the contingent effects of top management teams on v enture
TRANSCRIPT
The contingent effects of top management teams on ventureperformance: Aligning founding team composition withinnovation strategy and commercialization environment
The MIT Faculty has made this article openly available. Please share how this access benefits you. Your story matters.
Citation Eesley, Charles E., David H. Hsu, and Edward B. Roberts. “TheContingent Effects of Top Management Teams on VenturePerformance: Aligning Founding Team Composition with InnovationStrategy and Commercialization Environment.” StrategicManagement Journal (September 2013):
As Published http://dx.doi.org/10.1002/smj.2183
Publisher John Wiley & Sons, Inc
Version Author's final manuscript
Citable link http://hdl.handle.net/1721.1/88085
Terms of Use Creative Commons Attribution-Noncommercial-Share Alike
Detailed Terms http://creativecommons.org/licenses/by-nc-sa/4.0/
The Contingent Effects of Top Management Teams on Venture Performance: Aligning Founding Team Composition with Innovation Strategy and Commercialization Environment
Charles E. Eesley
Assistant Professor Stanford University
Department of Management Science & Engineering [email protected]
740-236-4653
David H. Hsu Richard A. Sapp Associate Professor of Management
Wharton School, University of Pennsylvania
Edward B. Roberts David Sarnoff Professor of Management of Technology
MIT Sloan School of Management
Abstract How does the relationship between founding team composition and venture performance depend on the venture’s strategy and business environment? Using data from a novel survey of 2,067 firms, we show that while diverse founding teams tend to exhibit higher performance, this is not universally true. We find that founding teams that are diverse are likely to achieve high performance in a competitive commercialization environment. On the other hand, technically-focused founding teams are aligned with a cooperative commercialization environment and when the enterprise pursues an innovation strategy. These results are robust to corrections for endogenous team formation concerns. The findings suggest that ventures cannot ignore founding team composition and expect to later professionalize their top management teams to align with their strategy and environment. Keywords: founding teams, entrepreneurship, venture performance. Acknowledgements We thank Kathy Eisenhardt and audience members at the Academy of Management for comments. Garrett Heath provided excellent research assistance. We gratefully acknowledge funding from the Ewing Marion Kauffman Foundation, the M.I.T. Entrepreneurship Center, and the Mack Center for Technological Innovation at Wharton. We also acknowledge funding for Garrett Heath from the Stanford Technology Ventures Program.
2
Introduction
Founding teams of new ventures are typically composed of individuals with demographic
characteristics much more alike than different as compared to a benchmark of randomly
assembled teams (Ruef, Aldrich, and Carter, 2003). However, we have little knowledge of
whether, or under what circumstances, founding team uniformity helps or hinders venture
performance. Restated, we do not know when founders ought to include more diversity on their
founding teams. Building on the upper echelon theory of organizations relating characteristics of
the top management team (TMT) to organizational performance (Hambrick and Mason, 1984),
existing studies of founding team composition generally suggest that diverse teams allow
ventures to access a broader array of skills while more uniform teams tend to speed execution
and implementation (Eisenhardt and Schoonhoven, 1990; Beckman, 2006). However, because
the benefits to one type of founding team composition are likely to be more important under
certain circumstances, we may suspect that one type of team composition is not unconditionally
better than another.
We examine the impact of founding team composition on firm performance under two
contingencies often important to new ventures: the business environment and strategy.1 While
the early contingency literature related organizational design decisions to features of the business
environment such as stability versus turbulence (Burns and Stalker, 1961), such organizational
design decisions did not include founding team composition. However, as founding teams are the
first TMT of the enterprise, team composition impacts both current skills and, as a result of
founder imprinting, has a variety of long-lived effects on organizational performance (Boeker,
1989; Baron, Burton, and Hannan, 1999; Beckman and Burton, 2007). We therefore believe that
1 We use the terms business environment and strategy to refer to general concepts in the literature. When we discuss our hypothesis development and empirical operationalization, we use the terms commercialization environment and innovation strategy.
3
the business environment is an important yet understudied contingency to the relationship
between founding team composition and performance. Similarly, strategy has long been thought
of as how the top management team intends to position itself and interact with the business
environment (Ronda-Pupo and Guerras-Martin, 2012). While the early literature discussed “fit”
between different corporate strategies and varying organizational designs and investments (Miles
and Snow, 1981; Maidique and Patch, 1982), only later did scholars examine how top
management characteristics might align with strategies in shaping organizational performance
(Thomas, Litschert, and Ramaswamy, 1991; McGee, Dowling, and Megginson, 1995). However,
the critical role of founding team composition and the associated founder imprinting effects are
not considered in this literature.
We examine features of firms’ business environment that extend beyond the dimension of
environmental stability versus turbulence and build on the early insight in the contingency
literature that technical requirements are an important feature of the business environment that
can impact organizational design (Woodward, 1965). In business environments in which new
ventures enjoy strong appropriability for their innovations, such as through intellectual property
protection, they will more readily engage in negotiations with partners for cooperative
commercialization (as striking deal terms must involve innovation disclosure). Furthermore,
should commercializing the innovation in a given industry also require assembling downstream
complementary assets, such as a specialized sales force that the potential partner might possess,
this reinforces the degree to which the environment favors a cooperative strategy (Teece, 1986;
Gans and Stern, 2003). In contrast, a competitive environment is characterized by weak
appropriability (so the entrepreneur is reluctant to bargain with and disclose innovation details to
potential partners) and relatively low cost of assembling the requisite complementary assets (thus

4
lowering the entrepreneur’s costs of product market entry). Using an upper echelon lens on
information and skills, we argue that the ideal founding team composition depends on whether
the enterprise operates in a cooperative or competitive environment.
A second contingency we examine in the link between founding team composition and
enterprise performance is the venture’s innovation strategy. When considering the competitive
strategies available to entrepreneurs, an important choice is whether or not to pursue an
innovator strategy (Lieberman and Montgomery, 1988; Eisenhardt and Schoonhoven, 1990;
Hellmann and Puri, 2000). Innovator strategies are marked by an opportunity-driven logic in
which a certain degree of risk (often technological) is accepted in order to attain growth. Since
firms have the choice of whether to pursue an innovator strategy, a natural question is whether
this choice also has implications for the ideal founding team composition, as the team
composition will impact the venture’s information and skills.
We therefore seek to address a missing perspective in the upper echelon literature as it
applies to new ventures: The notion of aligning founding team composition with the business
environment and strategy to enhance organizational performance. At a broad level, we believe
this gap in the literature is an important one because the performance of entrepreneurial firms is a
significant engine in driving economic growth and job creation (Haltiwanger, Jarmin, and
Miranda, 2010; Roberts and Eesley, 2011). Furthermore, the founder imprinting literature
suggests that the ability to add managerial expertise over the venture lifecycle may be limited
(Beckman 2006; Beckman and Burton, 2008), implying that the stakes to founder composition
decisions are magnified.
We use unique data on the founding management roles played at venture inception in
2,067 ventures started by alumni of the Massachusetts Institute of Technology (MIT) to shed

5
light on founding team composition alignment with the organization’s strategy and business
environment. We examine three sets of variables: founding team composition (the diversity and
technical focus of the founding team) and its alignment with two sets of contingent variables (1)
whether the industry commercialization environment is competitive or cooperative, and (2) the
firm’s degree of innovation strategy. We measure performance in a way consistent with the
literature, i.e., whether the enterprise and its equity-holders achieve liquidity via an “exit” event
such as an acquisition or IPO.
We find that founding teams that are diverse are likely to achieve high performance in a
competitive commercialization environment. On the other hand, technically-focused founding
teams are aligned with a cooperative commercialization environment and when the enterprise
pursues an innovation strategy. Our study therefore demonstrates the contingent relationship
between founding team composition and organizational performance depending on business
environment and strategy.
Theory and Hypotheses
In this section, we discuss our motivation for examining founding teams and review the
literature on teams and organizational performance. We then turn our attention to theorizing
about aligning founding team composition with two sets of factors that are likely to exhibit
important contingencies - innovation strategies and commercialization environments. As we
describe in greater detail below, these contingencies are likely to play particularly important and
previously unexamined roles in shaping the necessary founding team characteristics for success.
Founding team composition. Upper echelon theory argues that top management team
(TMT) characteristics shape organizational performance (Hambrick and Mason, 1984; Pfeffer,
6
1983; Beckman and Burton, 2008), where a TMT member is any manager who occupies an
executive-level position. While this literature has a long tradition regarding TMTs of established
firms, far fewer studies have examined the link between founding teams and performance.
Founding teams are often the first TMT of an organization, and so we might initially
expect the range of findings on TMTs to apply equally well to founding teams. We might more
specifically expect this to hold under a pure “lifecycle” view of entrepreneurial TMT succession,
in which founders are replaced with new managers possessing skills appropriate for the given life
stage of a venture (Greiner, 1972), with little or no organizational memory and adjustment costs
of organizational procedures and culture. The argument is that organizations encounter different
challenges at various stages in the “lifecycle” of the organization and therefore different top
managers with new skills should be brought in (Boeker and Karichalil, 2002; Quinn and
Cameron, 1983; Hellmann and Puri, 2002). Others have argued along similar lines that the
departure of founders and hiring of “new blood” is necessary with certain transitions in the life of
the entrepreneurial firm (Miller, 1993; Miller and Shamsie, 2001).
However, a long literature suggests that both environmental and founder imprinting can
have long-lived effects on organizational processes, structure, and outcomes, even long after a
founding team departs a venture (Stinchcombe, 1965; Eisenhardt and Schoonhoven, 1990;
Baron, et al., 1999; Beckman and Burton, 2008). The imprinting view relies on a path
dependency mechanism in which the early decisions about founding team composition shape
future behavior, organizational structure, and as a result, firm performance. These early choices
are not easily undone, and so it becomes consequential whether the early team is well-aligned
with strategic decisions and with the industry environment. Such path dependency can result
from many sources, including organizational routines that can guide behavior and that may
7
transcend particular individuals, to developed organizational reputations that can influence the
type and quality of individuals attracted to work at a given firm. The high-level consequence for
our purposes is that founding team composition and their decisions regarding business policy and
organizational structure can be consequential even decades after founding the firm (Boeker,
1989; Miles and Snow, 1978).
Within the founding team literature, a main set of findings is that more homogenous
founding teams may have advantages in faster decision-making and execution (Eisenhardt and
Schoonhoven, 1990; Brown and Eisenhardt, 1997), while diverse teams tend to have a broader
set of skills and draw on a wider variety of information and experiences (Beckman, 2006;
Beckman and Haunschild, 2002). Teams with a diversity of knowledge and skills who at the
same time are able to execute quickly and efficiently are in an even more privileged position
(Eisenhardt and Schoonhoven, 1990; Beckman, 2008). This team configuration might be
possible because teams could have diversity in their functional backgrounds, but have uniformity
by having a common employer, for example. Despite these findings on founding team
configuration, Ruef, et al. (2003) find that the composition of actual founding teams is much
more uniform than would be expected relative to random pairings of founders.
At a broad level, these findings on founding teams largely echo the results from a large
body of literature relating the demographic composition of TMTs to firm strategy and
performance (for comprehensive reviews, see Finkelstein and Hambrick, 1996; Williams and
O’Reilly, 1998). Many studies demonstrate a positive relationship between top management
functional diversity and firm outcomes (Lant and Mezias, 1992). Diversity is thought to improve
firm performance because it ensures that the TMT has a broader spectrum of experience and
capabilities (Keck, 1997; Randel and Jaussi, 2003).
8
A related yet distinct dimension of team composition is the degree to which founding
teams adopt a technical focus, with the associated human resource management implications
(Baron, et al., 1999). For instance, a team composed solely of engineers or scientists with chief
technology officer or vice president of engineering roles would be highly technically-focused.
We chose to examine technical focus rather than other dimensions (finance, operations, or
marketing) because the prior literature has suggested that many firms, particularly those that are
technology-based, begin with a technical founding team and then subsequently “professionalize”
by adding other functions to the top management team. Technically-focused teams are also the
most relevant to our focus on innovation strategy and commercialization environments.
Unlike the founding team literature, the upper echelons literature on large, established
firms has demonstrated certain contingencies shaping the optimal TMT composition. These
studies largely show that the more complex the environment or strategy, the more that diversity
among top executives is beneficial (Priem, 1990; Hambrick, Cho, and Chen, 1996; Carpenter,
2002). For instance, a firm’s corporate diversification posture (Michel and Hambrick, 1992) and
environmental turbulence (Haleblian and Finkelstein, 1993) skew the ideal TMT composition
towards diversity. Furthermore, functionally diverse teams are more likely to survive disruptions
in the environment (Keck and Tushman, 1993). Yet, within the literature on early TMTs, few
papers discuss team demography contingencies or the importance of fit between the founding
team and business strategy and the business environment.2
In summary, while scholars have noted that many founding teams are more focused and
homogenous than diverse, we have little knowledge of when such founding team composition
might be misaligned with innovation strategy or the business environment. We seek to begin
2 For example, Amason, et al. (2006) use a sample of 174 firms experiencing an IPO to argue that highly diverse TMTs have lower performance when the venture had more novel products and services.
9
gaining that understanding in this study by paying particular attention to the founding team,
especially in light of the early team imprinting across a range of organizational processes. By
doing so, we respond to Hambrick’s (2007) call to examine the role of the founding team in
greater depth. A recent meta-analysis on the relationship between TMT composition and firm
financial performance suggests a middling direct relationship, but calls for work on moderating
influences shaping the relationship between team composition and organizational performance
more generally (Certo, et al., 2006).
Innovator strategy. A firm’s strategy to be an innovator may impact the link between
founding team composition and venture performance. When considering the competitive
strategies available to entrepreneurs, an important choice is whether or not to pursue an
innovator strategy (Lieberman and Montgomery, 1988; Eisenhardt and Schoonhoven, 1990;
Hellmann and Puri, 2000). While it is not clear that an innovator strategy is always better than
other alternatives (Leiberman and Montgomery, 1998), the choice has implications for the skills
needed, which in turn directly relate to issues of founding team composition. A non-innovation
based firm tends to compete on dimensions other than technological innovation since it is not
developing new-to-the-world products. Innovators introduce new products and services and
primarily compete based on their technical edge. Since firms have the choice of whether to
pursue an innovator strategy, a natural question is whether this choice also has implications for
the ideal founding team composition.
As compared to firms pursuing an innovator strategy, which rely more on the single
dimension of technical excellence for success, ventures not pursuing an innovation strategy will
rely on a broader set of resources and skills for success. As a result, in most firms outside of that
select group pursuing an innovator strategy, having a more functionally diverse founding team

10
offers a performance advantage. Consistent with prior literature, most such firms will have to be
competent in a wide range of areas such as sales and marketing, product distribution, and cost
leadership. While Teece (1986) stresses that possessing such complementary organizational
assets and skills (distinct from the raw technical invention) is important for value capture in
general, these assets will be particularly important in settings in which the basis for value capture
is broader, such as in the majority of cases when firms do not pursue an innovator strategy.
Firms engaged in a less innovation-intensive strategy are therefore more vulnerable to
their weakest organizational link. This argument is reminiscent of Lazear’s (2004) image of
entrepreneurs as jack-of-all-trades. Because entrepreneurial team success hinges on possessing
sufficient skill in each of a variety of domains, teams with a balanced but lower set of
multifaceted skills are likely to outperform teams with leading edge skills in certain domains but
with low or missing competence in other domains.
Furthermore, under a less innovation-intensive strategy, firms may have to engage in a
more complex strategy such as orchestrating linkages among a broader set of organizational
activities (the span of which may be less diffuse for firms pursuing an innovation-oriented
strategy). Diverse founding teams may be more capable of building or accessing the requisite
complementary organizational assets, as well as the management skills necessary to manage the
complexity. In turn, engaging and managing the wider set of organizational resources can raise
the barriers to entry and imitation by others (Rivkin, 2000) and provide a basis for competitive
advantage. Indeed, the TMT literature has found that team diversity is more beneficial with
complexity (Hambrick et al., 1996; Priem, 1990).
It is also important to consider the source of complexity in a venture and whether it
comes from the technology or the business model aspects of the firm. In addition to Hambrick et

11
al.’s (1996) conceptualization of environmental complexity, complexity may also affect the
technical and/or business aspects of the venture. The specific source of complexity in the
venture’s strategy should be aligned with the team composition (technical focus or functional
diversity). In ventures that are using an innovator strategy, the complexity is likely to reside in
the technology aspect of the business. For instance, a cure for cancer is very complex technically
(requiring multiple scientists and engineers with various backgrounds), but the business model if
such a cure were discovered is relatively more straightforward. In contrast, in ventures pursuing
a non-innovator strategy, the technical aspects are likely to be less complex and the greater
source of complexity is then more likely to stem from the business model aspect of the firm,
requiring greater diversity in functional roles, such as marketing, sales, and distribution. Thus,
complexity of either type could result in diversity being beneficial to performance. However,
complexity in the technical aspects as a result of an innovator strategy can be better addressed
via technically-focused team members, and thus other more diverse functional roles will be
likely to contribute less in this case.
In sum, consistent with prior literature, we expect diverse founding teams will be
positively associated with venture performance. However, firms pursuing an innovator strategy
will be an exception and will not experience the same positive impact from a diverse founding
team. Outside of those firms pursuing an innovator strategy, multifaceted organizational skills,
resources and management are particularly important for value creation and capture, and diverse
founding teams are more likely to possess such attributes. We therefore predict that while diverse
teams have a positive performance effect, this will not be the case in all situations:
H1a: Diverse founding teams are positively associated with venture performance, but are less beneficial when pursuing an innovator strategy.

12
For firms pursuing an innovation strategy, on the other hand, a more technically-focused
founding team may improve venture performance.3 A technically-focused founding team is more
likely to achieve the technological milestones necessary to develop the invention (Boeker, 1989).
This can stem from a variety of mechanisms including enhanced managerial focus on technical
development, stronger links with the relevant labor market (which can facilitate identifying,
recruiting and retaining technical staff), and/or fewer frictions in executing a product
development plan due to improved communication between management and technical staff.
In turn, venture capitalists (VCs) are disproportionately attracted to funding new
enterprises pursuing an innovation strategy (Hellmann and Puri, 2000). VCs can help provide a
range of services such as business development, strategic advice, corporate governance and
professionalization services, all of which can help entrepreneurs speed their products to market
(e.g., Hellmann and Puri, 2000; Hsu, 2006). Such services may help partially overcome the
broader challenge faced by initially narrowly-focused founding teams in subsequently building
broader TMTs (Beckman and Burton, 2008).
Of course not all new ventures will attract or wish to accept venture capital funding, and
for these firms, pursuing an innovation strategy with technically-focused teams can attract
incumbent firm partners to perform complementary commercialization functions such as sales
and marketing activities. Being at the leading edge of innovation in a given category can offer a
compelling value proposition to would-be partners to the focal firm and lead to more
commercialization opportunities.
On the other hand, the predictions of the lifecycle perspective on organizations and top
management teams would be that founding teams that are initially technically-focused (or
3 We thank an anonymous reviewer for pointing out that our thesis that founding team technical expertise can be important for an innovation strategy is not the same as the argument that team diversity can be problematic, as those attributes are not mutually exclusive within a team, as prior studies show.
13
functionally diverse) can hire top managers as they encounter new life cycle stages and new
challenges. This view would suggest that the composition of the initial founding team has limited
explanatory power as the firm can later hire managers aligned with its strategy and environment.
Nonetheless, for a number of additional reasons that the lifecycle view does not consider,
technically-focused teams are also likely to have an advantage when innovating. Such teams
have better knowledge and expertise regarding what innovations have been tried previously and
either failed or succeeded, and so have a better technical roadmap for product development. They
are also likely to have more connections to the external technical community, which can be
helpful for providing information, building technical advisory boards and overcoming technical
challenges. Finally, technically-focused teams are also likely to share heuristics and mental
models allowing for faster decision-making, better coordination and a smoother working
relationship among cofounders. We therefore expect:
H1b Technically focused founding teams, when they pursue an innovation strategy, are positively associated with venture performance.
Commercialization environment. Strategy and organization theorists have long been
interested in the influence of the firm’s environment (Porter, 1991; Selznick, 1949; Starbuck,
1983; Stinchcombe, 1965). Prior work has shown that organizations are influenced by the
opportunities provided by environmental jolts and turbulence (Grant, 2003), the industry life
cycle’s effect on innovation (Abernathy and Utterback, 1978), and the isomorphic pressures of
the institutional environment (Meyer and Rowan, 1977; Scott, 2008). Organizational ecologists
have focused on the roles of density, legitimacy and resource munificence on firm survival
(Tushman and Anderson, 1986). Others have explored the strategic decision-making implications
of high velocity environments (Eisenhardt, 1989) and managing environmental uncertainty
(Pfeffer and Salancik, 1978). Finally, the stakeholder and social movement literature have
14
demonstrated the role of activists and social movement organizations (Eesley and Lenox, 2006;
Hiatt, Sine, and Tolbert, 2009). We focus on the line of work examining how certain technical
dimensions of the industry environment can shape organizational design (Woodward, 1965).
Prior literature indicates that for several reasons, including technical requirements in
some industries, firms typically undertake a strategic approach and partner with as opposed to
compete against industry incumbents (Lerner and Merges, 1998; Christensen and Bower, 1996;
Teece, 1986; Tripsas, 1997). This literature contains a theoretically-based way to classify
industry commercialization environments since it gives us a structured lens through which to
predict how new ventures will likely make strategic choices and what types of teams they may
need. For instance, in the biotechnology industry, ventures frequently develop a new technology
and then partner with incumbents (pharmaceutical firms) who handle the subsequent steps of
regulatory approval, marketing, sales and distribution. In contrast, in some industries such as
software it is more common for ventures to compete head-to-head in the product market with
incumbent firms. These commercialization environments, which we label competitive versus
cooperative with incumbents, tend to differ across industries (Gans, Hsu, and Stern, 2002). A key
insight from this literature is that certain dimensions of industry environments, such as the
importance of complementary assets and the effectiveness of intellectual property protection,
especially relate to the technical requirements of the industry (Woodward, 1965; Tripsas, 1997).
These shape the likelihood that a venture will pursue a competitive versus cooperative strategy
with industry incumbents for commercializing their products or services (Gans and Stern, 2003;
Lerner and Merges, 1998; Rothaermel, 2001).
In the cooperative environment, ventures tend to cooperate with incumbents and form
partnerships with established firms in the industry to bring their products and services to market.

15
Ventures in cooperative environments tend not to compete in the product market directly with
incumbents; instead they typically partner with industry incumbents. This type of cooperative
commercialization environment characterizes industries like biotechnology (that often partner
with incumbent pharmaceutical firms for regulatory approval, marketing and distribution) and
medical devices, telecommunications, or chemicals. In a competitive commercialization
environment (for instance, software, consumer products, or web services), ventures seek to
compete in the product market against incumbent firms rather than partner for commercialization
(e.g., Katila, Rosenberger, and Eisenhardt, 2008; Tripsas, 1997).
These differences in the technical requirements of the industry environment have direct
implications for the founding team composition. When in a competitive environment,
entrepreneurial ventures typically have to make investments in their own complementary assets,
such as marketing, sales, manufacturing and distribution to build the capabilities necessary to
compete in the market. More functionally diverse founding teams have the human capital, skills,
and diversity of experience to build the complementary assets necessary to commercialize a
good. It is more challenging for a technically-focused team of all engineers or scientists to build
the sales, marketing and distribution capabilities necessary for the firm to compete with industry
incumbents. Consequently, we predict:
H2a: When in a competitive commercialization environment, diverse founding teams are positively associated with venture performance.
In contrast, a cooperative commercialization environment tends to favor ventures which
partner with industry incumbents to bring their products and services to market. In these settings,
a firm can exclude others from using its technology either by secrecy or because patent
protection is more effective in these industries (Cohen, Nelson, and Walsh, 2000), thus
mitigating the expropriation threat inherent in contracting with a partner. In addition,
16
complementary assets owned by incumbents are important for commercialization and difficult
for a new venture to replicate (Rothaermel, 2001; Tripsas, 1997), further enhancing the
incentives for joint commercialization. As a result, a cooperative commercialization environment
(such as in the biotechnology industry) may be aligned with a different type of founding team
composition as compared with a competitive environment. In cooperative commercialization
environments, ventures compete with one another to partner with industry incumbents.
Cooperative environments are therefore marked by tight appropriability regimes and innovations
are necessary that sustain existing complementary assets owned by incumbents.
In cooperative environments, competition exists among entrepreneurial firms in
supplying innovations to larger firms, making a focus on technology and technical talent more
important. Furthermore, startup innovators have the option to license or sell their innovation to
the incumbent rather than bear the full cost of developing complementary assets. In the case of
the mobile telecommunications market, for example, where a strong startup cooperative
environment exists, new entrants did better when pursuing next generation technological
innovation (He, Lim, and Wong, 2006). When in a cooperative commercialization environment,
a venture that is partnering can rely on an incumbent firm’s capabilities in marketing, sales, and
customer support, allowing it to have a more focused set of skills on the founding team.
Technical milestones such as completion of design, proof-of-concept, prototype
completion and pilot production indicate a new firm’s development stage (Sahlman, 1990), and a
technically-focused team can more quickly progress through technical stages of development
(Katila, Rosenberger, Eisenhardt, 2008). Such development can help the startup innovator more
successfully gather financial resources (Hallen, 2008) and enable the firm to give up less equity
when raising financial capital (Gompers, 1995). Getting the pilot completed and beginning initial

17
sales can also help the firm gain more direct feedback from the market. If customer feedback
signals that a new set of features is needed, then such a team may more easily re-engineer the
product to new specifications. Furthermore, completing more of the technical development
enables a firm to be in a better negotiating position, allowing it to capture more value (Katila, et
al., 2008). As a result, we expect that a technically-focused founding team will be more
beneficial for firms in a cooperative commercialization environment:
H2b: When in a cooperative commercialization environment, technology-focused founding teams are positively associated with venture performance. Data and Measures
We test our hypotheses using a sample of 2,067 ventures founded between 1931 and
2003. We developed this sample from a novel survey administered in 2001 to all 105,928 alumni
from MIT to generate a sample of firms where we have detailed information on founders as well
as on firm performance. An alumni survey is particularly appropriate because it enables
gathering data from a well-defined population of comparable individuals in multiple industries
(Eesley, 2011). The alumni survey increases the response rate and trust in the survey for the
respondents. By surveying all alumni, we have polled all who could have founded a firm within
this population. Due to these advantages, the use of alumni surveys as a data collection
methodology has been growing, especially in the domain of entrepreneurship research (Burt,
2001; Dobrev and Barnett, 2005; Hsu, Roberts, and Eesley, 2007; Lazear, 2004; Lerner and
Malmendier, 2011).
The 2001 survey generated 43,668 responses from MIT alumni for a 41.2 percent
response rate. Out of 7,798 alumni who had indicated that they had founded a company, 2,111
founders completed more detailed surveys in 2003, representing a response rate of 25.6 percent.
Removing duplicates where more than one cofounder reported on the same firm brings us to a

18
total sample of 2,067 companies. We are able to compare data on demographic and educational
characteristics of the entire population of alumni with the survey respondents. Differences in
means tests of observed characteristics of the responders and non-responders of both the 2001
and 2003 surveys detect little difference between the groups.4
The data were matched with complementary data sources through 2006 via Compustat
(for public companies), the United States Patent and Trademark Office (USPTO), and Dun &
Bradstreet (for private companies). Industries covered in the sample include aerospace,
architecture, biomedical, chemicals, consumer products, consulting, electronics, energy, finance,
law, machine tools, publishing, software, telecommunications, other services, as well as other
manufacturing. A key feature of this dataset is its scope of coverage: all living MIT alumni who
graduated between 1930 to 2001 were surveyed.5
Dependent Variables
Following many studies in the literature, we measure entrepreneurial success through
observed IPO or acquisition liquidity events. We define a favorable exit as either an IPO or an
acquisition if that acquisition met either of two criteria: it made money for the investors (the
valuation was higher than the capital raised) or if the acquired firm was older than five years and
had positive (greater than zero) revenues. This measure eliminates acquisitions where the firm
was acquired at a low valuation, was not generating positive cash flow and would have otherwise
gone out of business. Arora and Nandkumar (2011) recently used similar screening criteria to
measure favorable exits. The acquisition and IPO events were self-reports in the MIT survey. We
confirmed their accuracy with the Compustat and the SDC Platinum databases. We also tested
4 In only a few instances do the differences between the sub-samples vary by three percentage points or more. For the 2001 survey, only the variables male, European citizen, and Middle Eastern citizen meet these criteria. 5 Respondents also reported on firms that later failed as well (41 percent of the firms failed), so the data include failed founding attempts.
19
the results for robustness by using alternative performance measure, exits, which equals 1 if the
firm experienced any type of acquisition or IPO and 0 if not (as of 2003). The youngest firms
would not have had sufficient time to have an IPO or acquisition so we restricted the analysis to
firms founded in 1998 and earlier, giving the firms at least five years of operating time.
Independent Variables
Team characteristics. We measure diverse teams by the different functional roles on the
founding team with the variable diverse team. The survey asked respondents for the role at
founding for himself or herself and for each cofounder. These roles were then coded according to
whether they fell under technology roles (CTO, Chief Scientist, etc.), finance, sales and
marketing, or other. The number of roles thus ranges from 1 to 4. A diverse team is coded as a
count of the number of functional roles on the founding team. Beckman and Burton (2008)
similarly use the count of the number of functional roles on the founding team. We test for, and
find, robustness to variants of this measure such as dichotomizing the variable split at the median
of the underlying functional role count. As a measure of how technology-focused the founding
team is, we created the variable technically focused team as a dichotomous variable equal to 1 if
the founding team was entirely composed of individuals who indicated that their role at founding
was focused on the development of the technology (as opposed to other roles including
marketing, sales, finance, management, etc.).
Innovation. We measure firms’ innovation strategy by creating a composite index of the
extent to which a firm innovates as the basis of its strategy. The variable innovator ranges from 0
to 3 depending on how innovative the firm is. A firm receives a three if it indicated that
innovation was critical for its success, if it held at least one patent at the time of the survey, and
if the idea for the venture came from a research lab (corporate or university). The firm receives a
20
2 if two of these conditions hold, a 1 if only one of them holds, and a 0 if none of them holds.
Compared with prior studies that use patent counts as a measure of innovation, this measure has
the advantage of applying to both younger and older firms (younger firms often have fewer
resources to file for patents). The measure also has the advantage of being able to be used across
industries, including those industries where patenting may not be used as frequently since it is
less effective (Cohen, Nelson, and Walsh, 2000). As a robustness check, we examine the results
using the components of the innovator index and by using the average patent “originality” score
for a firm’s patents. The originality measure, a common one in the innovation literature, is a
concentration index of the diversity of patent classes that a focal patent cites, with a patent citing
a more diverse set of patent classes said to be more original (Hall, Jaffe, and Trajtenberg, 2001).
Commercialization environment. We follow Gans and Stern (2003) in contrasting two
startup commercialization environments, which depend on the extent to which existing
complementary assets are made obsolete by innovation and the appropriability regime
surrounding innovation. Teece (1986) defines complementary assets as the assets or capabilities
of firms that assist in the commercialization of innovations.6 These assets can be resources that
firms own, such as brand reputation, distribution channels, or customer relationships. They can
also be organizational competencies, such as manufacturing capabilities, sales and service
expertise, or the ability to capture customer knowledge. When intellectual property rights (IPR)
are strong, innovation is more valuable due to the reduction of potential opportunism or
expropriation (Anton and Yao, 1995; Arora, Fosfuri, and Gambardella, 2001; Gans et al., 2002).
Startups have less fear of disclosing their IP when forming an alliance or partnership in this case
(Katila, et al., 2008). Formal intellectual property rights are one of several channels innovators
6 Rosenbloom and Christensen (1994) describe a similar idea using the term “value network” to describe the system of producers and markets serving “the ultimate user of the products or services to which a given innovation contributes.”
21
can use to capture the value of their innovations. IPR may be particularly important in some
industries in reducing the risks of expropriation (since patent protection varies by industry
(Cohen et al., 2000)), thereby easing innovator contracting and knowledge disclosure.
We define an environment where competitive commercialization is more frequently used
as one in which the patent channel of appropriability is relatively weak while at the same time,
incumbents’ extant complementary assets for commercialization are largely disrupted (startup
innovators fear bargaining with industry incumbents for fear of expropriation at the same time as
the cost of entry is relatively low). A cooperative commercialization environment is defined in
the opposite way, where patent protection is effective and the importance of incumbents’ existing
complementary assets is sustained (and so startup innovators feel more comfortable bargaining
with incumbents, who have a comparative advantage in assembled complementary assets).
We measure the importance of complementary assets and the effectiveness of patent
protection in a firm’s industry by matching the industry sectors with the Carnegie Mellon
industry R&D survey (Cohen, et al., 2000). We create the measure of industry complementary
asset importance by averaging the importance of complementary manufacturing and sales or
services (then we took the natural log to account for the skewed distribution). Sectors scoring
high on this measure included electronics, telecommunication, machinery, chemicals and
materials, biotechnology, medical devices and consumer products (scoring low were software,
finance, and services).7 Similarly, we created an average of the importance of patents for
protecting products and processes (and took the natural log to adjust for the skewed distribution)
7 Not all MIT alumni firms fit into the industries in the CMU data (restaurants, dry cleaners, etc. are fairly rare). However, there are a number of services firms, such as consulting, law, accounting, and so on. These were grouped into an “other services” category. The results are robust to excluding these firms. Patents are very unlikely to be effective in the case of services firms; similarly, specialized complementary assets are likely unimportant. Thus, both of these measures are likely to be low. We therefore used the lowest values from the CMU survey for this category, which places them on similar footing as the printing and publishing industries, for example.
22
to create the measure of patent strength. Sectors high in patent strength included energy, electric
utilities, aerospace, chemicals, materials, machinery, biotechnology and medical devices (scoring
low were finance, software, and services). We use the median values of these measures as the
cutoff point. We use the median of the ratings on the importance of complementary assets in the
sector, complementary assets, and the effectiveness of patent protection, IPR strength, to split the
sample into firms that are in an environment where complementary assets are important and
patent protection is strong (499 firms) and an environment where complementary assets are less
important and patent protection is weak (885 firms).8
Control variables. Another aspect of the environment that is likely to shape the
characteristics of the founding team is the economic cycle, in particular whether the firm was
founded in a recession. General economic conditions at the time of founding were classified into
expansion or contraction (recession) via the widely used National Bureau of Economic Research
(NBER) Business Cycle Dating Committee’s classifications (Stock and Watson, 2010). The
variable recession year is equal to 1 if the firm was founded during a recession. We include this
variable to proxy for founding conditions, as the prior literature suggests that founding in growth
markets or high demand increases performance (Carroll and Delacroix, 1982; Romanelli, 1989;
Eisenhardt and Schoonhoven, 1990).
The prior literature also shows that firm performance is partly related to industry factors,
so we use a set of industry dummies as controls for the industry segment (such as biotech,
software, and electronics). Survey respondents chose the industry category that best fit their firm.
Since prior work finds that entrepreneurial performance is related to the founder’s
education level (Roberts, 1991), we control for the education level with master’s degree and
8 Grouping industries based on their complementary assets and patent protection dimensions is a method grounded in the prior literature, and allows future researchers to classify new industries based on these characteristics.
23
doctorate degree controls. While having a founder with a doctorate degree might be an
indication of a technology-focused team, not all doctorates in the sample are in technical fields,
so we prefer the founding role measure and leave educational degrees as a control. Since more
general experience may increase entrepreneurial performance, we control for founder age (Evans
and Leighton, 1989). The variable founder age is the entrepreneur’s age when the firm was
founded. A number of studies show that the founder’s prior industry experience increases firm
performance (Klepper and Simons, 2000; Klepper, 2002; Ingram and Baum, 1997). Older, more
experienced TMT members are found to aid firm performance. For example, CEOs in the
microcomputer industry with an older experienced counselor make faster decisions, improving
performance (Eisenhardt, 1989). We also measure experience in founding a firm with the
variable experienced entrepreneur as a binary variable indicating whether the founder has prior
entrepreneurial experience. Prior work has shown experienced entrepreneurial founders
outperform their less experienced counterparts (Delmar and Shane, 2006).
Finally, we control for other team and firm-level effects that may influence firm
performance. Since larger founding teams have been shown to outperform, we control for
founding team size (in addition to the respondent) since having multiple members of a team leads
to higher performance (Eisenhardt and Schoonhoven, 1990; Roberts, 1991). We control for solo
founder, which is equal to 1 if there was only one founder. Older firms tend to be larger and have
higher revenues, so we control for the age of the startup, as measured by firm age. Since raising
funding from external investors has been shown to be associated with higher firm performance
and also may be easier for an experienced entrepreneur, we seek to control for these effects
(Hellmann and Puri, 2002; Hsu, 2007). External funding is equal to 1 if the individual raised
funds from venture capital firms or angel investors. It is possible that some ventures had more
24
technical development prior to the founding of the company than others, allowing some to be
ready for commercial sales, while others needed more technical development first. We therefore
use a question from the survey about whether the founder had funding to develop a prototype
prior to founding the company as another control variable (prototype funded).
Analysis and Results
-------------------------------------------------------- Insert Table 1 about here
-------------------------------------------------------- Table 1 provides descriptive statistics and a pair-wise correlation table.9 Table 2 reports
the results of the logit regressions predicting favorable exits. Table 2, model 2-1 shows results
for the controls and model 2-2 shows just the main effects where diverse team is positive and
significant (p<0.05) and tech. focused team is also positive and significant (p<0.10). Models 2-3
and 2-4 test the effects of the interaction between team composition and the innovator strategy.
Hypothesis 1a was that diverse founding teams are positively associated with venture
performance, but are less beneficial when pursuing an innovator strategy. Model 2-3 provides
evidence supporting H1a. We find a positive (above 1) odds ratio on diverse team, indicating that
these teams in general have a positive effect, and we find a negative (below 1) odds ratio on the
interaction term between innovator and diverse team, indicating that diverse teams are
significantly less beneficial when innovating. We find a positive odds ratio in model 2-4 when
interacting innovator and technically focused team, supporting hypothesis 1b that when using an
innovation strategy, technically-focused teams are positively associated with performance. 9 A majority (64 percent) of the firms have no founder in a technical role. Of the firms with no technical cofounders, 67 percent of them are solo founders. Of these, most are in service industries (law, consulting, management). We examined the types of degrees earned by those who indicated that they did not have a technical role on the founding team and found 61.5 percent had engineering degrees, 15.5 percent had science degrees, 13.9 percent had management degrees, 4.8 percent had humanities and social sciences degrees and 4.3 percent had architecture degrees. Some of these individuals had been inventors and worked in technical roles in the past, but may have moved into management roles (29 percent indicated that in their prior work experience, they had created patented inventions).
25
Hypothesis 2a predicted that, when in a competitive commercialization environment,
diverse founding teams would be positively associated with venture performance. In Table 3,
models 3-1 and 3-2 report results for only the controls in the competitive and cooperative
strategy settings, respectively. We find support for the hypothesis in the significant, positive odds
ratio on diverse team in the competitive strategy environment (model 3-3). The odds ratio is
significantly (p<0.05) larger than in the cooperative strategy setting. Hypothesis 2b predicted that
technically-focused teams would be positively associated with venture performance when in a
cooperative commercialization environment. This hypothesis was supported, as the odds ratio on
technically focused team is positive and significantly larger (p<0.05) than the same odds ratio in
the cooperative environment setting (model 3-6).10
In the logit regression tables, we present odds ratios, which give a sense of the size of the
effects. However, while odds ratios are good at showing differences in the effects across groups,
they do not adequately take into account the baseline main effects. Marginal effects take into
account the baseline risk of a favorable exit and more accurately reflect the impact of a change in
team composition. Based on model 2-2 (Table 2), at the mean level of the other independent
variables, we find the following marginal effects: for one additional functional role on the
founding team, the main effect is an 8.9 percent higher likelihood of a favorable exit. Based on
the specification in model 2-4, when employing an innovation strategy, a technically focused
team results in a 3.7 percent greater likelihood of a favorable exit (this estimate is the total effect,
including the main and interaction effects). Hall and Woodward (2010) show that the mean
return on a VC exit to the investors is $5M ($9M for the entrepreneurs), so this estimate would
represent an increase in expected value of $185,000 for the VCs ($333,000 for the
10 Substituting an analysis with interaction terms instead of a split sample yields similar results. We present split sample analyses, as this allows the coefficients on the control variables to vary.
26
entrepreneurs). These results have significant real world effects and a magnitude that would
likely justify the costs of a headhunting firm or other efforts to recruit the right cofounder. With
interaction effects in non-linear models, graphing the interaction effect is necessary because the
marginal effect is not equal to just changing the interaction term and depends on the levels of
other variables (Norton, Ai and Wang, 2004). When we graph the interaction effect, we find an
inverse U-shaped relationship (for the innovation and technically focused founding team
interaction) with the strongest positive effect at seven percent greater likelihood for those at a
moderate likelihood of a favorable exit. An additional function on the founding team when
adopting an innovation strategy reduces the likelihood of a favorable exit by 8.4 percent (based
on the specification in model (2-3)). This effectively cancels out the positive, beneficial effect of
an additional function on the founding team in general. Graphing the interaction effect, we see
that there is a U-shaped relationship, where the effect ranges from 2-4 percent lower likelihood at
very low or very high probabilities of a favorable exit to 12 percent lower likelihood for those at
a moderate likelihood of favorable exit. Finally, based on Table 3, model 3-6, in the cooperative
environment a technically-focused founding team has a 12.8 percent greater likelihood of a
favorable exit. In the competitive environment, based on model 3-3, an additional function on the
founding team results in a 7.9% increase in the likelihood of a favorable exit.
-------------------------------------------------------- Insert Tables 2 and 3 about here
-------------------------------------------------------- Additional Analysis, Robustness and Limitations
We ran additional analyses with variants of the dependent variable, independent
variables, industry environment, and other periods of time to investigate the robustness of the
27
results.11 The results are robust to using exit as a measure indicating whether the firm
experienced any acquisition or IPO event instead of favorable exit. We also tested for and found
that the results are not sensitive to alternative measures of our key independent variables. We
narrowed the sample to those firms with patents so that we can test the impact of patent-based
measures of the degree of innovation (patent originality) and found the results robust. The results
(available from the authors) are also not sensitive to using patents and the percentage of revenues
spent on R&D as alternative innovation measures. We find the results robust to using a binary
variant of the variable diverse team equal to 1 if the team has greater than the median number of
structural roles on the founding team as an alternative to the continuous diverse team variable.
Furthermore, defining the industry environments in alternative ways does not alter the
results. While we decided to use the median values of complementary assets and patent
protection, the results were robust to changing the exact division points across these
environments and to simply defining them based on industries.12 We also found that our results
hold across a broad range of different time periods (either restricting the data to more recently
founded firms or to just firms founded before a certain year to test whether right censoring was
driving our results).
We next assessed whether our results are driven by the possible co-determination of
founding team composition and business environment and strategy. Prior literature suggests that
many studies in the management and organizations literature have concluded that team formation
considerations precede strategy formulation. In this spirit, Beckman (2006) writes (p. 742):
11 In response to a reviewer request about how the combination of innovation strategy, commercialization environment and team composition align, we ran three-way interactions. The prediction was that an innovation strategy in the cooperative environment with a technically-focused founding team would be best. The three way interactions suggest higher performance by technically-focused, innovation strategy firms in the cooperative environment and by diverse, innovation strategy teams in the competitive environment. 12 Biotechnology, machine tools, chemicals and telecommunications make up the majority of cooperative environment firms and electronics and software firms make up the majority of the competitive environment firms.
28
“Indeed, prior work on new ventures has shown that founders and founding teams shape a firm’s
initial strategies, structures, actions, and performance (e.g., Beckman, 2006; Boeker, 1988;
Burton, Sorenson, and Beckman, 2002; Eisenhardt and Schoonhoven, 1990; Gompers, Lerner,
and Scharfstein, 2005; Roure and Maidique, 1986).” Ruef and colleagues (2003: p. 754) interpret
their findings as indicating, “founding teams are generally formed for reasons of social
convenience, and not strategy.”
Nonetheless, since team formation may be an endogenous process alongside the choice of
innovation strategy and commercialization environment (particularly for more savvy
entrepreneurs), we use subsample analyses and an instrumental variables approach as robustness
checks. We use two different sub-samples in Table 4, panels B and C (young founders and
“naïve” teams) where the teams would plausibly be formed less for strategic reasons and are
more likely formed based on social convenience. We use a subsample of first-time founders who
are young (under the age of 28). For naïve teams, we use teams where the founders indicated
they met via family, socially, in school, or in the research lab. In Table 4, panel A, we use an
instrumental variables (IV) approach with an IV probit estimation procedure, as a Hausman test
shows that the founding team variables may potentially be endogenous. Using these three
analyses, we find results consistent with our main results.
To conduct our IV analysis, we ran the first-stage as a probit regression on the potentially
endogenous variables, technically focused and diverse team. We constructed the instrument idea
from research (for technically focused teams) and team from work (used for diverse teams)
where these variables indicate the primary source of the idea and founding team. These
instruments are used separately in the regressions and are significantly correlated with the
founding team composition, but should not be correlated with the error term through omitted
29
variables. The instruments satisfy the exclusion restriction because the source of the idea or team
(research or work) should not have a direct impact on the likelihood of a favorable exit (venture
execution rather than strict venture genesis is more likely to determine ultimate enterprise
outcomes). We then assessed the instrument’s relevance. Using an F-test where the first stage
model is compared to a model without the instrument, we find that the F-statistic is greater than
the recommended values, suggesting that the instruments are not weak.13 The results in Table 4
are consistent with our main Tables 2 and 3, providing greater confidence in our findings. In
Table 4, Panel A, in our IV estimates, it is worth noting that tech. focused team becomes
significant in the competitive environment as well as the cooperative environment. This does not
occur in Panels B and C.
-------------------------------------------------------- Insert Table 4 about here
-------------------------------------------------------- Discussion and Conclusion
Our main findings are that technically-focused teams are aligned with a cooperative
commercialization environment and when using an innovation strategy, while diverse teams are
higher performing in a competitive commercialization environment. These results have
implications for the related literatures on entrepreneurship, top management teams, and strategy.
Prior work has examined factors such as the career history of founders and top
management team, strategy and market growth (Eisenhardt and Schoonhoven, 1990). This
literature has generally argued that a functionally diverse founding team is optimal (Beckman, et
13 We also assess the instruments’ exogeneity using the over-identification J-test. Including all of the team sources from the survey, including team from social, team from school, and team met via family, the test fails to reject the null that the instrument is valid. This test assesses whether the bundle of instruments is exogenous assuming that a least one of the instruments is exogenous. These additional instruments are not used in the IV regression since they are weak instruments, however they allow us to perform the J-test for over-identification to test the exclusion restriction.
30
al., 2007).14 In addition, the prior literature shows that the general complexity surrounding the
organization is an important factor in top management team composition (Priem, 1990). We
provide theory and evidence that in some cases, a diverse team is less beneficial and a more
technically-focused founding team does better. In these cases, when using an innovator strategy
or in a cooperative industry environment, the complexity regarding technical issues is high while
business model complexity is relatively lower. Our results show that the source of the
complexity has implications for the type of top management team associated with higher
performance. As a result, our work responds to Hambrick’s (2007) call to examine the role of the
founding team as well as calls for work on moderating influences (Certo et al., 2006) by showing
that the characteristics of highly performing founding teams may be contingent on their
alignment with two factors – innovation strategy and industry commercialization environment.
We also contribute to the debate between lifecycle and imprinting models of founding
teams. Lifecycle models have argued that ventures can add the appropriate skills and top
managers as they are needed over time (Greiner, 1972; Audia and Rider, 2005). Those models
assert that a venture becomes “professionalized” over time and so a fit between the founding
team and the eventual innovation strategy is unnecessary as the right skills can be added at a later
stage (Hellmann and Puri, 2000; Keck, 1997; Randel and Jaussi, 2003). In contrast, imprinting
models argue that the founding team composition has lasting influences on the firm (Beckman
and Burton, 2008; Burton and Beckman, 2007). We contribute to this literature by showing that
14 We do not regard our results as at odds with the results of Beckman (2006), which finds that diverse teams are more likely to undertake exploratory innovation. That study examines diverse teams in terms of prior employer affiliations, whereas we examine diverse teams by functional roles. The Beckman study examines the extent to which firms pursue an exploratory versus exploitative innovation strategy rather than their success in innovating or the firm’s likelihood of an exit. Beckman (2006) does examine firm growth as an outcome measure, but finds that exploratory innovation has a negative and insignificant effect on firm growth. While a diverse team (in terms of prior employer affiliations) may be more likely to pursue an exploratory innovation strategy, our results show that they will be more likely to have a favorable exit if they operate in a competitive environment and that they will have lower performance if they attempt to adopt an innovation strategy in a cooperative environment.

31
the initial founding team must be aligned with the strategy and environment to produce long-
term organizational performance, which may limit the effectiveness of sequential TMT
professionalization over the venture life cycle.
Finally, while the firm’s business environment continues to interest strategy and
organization theorists (Porter, 1991; Selznick, 1949; Starbuck, 1983; Stinchcombe, 1965), little
or no prior work has related firms’ commercialization environments to their founding team
composition. While the prior literature studies new ventures’ entry strategies and finds that such
strategies are contingent on the business environment (Teece, 1986; Gans, et al., 2002), we
suggest that the commercialization environment is an important contingency in the relationship
between founding team composition (and the associated information and skills of the startup)
and organizational performance. Consequently, our findings contribute to the literature by
showing how technical aspects of the industry commercialization environment influence
founding team composition.
Limitations and future research. One limitation of our research is that we cannot
observe the precise ordering of who joined the founding team in relation to the timing of strategy
and entry decisions. However, in keeping with the commercialization environment literature, we
have conceptualized our analysis statically. A question for future research is: under what
circumstances would a more dynamic conceptualization of changes in strategy or environment
result in different implications for team composition? Another limitation is that we have not
explicitly examined the costs of searching for teammates. Finally, another area for future
research is in conceptualizing the skills and information available beyond the founding team to
the broader set of resource providers (i.e., investors, early employees and advisors). An open
question is whether these resource providers bring some of the same benefits to the venture.

32
While these and other future research directions would be interesting, our results here aid
existing efforts to better understand when certain organizational structures, including founding
team composition, might be aligned with firms’ strategy and business environment. Our work is
among the first to suggest that entrepreneurs may need to take into account likely future strategic
commercialization choices and environments when forming their founding team.
References
Abernathy W, Utterback J. 1978. Patterns of Industrial Innovation. Technology Review. 80: 40-47.
Aggarwal V, Hsu D. 2009. Modes of cooperative R&D commercialization by start-ups. Strategic Management Journal 30: 835-864
Amason AC, Shrader, RC, Tompson GH. 2006. Newness and novelty: Relating top management team characteristics to new venture performance. Journal of Business Venturing 21(1): 125-148.
Anton JJ, Yao DA. 1995. Start-ups, spin-offs, and internal projects. Journal of Law, Economics and Organization 11(2): 362-378.
Arora A, Nandkumar A. 2011. Cash-out or flame-out! Opportunity cost and entrepreneurial strategy: Theory, and evidence from the information security industry. Management Science 57(10): 1844-1860.
Arora A, Fosfuri A, Gambardella A. 2001. Markets for Technology: The Economics of Innovation and Corporate Strategy. MIT Press, Cambridge, MA.
Audia PG, Rider, CI. 2005. A garage and an idea: What more does an entrepreneur need? California Management Review 48: 6-28.
Baron J, Burton M, Hannan M. 1999. Engineering bureaucracy: The genesis of formal policies, positions, and structures in high-technology firms. Journal of Law Economics and Organization 15(1): 1-41.
Beckman, C. 2006. The influence of founding team prior company affiliations on firm behavior. Academy of Management Journal 49: 741-758.
Beckman C, Burton MD, O’Reilly C. 2007. Early teams: The impact of entrepreneurial team demography on VC financing and going public. Journal of Business Venturing 22:147-173.
Beckman CM. Burton MD. 2008. Founding the future: Path dependence in the evolution of top management teams from founding to IPO. Organization Science 19(1): 3-24.
Beckman CM, Haunschild PR. 2002. Network learning: The effects of partners’ heterogeneity of experience on corporate acquisitions. Administrative Science Quarterly 47: 92-124.
Boeker W. 1989. Strategic change: The effects of founding and history. Academy of Management Journal 32: 489-515.
Boeker W. 1997. Executive migration and strategic change: The effect of top manager movement on product-market entry. Administrative Science Quarterly 42: 213-236.

33
Boeker W, Karichalil R. 2002. Entrepreneurial Transitions: Factors Influencing Founder Departure. Academy of Management Journal 45(4): 818-826.
Brown SL, Eisenhardt KM. 1997. The art of continuous change: Linking complexity theory and time-paced evolution in relentlessly shifting organizations. Administrative Science Quarterly 42: 1–34.
Burns T, Stalker GM. 1961. The Management of Innovation. London: Tavistock. Burt, RS. 2001. Attachment, decay, and social network. Journal of Organizational Behavior
22(6): 619-643. Burton MD, Sørensen JB, Beckman C. 2002 Coming from good stock: Career histories and new
venture formation. Research in the Sociology of Organizations 19: 229-262. Burton MD, Beckman CM. 2007. Leaving a legacy: Position imprints and successor turnover in
young firms. American Sociological Review 72(2): 239. Carpenter, MA. 2002. The implications of strategy and social context for the relationship
between top management team heterogeneity and firm performance. Strategic Management Journal 23(3): 275-284.
Carroll GR, Delacroix J. 1982. Organizational mortality in the newspaper industries of Argentina and Ireland: An ecological approach. Administrative Science Quarterly 27(2): 169-198.
Certo ST, Lester RH, Dalton CM, Dalton DR. 2006. Top management teams, strategy and financial performance: A meta-analytic examination. Journal of Management Studies 43(4): 813-839.
Cohen W, Nelson R, Walsh J. 2000. Protecting their intellectual assets: Appropriability conditions and why U.S. manufacturing firms patent (or not). NBER Working Paper W7552.
Delmar F, Shane S. 2006. Does experience matter? The effect of founding team experience on the survival and sales of newly founded ventures. Strategic Organization 4(3): 215-247.
Dobrev SD, Barnett WP. 2005. Organizational roles and transition to entrepreneurship. Academy of Management Journal 48(3): 433-449.
Eesley C. 2011. Alumni surveys as a data collection methodology. Working paper. Available at: http://www.stanford.edu/~cee/Papers/Eesley_Alumni_surveys.pdf
Eesley C, Roberts EB. 2012. Are you experienced or are you talented?: When does innate talent versus experience explain entrepreneurial performance?. Strategic Entrepreneurship Journal 6(3): 207-219.
Eisenhardt, K. 1989. Making fast strategic decisions in high-velocity environments. Academy of Management Journal 82(5): 929-964.
Eisenhardt KM, Schoonhoven, CB. 1990. Organizational growth: Linking founding team, strategy, environment, and growth among U.S. semiconductor ventures, 1978-1988. Administrative Science Quarterly 35(3): 504-529.
Evans DS, Leighton LS. 1989. Some empirical aspects of entrepreneurship. The American Economic Review 79(3): 519-535.
Finkelstein S, Hambrick D. 1996. Strategic leadership: Top executives and their effects on organizations. Minneapolis/St. Paul: West Pub. Co.
Finkelstein S, Hambrick DC: 1990. Top-management-team tenure and organizational outcomes: The moderating role of managerial discretion. Administrative Science Quarterly 35:484-503.

34
Fuller AW, Thursby MC. 2008. Chapter 8 Technology commercialization: Cooperative versus competitive strategies, in Gary D. Libecap, Marie C. Thursby (ed.) Technological Innovation: Generating Economic Results (Advances in the Study of Entrepreneurship, Innovation & Economic Growth, Volume 18), Emerald Group Publishing Limited; 227-250
Gans JS, Hsu DH, Stern S. 2002. When does start-up innovation spur the gale of creative destruction? The Rand Journal of Economics 33(4): 571-586.
Gans JS, Stern S. 2003. The product market and the market for "ideas": Commercialization strategies for technology entrepreneurs. Research Policy 32(2): 333-350.
Gans JS, Hsu DH, Stern S. 2008. The impact of uncertain intellectual property rights on the market for ideas: Evidence from patent grant delays. Management Science 54(5): 982-997.
Gompers PA. 1995. Optimal investment, monitoring, and the staging of venture capital. Journal of Finance 50:1461-1490.
Gompers P, Lerner J, Scharfstein D. 2005. Entrepreneurial spawning: public corporations and the genesis of new ventures, 1986 to 1999. Journal of Finance 60(2): 517–614.
Grant RM. 2003. Strategic Planning in a Turbulent Environment: Evidence from the Oil Majors. Strategic Management Journal 24: 491-517.
Greiner LE. 1972. Evolution and revolution as organizations grow. Harvard Business Review 50(4):37-46.
Hall BH, Jaffe AB, Trajtenberg M. 2001. The NBER patent citation data file: Lessons, insights and methodological tools. NBER Working Paper Series w8498 Available at SSRN: http://ssrn.com/abstract=285618.
Haleblian J, Finkelstein S. 1993. Top management team size, CEO dominance, and firm performance: The moderating roles of environmental turbulence and discretion. Academy of Management Journal 36(4): 844-863.
Hall RE, Woodward SE. 2010. The Burden of the Nondiversifiable Risk of Entrepreneurship. American Economic Review, 100(3): 1163–94.
Hallen, B. 2008. The causes and consequences of the initial network positions of new organizations: From whom do entrepreneurs receive investments? Administrative Science Quarterly 53 685-718.
Haltiwanger J, Jarmin R, Miranda J. 2010. Who creates jobs? Small vs. large vs. young. NBER Working Paper No. 16300.
Hambrick DC, Mason, PA. 1984. Upper echelons: The organization as a reflection of its top managers. Academy of Management Review 9(2): 193-206.
Hambrick DC. 2007. Upper echelons theory: An update. Academy of Management Review 32(2): 334-343.
Hambrick DC, Cho TS, Chen, MJ. 1996. The influence of top management team heterogeneity on firms' competitive moves. Administrative Science Quarterly 41(4): 659-84.
He Z, Lim K, Wong P. 2006. Entry and competitive dynamics in the mobile telecommunications market. Research Policy 35(8): 1147-1165.
Hellmann T, Puri M. 2002. Venture capital and the professionalization of start-up firms: empirical evidence. The Journal of Finance 57(1): 169-197.
Hellmann T, Puri M. 2000. The Interaction between Product Market and Financing Strategy: The Role of Venture Capital. Review of Financial Studies 13(4): 959-984.

35
Hiatt SR, Sine WD, Tolbert PS. 2009. From Pabst to Pepsi: The deinstitutionalization of social practices and the creation of entrepreneurial opportunities. Administrative Science Quarterly, 54(4): 635-667.
Hsu DH. 2004. What do entrepreneurs pay for venture capital affiliation? Journal of Finance 59: 1805-1844.
Hsu DH. 2006. Venture capitalists and cooperative start-up commercialization strategy, Management Science 52: 204-219.
Hsu DH. 2007. Experienced entrepreneurial founders, organizational capital, and venture capital funding. Research Policy 36: 722-741.
Hsu DH, Roberts EB, Eesley CE. 2007. Entrepreneurs from technology-based universities: Evidence from MIT. Research Policy 36: 768-788.
Ingram P, Baum J. 1997. Opportunity and constraint: organizations' learning from the operating and competitive experience of industries. Strategic Management Journal 18(S1): 75-98.
Katila R, Chen E. 2009. Effects of search timing on product innovation: The value of not being in sync. Administrative Science Quarterly 53: 593-625.
Katila R, Rosenberger J, Eisenhardt KM. 2008. Swimming with sharks: Technology ventures, defense mechanisms, and corporate relationships. Administrative Science Quarterly 53 295-332.
Keck SL. 1997. Top management team structure: Differential effects by environmental context. Organization Science 8(2): 143-156.
Keck SL, Tushman ML. 1993. Environmental and organizational context and executive team structure. Academy of Management Journal 36(6): 1314-1344.
Klepper S. 2002. The capabilities of new firms and the evolution of the U.S. automobile industry. Industrial and Corporate Change 11(4): 645-666.
Klepper S, Simons KL. 2000. Dominance by birthright: entry of prior radio producers and competitive ramifications in the U.S. television receiver industry. Strategic Management Journal 21(10/11): 997-1016.
Lant TK, Mezias SJ. 1992. An organizational learning model of convergence and reorientation. Organization Science 3(1): 47-71.
Lazear E. 2004. Balanced skills and entrepreneurship. American Economic Review 94(2): 208-11.
Lerner J, Malmendier U. 2011. With a little help from my (random) friends: Success and failure in post-business school entrepreneurship. NBER Working Papers 16918, National Bureau of Economic Research, Inc.
Lerner J, Merges RP. 1998. The control of technology alliances: An empirical analysis of the biotechnology industry, Journal of Industrial Economics 46(2): 125-156.
Lieberman MB, Montgomery DB. 1988. First-mover advantages. Strategic Management Journal 9(5): 41.
Lieberman, MB, Montgomery DB. 1998. First-Mover (Dis)Advantages: Retrospective and Link with the Resource-Based View. Strategic Management Journal, 19: 1111–1125.
Maidique MA, Patch P. 1982. Corporate strategy and technological policy. In ML Tushman and W. L. Moore (Ed.), Readings in the Management of Innovation. Marshfield, MA: Pitman.
McGee JE, Dowling MJ, Megginson WL. 1995. Cooperative strategy and new venture performance: The role of business strategy and management experience. Strategic Management Journal 16(7): 565-580.
36
Meyer J, Rowan. 1977. Institutionalized Organizations: Formal Structure as Myth and Ceremony. American Journal of Sociology, 83: 340-363.
Michel JG, Hambrick DC. 1992. Diversification posture and top management team characteristics. Academy of Management Journal 35(1): 9-37.
Miles RE, Snow CC. 1978. Organizational strategy, structure, and process. McGraw-Hill: NY. Miller D. 1993. Some organizational consequences of CEO succession. Academy of
Management Journal 36: 644-659. Miller D, Shamsie J. 2001. Learning across the Life Cycle: Experimentation and Performance
among the Hollywood Studio Heads. Strategic Management Journal 22(8): 725-745.
Norton EC, Wang H, Ai C. 2004. Computing interaction effects and standards errors in logit and probit models. Stata Journal 4(2): 154–167.
Pfeffer J. 1983. Organizational demography. Research in Organizational Behavior 5: 299-357. Pfeffer J, Salancik GR. 1978. The External Control of Organizations: A Resource Dependence
Perspective. Stanford Business Books. Porter ME. 1991. Towards a dynamic theory of strategy. Strategic Management Journal, 12: 95–
117. Powell TC. 1992. Organizational alignment as competitive advantage. Strategic Management
Journal 13(2): 119-134. Priem RL. 1990. Top management team group factors, consensus, and firm performance.
Strategic Management Journal 11(6): 469-478. Quinn R, Cameron, K. 1983. Organizational life cycles and shifting criteria of effectiveness:
Some preliminary evidence. Management Science 29: 33-51. Randel AE, Jaussi KS. 2003. Functional background identity, diversity, and individual
performance in cross-functional teams. Academy of Management Journal 46(6): 763-774. Rivkin JW. 2000. Imitation of complex strategies. Management Science 46(6): 824-844. Roberts EB. 1991. Entrepreneurs in High Technology: Lessons from MIT and Beyond. Oxford
University Press, New York, NY. Roberts EB, Eesley, CE. 2011. Entrepreneurial Impact: The Role of MIT – an Updated Report.
Foundations and Trends® in Entrepreneurship 7(1-2): 1-149. Romanelli, E. 1989. Environments and strategies of organization start-up: Effects on Early
Survival. Administrative Science Quarterly 34(3): 369. Ronda-Pupo GA, Guerras-Martin LA. 2012. Dynamics of the Evolution of the Strategy Concept
1962-2008: A Co-Word Analysis. Strategic Management Journal, 33: 162–188. Rosenbloom RS, Christensen CM. 1994. Technological discontinuities, organizational
capabilities, and strategic commitments. Industrial and Corporate Change 3(3): 654-68. Rothaermel, FT. 2001. Incumbent’s Advantage Through Exploiting Complementary Assets Via
Interfirm Cooperation. Strategic Management Journal, 22: 687–699. Roure JB, Maidique MA. 1986. Linking Prefunding Factors and High-Technology Venture
Success: An Exploratory Study. Journal of Business Venturing 1(3): 295-306. Ruef M, Aldrich H, Carter N. 2003. The Structure of founding teams: Homophily, strong ties,
and isolation among U.S. entrepreneurs. American Sociological Review 68(2): 195-222. Sahlman WA. 1990. The structure and governance of venture-capital organizations. Journal of
Financial Economics 27(2): 473-521. Scott WR. 2008. Institutions and Organizations. Thousand Oaks, CA: Sage. Selznick P. 1949. TVA and the grass roots. Berkley, CA: University of California Press.
37
Smith KG, Smith KA, Olian JD, Sims HP, O'Bannon DP, Scully JA. 1994. Top management team demography and process: The role of social integration and communication. Administrative Science Quarterly 39(3): 412-438.
Starbuck WH. 1983. Organizations as action generators. American Sociological Review. 48: 231-266.
Stinchcombe AL. 1965: Social Structure and Organizations. In: March, J.G. (ed.), Handbook of Organizations. Chicago: Rand McNally & Company, 142-193.
Stock JH, Watson, MW. 2010. Indicators for dating business cycles: Cross-history selection and comparisons,” American Economic Review 100(2): 16-19.
Teece DJ. 1986. Profiting from technological innovation: Implications for integration, collaboration, licensing and public policy. Research Policy 15: 285-305.
Thomas AS, Litschert RJ, Ramaswamy K. 1991. The performance impact of strategy - manager coalignment: An empirical examination. Strategic Management Journal 12(7): 509-522.
Tripsas, M. 1997. Surviving radical technological change through dynamic capability: Evidence from the typesetter industry. Industrial and Corporate Change 6(2): 341-377.
Tushman ML, Anderson P. 1986. Technological Discontinuities and Organizational Environments. Administrative Science Quarterly, 31: 439-465.
Williams KY, O’Reilly CA. 1998. Demography and Diversity in Organizations: A Review of 40 Years of Research, in Staw, BM and Cummings, LL, eds, Research in Organizational Behavior, vol. 20. JAI Press; Greenwich, CT.
Woodward, J. 1965. Industrial Organization: Theory and Practice. Oxford University Press, Oxford.
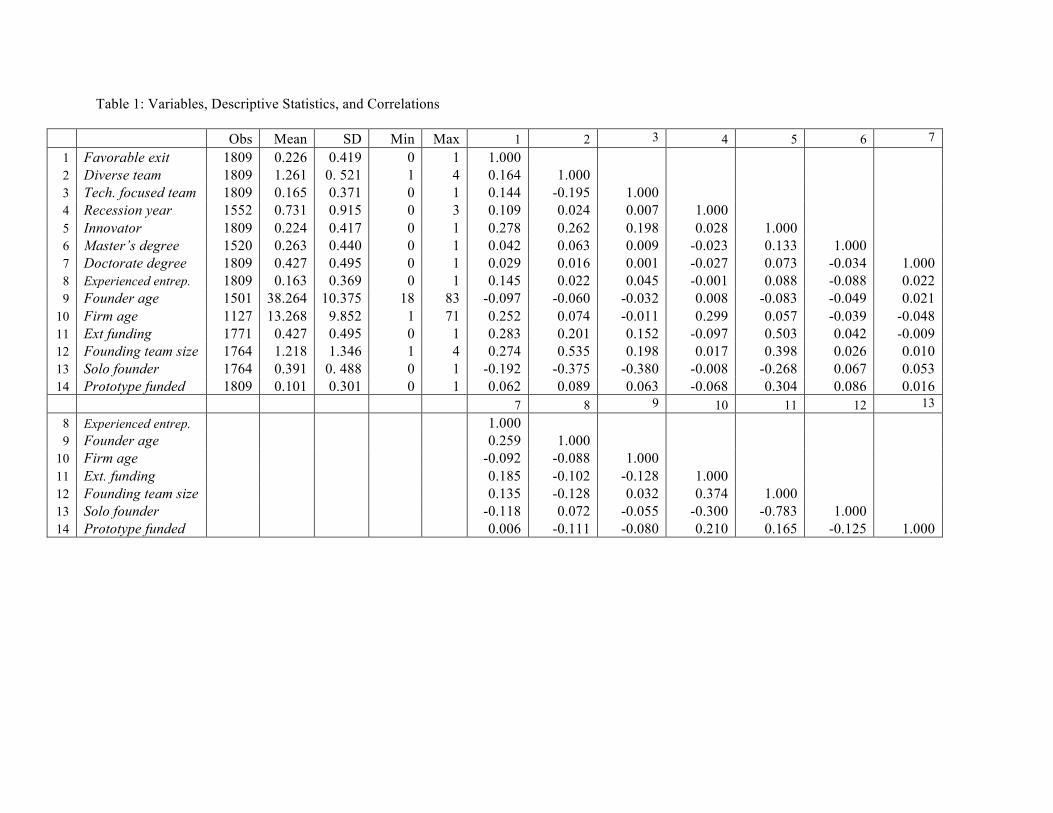
Table 1: Variables, Descriptive Statistics, and Correlations
Obs Mean SD Min Max 1 2 3 4 5 6 7 1 Favorable exit 1809 0.226 0.419 0 1 1.000 2 Diverse team 1809 1.261 0. 521 1 4 0.164 1.000 3 Tech. focused team 1809 0.165 0.371 0 1 0.144 -0.195 1.000 4 Recession year 1552 0.731 0.915 0 3 0.109 0.024 0.007 1.000 5 Innovator 1809 0.224 0.417 0 1 0.278 0.262 0.198 0.028 1.000 6 Master’s degree 1520 0.263 0.440 0 1 0.042 0.063 0.009 -0.023 0.133 1.000 7 Doctorate degree 1809 0.427 0.495 0 1 0.029 0.016 0.001 -0.027 0.073 -0.034 1.000 8 Experienced entrep. 1809 0.163 0.369 0 1 0.145 0.022 0.045 -0.001 0.088 -0.088 0.022 9 Founder age 1501 38.264 10.375 18 83 -0.097 -0.060 -0.032 0.008 -0.083 -0.049 0.021
10 Firm age 1127 13.268 9.852 1 71 0.252 0.074 -0.011 0.299 0.057 -0.039 -0.048 11 Ext funding 1771 0.427 0.495 0 1 0.283 0.201 0.152 -0.097 0.503 0.042 -0.009 12 Founding team size 1764 1.218 1.346 1 4 0.274 0.535 0.198 0.017 0.398 0.026 0.010 13 Solo founder 1764 0.391 0. 488 0 1 -0.192 -0.375 -0.380 -0.008 -0.268 0.067 0.053 14 Prototype funded 1809 0.101 0.301 0 1 0.062 0.089 0.063 -0.068 0.304 0.086 0.016 7 8 9 10 11 12 13
8 Experienced entrep. 1.000 9 Founder age 0.259 1.000
10 Firm age -0.092 -0.088 1.000 11 Ext. funding 0.185 -0.102 -0.128 1.000 12 Founding team size 0.135 -0.128 0.032 0.374 1.000 13 Solo founder -0.118 0.072 -0.055 -0.300 -0.783 1.000 14 Prototype funded 0.006 -0.111 -0.080 0.210 0.165 -0.125 1.000
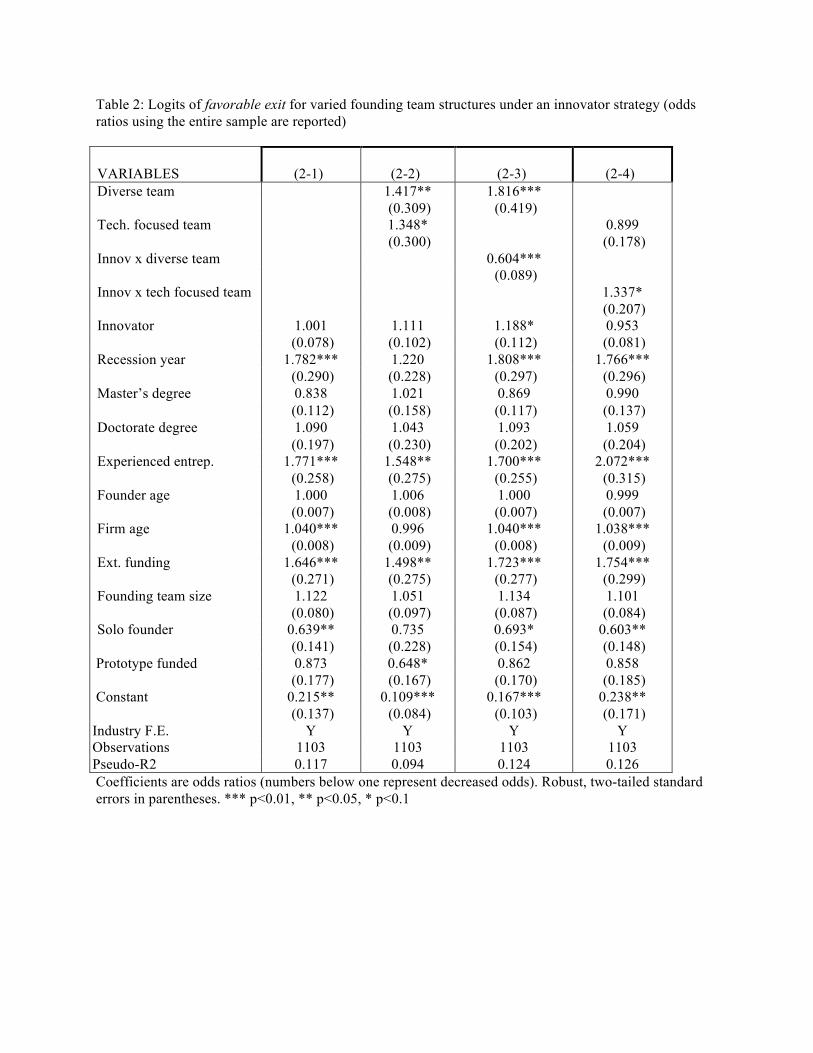
Table 2: Logits of favorable exit for varied founding team structures under an innovator strategy (odds ratios using the entire sample are reported)
VARIABLES
(2-1)
(2-2)
(2-3)
(2-4) Diverse team 1.417** 1.816*** (0.309) (0.419) Tech. focused team 1.348* 0.899 (0.300) (0.178) Innov x diverse team 0.604*** (0.089) Innov x tech focused team 1.337* (0.207) Innovator 1.001 1.111 1.188* 0.953 (0.078) (0.102) (0.112) (0.081) Recession year 1.782*** 1.220 1.808*** 1.766*** (0.290) (0.228) (0.297) (0.296) Master’s degree 0.838 1.021 0.869 0.990 (0.112) (0.158) (0.117) (0.137) Doctorate degree 1.090 1.043 1.093 1.059 (0.197) (0.230) (0.202) (0.204) Experienced entrep. 1.771*** 1.548** 1.700*** 2.072*** (0.258) (0.275) (0.255) (0.315) Founder age 1.000 1.006 1.000 0.999 (0.007) (0.008) (0.007) (0.007) Firm age 1.040*** 0.996 1.040*** 1.038*** (0.008) (0.009) (0.008) (0.009) Ext. funding 1.646*** 1.498** 1.723*** 1.754*** (0.271) (0.275) (0.277) (0.299) Founding team size 1.122 1.051 1.134 1.101 (0.080) (0.097) (0.087) (0.084) Solo founder 0.639** 0.735 0.693* 0.603**
(0.141) (0.228) (0.154) (0.148) Prototype funded 0.873 0.648* 0.862 0.858 (0.177) (0.167) (0.170) (0.185) Constant 0.215** 0.109*** 0.167*** 0.238** (0.137) (0.084) (0.103) (0.171) Industry F.E. Y Y Y Y Observations 1103 1103 1103 1103 Pseudo-R2 0.117 0.094 0.124 0.126 Coefficients are odds ratios (numbers below one represent decreased odds). Robust, two-tailed standard errors in parentheses. *** p<0.01, ** p<0.05, * p<0.1
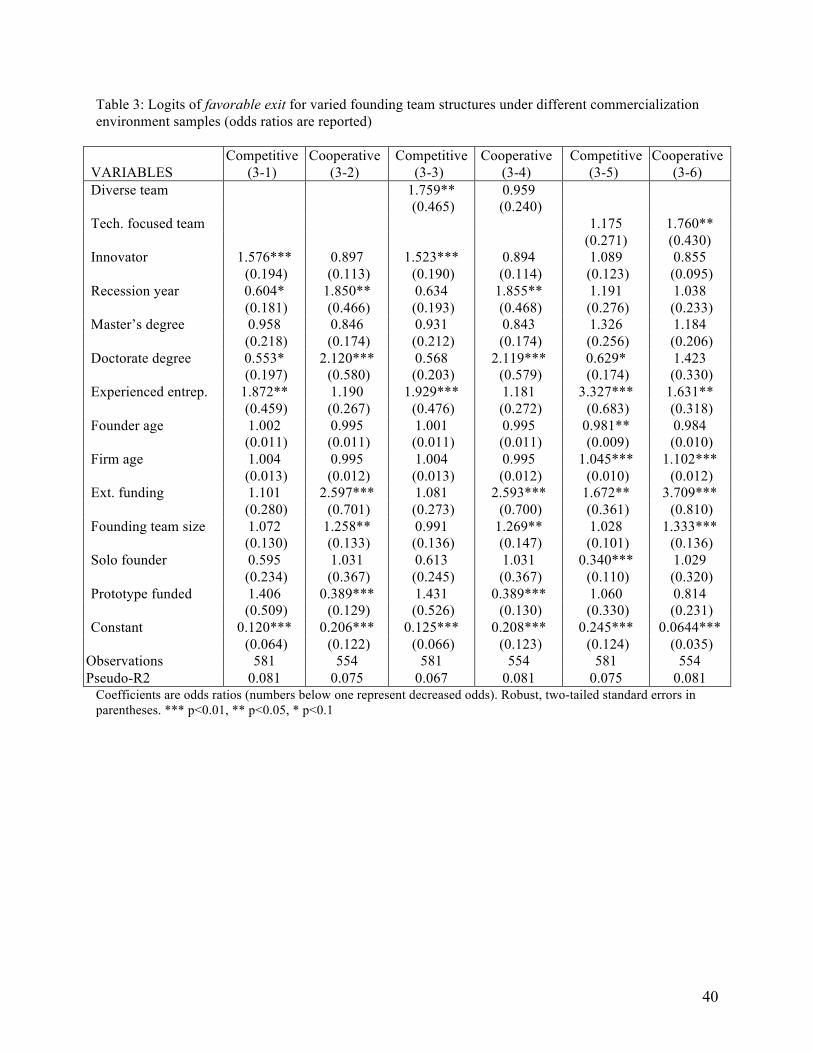
40
Table 3: Logits of favorable exit for varied founding team structures under different commercialization environment samples (odds ratios are reported)
VARIABLES Competitive
(3-1) Cooperative
(3-2) Competitive
(3-3) Cooperative
(3-4) Competitive
(3-5) Cooperative
(3-6) Diverse team 1.759** 0.959 (0.465) (0.240) Tech. focused team 1.175 1.760** (0.271) (0.430) Innovator 1.576*** 0.897 1.523*** 0.894 1.089 0.855 (0.194) (0.113) (0.190) (0.114) (0.123) (0.095) Recession year 0.604* 1.850** 0.634 1.855** 1.191 1.038 (0.181) (0.466) (0.193) (0.468) (0.276) (0.233) Master’s degree 0.958 0.846 0.931 0.843 1.326 1.184 (0.218) (0.174) (0.212) (0.174) (0.256) (0.206) Doctorate degree 0.553* 2.120*** 0.568 2.119*** 0.629* 1.423 (0.197) (0.580) (0.203) (0.579) (0.174) (0.330) Experienced entrep. 1.872** 1.190 1.929*** 1.181 3.327*** 1.631** (0.459) (0.267) (0.476) (0.272) (0.683) (0.318) Founder age 1.002 0.995 1.001 0.995 0.981** 0.984 (0.011) (0.011) (0.011) (0.011) (0.009) (0.010) Firm age 1.004 0.995 1.004 0.995 1.045*** 1.102*** (0.013) (0.012) (0.013) (0.012) (0.010) (0.012) Ext. funding 1.101 2.597*** 1.081 2.593*** 1.672** 3.709*** (0.280) (0.701) (0.273) (0.700) (0.361) (0.810) Founding team size 1.072 1.258** 0.991 1.269** 1.028 1.333*** (0.130) (0.133) (0.136) (0.147) (0.101) (0.136) Solo founder 0.595 1.031 0.613 1.031 0.340*** 1.029 (0.234) (0.367) (0.245) (0.367) (0.110) (0.320) Prototype funded 1.406 0.389*** 1.431 0.389*** 1.060 0.814 (0.509) (0.129) (0.526) (0.130) (0.330) (0.231) Constant 0.120*** 0.206*** 0.125*** 0.208*** 0.245*** 0.0644***
(0.064) (0.122) (0.066) (0.123) (0.124) (0.035) Observations 581 554 581 554 581 554 Pseudo-R2 0.081 0.075 0.067 0.081 0.075 0.081
Coefficients are odds ratios (numbers below one represent decreased odds). Robust, two-tailed standard errors in parentheses. *** p<0.01, ** p<0.05, * p<0.1
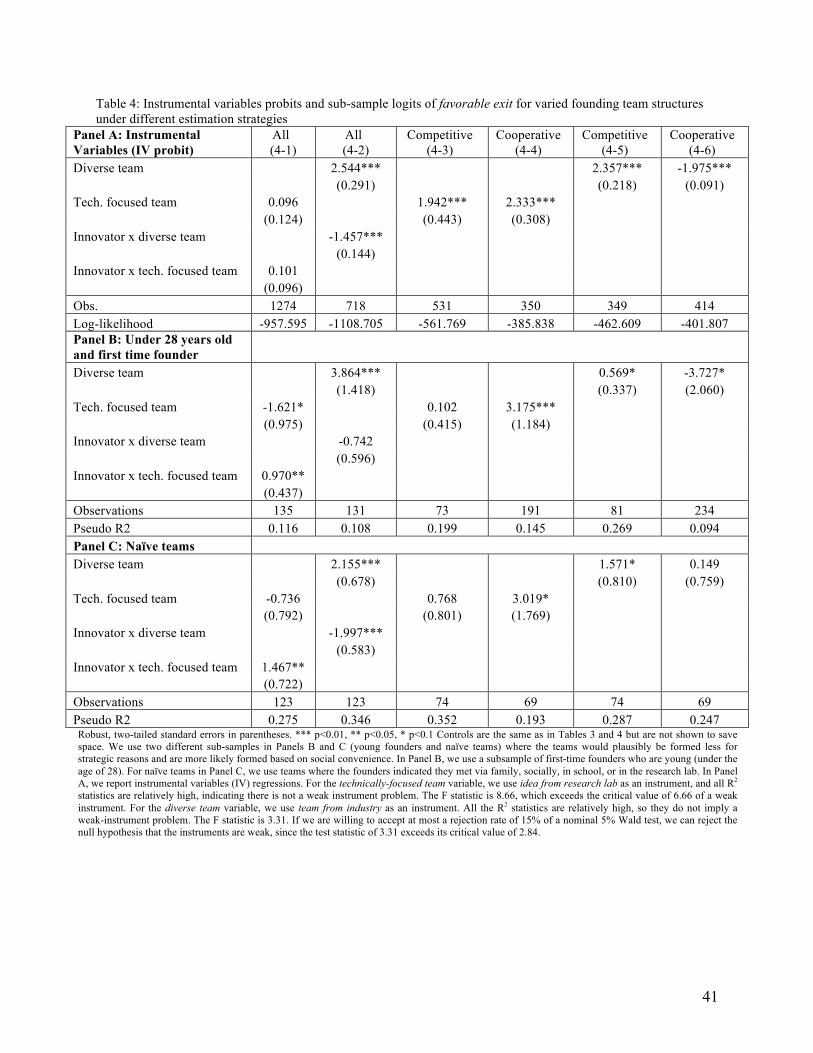
41
Table 4: Instrumental variables probits and sub-sample logits of favorable exit for varied founding team structures under different estimation strategies
Panel A: Instrumental Variables (IV probit)
All (4-1)
All (4-2)
Competitive (4-3)
Cooperative (4-4)
Competitive (4-5)
Cooperative (4-6)
Diverse team 2.544*** 2.357*** -1.975*** (0.291) (0.218) (0.091) Tech. focused team 0.096 1.942*** 2.333*** (0.124) (0.443) (0.308) Innovator x diverse team -1.457*** (0.144) Innovator x tech. focused team 0.101 (0.096) Obs. 1274 718 531 350 349 414 Log-likelihood -957.595 -1108.705 -561.769 -385.838 -462.609 -401.807 Panel B: Under 28 years old and first time founder Diverse team 3.864*** 0.569* -3.727* (1.418) (0.337) (2.060) Tech. focused team -1.621* 0.102 3.175*** (0.975) (0.415) (1.184) Innovator x diverse team -0.742 (0.596) Innovator x tech. focused team 0.970** (0.437) Observations 135 131 73 191 81 234 Pseudo R2 0.116 0.108 0.199 0.145 0.269 0.094 Panel C: Naïve teams Diverse team 2.155*** 1.571* 0.149 (0.678) (0.810) (0.759) Tech. focused team -0.736 0.768 3.019* (0.792) (0.801) (1.769) Innovator x diverse team -1.997*** (0.583) Innovator x tech. focused team 1.467** (0.722) Observations 123 123 74 69 74 69 Pseudo R2 0.275 0.346 0.352 0.193 0.287 0.247 Robust, two-tailed standard errors in parentheses. *** p<0.01, ** p<0.05, * p<0.1 Controls are the same as in Tables 3 and 4 but are not shown to save space. We use two different sub-samples in Panels B and C (young founders and naïve teams) where the teams would plausibly be formed less for strategic reasons and are more likely formed based on social convenience. In Panel B, we use a subsample of first-time founders who are young (under the age of 28). For naïve teams in Panel C, we use teams where the founders indicated they met via family, socially, in school, or in the research lab. In Panel A, we report instrumental variables (IV) regressions. For the technically-focused team variable, we use idea from research lab as an instrument, and all R2 statistics are relatively high, indicating there is not a weak instrument problem. The F statistic is 8.66, which exceeds the critical value of 6.66 of a weak instrument. For the diverse team variable, we use team from industry as an instrument. All the R2 statistics are relatively high, so they do not imply a weak-instrument problem. The F statistic is 3.31. If we are willing to accept at most a rejection rate of 15% of a nominal 5% Wald test, we can reject the null hypothesis that the instruments are weak, since the test statistic of 3.31 exceeds its critical value of 2.84.