the contingent valuation method - wordpress.com · 8/20/2017 · what could go wrong? problem 1 ......
TRANSCRIPT

The Contingent
Valuation Method

Introduction to the
contingent valuation method

Theoretical basis for CVM
▪ WTP measures give an estimate of compensating variation
for welfare improving moves and of equivalent variation for
welfare decreasing moves.
▪ Example with indirect utility function where utility indirectly
depends on prices, income and environmental quality:
For z1 > z0
u0 = V(p, y, z0) = V(p, y - CV, z1) (WTP)
u1 = V(p, y, z1) = V(p, y + EV, z0) (WTA)
For z1 < z0
u0 = V(p, y, z0) = V(p, y + CV, z1) (WTA)
u1 = V(p, y, z1) = V(p, y - EV, z0) (WTP)
Further reading: Champ et al. (2003): Chapter 2.

Brief description
The words contingent valuation (CV) is derived from the
application of the method since respondents are asked a value
contingent upon the occurrence of a hypothetical situation.
Quality of the CV questionnaire is extremely important.
Present a scenario that describes a certain change in the
provision of a public good. The scenario also describes how the
respondent would pay for this provision. Then respondents are
1) Closed-ended: Asked to say Yes or No to a certain cost
(bid), or
2) Open-ended: Asked to state how much they would be
willing to contribute.

Steps in the develpment of a CV survey
1) Identify the valuation problem
2) Construct the scenario
3) Design elicitation question
4) Draw a sample of the population
5) Collect data (including collection of e.g. socio-
economic characteristics)
6) Estimate econometric models and test validity
(estimate the WTP and analyse its determinants)
7) Extrapolate these responses to the whole
population
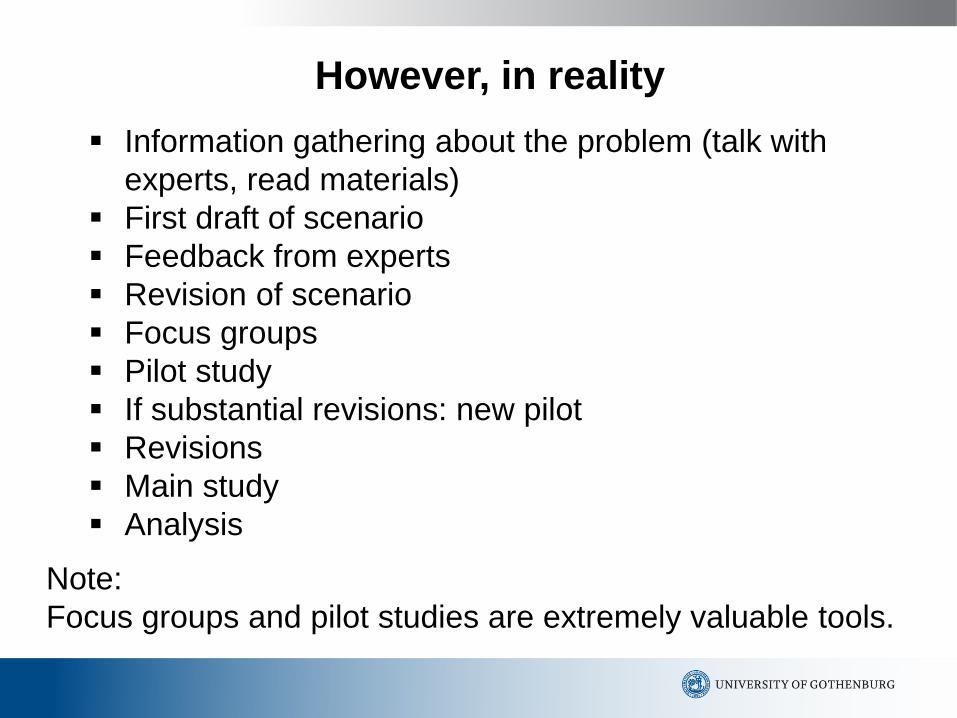
However, in reality
▪ Information gathering about the problem (talk with
experts, read materials)
▪ First draft of scenario
▪ Feedback from experts
▪ Revision of scenario
▪ Focus groups
▪ Pilot study
▪ If substantial revisions: new pilot
▪ Revisions
▪ Main study
▪ Analysis
Note:
Focus groups and pilot studies are extremely valuable tools.

Three problems with CVM in developing
countries
1. Poor survey implementation
Poorly executed surveys a major
problem. Researchers are badly trained at this
and it is difficult! Enumerators are critical link.
Train them and treat them well. Check their
impact with dummies in the analysis.

Three problems with CVM in developing
countries
2. Poorly crafted scenarios
Important and difficult hurdle – not easy!
Construct an interesting deal to be accepted or
rejected. Respondent should be sufficiently
intrigued and understand it as intended.
Put yourself in the respondents place! Does the
question make economic sense?
There is a link between the good to be valued,
the scenario and the elicitation method to be
used. Many possible pitfalls.

Three problems with CVM in developing
countries
3. Failure to test design
General recommendation to use split-samples to
test designs to:
▪ Gain insights if the right choices were made in the
design process (responses should be sensitive to
design).
▪ Opportunity to learn what works and what does not
work – particularly for funding agencies etc that are
interested in low-cost robust methods.

What could go wrong?Problem 1
Individuals answer willingness to pay questions
inaccurately due to …
▪ Problems with the method itself, and/or
▪ Problems with survey administration.
Problem 2
Miscommunication between the interviewer and the
respondent due to poorly designed questionnaire.
Problem 3
Problems involved with aggregation of individual
responses to CV questions.
▪ Due to non-random samples;
▪ Insufficient sample size;
▪ Poor econometrics.

What should we do?
▪ Design better survey instruments;
▪ Manage the survey implementation better
(e.g., training and supervision of
enumerators);
▪ Better research design, sampling,
econometric analysis.

Standard components of a CV questionnaire
▪ An introductory section that helps set the general context for
the decision to be made;
▪ A scenario which includes a detailed description of the good,
service, or project to be offered to the respondents as well as
the manner in which the respondent is to pay for the good,
service, or project;
▪ The institutional setting in which the good will be provided;
▪ A method by which the questionnaires elicits the
respondent’s preferences for (or against) the good or service;
▪ Debriefing questions about why respondents answered
certain questions the way they did;
▪ Questions about the characteristics of the respondent,
including socioeconomic and attitudinal information.

Design of contingent
valuation survey instruments

General issues in questionnaire design
▪ Time constraints
▪ Negotiating questions to include
▪ Sequence of modules
▪ Revealed preference data
▪ Time-to-think experiments
▪ Multiple income proxies
▪ Tag-on on other surveys

Again, steps in the develpment of a CV survey
1) Identify the valuation problem
2) Construct the scenario
3) Design elicitation question
4) Draw a sample of the population
5) Collect data (including collection of e.g. socio-
economic characteristics)
6) Estimate econometric models and test validity
(estimate the WTP and analyse its determinants)
7) Extrapolate these responses to the whole
population

1. Identification of the problem
▪ What is the problem?
▪ How to change the environmental
quality?
▪ What will the effect be of the changed
quality?

2. Construction of the scenario
▪ Story => reason for payment
▪ Conceptual model – CBA rule
▪ Theoretically accurate?
▪ Extent of “market”? (should be those with
economic and legal standing)
▪ Sensitive to amount and kind of information
regarding environmental change
▪ Explaining risk, probabilities

The scenario ...
Does the story make sense?
▪ Policy relevant?
▪ Plausible/reasonable?
▪ Understandable?
▪ Meaningful?
▪ Pre-test, pre-test, pre-test
Notes: differences b/w pre-test and pilot?

More specifically in the scenario
▪ When the service will be available?
▪ How will they pay? (payment vehicle)
▪ How much others will be expected to pay?
▪ Who will pay?
▪ What are conditions for the provision of the good?
(e.g. more than 50% says Yes);
▪ What institutions will be responsible for the delivery of
the good or service?
▪ Quality and reliability of the service?
▪ Include “cheap talk” script?
▪ Remind them about budget constraint

What is cheap talk?
▪ Cheap talk refers to a text script which
is shown to respondents prior to
completing an elicitation question or an
experiment. The script emphasizes the
importance of the respondent’s answer,
despite the hypothetical nature of the
designed task (Fifer et al., 2014).

Example of cheap talk script
The experience from previous similar surveys is that
people often respond in one way but act differently. It is
particular common that one states a higher willingness
to pay than what one actually is willing to pay for the
good in the store. We believe this is due to the fact that
one does not really consider how big an impact an extra
cost actually has to the family budget. It is easy to be
generous when one does not really need to make the
choices in a store. If you have another idea or comment
on what this behavior depends on, please write this
down on the last page of the questionnaire.

Follow-up of the scenario
▪ Test understanding
▪ Give them time to think (Cook et al, 2011)
▪ Debriefing questions; identifying “scenario
rejecters”
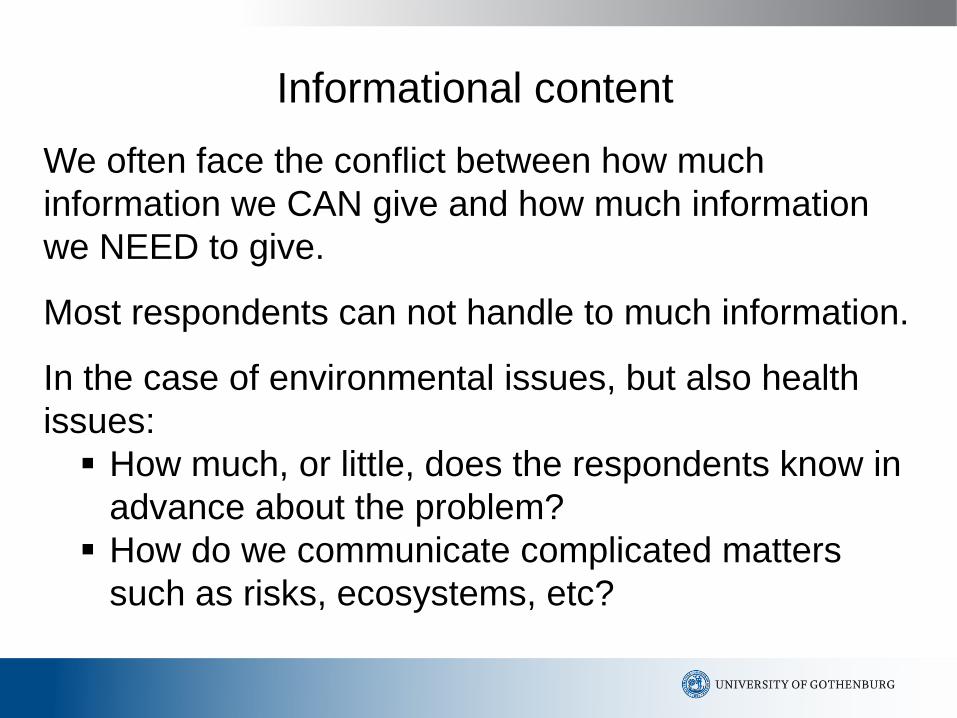
Informational content
We often face the conflict between how much
information we CAN give and how much information
we NEED to give.
Most respondents can not handle to much information.
In the case of environmental issues, but also health
issues:
▪ How much, or little, does the respondents know in
advance about the problem?
▪ How do we communicate complicated matters
such as risks, ecosystems, etc?

Example: Risk description I
We will consider the risk for people between the ages of 18 and 70 years. There
are currently 6 million people in this age group in Sweden. Although the number
of people that die in accidents within this age group varies from year to year, we
are still able to calculate the average risks based on statistics from different
accident types.
For example: During a ten year period, 600 adults die in fire accidents in
Sweden. We can then say that the average risk of dying in a fire accident is 600
in 6 million.
This is the same as saying that the average risk of dying in a fire accident is 6 in
60.000. For road traffic accidents, the risk of dying during a ten year period is 35
in 60.000 while for drowning accidents the risk is 8 in 60.000.
We will now require you to answer a number of questions. In each question,
there is the possibility of taking a measure that will reduce your own personal
risk of dying in a particular accident type. In each question, we assume that your
current level of risk is given. This risk will vary between questions and you are
only able to reduce this risk by taking the accident prevention measure. Please
take this risk as given, even if you believe that you are able to influence this risk
in some other way.

Example: Risk description II

The payment vehicle
▪ Should be perceived by the respondent to be linked directly
to the provision of the good.
▪ Should be viewed as mandatory once a commitment has
been made, so that respondents take the notion of payment
seriously.
Typical mechanisms:
▪ Tax
▪ Utility bills, for example water and electricity
▪ Donations
The first two are coercive and the last is voluntary. In general,
we use coercive payment vehicles.
▪ Lump sum or monthly?
▪ Money, labor or rice?

3. Design elicitation questions
▪ Open ended
▪ Payment card
▪ Bidding game
▪ Binary/dichotomous choice/single-bounded
▪ Double-bounded/triple-bounded
Further reading: Bateman et al. (2002): Chapter 4.

Elicitation methods I
Open-ended
How much would you at most pay as solid waste management
fee in order for you household to participate in the solid waste
management program? Express in per month and per
household:
........................... Rs per month
Single-bounded
If the solid waste management fee for your household is
Rs............ per month would your household participate in the
solid waste management program?
1. Yes 2. No
The amount they are offered is called the bid. Everybody does
not face the same bid. The bid is drawn from the bid vector.

Elicitation methods II
Double-bounded15. If the solid waste management fee for your house hold is Rs X.
per month would your household participate in the solid waste
management program?
1. Yes Go to 15b
2. No Go to 15c
15b. What if the fee for your household instead was Rs 2*X per
month, would your household participate in the solid waste
management program?
1. Yes 2. No
15c. What if the fee for your household instead was Rs 0.5*X per
month, would your household participate in the solid waste
management program?
1. Yes 2. No

Open-ended versus single-bounded
Open-ended▪ More information about WTP
▪ No hint/cue about the cost
▪ More difficult to answer
▪ Not incentive compatible
Single-bounded▪ Easy to answer
▪ Resemble market transaction
▪ Incentive compatible
▪ In the public good case, this resembles a vote for the public
good.
▪ Less information, which means larger sample size is required,
and more complicated econometrics.
▪ Yea-saying/Nay-saying. The bid does not affect the behaviour.

Single-bounded versus double-bound
Double-bounded/bidding game
▪ More information, i.e. smaller sample sizes
▪ Not incentive compatible
▪ Evidence that the preferences are not stable over
the experiment. The preferences reflected in the
first question are not the same as the preferences
in the second question.
▪ More difficult to answer.

Design of the bid vector
▪ How many bids should be used and what should the bids be?
▪ The goal of experimental design is to find the bid vector that
provides maximum possible information about the
parameters of the WTP distribution, given the size of the
sample.
▪ One fundamental problem of optimal design is that we need
to make an assumption about the true underlying WTP
distribution.
▪ This assumption should be based on extensive pilot studies.
▪ Use focus groups, pre-test and iterative surveys with updated
designs.
▪ In practice, CVM practitioners seem to rely more ad-hoc
rules, or perhaps are taking precaution against wrong priors.

Debriefing questions
▪ Did the respondent really care?
▪ Identify respondents with zero WTP - Why
zero WTP? True zero or protest? (compare
“cannot afford” versus “the government should
pay”).
▪ Measuring uncertainty

(If no WTP) Why don't you want to pay
anything for the provision of public good?
1. We are too poor.
2. The government should pay.
3. We are exempted from use.
4. We don't get anything/not much from the good.
5. We have good access to other sources.
6. Man is not present to decide.
7. We don't have cash.
8. Village committee has to decide.
9. Because the present situation gives us enough.

(Interviewer) Did the respondent:
1. Give the questions prolonged consideration in an
effort to arrive at the best possible value?
2. Give the questions careful consideration, but the
effort was not prolonged?
3. Give the questions some consideration?
4. Give the questions very little consideration?
5. Other (specify):

Tests of design and other hypotheses
Use various split samples to test for:
▪ Variations in the goods
▪ Variants of scenario
▪ Design and bias tests
▪ Survey implementation tests

Implementation of survey

4. Sampling
▪ Determine the target population
▪ Create the sampling frame
▪ Draw the sample from the sampling frame
• Random sample
• Stratified sample? (eg by income or ethnicity)
• Sample size?
– Depends on elicitation format
– Budget issue

Sampling frame
▪ Look out for poor/landless/women
▪ Choose household or individual household head
often the relevant level of disaggregation.
Common approaches:
▪ Village roster
▪ Census, tax or voting rosters
▪ Random sample in village (or “every fifth door”)
▪ Be careful with marginalized groups, e.g.
schedule caste in separate hamlets.

Sampling frame: Example
▪ I made village maps, and identified each
household
▪ Used random function in EXCEL
▪ Gave lists of hh:s and maps to
enumerators including extra numbers
(better to track down the first choice
because of potential selection bias)

Delivery mode
▪ Mail/telephone/in-person/www (mail is
cheapest and most common in
developed countries).
▪ Personal interview the only possible
option in many cases. Also considered
the best, but not neutral, as we will see.
▪ Be careful with training of enumerators in
order to decrease problems with biases.

Training enumerators
▪ Understanding the subject matter of the
survey.
▪ Understanding the CVM and the
research design.
▪ Imparting skills to be a good interviewer.


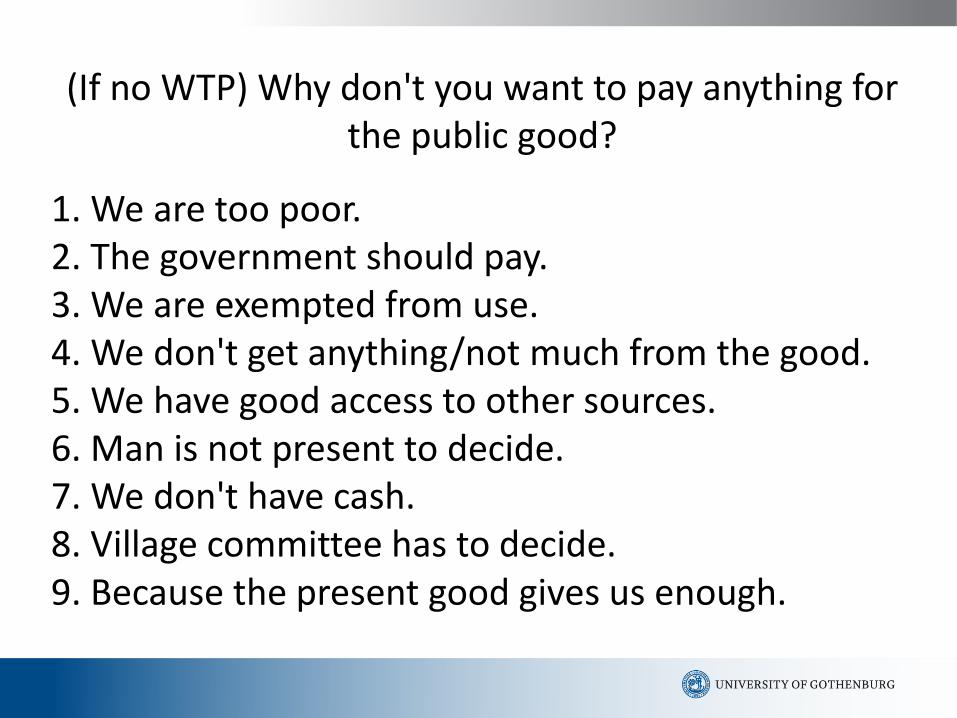
(If no WTP) Why don't you want to pay anything for the public good?
1. We are too poor.2. The government should pay.3. We are exempted from use.4. We don't get anything/not much from the good.5. We have good access to other sources.6. Man is not present to decide.7. We don't have cash.8. Village committee has to decide.9. Because the present good gives us enough.

Training Enumerators (cont.):Do’s and don’ts
1. Read every question exactly as written – do not improvise.
2. Read the questions slowly enough so that respondents can understand.
3. Wait for the respondent to answer.4. If the respondent cannot answer, repeat the question.5. Remain absolutely neutral about the respondent’s
answers.6. Do not act embarrassed about a respondent’s answers
to sensitive questions.

Training Enumerators (cont.):Do’s and don’ts
7. Never suggest an answer.
8. Don’t repeat the respondent’s answers.
9. Conduct the interview in private.
10. Do not give advice to respondents on personal matters.
11. Answer directly any questions the respondent may have about the purpose of the survey.
12. Listen carefully to the respondent’s answer.

▪ Contact a coding company to check the questionnaires for coding.
▪ Try to pre-code as much as possible.▪ Think about coding of zero, not applicable, no
answer.▪ Definition of household▪ When do respondents have time to respond?
(season of year, time of day, etc)▪ Transportation/accommodation▪ Double entry of data
Logistics

Pilots
▪ About 10-20% of final sample. Update bid
vector.
▪ Bring computer and printer – continuously
update coding.
▪ Make sure you have time between the
pilot study and the main survey to
implement any changes.
▪ You should even be prepared to do a
second pilot if things go wrong.
5. Collecting data
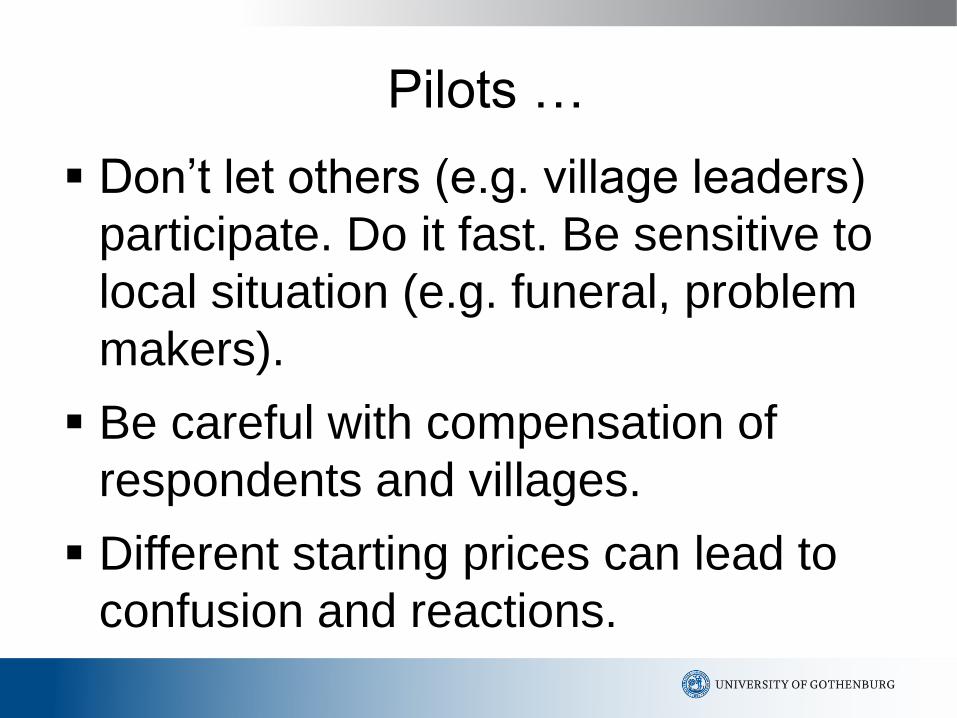
▪ Don’t let others (e.g. village leaders)
participate. Do it fast. Be sensitive to
local situation (e.g. funeral, problem
makers).
▪ Be careful with compensation of
respondents and villages.
▪ Different starting prices can lead to
confusion and reactions.
Pilots …

▪ First test is to see if bids can be explained
by variables proposed by economic
reasoning/model (construct validity).
▪ (Old rule of thumb from Mitchell and
Carson is an adjusted R2 of 0.15)
Validation

Checklist of Questions to Consider in the
Design of CV Survey Instruments
1. Should you have the respondent sign an
“informed consent” form?
2. Does the introductory material convey a sense
that the respondent’s answer will be meaningful
in policy matters and thus encourage the
respondent to take the interview seriously
(consequentiality)?

Checklist of Questions to Consider (cont.)
3. Are the questions in the introductory section
“easy” for the respondent to answer? Are they
“warming up” the respondent to think about the
valuation question(s)? Do they cover existing
attitudes and practices about the good or service
to be valued?
4. Does the CV scenario include questions to break
the presentation of material to the respondents?
Do they collect useful information?

Checklist of Questions to Consider in the
Design of CV Survey Instruments (cont.)
5. Does the CV scenario include a “cheap talk”
script to encourage the respondent to tell the
truth?
6. Are you satisfied that the payment vehicle is
credible?
7. Do you want to follow-up the valuation
question(s) with questions designed to gauge
how certain the respondent is of her/his answer?

Checklist of Questions to Consider (cont.)
8. Are debriefing questions included to better
understand the respondent’s motivations for his/her answers to
the valuation questions? Are the coded answers to the
debriefing questions sufficiently detailed to include most
respondents’ answers?
9. Is there a sequence of questions that clearly
identifies who is “in the market” and who is not (in
case you need to estimate a spike model)?
10. Are there multiple questions that can be used to
classify respondents’ income levels (socioeconomic
status)? Don’t forget to obtain the respondent’s
electricity and other infrastructure bills, if relevant!

Checklist of Questions to Consider (cont.)
11. Is there a question that requires the enumerator to compare
the respondent’s WTP response with his/her income and
confirm that the WTP response is reasonable? Can the
enumerator record a revised WTP answer?
12. If a discrete choice referendum valuation question
is used, is there a debriefing section at the end of the
questionnaire that tells the respondent the purpose of the
split-sample experiment and why some respondents were
offered one price and others will be offered a different price
(in order to avoid spreading misinformation)?
13. Is there a section at the end of the questionnaire to record
the enumerator’s assessment of the
interview?

Readings?
Bateman et al. 2002. Economic valuation
with stated preference techniques: A
manual. Edward Elgar. Chapters 3, 4.

Other Issues with
Contingent Valuation
Method

Whittington, D. (2010). What Have We Learned
from 20 Years of Stated Preference
Research in Less-Developed Countries?
Annual Review of Resource Economics, (2)
pp.209-236.
1. CVM in developing countries
Carlsson, F. (2010). Design of stated preference
surveys: Is there more to learn from
behavioral economics? Environmental and
Resource Economics, (46) pp.167-177.
2. Design of stated preference surveys

Cook, J., M. Jeuland, and D. Whittington.
(2012). Giving stated preference respondents
‘’Time to Think’”: Results from four countries.
Environmental and Resource Economics,
(51) pp.473-496.
3. Time to think

Venkatachalam, L. (2004).The contingent
valuation method: A review. Environmental
Impact Assessment Review, (24) pp.89-124.
4. A review of CVM

Choice Experiments

Introduction

What is it?
In a survey, setting people choose their preferred alternative
from a choice set.
Repeated choices! So each individual answers more than one
question.
The alternatives are described by a number of attributes,
including a monetary (cost) attribute.
So
▪ Each choice question is called a “choice set”.
▪ Each alternative is described in terms of a common set of
“attributes”.
▪ Alternatives are differentiated by the “levels” taken on by
the attributes.

Example 1:
Wetlands in
Sweden
Your choice
(Mark your choice)
Wetland Alternative 1
Simple ponds
Alternative 2 Alternative 3
Surrounding vegetation
Fish
Cray fish
Biodiversity
Walking facilities
Fence
___________________
Total cost per citizen
Your Choice
Forest
No actions
No introduction
Low
No walking
facilities
No
______________
SEK 0
Forest
Good conditions
Introduction
Low
No walking
facilities
No
_____________
SEK 850
Meadow-land
No actions
No introduction
High
Walking
facilities
Fence
______________
SEK 400

Example 2: Contract choice in China
Contract 1 Contract 2 No contract
Tenure length 25 years 50 years
I don’t get a
contract for the
plot.
In other words,
I prefer not to
contract the plot.
First right for contract
You have priority
to renew the
contract. But you
don’t know the
price.
You don’t have
priority to renew
the contract.
Enforcement
The contract can
be prematurely
ended. The risk is
5 out of 100
contracts.
The contract
cannot be
prematurely ended.
Harvest right
Half the times you
get it when you
want it. If you do
not get it you have
to wait 1 year.
Half the times you
get it when you
want it. If you do
not get it you have
to wait 4 years.
Total payment
Annual payment
700
28
500
10
Your choice

Example 3: Flood insurance in Vietnam

The “history” of CE
▪ CE popular in transport and marketing. Valuation of
different attributes. Which became an interest in
environmental economics.
▪ At the same time CVM criticized; a hope that CE could
”solve” some of the problems.
▪ A combination of the knowledge about surveys from
CVM and a development of econometric techniques
resulted in a rapid development of CE in environmental
economics.
▪ But, the hope that CE would solve the biases of CVM
did not really realize. Same problems as with CVM.

But why do CE and not CVM?
CVM and CE are to a greater extent complements
than substitutes. CVM originates from the welfare
approach, while CE from the marketing approach.
CVM: Estimate WTP for a certain scenario.
CE: Estimate marginal WTP for attributes of a
scenario.
So what method we should use depends more on
what we want to do.

Designing a Choice
Experiment

The steps of a CE survey
1) Design the questionnaire including the scenario;
2) Draw a sample of the population;
3) Ask the sample to answer the choice sets;
4) Estimate the parameter of the utility function and
estimate welfare measures (usually MWTP);
5) Extrapolate these responses to the whole
population.
Very much the same procedure as the design of CV
surveys. For example, the scenario is equally
important here. So we will focus on additional aspects.

Design of the choice experiment
1) Definition of attributes and levels;
2) Experimental design;
3) Context, validity tests and
questionnaire development;
4) Sample and sampling strategy.

1. Attributes and levels
1) Do focus groups and pilot studies. Extremely important.
2) Attributes should be expected to affect peoples’ choices.
3) Policy relevant attributes.
4) Do people understand the attributes? This can be a
particular problem for environmental attributes.
The general recommendation is to identify all relevant
attributes. We do not have to include all relevant attributes, but
in that case we need to inform respondents that those not
included are held constant.
The choice of attributes and levels is often a compromise
between what we want to know and complexity for the
respondent.

Attributes continued
Krupnick (2011) describe the need to construct attributes as
“endpoints” or items that are directly incorporated in the utility
functions or household production functions of consumers.
Thus, in a passive use valuation of endangered species
programs, habitat improvements may not be the relevant
attribute as that is not the “endpoint”. The effect on species
survival or species status (threatened, endangered, etc.) is
more likely the endpoint.
Schultz et al (2012) develop a set of standards for attributes or
indicators in stated preference studies. These include
measurability (quantifiable), interpretability (can be understood
by a non-scientist), applicability (linked to endpoints) and
comprehensiveness (a complete description of the outcomes or
endpoints).
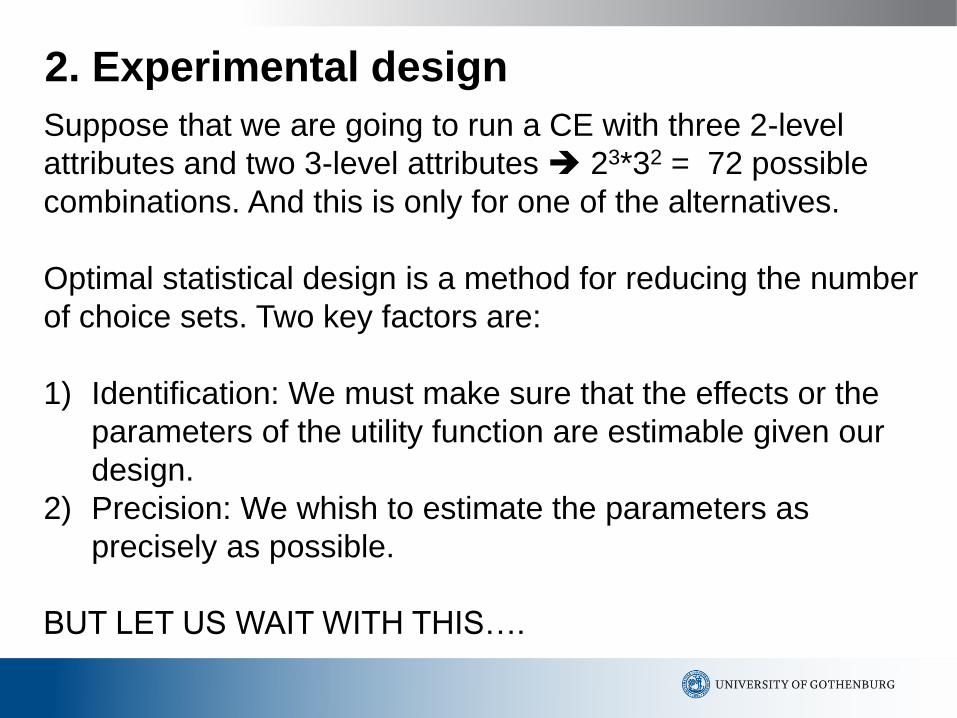
2. Experimental design
Suppose that we are going to run a CE with three 2-level
attributes and two 3-level attributes 23*32 = 72 possible
combinations. And this is only for one of the alternatives.
Optimal statistical design is a method for reducing the number
of choice sets. Two key factors are:
1) Identification: We must make sure that the effects or the
parameters of the utility function are estimable given our
design.
2) Precision: We whish to estimate the parameters as
precisely as possible.
BUT LET US WAIT WITH THIS….

3. Context and Questionnaire development
The scenario is extremely important.
- Excellent work in the CVM literature.
- Simple and clear, but at the same time necessary information has
to be given.
- Particularly important and difficult for environmental and health
problems.
Alternative specific versus generic presentation of alternatives
- Alternative specific: easier to understand but can create biases
- Generic: focus on the trade-off between attributes.
The possibility of opt-out
- Do not distort the welfare measure (?)
- If we focus on the trade-off between attributes then no need for an
opt-out.

Alternative-specific vs. generic
This has to do with the labeling of the alternatives. In most
cases in environmental economics, generic designs are used.
But not always.
Park A Park B
Distance to
volcano50 meters 400 meters
Chance to
see crater
2 out of 10
days
9 out of 10
days
Price $5 $10
Poas Park Arenal Park
Distance to
volcano 50 meters 400 meters
Chance to
see crater2 out of 10
days
9 out of 10
days
Price $5 $10

What information do we get
In the generic:
How visitors value the two attributes in “general”. In principle
this can be transferred to any of the parks in Costa Rica.
In the alternative-specific:
How visitors value the two attributes for the two parks +
difference in valuation between the two parks. More difficult to
transfer the values to other parks.
So the format you use depends on the information you want.
However, by using generic design we face the risk that we miss
something crucial for a particular park (for example that they
don’t have a volcano ☺).

Opt-out or not
Park A Park B No park
Distance
to volcano
50
meters
400
metersNothing
Chance to
see crater
2 out of
10 days
9 out of
10 daysNothing
Price $5 $10 0
Park A Park B
Distance to
volcano50 meters 400 meters
Chance to
see crater
2 out of 10
days
9 out of 10
days
Price $5 $10

What information do we get?
With opt-out
How many people that would not buy any version for that given
combination?
The marginal WTP for the attributes for those that do not choose the
opt-out.
Without opt-out
The marginal WTP for the attributes for all respondents.
What should you go for?
Forced choice in reality? For example, choice of water/energy
contract.
Are you particularly interested in non-demanders?
Do you think that non-demanders would make different trade-offs
than those who demand?

Constructing validity tests
▪ Transitivity: if APB and BPC then APC.
▪ Stability: are preferences stable over the
experiment (test learning).
▪ Bozo test: if A is strictly better than B, then
everybody should prefer A.
Empirically: In general, people do not violate
the test. Again, this depends on the
complexity of the experiment. But we will get
back to this.

4. Sampling
The sample size is of course for researchers partly a
budget issue.
Things to think about:
▪ Sample size depends on the ”size” of the choice
experiment.
▪ Sample size also depends on how many sets each
respondent answers.
In theory discrete choice models required a lot of
observations to receive large sample properties. We
rarely have that many observations.

2. Going back to the experimental design
Suppose that we are going to run a CE with three 2-level attributes
and two 3-level attributes 23*32 = 72 possible combinations (full
factorial design). And this is only for one of the alternatives.
Optimal statistical design is a method for reducing the number of
choice sets. Two key factors are:
1) Identification: We must make sure that the effects or the
parameters of the utility function are estimable given our design.
2) Precision: We whish to estimate the parameters as precisely as
possible.
Fractional factorial design:
▪ Orthogonal design
▪ Efficient designs

Some examples: Johnson et al, Chapter 7.

Some examples: Johnson et al, Chapter 7.

Some examples: Johnson et al, Chapter 7.

Some examples: Johnson et al, Chapter 7.

Some examples: Johnson et al, Chapter 7.

Some examples: Johnson et al, Chapter 7.
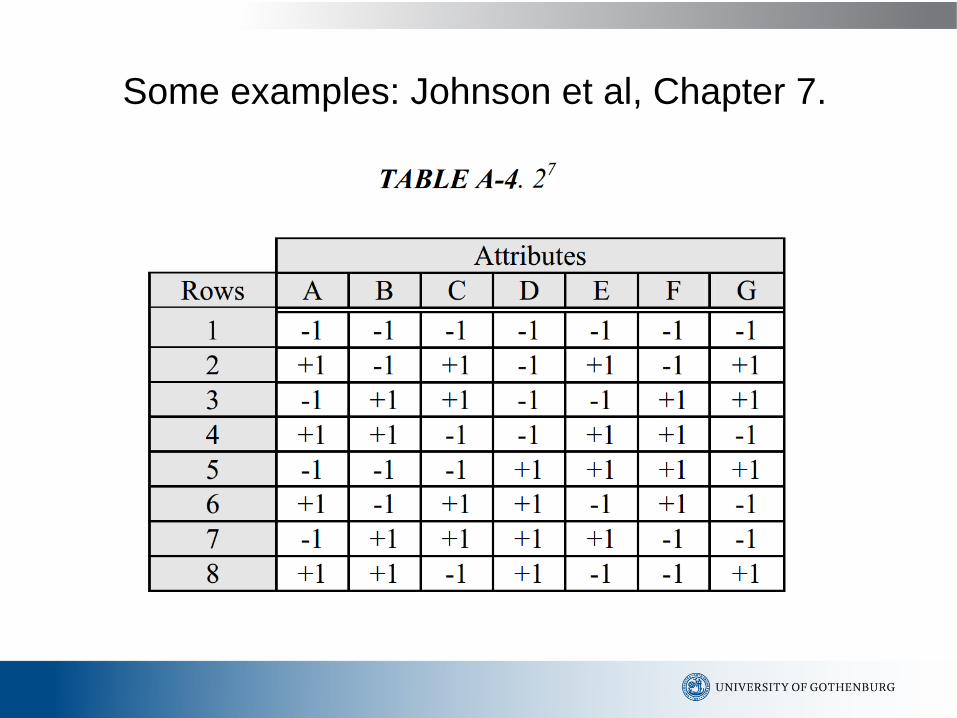
Some examples: Johnson et al, Chapter 7.

Some examples: Johnson et al, Chapter 7.

Orthogonal main effects design
One fundamental rule that is most often used is that the design
should be orthogonal: the variation of the attributes should be
uncorrelated.
Furthermore, in many cases we are only interested in
estimating the main effects: the effect of each attribute on utility,
and not the interaction between them.
With these two principles we have a orthogonal main effects
design.
Suppose we have a very simple design problem with three
attributes, two of the attributes have 4 levels and one has 2
levels. There are thus 32 possible combinations.

Creating the choice sets
So far we have only generated levels combinations
for one alternative. Now we must create the choice
sets.
There are a number of alternatives available, all more
or less using different computer packages. Examples
of such designs are:
1) Comparing each alternative of the design with a
base alternative.
2) Cyclical design
3) Random designs
4) Creating the choice sets simultaneously.

Cyclical Design/Foldover
From an orthogonal array create additional alternatives in each choice set
by cyclically adding alternatives to the set. For example, the levels of these
added attributes add one to the level of the previous alternative. When the
highest level is attained, the level of the attribute is set to its lowest level.
Only for generic designs.
Alternative 1 Alternative 2
Choice set X1 X2 X3 X1 X2 X3
1 1 3 3 0 0 0
2 1 2 2 0 3 3
3 1 1 1 0 2 2
4 1 0 0 0 1 1
5 0 3 0 1 0 1
6 0 2 1 1 3 2
7 0 1 3 1 2 0
8 0 0 2 1 1 3

Simultaneous design
Suppose that there are two alternatives in
each choice set.
We would then generate an orthogonal design
with 2*number of attributes, thus (2142)*(2142)
possible combinations.
Suitable for alternative specific designs.

Blocking
Even if we have reduced the number of choice
sets with statistical design principles. The number
of sets might be to many to answer for each
respondent.
What we then do is to block the design so that
different respondents answers different subsets of
the main design.
We can do this randomly or using design
principles.

Summary orthogonal designs
Advantages:
Orthogonal and smaller than the full factorial.
Disadvantages:
Might still be too large, but this can be solved by
blocking.
May contain choice situations that does not provide
much information.
Other designs can yield more reliable parameter
estimates.
Readings?
Bateman et al. 2002. Economic valuation
with stated preference techniques: A
manual. Edward Elgar. Chapter 6.
Hoyos, D. 2010. The state of the art of
environmental valuation with discrete
choice experiments. Ecological
Economics, (69) pp.1595-1603.

Other Issues with
Choice Experiments

1. Hypothetical bias
Fifer, S., J. Rose, and S. Greaves. (2014).
Hypothetical bias in stated choice experiments:
Is it a problem? And if so, how do we deal with
it? Transportation Research, pp.164-177.
Hensher, D,A. (2010).Hypothetical bias, choice
experiments and willingness to pay.
Transportation Research, (44) pp.735-752.

2. Status quo bias
Meyerhoff, J., and U. Liebe. (2009). Status quo
effect in choice experiments: Empirical
evidence on attitudes and choice task
complexity. Land Economics, (85), pp.515-528.
Whittington, D., and W. Adamowicz. (2011).The
use of hypothetical baselines in stated
preference surveys. Environment for
Development, Discussion Paper Series.

3. Dominant preferences
Scott, A. (2002). Identifying and analyzing
dominant preferences in discrete choice
experiments: An application in health care.
Journal of Economic Psychology, (23), pp.383-
398.

4. Ordering effects in choice experiments
Carlsson, F., M.R. Morkbak, and S.B. Olsen.
(2012). The first time is the hardest: A test of
ordering effects in choice experiments. Journal
of Choice Modelling, (5), pp.19-37.

5. Effects coding in choice experiments
Bech, M., and D. Gyrd-Hansen. (2005). Effects
coding in discrete choice experiments. Health
Economics, (14), pp.1079-1083.

6. ANA in choice experiments
Thanh Cong Nguyen, J. Robinson, J.A. Whitty, S.
Kaneko, and Nguyen The Chinh. (2015). Attribute
non-attendance in discrete choice experiments: A
case study in a developing country. Economic
Analysis and Policy, (47), pp.22-33.
Erdem, S., D. Campbell, and A.R. Hole. (2014).
Accounting for attribute-level non-attendance in a
health choice experiment: Does it matter? Health
Economics.