the contribution of food access strategies to dietary
TRANSCRIPT

i
The contribution of food access strategies to dietary diversity of farm
worker households on Oranje farm in the Fouriesburg district (RSA)
Moratwa Tsholofelo Hope Matla
The contribution of food access strategies to dietary diversity of farm
worker households on Oranje farm in the Fouriesburg district (RSA)
By
Moratwa Tsholofelo Hope Matla
Script submitted in partial fulfillment of the requirements for the degree
Magister in Consumer Science: Development
in the Faculty of Natural and Agricultural Sciences
University of Pretoria
Pretoria
February 2008
Study Leaders: Dr Rozanne Kruger
Prof Hettie C Schönfeldt

Dedicated to my beloved baby boyDedicated to my beloved baby boyDedicated to my beloved baby boyDedicated to my beloved baby boy
Molau Oratile Matla!Molau Oratile Matla!Molau Oratile Matla!Molau Oratile Matla!
I love you with all my heI love you with all my heI love you with all my heI love you with all my heartartartart

i
Acknowledgements
My sincerest gratitude and appreciation to the following individuals and
organisations:
♦ My son, Molau Oratile Matla, you were my inspiration and my motivation.
♦ Dr Rozanne Kruger, the supervisor for this study, for her knowledge, advice,
support and encouragement throughout the project and also her sacrificed
holidays and weekends to assist me in my work.
♦ Dr Rozanne Kruger’s family for being patient and understanding while I was
taking her away from them over weekends and holidays.
♦ My mother, for her love, encouragement and supporting me financially.
♦ My family especially my sisters Maqueen & Ntshepiseng, for their love,
motivation and support .
♦ My helper Me Malenka who offered her holidays to look after my son while I
was finishing my study.
♦ My best friend Jacob, for your patience, love, motivation, encouragement and
support.
♦ To my friends Thabo & Tiny for their love, support and helping with
accommodation.
♦ Prof Hettie Schönfeldt for her leadership, encouragement and support.
♦ Rina Owen, for the statistics.

ii
♦ To the community of Oranje Farm, for granting me permission to work with
them.
♦ Trudie Erasmus, for the technical care of the thesis.
♦ Elize van Straaten, for the technical care of the thesis
♦ Mrs A.T Viljoen for the support and encouragement.
♦ Mann Stanley Smith Trust Foundation through Centre of Nutrition UP, for
partial funding of the project.
♦ To the Department Consumer Science, for accepting my study with them.
♦ To Ane Louw, for the language editing of the thesis.
♦ Above all I thank God, for carrying me everyday so far.

iii
Abstract
The contribution of food access strategies to dietary diversity of farm
worker households on Oranje farm in the Fouriesburg district (RSA)
by Moratwa Tsholofelo Hope Matla
Study Leaders: Dr Rozanne Kruger
Prof Hettie C Schönfeldt
Department of Consumer Science
Faculty of Natural and Agricultural Sciences
University of Pretoria
for the degree Magister in Consumer Science
Dietary diversity is an indicator of the access dimensions of household food
security as it relates to income, area, and seasonality. Dietary diversity refers to
the number of different individual food items (food variety) and food groups (food
group variety) consumed over a given reference period (Ruel, 2002:3). This may
accurately predict individual nutrient adequacy and thus household food security.
Inability to access enough food for a sustainable and healthy life indicates food
insecurity. Food accessing refers to obtaining food for all household members at
all times through own production, exchange and/or purchase. Food access
depends on an adequate, stable, local food supply, and includes the availability

iv
and utilization of food (Steyn, Labadarios & Huskissom, 1999: 32). Lack of food
resources often leads to food insecurity due to, among other, limited dietary
diversity (different foods items or food groups) (Bellamy, 1998:24). Emphasis on
dietary diversity can eliminate nutrient deficiency by increasing individual food
and food group variety, thereby improving health.
The aim of this research is to identify and describe the contribution of food
access strategies to dietary diversity of farm worker households by identifying
their dietary diversity level and its contribution to household food security. A
cross-sectional research design was used to collect data from all the adult
women (18-65 years) (N=21) responsible for the food in a complete community of
farm worker households on a farm (Oranje farm) in the Free-State province of
South Africa. A structured questionnaire was used to gather data on
demographics, food access strategies with special reference to food production,
purchasing, bartering, gathering and payment in kind, as well as dietary diversity.
The two most common food accessing strategies used were purchasing (general
dealers) and gathering (wild leaves, hunting, and fishing). Most people depended
on own food production (86%) such as the cultivation of vegetables (spinach,
green beans, pumpkin, turnip, tomatoes, cabbage) and fruit (apricots, peaches).
Food bartering is seldom practiced (19%) due to customs and lack of knowledge.
Food received as payment in kind (maize meal) was common (76%). The choice
method of food access was buying (76%), gathering (19%) and producing (4%).
People seldom ate outside their own home (76%), except children receiving food
at school from the school feeding scheme (90%). Dietary diversity was limited for
cereals consisting mainly of maize meal porridge, bread, vegetables such as wild
leafy vegetables, tomatoes, onions, and potatoes, fruit (apples), unpasteurised
milk, protein (eggs, chicken) and other (tea, sugar, oil, curry powder).
The mean for the food variety score of the 109 food items per day varied from
23.0 to 27.9 between five seasons which relates to three to four different food

v
items per day. Food variety score were thus lower in all the seasons when
considering nutritious food. The food group diversity score was also calculated
over nine nutritious food groups used over seven days. The food group diversity
scores was high in almost all the seasons. The mean food group diversity score
of the nine food groups varied from 7.9 to 8.8 between five seasons which relates
to one and almost two food groups per day. Although most food groups were
consumed in seven days, resulting in “high” dietary diversity, the numbers of food
items (individual food variety) eaten within the various food groups was low. This
study showed that it was possible to predict household food security of
household members by simply calculating the food variety score and food group
diversity score of a household as an indication of dietary diversity. The result
revealed which households was food secure on insecure, and provided an overall
picture of the dietary diversity of the whole community.
Overall this results indicated that limited food access strategies were utilized or
that many of the strategies were not used optimally, resulting in limited dietary
diversity, ultimately affecting the household food security status of farm worker
households. This information can be used to formulate strategies and develop
interventions to increase the number of food access strategies utilized and to
food improve utilization thereof in order to improve dietary diversity and
household security.
Key words: household food security, dietary diversity, food variety, food group,
food access, commercial farm

vi
Table of Contents
ACKNOWLEDGEMENTS ............................................................................................... i ABSTRACT ................................................................................................................... iii LIST OF TABLES........................................................................................................... x LIST OF FIGURES ....................................................................................................... xii LIST OF ADDENDA .....................................................................................................xiv CHAPTER 1 - GENERAL ORIENTATION OF THE STUDY .......................................... 1 1.1 INTRODUCTION.................................................................................................... 1 1.1.1 Access to food.................................................................................................. 3 1.2 BACKGROUND TO THE INVESTIGATION ........................................................... 4 1.3 MOTIVATION FOR THE STUDY ........................................................................... 5 1.4 LAYOUT OF THE STUDY...................................................................................... 7 CHAPTER 2 - LITERATURE REVIEW AND THEORETICAL FRAMEWORK............... 9 2.1 INTRODUCTION.................................................................................................... 9 2.2 THE UNICEF CONCEPTUAL FRAMEWORK OF MALNUTRITION .................... 11 2.2.1 Basic causes at societal level......................................................................... 12 2.2.2 Underlying causes at household/family level.................................................. 14 2.2.2.1 Household food security .......................................................................... 15 2.2.2.2 Maternal and childcare practices ............................................................. 19 2.2.2.3 Poor water/sanitation & inadequate health services & environments ...... 20 2.2.3 Immediate causes .......................................................................................... 20 2.2.3.1 Inadequate dietary intake......................................................................... 21 2.2.3.2 Illnesses................................................................................................... 22 2.2.3.3 Disease patterns...................................................................................... 22 2.3 FOOD SECURITY................................................................................................ 23 2.3.1 Introduction and definitions ............................................................................ 23 2.3.2 Household food security................................................................................. 25 2.3.3 Dietary diversity.............................................................................................. 27 2.3.4 Association of dietary diversity and nutrient adequacy................................... 28

vii
2.3.5 Association of dietary diversity and nutritional status ..................................... 31 2.3.6 Association of dietary diversity and nutrient density....................................... 31 2.3.7 The effect of food accessing strategies on dietary diversity ........................... 32 2.3.8 The effect of micronutrients to dietary diversity .............................................. 34 CHAPTER 3 - RESEARCH METHODOLOGY............................................................. 36 3.1 RESEARCH DESIGN........................................................................................... 36 3.2 RESEARCH PROBLEM ....................................................................................... 36 3.2.1 Sub problems................................................................................................. 37 3.2.2 Conceptualisation........................................................................................... 38 3.2.2.1 Definitions of components in the conceptual framework.......................... 39 3.3 OPERASIONALISATION ..................................................................................... 40 3.3.1 Biographic information ................................................................................... 40 3.3.2 Anthropometric measurement ........................................................................ 41 3.3.3 Dietary diversity.............................................................................................. 41 3.3.3.1 Food variety ............................................................................................. 42 3.3.3.2 Food group diversity ................................................................................ 42 3.4 POPULATION AND SAMPLING .......................................................................... 42 3.5 PROCEDURE AND DATA COLLECTION METHODS......................................... 43 3.5.1 Procedure....................................................................................................... 43 3.5.2 Data collection techniques ............................................................................. 43 3.6 DATA ANALYSIS ................................................................................................. 45 3.7 THE QUALITY OF THE RESEARCH................................................................... 46 3.7.1 Validity............................................................................................................ 46 3.7.1.1 Theoretical and content validity ............................................................... 46 3.7.1.2 Measurement / construct validity ............................................................. 47 3.7.1.3 Internal validity and transferability............................................................ 47 3.7.1.4 Inferential validity ..................................................................................... 47 3.7.2 Reliability........................................................................................................ 47 CHAPTER 4 – RESULTS & DISCUSSION .................................................................. 48 4.1 DESCRIPTION OF ORANJE FARM .................................................................... 48 4.1.1 Available food found in the spaza shop on the farm....................................... 49 4.1.2 Environment of the farm worker village .......................................................... 50 4.2 RESEARCH RESULTS ........................................................................................ 52 4.2.1 Biographic Information ................................................................................... 53 4.2.2 Anthropometric measurement ........................................................................ 57 4.2.3 Dietary diversity.............................................................................................. 58 4.2.3.1 Food variety and food group diversity ...................................................... 58 4.2.4 Food accessing strategies.............................................................................. 60 4.2.4.1 Food production....................................................................................... 62 4.2.4.2 Food purchasing ...................................................................................... 65 4.2.4.3 Food bartering ......................................................................................... 66 4.2.4.4 Food gathering......................................................................................... 67
viii
4.2.4.4.1 Hunting/fishing................................................................................... 68 4.2.4.5 Payment in kind ....................................................................................... 69 4.2.4.6 Ranking of food accessing strategies ...................................................... 69 4.2.5 Dietary diversity issues .................................................................................. 71 4.2.5.1 Food variety ............................................................................................. 71 4.2.5.1.1 Meal pattern ............................................................................................ 72 4.2.5.1.2 Venues of eating & their frequency of purchasing ............................. 73 4.2.5.1.3 Meal supplies from home .................................................................. 73 4.2.5.2 Common foods accessed through different food accessing
strategies ................................................................................................. 75 4.2.6 Dietary diversity scores .................................................................................. 78 4.2.6.1 Interpretation of dietary diversity data...................................................... 78 4.2.6.2 Dietary diversity from 12 mixed food groups............................................ 82 4.2.6.2.1 Food variety scores – 151 food items................................................ 83 4.2.6.2.2 Food group diversity scores – 12 food groups................................... 85 4.2.6.3 Dietary diversity from nine nutritious food groups .................................... 86 4.2.6.3.1 Food variety scores – 109 food items................................................ 86 4.2.6.3.2 Food group diversity scores – nine food groups................................ 88 4.2.7 Food variety scores from the nine nutritious food groups............................... 89 4.3 DISCUSSION OF RESULTS................................................................................ 96 4.3.1 Biographic information ................................................................................... 97 4.3.1.1 Poor educational status affecting their purchasing .................................. 97 4.3.1.2 Employment status and income level....................................................... 98 4.3.2 Anthropometrics measurement ...................................................................... 98 4.3.3 Dietary Diversity ............................................................................................. 99 4.3.3.1 Food variety and food group diversity .................................................... 100 4.3.4 Food accessing strategies............................................................................ 102 4.3.4.1 Food production strategy ....................................................................... 103 4.3.4.2 Food purchasing strategy ...................................................................... 104 4.3.4.3 Food bartering strategy.......................................................................... 105 4.3.4.4 Food gathering strategy ........................................................................ 106 4.3.4.5 Payment in kind strategy........................................................................ 108 4.3.4.6 Ranking of food accessing strategies .................................................... 109 4.3.5 Dietary diversity issues ................................................................................ 110 4.3.5.1 Food variety ........................................................................................... 110 4.3.5.1.1 Meal frequency................................................................................ 110 4.3.5.1.2 Venues of eating.............................................................................. 110 4.3.5.1.3 Meal supplies from home ................................................................ 111 4.3.5.2 Common foods accessed through different food accessing
strategies ............................................................................................... 112 4.3.6 Dietary diversity scores ................................................................................ 115 CHAPTER 5 - CONCLUSION .................................................................................... 118 5.1 SUMMARY ......................................................................................................... 118 5.1.1 Motivation of the study ................................................................................. 119

ix
5.1.2 Results ......................................................................................................... 120 5.2 FINAL CONCLUSION ........................................................................................ 123 5.2.1 Food accessing strategies............................................................................ 123 5.2.2 Dietary Diversity ........................................................................................... 125 5.3 RECOMMENDATIONS ...................................................................................... 127 5.3.1 Recommendations from this research study ................................................ 127 5.3.2 Recommendations for future research ......................................................... 130 5.4 LIMITATIONS OF THE STUDY.......................................................................... 132 REFERENCES ........................................................................................................... 133

x
List of Tables
TABLE 4.1: AGE, MARITAL STATUS AND LEVEL OF EDUCATION .................... 53
TABLE 4.2: EMPLOYMENT STATUS AND INCOME LEVEL.................................. 54
TABLE 4.3: SOURCES OF INCOME........................................................................ 55
TABLE 4.4: COMPOSITIONS OF FARM WORKER HOUSEHOLDS
AND EMPLOYMENT STATUS OF MEMBERS .................................... 56
TABLE 4.5: BMI’s OF THE WOMEN IN FARM WORKER
HOUSEHOLDS ..................................................................................... 57
TABLE 4.6: VARIETIES OF FOODS ACCESSED FROM VARIOUS
FOOD GROUPS THROUGH DIFFERENT FOOD
STRATEGIES........................................................................................ 59
TABLE 4.7: FOOD ACCESSING STRATEGIES USED ON ORANJE
FARM .................................................................................................... 60
TABLE 4.8: FOOD TYPES ACCESSED THROUGH DIFFERENT FOOD
ACCESSING STRATEGIES.................................................................. 62
TABLE 4.9: THE DIFFERENT TYPES OF VEGETABLES AND FRUITS
PRODUCED BY SEASON .................................................................... 64
TABLE 4.10 SOURCE AND FREQUENCY OF FOOD PURCHASING..................... 66
TABLE 4.11: DIFFERENT TYPES OF WILD LEAVES GATHERED IN
THE VELDT PER SEASON .................................................................. 67
TABLE 4.12: FIRST CHOICE METHODS TO ACCESS FOOD IN THE
HOUSE.................................................................................................. 70
TABLE 4.13: SECOND CHOICE METHODS TO ACCESS FOOD IN THE
HOUSE.................................................................................................. 70

xi
TABLE 4.14: THIRD CHOICE METHODS FOR ACCESSING FOOD IN
THE HOUSE.......................................................................................... 71
TABLE 4.15: MEAL FREQUENCY OF FARM WORKER HOUSEHOLDS ................ 72
TABLE 4.16: VENUES OF EATING AND FREQUENCY OF
PURCHASING OF FARM WORKER HOUSEHOLDS.......................... 73
TABLE 4.17: LUNCH BOX OF EACH INDIVIDUAL IN A FAMILY ............................ 74
TABLE 4.18: MOST COMMON FOODS CONSUMED DURING EARLY
SUMMER, SUMMER, AUTUMN, WINTER, AND SPRING
ON ORANJE FARM ............................................................................. 76
TABLE 4.19: CURRENT MENU OF LOW-INCOME HOUSEHOLD
MEMBERS ON ORANJE FARM (LOW VARIETY)............................... 80
TABLE 4.20: TYPICAL MENU CONSUMED BY HOUSEHOLD
MEMBERS ON ORANJE FARM (MEDIUM VARIETY) ........................ 81
TABLE 4.21: NORMAL RECOMMENDED MENU CONSUMED BY AN
INDIVIDUAL PERSON (HIGH VARIETY) ............................................. 82
TABLE 4.22: FOOD VARIETY SCORES -151 FOOD ITEMS (N=20) ........................ 83
TABLE 4.23: FOOD GROUP DIVERSITY SCORES – 12 FOOD GROUPS
(N=20).................................................................................................... 85
TABLE 4.24: FOOD VARIETY SCORE – 109 NUTRITIOUS FOOD ITEMS
(N=20).................................................................................................... 87
TABLE 4.25: FOOD GROUP DIVERSITY SCORE - NINE NUTRITIOUS
FOOD GROUPS (N=20)........................................................................ 89
TABLE 4.26: FOOD VARIETY SCORES – GROUP ONE TO THREE....................... 91
TABLE 4.27: FOOD VARIETY SCORES (CONTINUED) – GROUP FOUR
TO SIX................................................................................................... 92
TABLE 4.28: FOOD VARIETY SCORES (CONTINUED) – GROUP
SEVEN TO NINE................................................................................... 93
TABLE 4.29: CORRELATION OF BODY MASS INDEX AND DIETARY
DIVERSITY PER SEASON ................................................................... 96
TABLE 5.1: SUMMARY OF LEVELS OF UTILIZATION OF FOOD
ACCESSING STRATEGIES IN THE SEASONS ................................ 129

xii
List of Figures
FIGURE 2.1: UNICEF CONCEPTUAL FRAMEWORK OF
MALNUTRITION (Bellamy, 1998:24) ................................................... 10
FIGURE 2.2: INADEQUATE DIETARY INTAKE / DISEASE CYCLE
(Bellamy, 1998: 25) .............................................................................. 21
FIGURE 3.1: THEORETICAL AND CONCEPTUAL FRAMEWORKS
HIGHLIGHTING THE RELATIONSHIP BETWEEN FOOD
ACCESS, FOOD SUPPLY AND DIETARY DIVERSITY....................... 38
FIGURE 3.2: INTERVIEWS AND DATA COLLECTION IN CONNECTION
WITH DIETARY DIVERSITY................................................................. 44
FIGURE 4.1: ORANJE FARM SURROUNDINGS ...................................................... 48
FIGURE 4.2: THE GUEST HOUSE SITUATED ON ORANJE FARM ........................ 49
FIGURE 4.3: THE SPAZA SHOP FOUND ON ORANJE FARM ................................ 50
FIGURE 4.4: WATER SOURCE AND HOUSING AREAS ......................................... 50
FIGURE 4.5: A WOMAN CARRYING WATER FROM THE WATER
SOURCE ............................................................................................... 51
FIGURE 4.6: THE PRIMARY SCHOOL SITUATED ON ORANJE FARM ................. 51
FIGURE 4.7: THE HIGH SCHOOL SITUATED ON ORANJE FARM......................... 52
FIGURE 4.8: BACK ROAD LEADING TO HIGH SCHOOL........................................ 52
FIGURE 4.9: WOMAN BEING WEIGHED.................................................................. 57
FIGURE 4.10: LENETA’S GARDEN ............................................................................ 65
FIGURE 4.11: TRADITIONAL WILD VEGETABLES ................................................... 68

xiii
FIGURE 4.12: DRIED FRESH WATER FISH ............................................................... 69
FIGURE 4.13: SUPPLEMENTS FROM THE SCHOOL FEEDING SCHEME............. 112
FIGURE 5.1: MINDMAP OF THE DIETARY DIVERSITY ISSUES........................... 128
FIGURE 5.2: TEACHING THE COMMUNITY ABOUT VITAMIN A ......................... 132

xiv
List of Addenda
ADDENDUM A: DIETARY DIVERSITY QUESTIONNAIRE....................................... 144
ADDENDUM B: LIST OF FOODS AND FOOD GROUPS DIVERSITY NON
NUTRITIOUS AND NUTRITIOUS FOOD ITEMS............................. 157
ADDENDUM C: LIST OF FOODS AND FOOD GROUPS DIVERSITY
NUTRITIOUS FOOD ITEMS ............................................................ 164

1
Chapter 1
GENERAL ORIENTATION GENERAL ORIENTATION GENERAL ORIENTATION GENERAL ORIENTATION OF THE STUDYOF THE STUDYOF THE STUDYOF THE STUDY
1.1 INTRODUCTION
Household food insecurity exists whenever the availability of nutritionally
adequate and safe foods or the ability to acquire acceptable foods in socially
acceptable ways is limited or uncertain (Derrickson, Sakai & Anderson, 2001:
155). The concept “household food security” refers to a household’s ability to
access (procure or produce) adequate food at all times for all members in the
household (Kennedy & Haddad, 1992:3; Bellamy, 1998: 23; Sayed, 2002:3).
Understanding household food insecurity and knowing its consequences is an
essential and important step in determining effective interventions. The
measurements of household food insecurity is essential for planning, targeting,
monitoring and evaluating interventions, but existing measures often are
inadequate (Budlender, 1993:2).
Household food security is therefore an important dimension of the health of
individuals within a household. There are three distinct variables essential to the
attainment of food security, which are food availability, food utilisation and food
access. This research study will be focusing on the food accessing strategies in
addressing household food security. Food access refers to individuals having
2
adequate incomes or other resources to purchase or barter to obtain levels of
appropriate food needed to maintain consumption of an adequate diet (Latham in
Sayed, 2002:7). The inability of households to access enough food for a
sustainable and healthy life is an important indicator of the level of poverty that
may be present in food insecure households. Appropriate measurement for
household food access is useful to:
♦ identify the food insecurity,
♦ assess the severity of the food shortfall,
♦ characterize the nature of the food insecurity (seasonal versus chronic),
♦ monitor changes over time,
♦ assess the impact of intervention (Hoddinott & Yohannes, 2002:1).
A recent Food and Nutrition Technical Assistance (FANTA) project has shown
that dietary diversity is a good indicator of the access dimensions of household
food security in a variety of settings, including poor and middle-income countries,
rural and urban areas, as well as across seasons. Dietary diversity is defined as
the number of individual foods or food groups consumed over a given period
(Hoddinott & Yohannes, 2002:1). The inability of households to access enough
food for a sustainable and healthy life is an important indicator of the level of
poverty that may be present in food insecure households.
In Southern Africa, food insecurity, hunger and malnutrition are closely linked
with poverty. The prevalence of poverty varies substantially across countries
ranging from 15% in Botswana to 85% in Zambia (Babu & Qian, 1996 in Lado,
2001: 144). Generally, poverty is a rural phenomenon in Southern Africa and
more than 75% of the poor are rural people who obtain their livelihoods from
agricultural or non-farming activities (Lado, 2001:144). In a study in the
Hammanskraal area, mothers were perceived as being food insecure (57), with
children’s hunger being the highest (60) and household hunger (46) the lowest
(Kruger, 1999:144).

3
The need to focus on both national and household food security levels is
important in the promotion of food security in a broad context. While South Africa
is food secure at the national level, household food insecurity still exists in South
Africa, especially in rural areas. Once food security is met at the national level, a
person cannot assume that all individuals and households will automatically also
experience food security. A country may be food secure to such an extent that it
exports food to other countries while some of its own citizens are suffering from
hunger and malnutrition (Kgaphola & Boshoff, 2002: 65).
1.1.1 Access to food
Access to food depends on an adequate, stable, local food supply. This is
influenced by many interacting factors, which play a role in determining the extent
of food security. The most frequently cited factors include:
♦ access to land,
♦ livestock ownership,
♦ food garden availability,
♦ safe, accessible water supply,
♦ stable climate conditions,
♦ access to food shops,
♦ access to alternative food supplies e.g. school feeding,
♦ cash (income) to buy food(Steyn, Labadarios & Huskisson, 1999:31).
Access to food is closely related to poverty and economic growth: the poor
usually do not have adequate means to gain access to food in the required
quantities (Lado, 2001:142). Lack of access to food is a major contributor to
malnutrition, which has an effect in a person‘s life. It is self evident that poverty
and malnutrition are well linked, but the mechanisms through which this
relationship is likely to operate, need to be considered.

4
1.2 BACKGROUND TO THE INVESTIGATION
The research problem for this study, formed part of a larger project that
developed a food based model to improve household food security on
commercial farms in South Africa”. Various post graduate students from the
Department of Consumer Science of the University of Pretoria (UP) were
involved. This project was completed and documented with the support of the
Center of Nutrition, UP. The research problem of the larger focus project (Green,
2004:7) was formulated in question format as follows: How can household food
security on commercial farms be improved through the implementation and
evaluation of community- based nutrition programs and other supplementary
interventions?
To fulfil the particular aim of addressing the food access component of household
food security on commercial farms in South Africa, baseline data from a selected
community have been obtained and analyzed specifically with the intention to
identify needs and problems concerning household food security that may
precipitate in rural communities. Identified nutritional needs and nutrition/food
related problems were used from the national food consumption survey to focus
on the design and implementation of related food-based programs. Evaluative
research was conducted in the larger project in terms of process and
outcome/impact, to construct a generic model or guideline. This model will be of
significant to understand the relevant factors that should be considered to
address aspects or components of household food insecurity in order to
contribute to the improvement of health. It will further be used as a baseline to
design effective and sustainable interventions on commercial farms in South
Africa (Green, 2004:7).
This research study was undertaken as one of the few in South Africa that
established a tool for measuring dietary diversity as a simple measurement of the
household food security status in communities. Additionally, the association
5
between food variety, food group diversity and weight status was also
considered. The researcher was involved in the initial stages of establishing a
dietary diversity tool, suitable in the South African context, to determine dietary
diversity in these communities. The sample was taken from the community of
farm worker households living on a farm situated in the Fouriesburg district in the
Free State province in South Africa (SA).
1.3 MOTIVATION FOR THE STUDY
The interest in this type of study was further stimulated when the researcher
observed the people in this community while working as a fieldworker for the
larger project on the same farm. Lack of dietary diversity was obviously a
problem, because their diets were dominated by starchy food intake (mainly from
maize meal porridge provided by the farmer as part of payment). Infrequent
protein consumption was observed as little or no animal products (mainly
chickens available) were consumed. Few fruits and vegetables were consumed,
depending on seasons and availability. Most of the adult women in the
community were unemployed, therefore contributing to poverty and poorly
diversified diets.
The researcher observed that there were many people who just eat what is
available at the time. The people living in this community lacked knowledge about
food and nutrition, and were generally ignorant regarding the value of food in
their lives. In the South African context, food accessing refers to obtaining food
for all members of a household at all times. This can be attained; through own
production of food for consumption, exchange of food between households, or
through purchasing of food within a household or a combination (Food Security
Working Group, 1997:4). Household food security includes the availability,
accessibility and utilization of food in a household (Food Security Working Group,
1997:4). Both definitions emphasize the importance of household food
6
accessibility through a number of food accessing strategies. The household is
regarded as a system that is responsible for food accessing and also for using
the available resources to meet the demands amongst others, such as the food
and nutritional needs of its members. The resources needed and used for
producing, purchasing and utilizing food, originate within the household or from
the environment in which the household functions and with which it interacts
(Kgaphola & Boshoff, 2002:67).
Food security emphasizes permanent access to sufficient food by all people at all
times for an active, productive and healthy life (World Bank, 1988 in Sayed,
2002:2). It is therefore important to develop strategies that will facilitate the
accessibility of food at individual and household levels. In addition, it is important
to know how the different food accessing strategies contribute to the dietary
diversity of a specific community. It is particularly important to understand
whether dietary diversity has an effect on the weight status of the individuals in a
household. This information will help program managers and policy makers to
understand what levels of reductions in malnutrition they can achieve from
poverty alleviation and dietary diversification interventions, and whether they can
expect a synergistic effect between the two approaches. The consumption of
diversified diets has been proven to improve health as well as preventing
malnutrition (Onyango, 2003:61). The researcher was thus motivated to
investigate and describe the food access strategies and subsequent dietary
diversity level resulting from the access strategies utilized by the women in this
farming community to assess their level of household food security and to
provide suggestions to improve the dietary diversity in this community.

7
1.4 LAYOUT OF THE STUDY
This thesis will be introduced by summarising each consecutive chapter.
Chapter 1 explains the general orientation of the study. The theoretical and
conceptual frameworks were specifically taken into consideration highlighting the
relationship between household food security, food access, food supply and
dietary diversity. The background to the investigation of the study has also been
summarised. This was done in order to focus on the originality as well as the
motivation of the researcher of the study.
Chapter 2 focuses on the literature review within a sound theoretical framework.
The literature review focused on household food security as well as dietary
diversity and its associations with nutrient adequacy, nutritional status, nutrient
density and the effects of food accessing strategies. The UNICEF Conceptual
framework (Kavishe 1995:370) was used as a theoretical framework for this
study. This model illustrated the important factors affecting the nutritional status
of adult women and children in a community and how these are linked to
household food security and subsequently food accessing strategies and their
impact.
Chapter 3 focuses on the research methodology used in the study. The problem
statement and sub-problems are addressed. A conceptual model illustrating all
the relevant concepts was designed and conceptualised thoroughly to define all
the important concepts in the model used. The study population, and sample,
data collection methods, procedures and analysis are discussed
Chapter 4 focuses on presentation of the data, which is done through the use of
tables. Findings and trends that emerged are presented. This chapter focuses on
the discussion of major findings. Results presented are discussed in relation to
the literature review and other related factors.

8
Chapter 5 focuses on the conclusion of the study. It also presents the study’s
recommendations and limitations of the study.

9
Chapter 2
LITERATURE REVIEW ANLITERATURE REVIEW ANLITERATURE REVIEW ANLITERATURE REVIEW AND THEORETICAL FRAMEWD THEORETICAL FRAMEWD THEORETICAL FRAMEWD THEORETICAL FRAMEWORKORKORKORK
2.1 INTRODUCTION
The UNICEF Nutrition Strategy aims to empower families, communities and
governments to improve the nutrition of women and children on the basis of
adequate and sound analysis (See Figure 2.1). The two most important elements
in this strategy, are the processes of assessment, analysis and action (the
“Triple–A” approach) and a conceptual framework for the analysis of the
determinants of malnutrition in a specific context (Engle, Lhotska & Armstrong,
1997:4).
The immediate determinants of good nutrition and survival are adequate dietary
intake and health. These are determined by underlying conditions that affect
household food security, health services, and the care of women and children.
Food, health, and care are in turn determined by the basic determinants of
political, ideological, historical and economic structures (Engle et al, 1997:4).

10
FIGURE 2.1: UNICEF CONCEPTUAL FRAMEWORK OF MALNUTRITION
(Bellamy, 1998:24)

11
2.2 THE UNICEF CONCEPTUAL FRAMEWORK OF MALNUTRITION
The theoreticall framework for this research study is based on a part of the
nutrition strategy approach consisting of a conceptual framework and the triple-A
cycle process of assessment, analysis and action (Kavishe, 1995: 370). To solve
problems, causes must be discovered! Before community nutrition problems, like
chronic malnutrition, can be alleviated or solved, it must be ascertained which
factors in the community are causing or contributing to the nutrition problem
(Terry in Kruger, 1999:19). According to Naidoo, Padayachee and Verburgh
(1993: 20) there is a universal awareness that under nutrition is largely the result
of poverty, which arises from:
♦ underemployment or unemployment,
♦ the pressure of a growing population.
♦ low productivity of agriculture,
♦ uneven distribution of income and consumption,
♦ poor environment sanitation,
♦ Illiteracy, and/ or
♦ cultural deprivation.
Nutrition problems found among groups are usually determined not by one factor
only, but by a variety of interrelated factors that play a role in influencing the
nutritional status of the individual, (in this case the women) negatively. Actual
food behaviour is the result of the synergistic relationship among ecological,
socio-cultural, economic and political environments. Multiple and interrelated
determinants are involved in the development of malnutrition, and a similar series
of approaches (multifaceted and multisectoral) are needed to deal with it (See
Figure 2.1). The model illustrates the important factors that affect the nutritional
status of adult women and children in a community, ultimately leading to
malnutrition, disability and/or death on the negative side, and survival, growth
and development on the positive side (Bellamy, 1998:24). This model explains all
the health and welfare of communities.

12
2.2.1 Basic causes at societal level
Basic causes of malnutrition relate to the allocation of and control over resources
in the society, and thus to the structural causes of poverty and inequality. The
depth and distribution of poverty in South Africa is a stark reminder of the ways in
which economic and social policies under the “apartheid” system combined to
disadvantage African people. Policy measures to improve poor people’s access
to productive resources, incomes, and opportunities to enhance their capabilities,
are central to the eradication of malnutrition (Mclachlan & Kuzwayo, 1997: 25).
The achievement of the abovementioned necessary condition for nutritional
security – food, health, care and information – requires human, economic and
organizational resources. Most underlying causes are the result of unequal
distribution of resources in society. Causes at this level are basic or structural
causes ((INP, 1997: 3.1-4).
The availability and control of resources strongly influence the final nutritional
outcome. Resources and their control, at various levels of society, is the result of
social, economic, political and cultural factors (INP, 1997: 3.1-4)
Social factors include aspects such as existing poverty relations, the division of
labor, and power structures. Political factors primarily reflect the structure and
function of the state and include income/tax policies, price and subsidization
policies, the legal system, and the role and power of national institutions. External
economic dependency and economic restructuring programmes, together with
maldistribution of productive assets, particularly land, are common basic
economic causes. Ideological factors cover even broader aspects of society such
as religion, culture, tradition and beliefs (INP, 1997: 3.1-4).
The following care resources include the major activities performed on a day to
day basis and are affecting the nutrition of women and their families:

13
♦ Potential resources
Food production practices and the environment
Most rural communities still depend on subsistence farming and they do not
produce a variety of foods. Maize is the most produced food in our (SA)
communities (Engle et al, 1997: 24).
Food storage
After harvesting, food storage facilities are either not available or inadequate.
The unhygienic food storage methods e.g. food stored at room temperature,
uncovered, as well as insects and rodents coming into contact with foods
There are no food processing plants and a lot of food is wasted through
spoilage. Women are responsible for farming and they have other
responsibilities too in the family (Engle et al, 1997: 24). It is therefore clear
that lack of resources have an effect in lowering the dietary diversity of some
communities.
Food purchasing
Due to lack of nutrition knowledge, people may buy non-nutritious foods or
food with low nutritious value. Due to a lack of income people may only buy
staple foods such as maize meal, resulting in undiversified diets (Engle et al,
1997: 24).
Food preparation
More time is spent in preparation and cooking, and the effort and skill
involved in these activities affect the nutrition. This can be reduced by
improving cooking resources (e.g. providing fuel-efficient stoves) or by
encouraging other family members to share the work. (Engle et al, 1997: 24).
In addition by changing the use of incorrect cooking methods and
overcooking and destroying nutrients in food, or discarding excess water
after cooking vegetables.

14
♦ Economical resources
Low incomes are mainly due to a lack of education, and it affects the
purchasing power of communities. Most underprivileged societies have large
families and low incomes. Low incomes and household food insecurity are
directly related (Engle et al, 1997: 30).
♦ Political resources
The policies from the state government on employment, prices, incomes,
subsidies, health education, and agriculture and the legal system, can
influence the resources for care. For example, since women education plays
an important role in child nutrition, support for a girl education as well as adult
education can improve human resource and decreasing the incidences of
malnutrition (Engle et al, 1997:33).
Cultural food beliefs
Cultural factors include habits, beliefs, preferences, customs and ideas that
legitimize actions in society. Malnutrition is likely to increase when these
when these factors do not support care for women. (Engle et al, 1997:34).
2.2.2 Underlying causes at household/family level
Three clusters of underlying causes lead to inadequate dietary intakes and
infectious disease. These include inadequate access to food in a household;
insufficient health services and unhealthful environments; and inadequate care
for children and women (Bellamy, 1998: 23). These causes relate to a failure to
meet the basic needs of children and women. Food, health, and care are all
necessary, but not sufficient conditions for good nutrition outcomes. Adequate
care alone will not result in optimal health and nutrition for women and children.
All three elements must be satisfactory for good nutrition (Engle et al, 1997:4).

15
2.2.2.1 Household food security
Household food security is defined as sustainable access to safe food of
sufficient quality and quantity including energy, protein and micronutrients, to
ensure an adequate intake and a healthy life for all members of the family
(Bellamy, 1998:23). In rural areas, household food security may depend on
access to land and other agricultural resources to guarantee sufficient domestic
production. In urban areas a range of foods is available at accessible prices to
ensure food security.
In order to achieve food security, both at national level and in the household, it is
necessary to ensure that there is a safe and nutritionally adequate food supply
from one year to the next and also during the year. It is also important to
encourage the equal distribution of food within the household among all its
members. If the household is food insecure it may be from a lack of production,
inadequate purchasing power, inadequate supply of food, inadequate storage,
and poor food hygiene. The World Food Summit Plan in 1995 describes food
security as the situation where all people, at all times, have physical and
economic access to sufficient food to meet their dietary needs & preferences for
an active and healthy life (Food & Agricultural Organization of the United Nations,
1998: ix).
The majority of people in South Africa depend on purchasing food to ensure
household food security. With the rising food prices and high cost of transport,
poverty has contributed toward food insecurity. In a recent survey of health
inequalities in South Africa, hunger was used as an indicator of the health impact
of poverty. According to the study, perceptions of hunger are closely associated
with low incomes, with 88% of households reporting that members often went
hungry, falling below the minimum living level. Urban provinces, such as Gauteng
and Western Cape, had comparatively lower levels of “hunger” than rural
provinces (Mclachlan & Kuzwayo, 1997:23). This clearly indicates that low

16
incomes especially in rural areas affects the utilisation /eating patterns thereby
affecting the dietary diversity of some communities.
2.2.2.2 Maternal and childcare practices
Children can still become malnourished even when there is adequate food in the
house, and a family lives in a safe and healthful environment, and has access to
health care services. Care is manifested in the ways a child is fed, nurtured,
taught and guided. Nutritionally, care encompasses all the measures and
behaviours that translate available food and health resources into good child
growth and development (Bellamy, 1998:27).
Nutrition during pregnancy is one of the most important factors in determining the
course and outcome of pregnancy for both mother and infant. A good diet that
provides adequate amounts of kilojoules and essential nutrients are necessary
for the support of the maternal body tissues and the growth and development of
the foetus (Obert, 1986:49).
The quality of healthy women‘s diets during pregnancy and lactation is very
important for themselves and their children. Children born to anaemic mothers
are often stunted and ill. Children born to iodine deficient mothers may be
apathetic, retarded, or have congenital abnormalities. Poorly nourished mothers
have higher rates of miscarriages, stillbirths, and maternal mortality. The
mother’s vitamin A status directly affects the infant’s intake through breast-milk
consumption, and affects the child’s resistance to diseases such as measles
(Engle et al, 1997:12).
Women need to have adequate dietary intakes of vitamin A during pregnancy
and lactation to ensure optimal vitamin A status in the young infant. Although
family food may be limited, families can care for women by making sure that they
receive an extra amount of family food. Families also need to be aware of the

17
possible negative impact of beliefs about food restrictions on women’s diets
during this period. The health and nutritional status of the pregnant and lactating
mother are critical for the outcome of pregnancy and subsequently for children’s
growth and development. Pregnancy, childbirth, and lactation are demanding on
women’s health and therefore a family should give them support and care during
this time. Even small changes by the family can influence birth outcomes (Engle
et al, 1997:13).
Children may still become malnourished due to the limited quantity and poor
quality of food (in terms of energy and nutrient density). This is particularly the
case during weaning (between the ages of 4 & 18 months) when small children
are especially susceptible to Protein Energy Malnutrition brought on by
insufficient breastfeeding or inadequate supplementary feeding. This might also
be due to lack of dietary knowledge or the fact that parents have too little time
available to prepare food for their children (Engle et al, 1997:11).
The feeding situation may also influence the food intake of young children. Some
children are fed on a regular basis each day, sitting in a prescribed place with
food easily accessible, whereas other children are fed while wandering around,
or at a time that the caregiver finds convenient (Guldan et al in Engle, Bentley &
Pelto, 2000: 27). These practices translate food security and health into a child’s
well being (Engle et al, 2000: 27).
Care practices also differ very much according to the age of the child, or the
child’s developmental period. The prenatal period and the first three years of life
(0-2) are the most important for growth and development. Mortality is highest
during the first year of life. In the first six months of life, malnutrition tends to be
less common if the mother is exclusively breastfeeding. During this period, the
most important care practices are centered on the lactating women and her
breastfeeding (Engle et al, 1997:11).
18
Care that is appropriate at one age may not be appropriate at another age. For
example, regular mealtimes are probably helpful in the second or third years of
life but scheduled times for breastfeeds in the first year usually lessen intake or
shorten breastfeeding durations. Active spooning of food is appropriate for a
seven -month-old but inappropriate for a normal two-year old who wants to feed
himself (Engle et al, 1997:11).
These care practices and resources for care are not only important for children’s
good nutritional status, but also for their growth and development. They also had
been recognized as building blocks of Early Childhood Care for Survival, Growth
and Development, UNICEF’s integrated approach to young children (Engle et al,
2000: 27). Different aspects of care necessary for good growth and development
links with household food security and can be determined such as care for
women, breastfeeding hygiene practices, home health practices and psycho-
social care.
Education and information
An important cause of poverty, disease and malnutrition is inadequate
educational services. Limited and sub-standard education greatly reduces life
chances. Low educational levels among women correlate strongly with the
incidence of malnutrition among children. This is because poor education not
only limits the chances of women being able to acquire wage employment or
improved productive skills – both of which will generate resources for improved
nutrition, but it also limits their knowledge of the nutritional and hygienic needs of
a healthy family (Engle et al, 1997:29).
Lack of freedom and mobility, and excessive workload often limits their access to
education both as children, and as adults. Education is one of the most important
investments that can be made in children’s growth and development. Mothers
with more education have better nourished children. More educated mothers may
be more assertive and make better use of health services, provide better child

19
care such as feeding, have more hygienic household practices and personal
habits. They have an increased knowledge of appropriate child rearing, or have
higher status in the family and thus more control of family resources (Engle et al,
1997:14).
2.2.2.3 Poor water/sanitation & inadequate health services &
environments
Access to curative and preventative health services that are affordable and of
good quality, play the most important role in a person’s good health and
nutritional status (Bellamy, 1998:25). Without these services people are at a high
risk of contracting diseases. Availability of health services, sanitation systems
and clean water, but most importantly, immunization against childhood diseases,
reduces the risk of malnutrition.
In terms of environmental health, the lack of access to a safe water supply,
proper sanitation practices, and the unhygienic handling of food, have significant
implications on the spread of infectious diseases. These are also the most
common causes of childhood diarrhoea. If the environment is unhealthy and
littered with animal and human wastes, young children are also more prone to
infection by intestinal parasites, thereby contributing to poor growth and
malnutrition. People who are usually responsible for fetching water for domestic
use are the women and children in a household. This is a very hard task that
drains considerable time and energy, depending on the distance to the water
source (Bellamy, 1998: 27).
Rural people have limited access to water and sanitation, proper housing and
energy. A quarter of rural African households state that available water is
insufficient to their needs, and a third has to walk more than 500m to the water
source. In general, households using water from unprotected sources use less
water on a per capita basis (Mclachlan & Kuzwayo, 1997: 21).
20
In respect of communal water supplies schemes in certain areas in South Africa,
soak-away facilities have not been installed, which have the potential for
elevating the transmission of disease associated with pools of stagnant water.
Those who use water are not always educated in the safe handling, storage and
disposal of water, despite evidence from several quarters of rapid deterioration of
water quality between the supply point and end use (Genthe et al, 1997, Thomas
et al, 1999 in Thomas, Seager & Mathee: 2002:5).
The South African Constitution, adopted in 1996, contains within it a Bill of
Rights, including specific mention of health and environmental rights. The Bill of
Rights states that ’… everyone has the right to an environment that is not harmful
to their health or well being, and to have the environment protected’. This is not a
true case because in terms of industrial pollution, poorly managed industrial
processes have led, for example, to increased exposure to asbestos in a number
of South African asbestos mining towns. This is associated with increased
incidence of asbestos-related diseases such as TB and asbestosis (Mathee,
2000b in Thomas et al., 2002: 3). The use of solid, and to a lesser extent, liquid
fuels, indoors has been shown to contribute to elevated levels of indoor air
pollution and respiratory ill health (Thomas et al, 2002: 3).
2.2.3 Immediate causes
The model clearly addresses the most significant immediate determinants of
malnutrition that include inadequate dietary intake and disease. Dietary intake
that is inadequate may also include inadequate total energy, protein, vitamin or
mineral intakes, while infectious diseases such as measles, gastro-enteritis and
respiratory infections are mostly linked with malnutrition. Poor nutritional status
reduces immune responses and thus increases susceptibility to infections,
thereby clearly indicating the interaction between dietary inadequacy and
infections. Conversely, the presence of infectious disease reduces dietary intake
through the loss of appetite and impairs nutrient utilization through reduced

21
digestion and absorption (Mclachlan & Kuzwayo. 1997: 6). The immediate
causes of malnutrition are inadequate dietary intake, disease, and psychological
stress together with trauma.
2.2.3.1 Inadequate dietary intake
Inadequate dietary intake and illness (disease) are the most significant
immediate causes of malnutrition and tend to create a vicious circle. Inadequate
dietary intake and infection operate in a vicious cycle that accounts for much of
the high morbidity and mortality seen in developing countries. When children do
not eat enough or well enough, their immune system defenses are lowered,
resulting in greater incidence, severity and duration of disease. Disease speeds
nutrient loss and suppresses appetite – so sick children tend not to eat as they
should and the cycle continues (See Figure 2.2) (Bellamy, 1998: 25).
FIGURE 2.2: INADEQUATE DIETARY INTAKE / DISEASE CYCLE (Bellamy,
1998: 25)
Its application in South Africa shows that anemia is also a significant problem
among children. Twenty percent of children were found to be anemic and 10% to
be iron deficient. Iron deficiency anemia was diagnosed in 5% of young children
Weight loss Growth faltering Immunity lowered Mucosal damage
Disease: - Incidence - Severity - Duration
Inadequate dietary intake
Appetite Loss Nutrient loss Malabsorption Altered metabolism

22
(SAVACG, 1996: 356). The mean intake of iron was also found to be consistently
low in all age groups and all provinces (Labadarios, 1999: 4; Steyn & Labadarios,
1999:242).
2.2.3.2 Illnesses
Malnutrition lowers the body’s ability to resist infection by undermining the
functioning of the main immune response mechanisms. This leads to longer,
more severe and more frequent episodes of illness. Infections cause loss of
appetite, malabsorption and metabolic and behavioral changes. These in turn
increase the body’s requirements for nutrients, which further affects young
children’s eating patterns and how they are cared for (Bellamy, 1998:23).
2.2.3.3 Disease patterns
When the infections become more frequent accompanied by poor health they
predispose children to malnutrition. In rural areas, poor health status of women
and children is clearly shown among poor populations. This can be seen in those
areas where there is inadequate water and sanitation, people living in informal
housing, in families where mothers have no education (INP, 1998: 3.1-2).
The most common infectious diseases in South Africa affecting growth of children
and which may lead to malnutrition are measles, diarrhea, acute respiratory
infections and tuberculosis. In such cases women are the ones taking care of the
children. Infections increase malnutrition due to one of the following reasons:
♦ The child may have a poor appetite
♦ If the child has a fever, the body needs more energy and may use the body’s
stores to provide energy
♦ The child may have diarrhoea and, therefore, nutrients are not absorbed; or
♦ Local beliefs of the appropriate diet for a sick child may lead to inadequate
nutrient intake (INP, 1998: 3.1-2).

23
Also a high prevalence of parasitic infections (round worms, whip worms, tape
worms) have been observed in micro-studies conducted in Mpumalanga,
KwaZulu-Natal and Western Cape (Vorster et al in Mclachlan & Kuzwayo,
1997:21)
An additional cause of poor physical and mental health in children relate to the
poor psychosocial development of children. In S.A as in other countries, which
have experienced sustained periods of social disorder and violence, many
children are severely traumatized through exposure to violence and brutality as
witnesses and victims. Under such circumstances, post-traumatic stress and
other forms of emotional and psychosocial scarring encumber their normal
development as human beings. Such trauma has a direct impact on young
children’s health, dietary intake and consequently increases their vulnerability to
malnutrition and illness (INP, 1998: 3.1-2).
This study will only address issues on the underlying causes pertaining to
insufficient access to food (household food security) as it influences the care
practices of women. Other studies contributing to the larger project will address
other issues of the model. All the information found would be used to conclude or
to make recommendations on household food security in farm worker households
on commercial farms. The consumption of diversified diets in has been proven to
improve health as well as preventing malnutrition (Onyango, 2003:61). This study
will only address issues underlying causes pertaining to insufficient access to
food (household food security) as it influences the care practices of women.
2.3 FOOD SECURITY
2.3.1 Introduction and definitions
Food security is defined (USAIDS, 1992 in Hodinnott & Johannes, 2002:3; World
Bank, 1988 in Sayed, 2002:2) as when all people at all times have both physical

24
and economic access to sufficient food to meet their dietary needs for a
productive and healthy life. Food security is probably too complex to ever be
adequately captured by a single indicator. In brief, measuring household food
security in valid and reliable ways is a major challenge, and the search for good,
cost-effective alternative indicators continues (Maxwell, Ahiadeke, Levin, Armar-
Klemesu, Zakariah & Lamptey, 1999: 412). Three distinct variables are
mentioned as being essential to the attainment of food security; these include the
following:
♦ food availability – refers to sufficient quantities of appropriate, necessary
types of food from domestic production, commercial imports or donors that
are consistently available, within reasonable proximity or within their reach
(USAIDS,1992 in Hoddinot & Johannes, 2002:3;Sayed, 2002: 6),
♦ food access – refers to the individual having adequate income or other
resources to purchase, barter or obtain levels of appropriate food needed to
attain consumption of an adequate diet or to attain an acceptable level of
nutrition (USAIDS,1992 in Hoddinot & Johannes, 2002:3; Latham, 1997 in
Sayed, 2002: 7).
♦ food utilization – refers to food that is properly used; proper food processing
and storage techniques that are employed; adequate nutrition knowledge and
child-care techniques that exist and is applied; and adequate health and
sanitation services that exist (USAIDS,1992 in Hoddinot & Johannes,
2002:3).
Food security of young children depends on power relationships within the
household. Children may be poorly fed if this relationship is unequal. The power
relationships are very dependent on the status of the women in the house. If only
the husbands makes decisions regarding buying of food, the needs of children
may be neglected. (Steyn et al, 1999: 31). Therefore this indicates the important
25
role played by women in a household in terms of nutrition or their dietary
diversity.
2.3.2 Household food security
Household food security refers to a household’s ability to access (procure or
produce) adequate food at all times for all members in the household (Bellamy,
1998:23; Hoddinott, 1999:7; Sayed, 2002:3). There are various other forms of
food security applicable on household level namely:
♦ individual food security – refers to the individual’s ability to access food in a
household (Sayed, 2002:4).
♦ nutrition security – refers to a diet that is adequate not just in terms of
quantity, that is total energy (kilojoules) intake, but also adequate in terms of
the quality and variety, that is protein, vitamin and mineral requirements
(Sayed, 2002: 4). This diet should also meet the specific food and nutrient
needs of the individual (e.g. an infant versus the elderly – each having
different nutritional requirements).
The achievement of nutrition security at the household level involves the
fulfilment of two essential requisites, namely adequacy of food supply at the
overall national level and equitable distribution of food among the population in
accordance with their physiological needs. It is apparently the latter requirement
that has often proven the more difficult to fulfil (Gopalan, 2001:S4).
Nutrition security cannot be achieved by reliance on just one staple food. Diets
exclusively based on rice and wheat will be deficient in a range of micronutrients,
apart from being relatively poor in protein quality. Diversification of household
diets is necessary and a national food production policy should aim at the
achievement of balanced production and availability of a range of basic essential
foods (Gopalan, 2001:S6).
26
Lack of nutrition security is a manifestation of a poverty syndrome, mutually
reinforcing attributes which include illiteracy, poor vocational skills and
consequently poor family income, poor access to food, poor housing and
environmental sanitation, poor access to basic health services and a lack of self-
esteem and consequent poor motivation for individual or collective action for
socio-economic advancement (Gopalan, 2001:S8).
Internationally, research has been conducted on dietary diversity and household
food security amongst a variety of communities (Drewnowski, Henderson, Shore,
Fischler, Prezioski & Hercberg, 1996: 663; Fernandez, Negri, La cchecia &
Franceschi, 2000: 11; Ruel, 2002: 23; Hoddinott & Yohannes, 2002: 4). However,
little data is available in South Africa (Kgaphola & Boschoff, 2002:65;
Kgaphola,2003: 218 ).The concept of household food security is useful in
emphasizing the possible (and likely) unequal distribution of food, as well as
other resources, which allow the household to produce and acquire food, within a
country or community. Food, water and fuel are all resources, which are essential
for household security, and all involve activities in which women play a
predominant role (Budlender, 1993: 2).
Various researchers have investigated links between food variety, improved
health and nutritional status (Onyango et al, 1998:484; Hatloy, Hallund, Diara &
Oshaugh, 2000:57; Oyango, 2003:1). Several researchers have also investigated
the relationship between dietary diversity and the causes of mortality, or the
protective function of diversified intakes of fruits and vegetables in some forms of
cancer (Fernandez et al, 2000:11; Ogle, Hung & Tuyet, 2001:21). The nutritional
benefits of fruits and vegetables are mostly argued on the basis of the
contribution it makes to intakes of known minerals and vitamins. It is therefore
important to identify those foods that will improve dietary diversity in a specific
location. This can be possible by identifying and compiling a list of foods
consumed by the community in order to develop a dietary diversity score
27
2.3.3 Dietary diversity
Dietary diversity refers to the number of individual foods or the number of food
groups consumed over a given period of time. It is a useful indicator of household
food security for four reasons. Firstly, questions on dietary diversity can be asked
at the household or individual level, and this makes it possible to examine food
security at the household and intra-household levels. Secondly, the participants
find questions easy to answer and it does not take a long time. Thirdly, eating a
variety of foods is a valid outcome in its own right. Fourthly, a higher variety of
food is associated with a number of positive outcomes such as improved birth
weight and child anthropometric status, improved haemoglobin concentrations
and reduced risk of mortality from cardiovascular disease and cancer (Hoddinott
& Yohannes, 2002:5).
Nutritionists have long recognized dietary diversity as the key element of high
quality diets. Increasing a variety of foods across and within food groups is
recommended by most dietary guidelines in the United States as well as
internationally and locally (Maunder, Matji & Moleo, 2001:s7). This is thought to
ensure adequate intake of essential nutrients and thus promote good health
(Ruel, 2002:1).
With regard to nutrition education of the public at large, South Africa is in process
of developing Food Based Dietary Guidelines. The International Conference on
Nutrition in 1992 identified the development of Food Based Dietary Guidelines as
one important strategy in the promotion of nutritional improvement and healthy
lifestyles (Maunder & Labadarios, 1999:518). Among the core features that
countries have emphasised in recent guidelines are the recommendations to
consume a wide variety of foods and to eat plenty of fruits and vegetables
(Gibney & Vorster, 2001:s24). However, while a diversified diet often is
associated with a healthier diet, it is a very diffuse term to use. Several
researchers have noted that there are little guidelines for measurement of dietary

28
diversity and suggested that a count of different foods or food categories
consumed may be a useful indicator. Some have analyzed the association
between the number of individual foods or food groups and the nutrient adequacy
(Hatloy, Torheim & Oshaug, 1998:891; Ruel, 2002:12).
Common measures of dietary diversity that are used in developing countries
include measures based on a simple count of foods or food groups, while others
take into consideration the number of servings of different food groups in
conformity with dietary guidelines (Ruel, 2002:6). Food variety will be measured
by counting all the different individual food items consumed over a specific
period, and calculating a food variety score (FVS). Another measure of dietary
diversity is the dietary diversity score (DDS), in this research it will be considered
as the food group diversity score (FGDS), which will be calculated and measured
by counting the number of food groups consumed over a specific period.
2.3.4 Association of dietary diversity and nutrient adequacy
A goal for many existing nutrition intervention programs is to increase the
nutritional adequacy of diets on the assumption that this will result in improved
nutritional status and health of target populations (Guthrie & Scheer, 1981: 240).
Single foods or food group counts have been the most popular measurement
approach for dietary diversity in developing countries, probably due to their
simplicity. The number of servings based on dietary guidelines was not
considered in any of the developing country studies reviewed. In China, Ethiopia
and Niger researchers used food group counts, while those in Kenya, Ghana and
Malawi used the number of individual foods consumed (Ruel, 2002:7).
Studies in Mali (Hatloy et al, 1998:891), and VietNam (Ogle et al, 2001:21) used
both single food counts called food variety scores (FVS) and food group counts
called dietary diversity scores (DDS). A useful contribution of the study in Mali
29
showed that DDS (based on food groups) was a stronger determinant of nutrient
adequacy than the FVS (based on individual foods).
Increasing the number of food groups has a greater impact on nutrient adequacy
than increasing the number of individual foods in the diet. This is because the
nutrients essential to meet nutritional requirements are not all found in a single
food item (with the exception of human breast-milk in the first month of life) but
come from a diet composed of a number of food groups (Hsu-Hage & Wallqvist,
1996: 53). Diverse diets have shown to protect against chronic diseases such as
cancer (Vecchia et al, 1997 in Hatloy et al. 1998: 891; Fernandez, et al. 2000:11).
Different food groups consist of different nutrients from each food item it contain.
A varied diet will therefore consist of all the essential nutrients and energy (Hatloy
et al. 1998: 891).
A diet may have all of the virtues just described and still lack variety if a person
eats the same foods day after day. Variety (dietary) refers to eating a wide
selection of foods within and among the major food groups (the opposite of
monotony). People should select foods from each of the food groups daily and
vary their choices within each food group from day to day for several reasons.
Firstly, different foods within the same group contain different nutrients. Fruits
such as strawberries are especially rich in vitamin C while cantaloupes are rich in
vitamin A. Secondly, variety is the spice of life. Even if a person eats beans
frequently, the person can enjoy pinto beans in Mexican burritos today and
garbanzo beans in Greek salad tomorrow, and baked beans with barbecued
chicken on the weekend. Eating nutritious meals needs never be boring (Whitney
& Rolfes, 2002:34).
Foods that are notably low in nutrient density – such as potato chips, candies,
and colas are sometimes called empty-kilojoule foods. The kilojoules these foods
provide are empty in that they deliver only energy (from sugar, fat, or both) with
little or no protein, vitamins, or minerals. Therefore, when eating these foods, a

30
person may not consume enough nutrients required according to the Dietary
Reference Intakes (DRI’s). It is thus very important to eat a variety of foods in
order to get enough nutrients. Foods rich in fat and sugar provide enjoyment and
energy but relatively few nutrients. In addition they promote weight gain when
eaten in excess and can lead to malnutrition (Whitney & Rolfes, 2002:34).
Monotony in the diet has been described as the hallmark of poverty and poor
nutrition (Golden, 1991; 95) and indeed, typical child diets in communities and
households with high rates of malnutrition are monotonous and bulky. Cereals,
roots and tubers account for more than three-quarters of energy intake and in
some cases similar proportions of proteins and micronutrient intakes (Onyango et
al, 1998: 486; Hatloy et al, 1998:893; Tarini, Bakari, Delisle, 1999:24).
The importance of emphasizing dietary diversity in developing countries stems
mainly from a concern related to nutrient deficiency and the recognition of the
importance of increasing individual food and food group variety to ensure nutrient
adequacy. Lack of dietary diversity is a particularly severe problem among poor
populations in the developing world, because their diets are predominantly based
on starchy staples and often include little or no animal products and few fresh
fruits and vegetables. These plant-based diets tend to be low in a number of
micronutrients, and the micronutrients they contain are often in a form that is not
easily absorbed. Although other aspects of dietary quality, such as high intakes
of fat, salt, and refined sugar have not typically been a concern in developing
countries, recent shifts in global dietary and activity patterns resulting from
increases in income and urbanization are making these problems increasingly
relevant for countries in transition as well (Popkin, 1994; WHO/FAO, 1996 in
Ruel: 2).

31
2.3.5 Association of dietary diversity and nutritional status
A study done in Mali documents a strong association between dietary diversity
and children’s growth (Hatloy et al, 2000:57). In urban areas of Mali, lower FVS
or DDS were associated with twice the risk of being stunted or underweight,
controlling for socioeconomic factors. No association between diversity and
growth was found in rural areas (Ruel, 2002:2).
Data from the South African National Food Consumption Survey (NFCS)
(Labadarios, 1999) showed that the majority of South African households live in
poverty with a limited variety of foods (mainly staples) available in the home.
Findings from the NFCS indicate that one out of two children had an energy
intake less than two thirds of their energy needs and many children consumed a
diet with poor nutrient density in order to meet their nutrient (macro and micro)
requirements. Stunting and underweight is the most severe in children 1-3 years
of age, especially those living on commercial farms. Mean intakes of the following
nutrients are low compared to the Dietary Reference Intakes (DRI): calcium, iron,
zinc, vitamins A, D, E, C, B6, riboflavin and niacin (Steyn & Labadarios,
1999:242).
2.3.6 Association of dietary diversity and nutrient density
The study in Vietnam, which included adult women, used similar methodology to
validate the same dietary measures (FVS and DDS) against nutrient intake and
nutrient density. Both the FVS and DDS were derived from a seven-day food
frequency questionnaire and included more than one hundred and twenty foods
and twelve food groups respectively. These findings confirm a positive
association between the two measures of diversity and the intake of a variety of
nutrients. Women who had a high score in the FVS, (thus consuming 21 or more
different foods in 7 days) had a significantly higher intake of most of the nutrients
studied, than those from the lowest tercile FVS(consuming 15 or fewer foods).

32
Similarly, women with a food group diversity greater or equal to eight foods (out
of a maximum of 12 groups) had significantly consumed higher nutrient ratios for
energy, protein, niacin, vitamin C and zinc than women with lower food group
diversity (Ogle et al, 2001: 21). This indicates that the more diversified a diet is,
the more nutrients will be available in an individual’s body.
2.3.7 The effect of food accessing strategies on dietary diversity
Socio-economic factors such as income and access to land, determine the ability
of households to obtain food either by their own production, or through
purchasing (Kgaphola & Boshoff, 2002:66). Home gardening can contribute to
household food security by providing households with direct access to food that
can be harvested, prepared and consumed by the household members, often on
a daily basis (Marsh, 1998 in Faber & Benade, 2003:24). It also has an effect on
dietary intake, as it will provide their diet with micronutrients essential for their
health. The local production of fruits and vegetables could potentially provide
households with direct access to foods rich in beta carotene and other various
nutrients such as calcium, iron, riboflavin, vitamin C, thereby improving the
overall quality of the diet (Faber & Benade, 2003:25). These nutrients are found
in vegetables and fruits and may help protect against diseases. Deficiencies of
iron, iodine and vitamin A are the most widespread forms of micronutrient
malnutrition with public health consequences. Other micronutrients have been
shown to play a role in preventing specific disease conditions (e.g. folic acid and
calcium) or in the promotion of growth (e.g. zinc). The reason that deficiencies
occur, is when the habitual diet lacks diversity or is overly dependent on a single
staple food, as is the case of monotonous cereal or tuber based diets (WHO/FAO
2002 in Kennedy, Nantel & Shetty, 2003: 9).
The natural environment can also determine what kinds of food can be produced
by influencing the food made available for consumption, while the behavioural
environment determines which foods will be chosen from the variety available.
33
The natural environment will also determine the types of animals and plants
available in the area (Sims & Smiciklas-Wright, 1978: 174). Finding all the types
of food obtained from the environment and determining whether they are utilized
properly, is essential in order to determine if they contribute to dietary diversity.
Food utilization is the final use of food by individuals at household level. This
includes storage, selection, preservation, preparation and the intake of food.
These activities rely on the allocation and use of a household’s personal and
material resources (e.g. knowledge, equipment available and financial means)
and it may be influenced by values, attitudes and norms held in the household or
by the individual concerned (Kgaphola & Boshoff, 2002:68). A study in Vietnam
explains the significance of wild vegetables in micronutrient intakes of adult
women in Vietnam. The nutrient contribution of wild vegetables was generally
found to be high. The use of a greater variety of wild vegetables was found
parallel to a higher dietary diversity (Ogle et al, 2001:29). Rural people in many
countries continue to include wild foods in their diets, but the role of this food
category is still difficult to capture in conventional dietary assessment. This poses
a problem because the wild vegetables are known only by their local vernacular
names, they vary with ethnicity, users are often illiterate, and there is sometimes
a social stigma attached. In addition, data on composition is often missing or
outdated (Ogle et al, 2001: 21). It is therefore important in these situations to
analyze the individual foods or food groups included in the diet. People eat what
they like, what is available and what they can afford. When traditional foods
become scarce and expensive, and when time and labour are no longer available
for their production, then processing and domestic preparation and their
contribution to the family diet is reduced (FAO, 1997: 178).
Investigations into micronutrient nutrition and traditional food systems of
indigenous peoples were recently carried out by FAO collaborators in the five
case studies of indigenous peoples in rural areas of Asia. It was found that, out of
716 species of traditional food reported by five community areas, 93 traditional

34
foods still required scientific identification, and for approximately 147 species
there were not even the most basic nutrient data on file (Kuhnlein, 2001 in
Kuhnlein, 2003: 33). Therefore it is equally important to take into consideration
the traditional food of rural people.
2.3.8 The effect of micronutrients to dietary diversity
Many nutritionists and social scientists believe that the integration of food rich in
micronutrients into the diet is the only sustainable way to improve micronutrient
status in the human. Micronutrient deficiency is the most prevalent in areas
where the diet lacks variety, as is the case for many individuals in developing
countries. When people cannot afford to diversify their diets with adequate
amounts of fruits, vegetables or animal-source foods that contain large amounts
of micronutrients, deficiencies are inevitable. In addition, a minimum amount of
fat or vegetable oil is required in the diet for adequate absorption of the fat-
soluble vitamins A, D, E and K (Kennedy et al, 2003:8). Micronutrient malnutrition
is also a public health problem of considerable significance in South Africa. One
in three children has serum retinal levels that are low, which indicates a marginal
vitamin A status. Children in rural areas and those of mothers with limited
education are the worst off. There is a strong correlation between vitamin A
status and protein-energy malnutrition. Forty percent of stunted children have a
marginal or deficient vitamin A status. As with protein energy malnutrition, the
problem is most severe in the Northern Province (Steyn et al, 1999:29).
Anaemia is also a significant problem among young children in South Africa.
Twenty percent of children were found to be anaemic and 10% to be iron
deficient. Iron deficiency anaemia was diagnosed in 5% of young children
(SAVACG, 1996:354). Micronutrients are the essential vitamins and minerals
required by human beings to stimulate cellular growth and metabolism.
Micronutrient deficiency results when populations do not have enough food to
eat. Iron, vitamin A & iodine deficiencies are of the greatest public health

35
significance contributing to malnutrition (Kennedy et al, 2003:9). According to
Maunder et al, 2001: 7), lack of dietary variety is thought to contribute to:
♦ Low micronutrient intakes
♦ Low energy intakes
♦ Chronic diseases of lifestyle.
For both consumers and nutritional scientists, variety is conceptualized as
including different foods and different food groups as part of the diet, as well as
altering the method of food preparation. Enjoying a variety of foods is the first of
ten South African Food Based Dietary Guidelines (FBDG) adopted in 2004 by the
government for implementation in the community. This guideline emphasizes the
problem of poor dietary variety and the need for change. It also encourages
people to eat a variety and to enjoy their foods (Maunder et al, 2001:s7).
36
Chapter 3
RESEARRESEARRESEARRESEARCH METHODOLOGYCH METHODOLOGYCH METHODOLOGYCH METHODOLOGY
3.1 RESEARCH DESIGN
A quantitative research approach was implemented in an attempt to answer the
research problem. This research study was designed as a survey, employing
quantitative measures supplemented with qualitative techniques. An empirical
research design was used to collect primary data about a community living on a
commercial farm. Data was gathered through face-to-face interviews and
observations. Due to the exploratory and descriptive nature of the research
purpose, various measuring instruments were used to collect data. A cross
sectional research design was implemented as this was based on observations
representing a single point in time (Babbie & Mouton, 2001: 641). The conceptual
framework will indicate the trail to follow during the process of data gathering to
attempt to answer the research problems of this study (See Figure 3.1).
3.2 RESEARCH PROBLEM
To identify and describe the different food access strategies employed by farm
worker households on Oranje Farm and how that contributes to dietary diversity.

37
3.2.1 Sub problems
The sub-problems for this study are as follows:
♦ Which foods were accessed through food production to contribute to
dietary diversity of farm worker households on Oranje Farm?
♦ Which foods were accessed through food purchasing to contribute to
dietary diversity of farm worker households on Oranje Farm?
♦ Which foods were accessed through food bartering to contribute to dietary
diversity of farm worker households on Oranje Farm?
♦ Which foods were accessed through food gathering to contribute to dietary
diversity of farm worker households on Oranje Farm?
♦ Which foods were accessed through payment in kind to contribute to
dietary diversity of farm worker households on Oranje Farm?
♦ Which foods were accessed through other strategies to contribute to
dietary diversity of farm worker households on Oranje Farm?
♦ To determine the dietary diversity (food variety and food group diversity
scores) of farm worker households on Oranje Farm.
♦ How do all the food access strategies contribute to dietary diversity of farm
worker households on Oranje Farm?
♦ How does the dietary diversity of adult women of farm worker households
on Oranje Farm relate to their body mass index?

38
3.2.2 Conceptualisation
Figure 3.1 provides the theoretical and conceptual frameworks for this research
study. The blue highlighted area indicates the concepts relevant in this research
study.
FIGURE 3.1: THEORETICAL AND CONCEPTUAL FRAMEWORKS
HIGHLIGHTING THE RELATIONSHIP BETWEEN FOOD
ACCESS, FOOD SUPPLY AND DIETARY DIVERSITY
HHoouusseehhoolldd FFoooodd SSeeccuurriittyy
FFoooodd aavvaaiillaabbiilliittyy FFoooodd uuttiilliizzaattiioonn
FFoooodd aacccceessss
SSttaabbllee,, aavvaaiillaabbllee ffoooodd ssuuppppllyy
Food
Production Food
Purchasing
Food bartering Food
Gathering
Payment
in kind Other
DDiieettaarryy DDiivveerrssiittyy
Food Variety Food Group Diversity
Body Mass Index
Adult women

39
3.2.2.1 Definitions of components in the conceptual framework
The definitions are as follows
♦ Food access - refers to whether the available food can be approached or
“got to” and includes people having the resources, ability and knowledge to
produce or procure food (Latham, 1997 in Sayed: 7).
♦ Food production - refers to what food are produced by the household and it
involves those techniques by which the food supply ideally is increased, and
controlled, at least to some extent (McIntosh, 1995:28) for example:
o horticulture that refers to the cultivation of domestic plants for food and
other purposes without the use of a plow (McIntosh, 1995:29).
o animal husbandry that refers to the raising of animals for food (McIntosh,
1995:29).
o agriculture that refers to all types of cultivation including horticulture and
raising the plants with the use of a plow (McIntosh, 1995:31).
♦ Food purchasing - in this study refers to what and how much food is
purchased with money from any dealer.
♦ Food gathering - refers to all kinds of “food-getting” activities in the
surrounding environment in which there is an attempt to increase the amount
of food available in the household. These activities can be aimless, random
or goal-oriented for example hunting, fishing and collecting (McIntosh,
1995:19).
♦ Food bartering - in this study refers to exchanging resources for food.
♦ Payment in kind - in this study refers to any food given freely or food that
forms part of payment. It includes food bought at a subsidized price
specifically on commercial farms e.g. milk bought at one Rand for a litre.

40
♦ Other - in this study refers to anything that can be unknown and can be
revealed by the community in terms of the methods of food access.
♦ Dietary diversity - refers to the number of different individual food items (or
thus food variety) and food groups (or thus food group variety) consumed
over a given reference period (Ruel, 2002:3). This may accurately predict the
individual nutrient adequacy and thus household food security.
o Nutrient adequacy – refers to the achievement of daily-recommended
intakes of energy and other essential nutrients (Ruel, 2002:4).
♦ Food variety – refers to a number of different individual food items
consumed over a specific period (Hatloy et al, 1998:891).
o Variety (dietary) – refers to eating a wide selection of foods within and
among the major food groups (the opposite of monotony) (Whitney &
Rolfes: 2002: 34).
♦ Food group diversity - refers to the number of food groups consumed over
a specific period (Hatloy et al. 1998:891).
3.3 OPERASIONALISATION
3.3.1 Biographic information
A questionnaire was specifically designed to gather biographic information
regarding the participant’s age, house number, marital status, level of education
and socioeconomic status and employment status.

41
3.3.2 Anthropometric measurement
Only one measure of weight status was included in this research study, namely
body mass index (BMI). The height and weight of all adult women were
measured and used to calculate their body mass index (BMI), which was then
compared to their dietary diversity scores to establish a relationship, if any.
♦ Weight
Body weight was measured in kilograms (kg) and rounded to the nearest
gram using an accurately calibrated electronic scale.
♦ Height
Body height was measured in meter (m) and rounded to the nearest
millimetres (mm). A measurement of standing height was being measured
using a measuring tape, affixed to the wall.
♦ Body mass index
This was calculated using weight and height measurements. This was
calculated as weight divided by height squared and the sum taken to be the
body mass index which was then compared to standard values (Lee &
Nieman, 2003:172).
3.3.3 Dietary diversity
One of the aims of the research was to compile a list of individual foods to
calculate scores for food variety and food group diversity (Addendum B). A list
was compiled of different food items typically consumed by these communities
and verified with the various foods access methods (See Addendum A). The
different types of foods and food groups consumed over a 7-day period in this
specific community, was compared to the list of foods and food groups (See
Addendum B) to determine a food variety score (FVS) and a food group diversity

42
score (FGDS). Various international researchers (Hatloy et al. 1998: 891; Ogle et
al, 2001:21) had used this method.
3.3.3.1 Food variety
All the individual foods consumed over a seven-day period were used to
calculate the score (FVS): firstly, 151 individual foods from twelve groups and,
secondly, the food list was again adapted to omit foods never used and by
adding those that were left out before thereby 109 nutritious individual foods from
nine groups were used. (For its calculations see 4.3.6.1 & 4.3.6.2).
3.3.3.2 Food group diversity
Various food group quantities were used for calculations of the food group
diversity score (FGDS). Firstly, twelve varied food groups (nutritious and non-
nutritious food) and, secondly, nine nutritious food groups were calculated
(nutritious food only) consumed over a seven-day period (FAO working group).
This was classified according to nine food groups as recommended by FAO.
Other remaining items such as tea, sugar, sweets were not used in (FVS) and
(FGDS) calculations (Steyn, Nel, Nantel, Kennedy & Labadarios, 2006:645). (For
its calculations see 4.3.6.1 & 4.3.6.2).
3.4 POPULATION AND SAMPLING
The study population is farm worker households on commercial farms. The
sample for this study is a community of farm worker households living as a small
community on a commercial farm (Oranje Farm) situated between the towns of
Clarens and Fouriesburg in the North Eastern Free State. All the available twenty
one adult women that were responsible for the food in these households
(between the ages of 18 and 65years) that were on Oranje Farm were the data

43
sources in the study. On average there were between two to four women living in
one of these households. For this research study an adult woman will be
considered as a woman, aged between 18 and 65 years, living in farm worker
households on a commercial farm.
3.5 PROCEDURE AND DATA COLLECTION METHODS
3.5.1 Procedure
Permission was obtained from the farm owner to gather information and
implement training programmes on his farm. The researcher first offered an
explanation of the research and informed participants of the purpose of the
research and allowed questions to be asked regarding the study. Confidentiality
was assured and the issue addressed by the researcher and those not
comfortable participating in the study were excused. A consent form was given
and signed by each participant to show that they confirmed that they were
participating out of their own free will. Privacy and anonymity were ensured.
Participants were encouraged to be as honest as possible when answering
questions. These aspects were used to describe the community and their socio-
economic backgrounds. The Ethics committee of the University of the Pretoria
approved the research study prior to the commencement of the study.
3.5.2 Data collection techniques
Data was collected during four seasons, which included early summer, late
summer, autumn, winter and spring. The results were collected twice during
summer in order to evaluate the variety of food consumed and to find a true
reflection of their dietary diversity since Christmas time. In addition, fruits and
vegetables are harvested more often during late summer. These periods was
therefore divided into two seasons which is early summer and late summer.

44
The data was collected during early December 2003 (early summer), late
January 2004 (late summer), late April 2004 (autumn), July 2004 (winter) and
early November 2004 (spring). Data was collected by means of a structured
questionnaire, which elicited information regarding food access, with special
reference to food production, purchasing, bartering, gathering, purchasing in
kind, others and dietary diversity (See Addendum A). During the interviews, the
researcher used food models, books, posters showing drawings or photographs
of different fruits, vegetables and herbs to help participants to recognise these
foods easily. Also, wrappings and packaging of different food items and
beverages were used to help identify various foods eaten by the community.
FIGURE 3.2: INTERVIEWS AND DATA COLLECTION IN CONNECTION WITH
DIETARY DIVERSITY
Due to the relatively low level of literacy of the participants, individual face-to-face
interviewing was used as a method in gathering data. This aided the researcher
to obtain information directly from each respondent. Although this method was
time consuming, as the researcher had to interview the respondents individually,
it was important in that it enabled the researcher to have reliable and valid
information. It gave the researcher an opportunity to probe for answers when
necessary.

45
The researcher’s presence might only slightly have affected a respondent’s
answers given that the researcher was of the same culture and spoke the same
language. Some simple observations while asking questions were recorded to
aid in enriching the data. The interviewer was also able to observe the
respondent’s general reaction to the study. Secondary data and field notes were
taken during data collection. In this case secondary data was the existing
research results from additional research studies conducted on the same group.
3.6 DATA ANALYSIS
The SAS and BMDP statistical packages were used in analysing data, mainly
using frequency and means procedures, and calculating standard deviations.
Other inferential statistical procedures included the Mann-Whitney test and
Friedman parametric tests. Mann-Whitney test is used for comparing mean of
two groups. It is a non parametric test. In this study it was used due to the two
comparing groups being small and the data was not normally distributed. The
Friedman parametric test is used to test for differences between more than two
matched or paired variables (BMDP, 1993; SAS, 1999; Steyn, Smith, Du-tuit &
Strasheim, 1999).
Also, the measure of dietary diversity (DD) namely the food group diversity score
(FGDS) and food variety score (FVS) was calculated. The FGDS was measured
by allocating foods into 12 different food groups and 9 nutritious food groups.
Participants’ responses were coded in the following manner: 1 point was
allocated for each positive response, i.e., 1 for “Yes” response, and 0 for a “No”
response.
Data was used to determine if any relationships could be found between:
♦ Food variety scores and Food group diversity scores
♦ Body mass index and diversity scores

46
Scores were compared between the seasonal periods to find which foods were
consumed most frequently in the different seasons. The methods and regularity
of usage and how often each food accessing strategy was used were also
investigated. Ranking of the food accessing strategies was also done to check
which method is used as the main accessing strategy. Data was further used to
find the most commonly consumed food items per season in order to assess the
meal patterns and usual eating patterns.
The results were presented in tables and discussed accordingly with regard to
the information obtained and the trends that emerged, or any unexpected
findings that emerged. The data was presented in numerical terms and
calculated findings in percentages.
3.7 THE QUALITY OF THE RESEARCH
The quality of the research was evaluated against the validity framework of
Mouton (1996:111). The framework was based on the stages of the research
process, sources of error and the methodological strategy that was being taken
to ensure a specific validity related criterion.
3.7.1 Validity
3.7.1.1 Theoretical and content validity
Concepts were defined and conceptualised in the conceptual framework well
(See 3.2.2.1) against the body of existing theory and research (Babbie & Mouton,
2001:109). This process clarified the main concepts and their relationship within
the conceptual framework, and the dimensions and indicators of both concepts
(i.e. the scope of the concepts) were specified. The study leaders and other
experts in the field approved this process.

47
3.7.1.2 Measurement/construct validity
Construct validity was based on the logical relationship among variables (Babbie
& Mouton, 2001:123), as was shown in the conceptual framework. Therefore, the
measurement for body mass index of adult women was used as an external
criterion for diet diversity.
3.7.1.3 Internal validity and transferability
This research can claim internal validity, since the sample was not representative
of the larger population of commercial farm worker households in South Africa.
This study is part of a larger research focus area, which has, as its aim, the
construction of a model for addressing household food security. Therefore, this
research was concerned about the transferability of its findings to another
receiving context (Babbie & Mouton, 2001:277).
3.7.1.4 Inferential validity
The analysis was done with the research question as point of departure and a
thorough understanding of related literature. The researcher was aware of rival
explanations for the conclusion that dawned from the research findings.
3.7.2 Reliability
Reliability was maximised by minimising error during data-collection. The
interviewer was familiar with the research setting, had good rapport with the
research participants, was of the same ethnical group and had been assured on
numerous occasions that the participants did give her honest information.
Participants were treated with dignity and answers recorded and observations
made accurately. Two fieldworkers were involved in data gathering.

48
Chapter 4
RESULTS AND DISCUSSIRESULTS AND DISCUSSIRESULTS AND DISCUSSIRESULTS AND DISCUSSIONONONON
4.1 DESCRIPTION OF ORANJE FARM
The study was conducted on a commercial farm in the North Eastern Free State,
called Oranje Farm (See Figure 4.1). Oranje farm is considered rural, as it does
not have the basic resources such as municipal water, sewerage and garbage
removal system.
FIGURE 4.1: ORANJE FARM SURROUNDINGS
Oranje farm is situated between two other towns known as Fouriesburg and
Clarens. Fouriesburg is +14km away from Oranje farm and people spend R10 for

49
a return trip from this town. Clarens however is + 20km away and people spend
R20 for a return trip. The community of Oranje farm thus prefers to go to
Fouriesburg, as it is nearer and less expensive to get there. A guesthouse is
available on the farm (See Figure 4.2).
FIGURE 4.2: THE GUEST HOUSE SITUATED ON ORANJE FARM
Due to poverty, most people cannot afford money for the transport, and therefore
rely on lifts from cars passing by. Clarens and Fouriesburg are not large towns
themselves, as they have few shops such as cafes, general dealers, butchery
and no supermarkets. These shops do not provide a variety of food, clothes and
other basic necessities. For people to get basic necessities, they have to travel to
Bethlehem, which is another town situated + 100km away. Due to costs involved
in travelling, people only can afford to travel to Bethlehem during special
occasions such as weddings, funerals and Christmas.
4.1.1 Available food found in the spaza shop on the farm
The community of Oranje farm depend on the two spaza shops found in the
village. These shops sell foods such as sugar, eggs, minced meat, sunflower oil,
artificial cold drinks, spices (curry powder), sunlight bath soap, matches as well
as candles. The spaza shops do not have a wide variety of foods but only the
basic requirements. This affects the food variety of the community living on this

50
farm as they depend on what is available. They also depend on what they
produce on the farm, which is then subsidized by the farm owner, e.g. milk and
eggs. This therefore results in the same eating pattern among different families.
Most of the households purchase the same groceries from the general dealer in
Fouriesburg and from the spaza shop in their community (See Figure 4.3).
FIGURE 4.3: THE SPAZA SHOP FOUND ON ORANJE FARM
4.1.2 Environment of the farm worker village
The village has a borehole approximately 200m away from the houses that are
situated up on the hill behind the main farm buildings (See Figure 4.4).
FIGURE 4.4: WATER SOURCE AND HOUSING AREAS
WATER SOURCE
LIVING AREA

51
This is the only source of water for these households. People have to move down
the hill a distance of about 200 metres on a return trip to go and fetch water for
their families. They also wash their clothes near the tap and, that way, they do
not have to carry the water up the hill back to their houses (See Figure 4.5). A
small dam is also available near the tap water. The community members use the
dam for fishing, depending on the season and the water level. More fish are
caught during summer.
FIGURE 4.5: A WOMAN CARRYING WATER FROM THE WATER SOURCE
There is one primary school in the village (See Figure 4.6), which serves 48
children from other surrounding farms (Oranje, Mooidam, Tuinplaas, Joelsnet).
FIGURE 4.6: THE PRIMARY SCHOOL SITUATED ON ORANJE FARM

52
There is another school building across the main road, which is used as a high
school, grade 7-9 (See Figure 4.7).
FIGURE 4.7: THE HIGH SCHOOL SITUATED ON ORANJE FARM
The children normally use the back road leading to school which is outside the
village (See Figure 4.8). The rest of the children go to school in Fouriesburg and
Clarens.
FIGURE 4.8: BACK ROAD LEADING TO HIGH SCHOOL
4.2 RESEARCH RESULTS
The study group consisted of twenty-one women (N=21), aged 18-65 years old
living in a community of farm worker households on Oranje Farm. The results will
be discussed in five parts, namely, biographic information including employment

53
status and income level, age, marital status, educational status and
anthropometry, food-accessing strategies, dietary diversity issues, food variety
and food group diversity scores.
4.2.1 Biographic information
These results are based on a description of the respondents in this study,
including their ages, marital status, number of children, socioeconomic status,
and their educational status. Some of these factors played an important role in
identifying certain factors or circumstances that hindered the women in having
diversified diets in their family. Additionally, their socio-economic status, as well
as educational status, makes an important contribution in understanding their
food security level. The age, marital status and level of education of the women
in the farm worker households are presented in Table 4.1.
TABLE 4.1: AGE, MARITAL STATUS AND LEVEL OF EDUCATION
FREQUENCY (N=21) PERCENTAGE (%)
Age (years)
18-25 7 34
26-33 3 14
34-41 3 14
42-49 4 19
50-57 3 14
58-65 1 5
Marital status
Single 12 57
Married 9 43
Level of education
None 1 5
Grade 1 & 2 4 19
Grade 2- 6 7 33
Grade 7 1 5
Grade 8 1 5
Grade 9 0 0
Grade 10 2 9
Grade 11 4 19
Grade 12 1 5

54
About one third of the respondents (34%, n=7) in this study are aged between 18
and 25 years old. Most of the respondents (57%, n=12) are not married, but live
with their extended families in these households. Most of the respondents (62%,
n=13) in this study were only educated up to primary school level of grade 7 and
only one woman had matriculated.
The employment status and income levels of the women living in these
households are presented in Table 4.2.
TABLE 4.2: EMPLOYMENT STATUS AND INCOME LEVEL
FREQUENCY (N=21) PERCENTAGE (%)
Occupation
Unemployed 15 71
Employed 6 29
Self- employed 0 0
Monthly income (n=6) %
R100-200 1 17
R200-500 3 50
R500-1000 2 33
R1000-2000 0 0
Nearly all the respondents (71%, n=15) living in these households were
unemployed, and only six (29%) women were working and earning an income at
the time of the study. Four of the respondents (67%, n=4) earned five hundred
rand or less while two of the respondents earned more, but less than one
thousand rand per month. Various family members and their extended family
living together were contributing to the incomes of these households. The
sources of income are presented in Table 4.3.

55
TABLE 4.3: SOURCES OF INCOME
CONTRIBUTORS TO THE FARM WORKERS HOUSEHOLD’S
INCOMES
RESPONSES FROM FARM WORKER
HOUSEHOLDS (N=21)
Yes % No %
Friends 0 0 21 100
Relatives 3 14 18 86
Child’s father or husband 12 57 9 43
Mother 3 14 18 86
Father 1 5 20 95
Sister 0 0 21 100
Brother 1 5 20 95
Pension/child grant 6 28 15 72.
Children (son & daughter) 4 19 17 81
Contributions of money to purchase food in a household mainly came from family
members or close relatives. Most households depended on the women’s
husbands or the fathers of the children (57%, n=12) to support their families. A
few (28%, n=6) depended on state money, either being pensions or children’s
grants. None of the respondents received money from their friends or sisters.
Table 4.4 is about the composition of farm worker household and their
employment status. What is indicated in that table is the total number of children
and adults in the household and the employment status of the adults in the
household. Household number 12 and 13 were empty houses and there was
nobody staying in them. Neighbours used household number 12 as a storeroom
to store maize meal and other equipment. Household number 13 was previously
used as a crèche for smaller children in the farm. The total number of household
members in the family and the number of children living in a household might
have an effect on their food consumption. It was to be expected that, in
households where less members were employed, a lower variety of food would
be available.

56
TABLE 4.4: COMPOSITIONS OF FARM WORKER HOUSEHOLDS AND EMPLOYMENT STATUS OF MEMBERS
HOUSE NUMBER NUMBER OF
ADULTS
NO OF CHILDREN
IN A HOUSEHOLD
NO OF ADULTS
WORKING
NO OF ADULTS
NOT WORKING
TOTAL NUMBER
OF PEOPLE IN THE
HOUSEHOLD
PENSION/
CHILD GRANT
1 1 0 0 1 1 1 Disability grant
2 5 6 4 1 11 1 Child grant
3 2 3 1 1 5 0
4 2 None 1 1 2 0
5 3 8 2 0 11 0
6 2 3 1 1 5 0
7 2 1 1 1 3 1 Child grant
8 2 3 1 1 5 0
9 3 1 1 2 4 0
10 5 2 3 2 7 1 Pension
11 1 0 0 0 1 1 Pension
12 0 0 0 0 0 0
13 0 0 0 0 0 0
14 3 6 0 0 9 2 Pensions, 3 Child grants
15 1 3 0 0 4 0
16 2 1 1 1 3 1 Pension, 1 Child grant
17 4 1 1 3 5 1 Pension
18 1 0 0 0 1 1 Pension
Total 39 38 17 15 76
No 15* Two children under the age of 12 years old were not yet receiving child grant because the mother never went to social welfare.

57
Most households depend on either pensions and/or child grants in order to
have food in the house. At least one member of the household earned income
or received a pension or social grant except for household number 15, where
the mother was neither working, nor receiving a grant for her children.
4.2.2 Anthropometric measurement
The weights and heights of all the women were measured and recorded to
assess their weight status (See Figure 4.9).
FIGURE 4.9: WOMAN BEING WEIGHED
The body mass index (BMI) of each woman was calculated to assess their
weight status, which is an important measurement of their physical health as
well as their health status (See Table 4.5).
TABLE 4.5: BMI’s OF THE WOMEN IN FARM WORKER HOUSEHOLDS
BMI NO OF WOMEN
(N=21) RESULTS %
>=30 10 Obese 48
25-29.9 4 Overweight 19
18.5-24.9 4 Normal 19
17-18.4 1 Possible underweight 5
16-16.9 2 Underweight 9

58
The respondents (67%, n=14) were above the normal or expected weight for
their ages & height. Most of them were obese (48%, n=10). Their weights
varied between 73kg and 120kg. Their mean BMI was 29.4 ranging from a
minimum of 16 to maximum of 48.
4.2.3 Dietary diversity
4.2.3.1 Food variety and food group diversity
The variety of foods eaten by the households was investigated by calculating
the number of foods consumed over a period of seven days. A list of foods
and food groups was used to investigate which food items were normally
eaten and bought (See Addendum B). The list was compiled during a pilot
study when the various households had to list the food items that they
normally used or consumed. One hundred and fifty one foods were identified
and used to compile the dietary diversity questionnaire that was used to
calculate the individual food variety scores of the community on Oranje farm.
The different foods that were accessed through the various food accessing
strategies, and that contributed to dietary diversity of farm worker households
on Oranje farm, are shown in Table 4.6.
The two staple foods most often consumed, were identified as maize meal
and brown bread, as households consumed these regularly. Staple foods
were accessed through either purchasing (bread), or payment in kind (maize
meal), which means that all the households regularly buy bread and receive
maize meal flour as payment in kind. The relishes or accompaniments used
most often with the staple food – in this instance stiff maize meal porridge –
included chicken, milk, eggs and vegetables like spinach. These foods were
mostly self-produced, gathered or bought, depending on their availability, as
well as on availability of money.

59
TABLE 4.6: VARIETIES OF FOODS ACCESSED FROM VARIOUS FOOD
GROUPS THROUGH DIFFERENT FOOD STRATEGIES
FOOD GROUPS INDIVIDUAL FOOD ITEMS
Cereal diversity Purchased items
Brown bread/maize-meal
Payment in kind
Maize-meal
Vegetable diversity
Gathered from the veldt
Wild vegetables (Green leafy vegetables) such as . thepe (pigweed), sebitsa (pepper plant),
seruwe (lambs quarter), sempaile (mustard), papasane (horse radish), tlhaku ya kgomo (lion
tooth), tenane (harebell leaves), sewediwetla (wild carrot), selae (lettuce)
Cultivated vegetables (Production)
Cabbage, spinach, onions, green beans, carrots, tomatoes, sugar beans, pumpkin, potatoes
Fruit diversity Cultivated fruits (production)
Apple (or bought ), apricots, peaches
Wild fruit gathered from the veldt
Prickly-pear
Proteins diversity Own livestock
Chicken, chicken runners & heads, chicken livers, eggs
Purchased items
Tinned fish, malana & mogodu ( tripe).
Fishing & hunting
Fresh fish (sardines)
Animals
Guinea fowl (Kgaka), rabbits (mmutla), pela (hare), letsa(steenbok), phuthi (springbok), rooikat
(caracal)
Milk products diversity Purchased or own or subsidized
Cow’s milk
Beverages diversity Purchased items
Imitation drinks such as foro, drink-o-pop, tea
Home preparation
Traditional beer
Miscellaneous diversity Purchased items
Sugar, salt, soups, tomato sauce, curry powder
Fats, oil & sweets diversity Purchased items
Sunflower oil, Lard (home made)
Other vegetables used as relishes were cabbage, spinach, onions, tomatoes,
sugar beans, pumpkin, green-beans and potatoes. Those who did not plant or
did not have a garden mainly purchased fruits and vegetables from
Fouriesburg. Cultivated fruits such as peaches and apricots were accessed
freely from the farmyard. Their garden plots had some fruit trees.

60
Their favorite fruit consumed throughout the whole year was apples. Other
foods that provided variety in food choice were mostly purchased. These were
however considered to be expensive such as sunflower oil, spices (curry
powder), tomato sauce, soups, sugar and salt. Traditional beer made from
sorghum was seen as a form of entertainment for some of the households. It
was prepared at any time or during funerals, rituals, parties and at Christmas
when sorghum was available.
4.2.4 Food accessing strategies
All the households (90%, n=18) had access to a garden plot specifically
allocated to them, which was mostly used for the purpose of cultivating fruits
and vegetables. Few households (10%, n=2) had garden plots but did not
plant vegetables or grow fruits. Only one respondent (5%, n=1) from all the
households did not cultivate vegetables and fruit in her garden plot due to her
illness. All the plots were freely used land found next to each house. The
lengths of the plots ranged from 5.1m to 15.4m and the widths ranged from
4m to 12.7m. Most (90%, n=18) of the households used their plots for
planting. People living in rural areas generally used different food accessing
strategies in order to prevent household food insecurity. The different food
accessing strategies that were used by this farm worker community on Oranje
farm are presented in Table 4.7.
TABLE 4.7: FOOD ACCESSING STRATEGIES USED ON ORANJE FARM
FOOD ACCESSING STRATEGIES (N=21) YES % NO %
Cultivation * (n=20) 18 90 2 10
Vegetables*(n=20) 16 80 4 20
Fruits*(n=20) 15 75 5 25
Livestock 18 86 3 14
Purchasing 21 100 0 0
Bartering 4 19 17 81
Gathering from the environment 21 100 0 0
Collecting (See 3.2.2.1) 21 100 0 0
Hunting 10 48 11 52
Fishing* (n=20) 11 55 9 45
Payment in kind 16 76 5 24
*n=20 – One person did not plant vegetables or fruit in her garden or engaged in fishing, due to ill health.
61
Cultivation – most of the households (90%, n=18) living on Oranje farm
cultivated fruits and vegetables for household food consumption. Most of the
households grew their own vegetables such as spinach, pumpkin (80%, n=16)
and fruits such as peaches, apricots (75%, n=15) in their gardening plots.
Most of the vegetables are grown all year round, but fruits were mostly
cultivated during summer only, due to seasonality. Many of the households
(86%, n=18) also had livestock such as chickens, cattle and few pigs.
However, the livestock was used more as an asset than day-to-day food.
Purchasing – all people access food by purchasing either from spaza shops
or shops in town.
Bartering – due to a lack of knowledge and understanding, most of the
women do not use the method of food bartering (81%, n=17) as a way of
getting food or of having larger variety of foods in the house.
Gathering – all households depend on gathering food from the veldt, such as
green leafy vegetables such as. thepe, sebitsa, seruwe and fruit (prickly
pears). They use these wild vegetables as a relish and consume it
accompanied with maize meal porridge (See Table 4.8). When food is scarce
or money is limited, some of these households (48%, n=10) hunted animals
such as guinea fowls, rabbits or springbok, and caught fish (55%, n=11) as a
source of fresh meat.
Payment in kind – several households (76%, n=16) depended on food
provided by the farmer as part of payment to his employees – specifically
maize meal flour. Few of the households (24%, n=5) did not receive foodstuffs
as payment in kind because none of their household members worked for the
farmer.
The households living on Oranje farm used a variety of different foods
accessed through the different food accessing strategies identified in their
community – either through the farm itself, from their garden plots and from
the veldt / environment. The investigation into the food diversity the food

62
accessing strategies practised revealed that the following foods were utilized
through the various identified food accessing strategies (See Table 4.8).
TABLE 4.8: FOOD TYPES ACCESSED THROUGH DIFFERENT FOO D
ACCESSING STRATEGIES
FOOD ACCESSING STRATEGIES FOOD KINDS PRODUCED RANKED FROM MOST TO LEAST
Food production
Cultivation
Vegetables
Spinach, green beans, pumpkin, tomatoes, turnip, cabbage,
beetroot, swiss chard, carrots, potatoes, maize on the cob,
lettuce (See Table 4.9).
Fruits
Peaches, apricots and grapes (See Table 4.9)
Livestock
Animals: chickens, cattle, pigs
86% - own livestock
92% - cattle only for milk products
100% - chickens
17% - own pigs for financial purpose
Food purchasing
Retail
Household grocery items (Table 4.6 & 4.18)
Bread, tea, imitation drinks, apples, sugar, salt, sunflower oil,
spices (curry powder).
Subsidized by the farmer Milk and eggs
Food bartering Maize meal, eggs, milk, sugar-beans, wild leaves, tomatoes,
carrots, mealies, tea, sugar, cake flour, meat
Food gathering
Animals
Hunting: Rabbit (mmutla), kgaka (guinea fowl), phuti (springbok),
pela (hare), Letsa (steenbok), rooikat (caracal)
Fishing: Sardines, fresh waterline fish (See Figure 4.12).
Plants Wild leaves such as thepe, sempaile, papasane, sebitsa, seruwe,
tlhako ya kgomo, tenane, seshwabohloko, tenane (See Table
4.11 & Figure 4.11).
Wild fruits like prickly pear
Payment in kind Maize meal: 60-80kg every month,
Other: eggs, milk, flour, dried corn kernels, mutton
n*=3 did not own livestock
4.2.4.1 Food production – cultivation - most common vegetables
crops cultivated in their garden plots were spinach, green beans, pumpkin,
tomatoes, turnip and cabbage (See Table 4.8 & 4.9). In addition different
vegetables and fruits were produced during the various seasons, mainly due

63
to availability and the difference in weather condition. Most vegetables were
cultivated during spring and summer, and the least during autumn.
Approximately 30 food items were planted during spring and summer
respectively by all the households on the farm, and only three items during
autumn. However, the variety of food items planted was limited, as only 11
different items were planted in spring and nine in summer. The vegetables
cultivated mainly in summer, were green beans, pumpkin and turnip; in spring
it was spinach, green beans and tomatoes, while cabbage was popular in
winter. In autumn, cabbage, swiss chard and tomatoes were popular to plant.
Most households (75%, n=15) grew their own fruit trees in their gardens while
few (25%, n=5) did not have any. In addition, the most common fruit available
was peaches, which were harvested during the summer, although this was
mostly from the farmer’s orchard. The other fruits were also harvested during
summer. However, there was one household that harvested grapes in autumn
When vegetables and fruit were planted in the gardens, it improved the dietary
diversity and was very accessible and available to the households (See Table
4.9).

64
TABLE 4.9: THE DIFFERENT TYPES OF VEGETABLES AND FRUITS PRODUCED BY SEASON
ITEM SEASONS
Vegetables Summer Autumn Winter Spring All year round Total
Spinach 4 0 1 5 3 13
Green beans 6 0 1 5 0 12
Pumpkin 8 0 0 3 0 11
Tomatoes 0 1 0 6 0 7
Turnip (Raap) 5 0 1 0 1 7
Cabbage 0 1 3 2 0 6
Beet root 2 0 0 2 0 4
Swiss chard 0 1 0 2 0 3
Potatoes 1 0 0 2 0 3
Carrots 2 0 0 1 0 3
Radish (rateisi) 0 0 0 1 0 1
Perm 0 0 0 1 0 1
Peas 1 0 0 0 0 1
Lettuce 1 0 0 0 0 1
Corn on the cob 0 0 1 0 0 1
Planting activities in community 30 3 7 30 4 74
Planting variety in community. 9 3 5 11 2 15
Peaches 17 0 0 0 0 17
Apricots 3 0 0 0 0 3
Grapes 2 1 0 0 0 3
Planting activities in community 22 1 0 0 0 23
*The respondents reported planting on specific seasons and not all year round except for spinach and turnip which was good for their soil. Fruits were
Only available during summer.
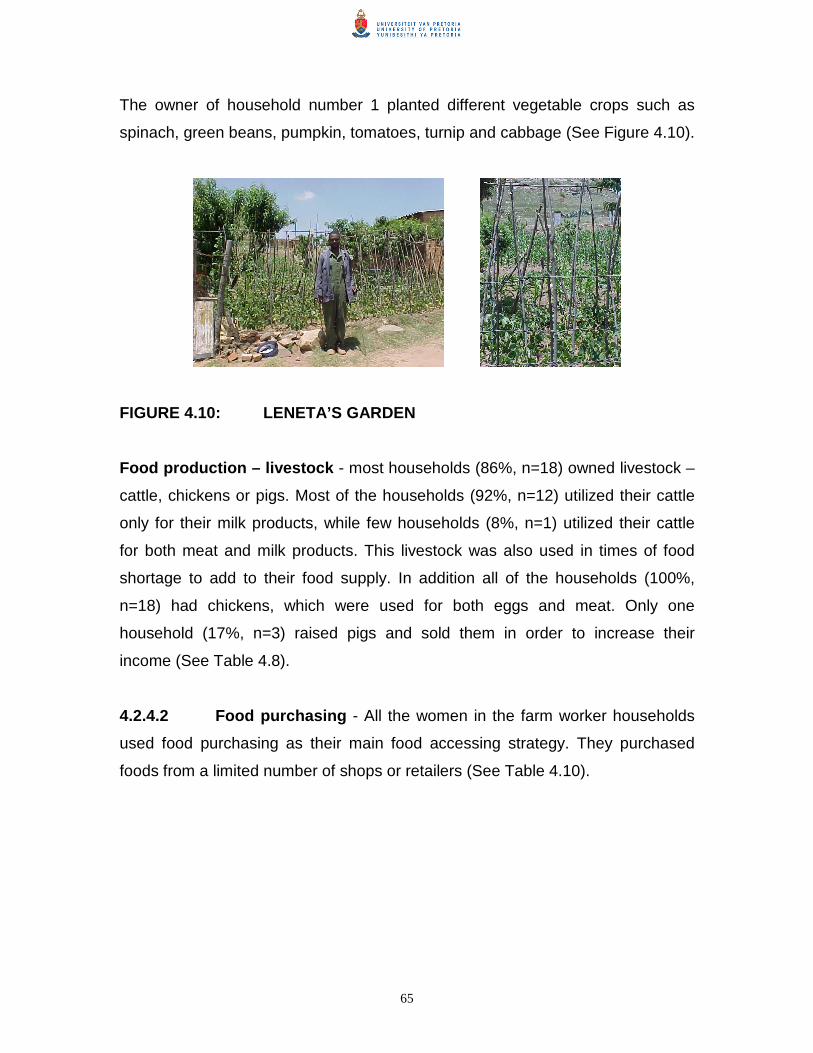
65
The owner of household number 1 planted different vegetable crops such as
spinach, green beans, pumpkin, tomatoes, turnip and cabbage (See Figure 4.10).
FIGURE 4.10: LENETA’S GARDEN
Food production – livestock - most households (86%, n=18) owned livestock –
cattle, chickens or pigs. Most of the households (92%, n=12) utilized their cattle
only for their milk products, while few households (8%, n=1) utilized their cattle
for both meat and milk products. This livestock was also used in times of food
shortage to add to their food supply. In addition all of the households (100%,
n=18) had chickens, which were used for both eggs and meat. Only one
household (17%, n=3) raised pigs and sold them in order to increase their
income (See Table 4.8).
4.2.4.2 Food purchasing - All the women in the farm worker households
used food purchasing as their main food accessing strategy. They purchased
foods from a limited number of shops or retailers (See Table 4.10).

66
TABLE 4.10 SOURCES AND FREQUENCY OF FOOD PURCHASING
SOURCE WHERE FOOD MOSTLY BOUGHT
RANKED FROM MOST TO LEAST FREQUENCY N=21 PERCENTAGE (%)
General dealer (small) 19 90
Spaza shop 1 5
Commercial farm 1 5
Frequency of purchasing N=21
%
Everyday 0 0
3 times a week 1 5
1-2 times a week 3 14
Three times a month 3 14
Twice a month 4 19
Once a month 9 43
Once a year 1 5
Most respondents (90%, n=19) purchased their food from the small general
dealer. The general dealer had limited stock with little variety of foods available.
Some of the households depended mostly on spaza shops and commercial farm.
The respondents (62%, n=13) did their shopping at Fouriesburg, once a month
after payday, or every second week when money was available. Other household
depended on subsidized food items sold by their farmer.
4.2.4.3 Food bartering - Few people bartered with foods (See Table 4.7).
Only a few respondents (19%, n=4) practised food bartering, but the three most
common foods they bartered with were maize meal, milk and eggs. These foods
were mostly obtained with the aid of food subsidies (milk, eggs), or given as part
of payment in kind by the farmer (maize meal). One litre of milk was sold for one
Rand, and was therefore a suitable product to barter with among farm workers
and those not employed on the farm (See Table 4.8). Most respondents reported
that they did not know anything about food bartering and were therefore not
practising it.

67
4.2.4.4 Gathering – collecting - They gathered large quantities of wild
leaves during summer by picking it from the veldt as an addition to what they had
available in their houses. A variety of different wild leaves and fruits were
collected from the veldt during the different seasons. These were found in
abundance for use in their homes, thereby increasing the household food variety
(See Table 4.11).
TABLE 4.11: DIFFERENT TYPES OF WILD LEAVES GATHERED IN THE
VELDT PER SEASON
WILD VEGETABLES FREQUENCY OF COLLECTION
Summer Autumn Winter Spring All year
round TOTAL
Thepe (pigweed) 15 0 0 6 0 21
Sempaile (mustard) 5 1 6 4 0 16
Papasane (horse radish) 10 0 1 3 1 15
Sebitsa (pepper plant 2 0 12 0 0 14
Seruwe (lambs quarter) 8 0 2 4 0 14
Tlhako ya kgomo (lions tooth) 3 0 0 0 0 3
Seshoa-bohloko (black nightshade) 1 0 1 1 0 3
Tenane (harebell leaves) 2 0 0 0 0 2
Sewediwetla (wild carrot) 2 0 0 0 0 2
Selae (lettuce) 0 0 1 0 0 1
Total 48 1 23 18 1 91
*Large quantities wild vegetables were gathered during specific reasons and not all year round.
All household members gathered food in the veldt in order to have fresh
vegetables. The four most common wild leaves that were gathered and eaten by
the community on Oranje farm were thepe, sempaile, papasane and sebitsa. The
other wild vegetables gathered are tlaku ya kgomo and seruwe. These wild
leaves are generally known as merogo. They are all wild green leafy vegetables
mostly found during summer. The wild vegetable leaves were usually gathered in
the mornings and then dried in the sunlight. They were dried in order to preserve
them for use/consumption in the seasons when they are scarce and not easily
available (See Figure 4.11).

68
FIGURE 4.11: TRADITIONAL WILD VEGETABLES
4.2.4.4.1 Gathering – hunting/fishing
The animals and birds that were hunted were ranked in order, rabbits (mmutla),
springbok (phuthi), guinea fowl (kgaka), hare (pela), steenbok (letsa) and rooikat
(caracal), which, are hunted all year round. They also gathered fish during
summer. Fresh-water fish was found mostly during summer in the nearest small
dam on the farm. Once caught, the fish is gutted and hung in the open air to dry
for later use (See Figure 4.12).
a - Sempaile b - Tlhako ya kgomo
c - Thepe d - Seruwe

69
FIGURE 4.12: DRIED FRESH-WATER FISH
4.2.4.5 Payment in kind – maize meal was the main product monthly
received as payment in kind. Payment in kind is practiced by the farmer to the
farm workers and their families living on the farm. These farm workers receive
food monthly that forms part of their payment, usually in the form of maize meal
(See Table 4.8). Each household receives a large bag (60kg-80kg) of maize meal
depending on their work status and on the number of people employed per
family. Some of the household members use the maize meal to barter with others
purely because of the large quantities involved.
4.2.4.6 Ranking of food accessing strategies
Households that utilize most of the food accessing strategies several times per
month were asked to rank their food accessing strategies according to frequency
of use (See Table 4.12, 4.13 & 4.14).
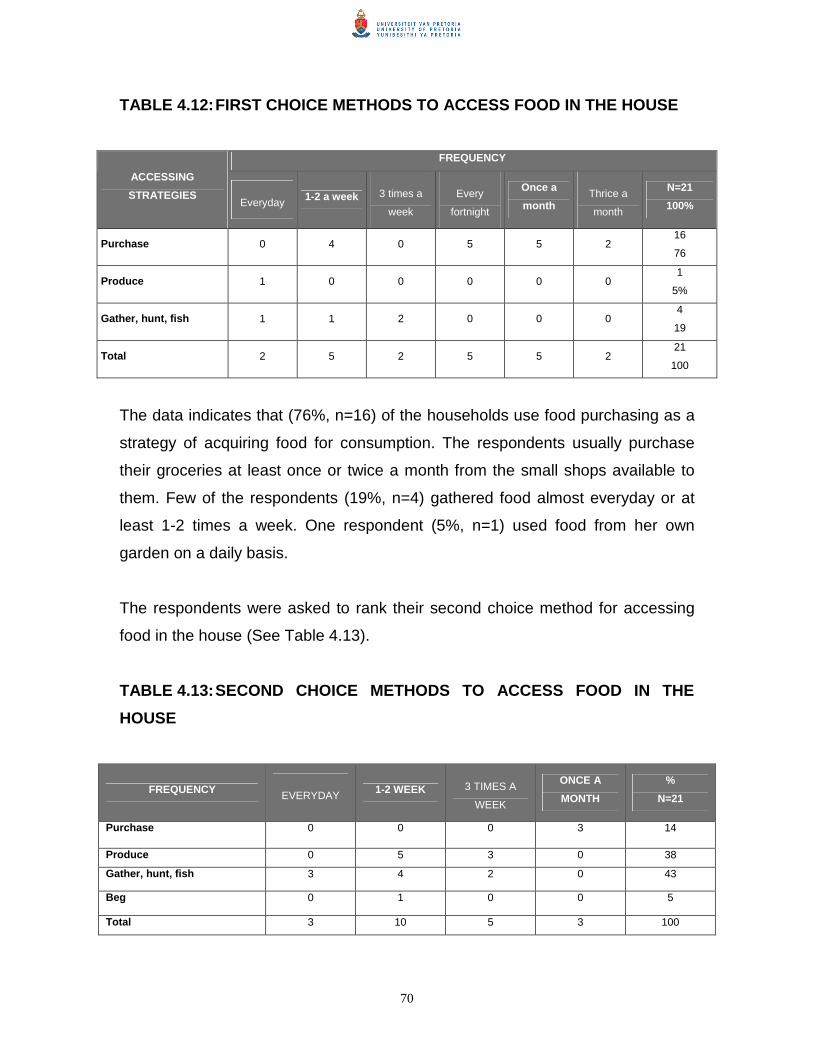
70
TABLE 4.12: FIRST CHOICE METHODS TO ACCESS FOOD IN THE HOUSE
FREQUENCY
ACCESSING
STRATEGIES Everyday 1-2 a week 3 times a
week
Every
fortnight
Once a
month Thrice a
month
N=21
100%
Purchase 0 4 0 5 5 2 16
76
Produce 1 0 0 0 0 0 1
5%
Gather, hunt, fish 1 1 2 0 0 0 4
19
Total 2 5 2 5 5 2 21
100
The data indicates that (76%, n=16) of the households use food purchasing as a
strategy of acquiring food for consumption. The respondents usually purchase
their groceries at least once or twice a month from the small shops available to
them. Few of the respondents (19%, n=4) gathered food almost everyday or at
least 1-2 times a week. One respondent (5%, n=1) used food from her own
garden on a daily basis.
The respondents were asked to rank their second choice method for accessing
food in the house (See Table 4.13).
TABLE 4.13: SECOND CHOICE METHODS TO ACCESS FOOD IN THE
HOUSE
FREQUENCY EVERYDAY 1-2 WEEK 3 TIMES A
WEEK
ONCE A
MONTH
%
N=21
Purchase 0 0 0 3 14
Produce 0 5 3 0 38
Gather, hunt, fish 3 4 2 0 43
Beg 0 1 0 0 5
Total 3 10 5 3 100

71
After purchasing, the second most frequently used method of acquiring food in
the house, is gathering from the veldt (43%, n=9,). Food is usually gathered daily;
once or twice a week; and sometimes three times a week. The respondents were
asked to rank their third method for accessing food in the house and the findings
are illustrated in Table 4.14.
TABLE 4.14: THIRD CHOICE METHODS FOR ACCESSING FOOD IN THE
HOUSE
ACCESSING STRATEGIES EVERYDAY 1-2 TIMES A WEEK
3 TIMES A WEEK
FORT-NIGHTLY
ONCE A MONTH
% N=18
Purchase 0 0 0 0 1 1 6
Produce 3 4 0 0 0 7 38
Receive 1 0 0 0 0 1 6
Gather, hunt and fish 0 5 3 0 0 8 44
Beg 0 0 0 1 0 1 5
Total 4 9 3 1 1 18 100
*Three people reported to have no third choice
The third method of choice for food accessing used by the farm worker
households was again gathering (44%; n=8) as well as producing (38%; n=7).
These methods were used at least once or twice per week.
4.2.5 Dietary diversity issues
This included their meal patterns, venues of eating, meal supplies from home and
the most common foods consumed throughout the whole seasons.
4.2.5.1 Food variety
The eating habits of the different farm worker households were mostly the same
except for a few individuals who were employed in the guesthouse. These
respondents had more varied intakes due to their exposure to food prepared in
the guesthouse.
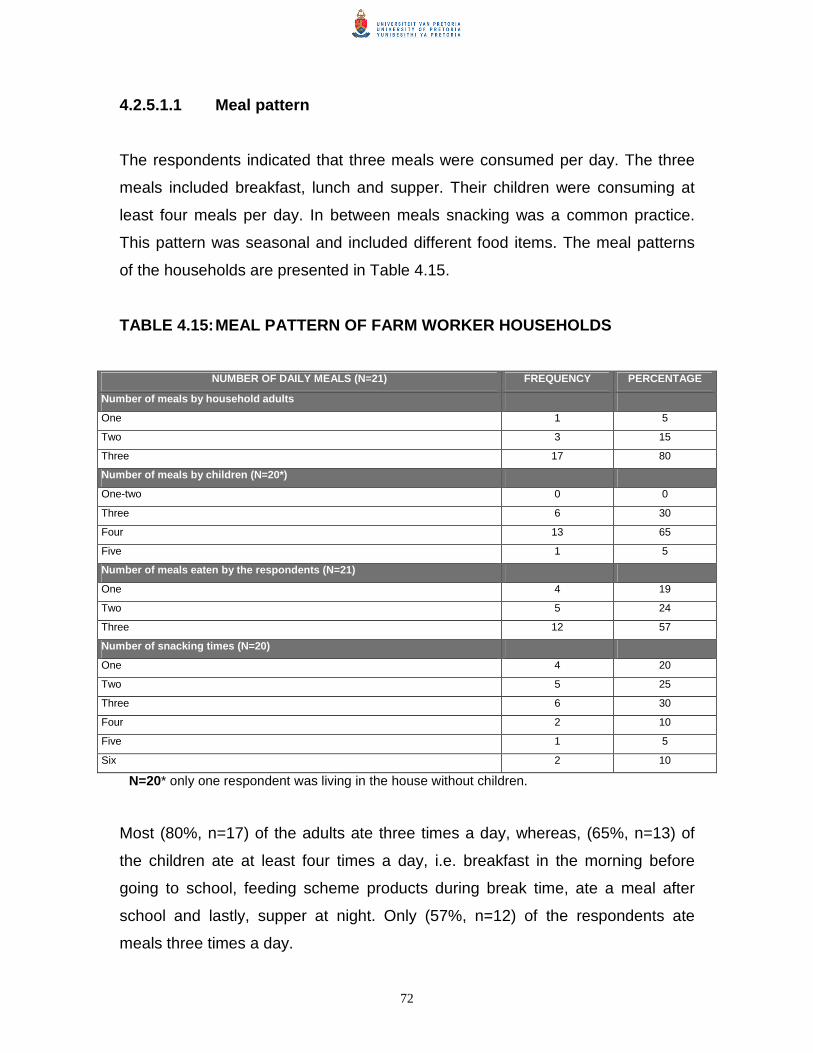
72
4.2.5.1.1 Meal pattern
The respondents indicated that three meals were consumed per day. The three
meals included breakfast, lunch and supper. Their children were consuming at
least four meals per day. In between meals snacking was a common practice.
This pattern was seasonal and included different food items. The meal patterns
of the households are presented in Table 4.15.
TABLE 4.15: MEAL PATTERN OF FARM WORKER HOUSEHOLDS
NUMBER OF DAILY MEALS (N=21) FREQUENCY PERCENTAGE
Number of meals by household adults
One 1 5
Two 3 15
Three 17 80
Number of meals by children (N=20*)
One-two 0 0
Three 6 30
Four 13 65
Five 1 5
Number of meals eaten by the respondents (N=21)
One 4 19
Two 5 24
Three 12 57
Number of snacking times (N=20)
One 4 20
Two 5 25
Three 6 30
Four 2 10
Five 1 5
Six 2 10
N=20* only one respondent was living in the house without children.
Most (80%, n=17) of the adults ate three times a day, whereas, (65%, n=13) of
the children ate at least four times a day, i.e. breakfast in the morning before
going to school, feeding scheme products during break time, ate a meal after
school and lastly, supper at night. Only (57%, n=12) of the respondents ate
meals three times a day.
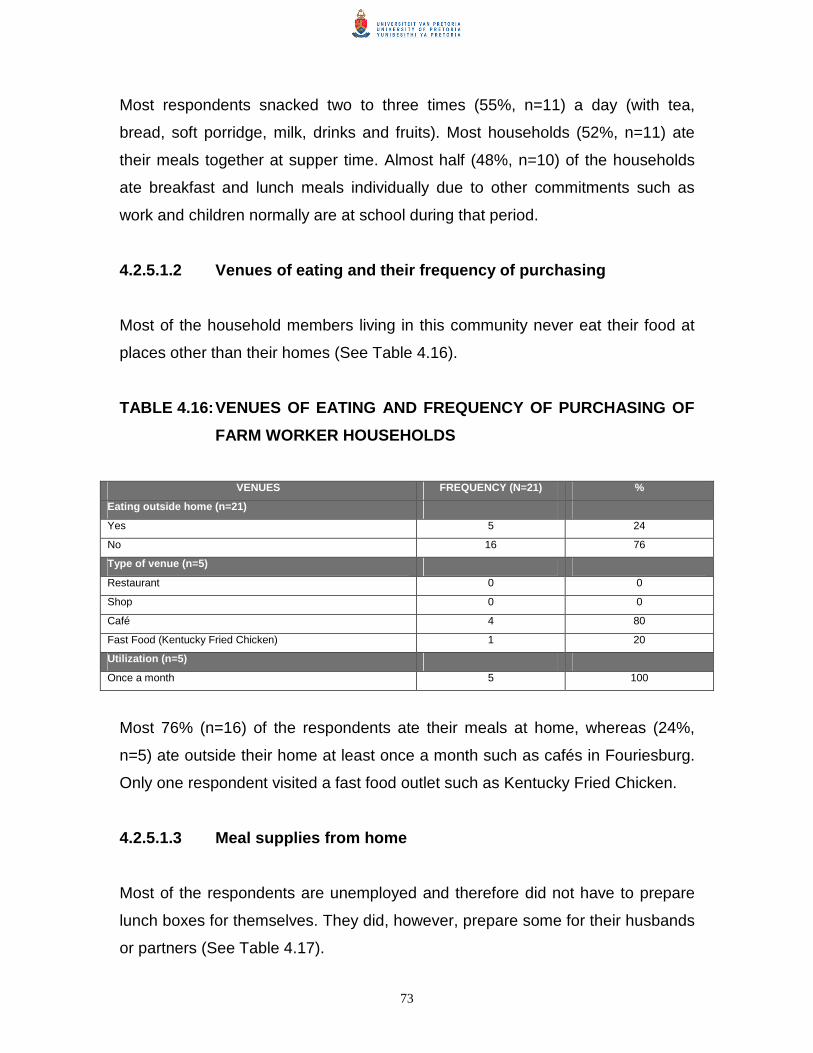
73
Most respondents snacked two to three times (55%, n=11) a day (with tea,
bread, soft porridge, milk, drinks and fruits). Most households (52%, n=11) ate
their meals together at supper time. Almost half (48%, n=10) of the households
ate breakfast and lunch meals individually due to other commitments such as
work and children normally are at school during that period.
4.2.5.1.2 Venues of eating and their frequency of purchasing
Most of the household members living in this community never eat their food at
places other than their homes (See Table 4.16).
TABLE 4.16: VENUES OF EATING AND FREQUENCY OF PURCHASING OF
FARM WORKER HOUSEHOLDS
VENUES FREQUENCY (N=21) %
Eating outside home (n=21)
Yes 5 24
No 16 76
Type of venue (n=5)
Restaurant 0 0
Shop 0 0
Café 4 80
Fast Food (Kentucky Fried Chicken) 1 20
Utilization (n=5)
Once a month 5 100
Most 76% (n=16) of the respondents ate their meals at home, whereas (24%,
n=5) ate outside their home at least once a month such as cafés in Fouriesburg.
Only one respondent visited a fast food outlet such as Kentucky Fried Chicken.
4.2.5.1.3 Meal supplies from home
Most of the respondents are unemployed and therefore did not have to prepare
lunch boxes for themselves. They did, however, prepare some for their husbands
or partners (See Table 4.17).
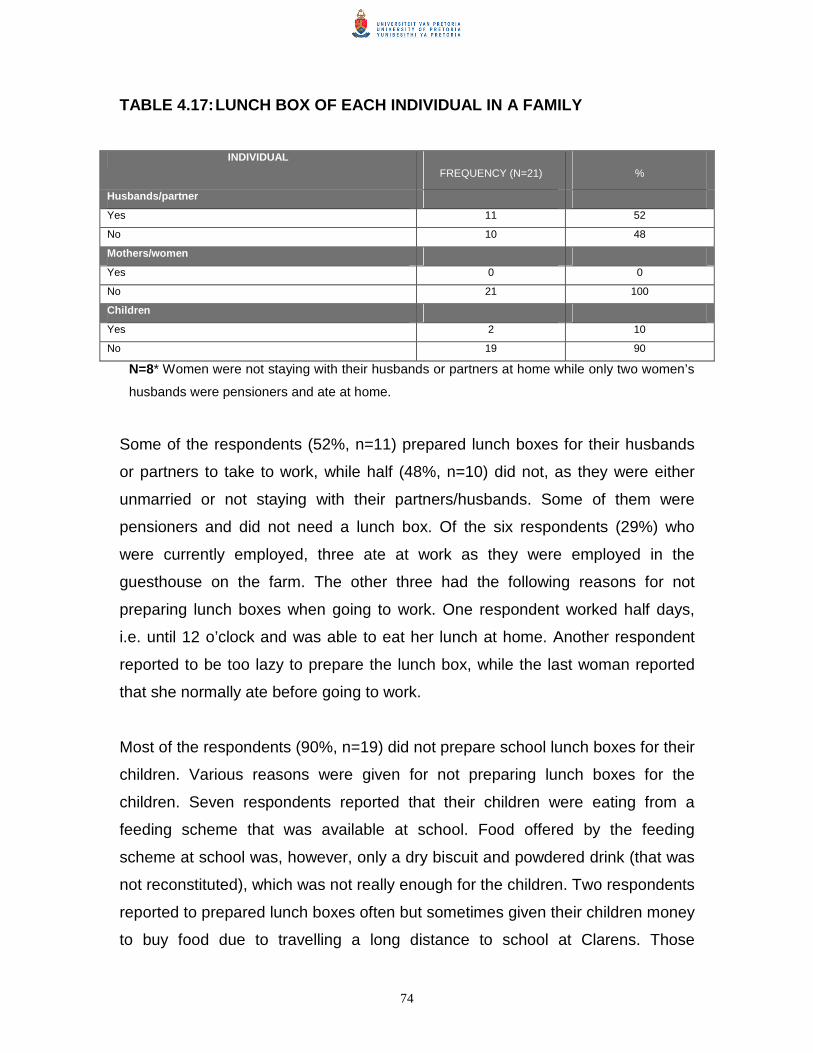
74
TABLE 4.17: LUNCH BOX OF EACH INDIVIDUAL IN A FAMILY
INDIVIDUAL
FREQUENCY (N=21) %
Husbands/partner
Yes 11 52
No 10 48
Mothers/women
Yes 0 0
No 21 100
Children
Yes 2 10
No 19 90
N=8* Women were not staying with their husbands or partners at home while only two women’s
husbands were pensioners and ate at home.
Some of the respondents (52%, n=11) prepared lunch boxes for their husbands
or partners to take to work, while half (48%, n=10) did not, as they were either
unmarried or not staying with their partners/husbands. Some of them were
pensioners and did not need a lunch box. Of the six respondents (29%) who
were currently employed, three ate at work as they were employed in the
guesthouse on the farm. The other three had the following reasons for not
preparing lunch boxes when going to work. One respondent worked half days,
i.e. until 12 o’clock and was able to eat her lunch at home. Another respondent
reported to be too lazy to prepare the lunch box, while the last woman reported
that she normally ate before going to work.
Most of the respondents (90%, n=19) did not prepare school lunch boxes for their
children. Various reasons were given for not preparing lunch boxes for the
children. Seven respondents reported that their children were eating from a
feeding scheme that was available at school. Food offered by the feeding
scheme at school was, however, only a dry biscuit and powdered drink (that was
not reconstituted), which was not really enough for the children. Two respondents
reported to prepared lunch boxes often but sometimes given their children money
to buy food due to travelling a long distance to school at Clarens. Those

75
respondents that prepared lunch boxes for their children mostly provided stiff
maize meal porridge with fried eggs.
4.2.5.2 Common foods accessed through different food accessing
strategies
The most common food consumed by the community was the same for each
household. They followed the same routine everyday. Every morning the women
went to collect some wild leaves in the veldt, which they then prepared upon their
return. The preparation method was similar for all the women. They normally
cooked their traditional merogo with water and towards the end added a little bit
of sunflower oil and curry powder for some flavour. Table 4.18 shows seasonal
data collected from 2003 and 2004 at different periods during the year. A dietary
diversity list of individual foods and food groups was used (See Addendum B).
This list was compiled during a pilot study from the foods that they usually ate in
a period of seven days.

76
TABLE 4.18: MOST COMMON FOODS CONSUMED DURING EARLY SUMMER, LATE SUMMER, AUTUMN, WINTER AND SPRING ON ORANJE FARM
FOOD
GROUPS
COMMON FOOD
(CORE FOODS)
EARLY SUMMER
(LATE NOVEMBER -
DECEMBER)
LATE SUMMER
(JANUARY-
FEBRUARY)
AUTUMN
(MARCH-MAY)
WINTER
(JUNE-AUGUST)
SPRING
(SEPTEMBER-EARLY
NOVEMBER)
CCeerreeaallss Maize meal porridge
Brown bread
Maize meal stiff porridge
Soft porridge
Brown bread
Rice
Maize meal stiff porridge
Brown bread
Rice
Samp
Mageu
Maize meal stiff porridge
Brown bread
Dumpling
Maize meal stiff porridge
Soft porridge
Mabela soft porridge
Brown bread
Maize meal stiff porridge
Soft porridge
Brown bread
VVeeggeettaabblleess Potatoes
OOnniioonnss
Tomatoes
Cabbage
Wild vegetables(Merogo)
Potatoes
Onions
Tomatoes
Cabbage
Wild vegetables(Merogo)
Potatoes
Onions
Tomatoes
Cabbage
Green-beans
Wild vegetables(Merogo)
Potatoes
OOnniioonnss
Tomatoes
Cabbage
Carrots
Pumpkin
Corn on the cob
Spinach
Rapp
Sugar beans
Wild vegetables(Merogo)
Potatoes
OOnniioonnss
Tomatoes
Cabbage
Sugar beans
Wild vegetables(Merogo)
Potatoes
OOnniioonnss
Tomatoes
Cabbage
Spinach
Sugar beans
Wild vegetables(Merogo)
Fruits Apple
Peaches/Apricots
Apple
Peaches/Apricots
Apple
Peaches/Apricots
Apple Apple
Orange
Apple
Banana
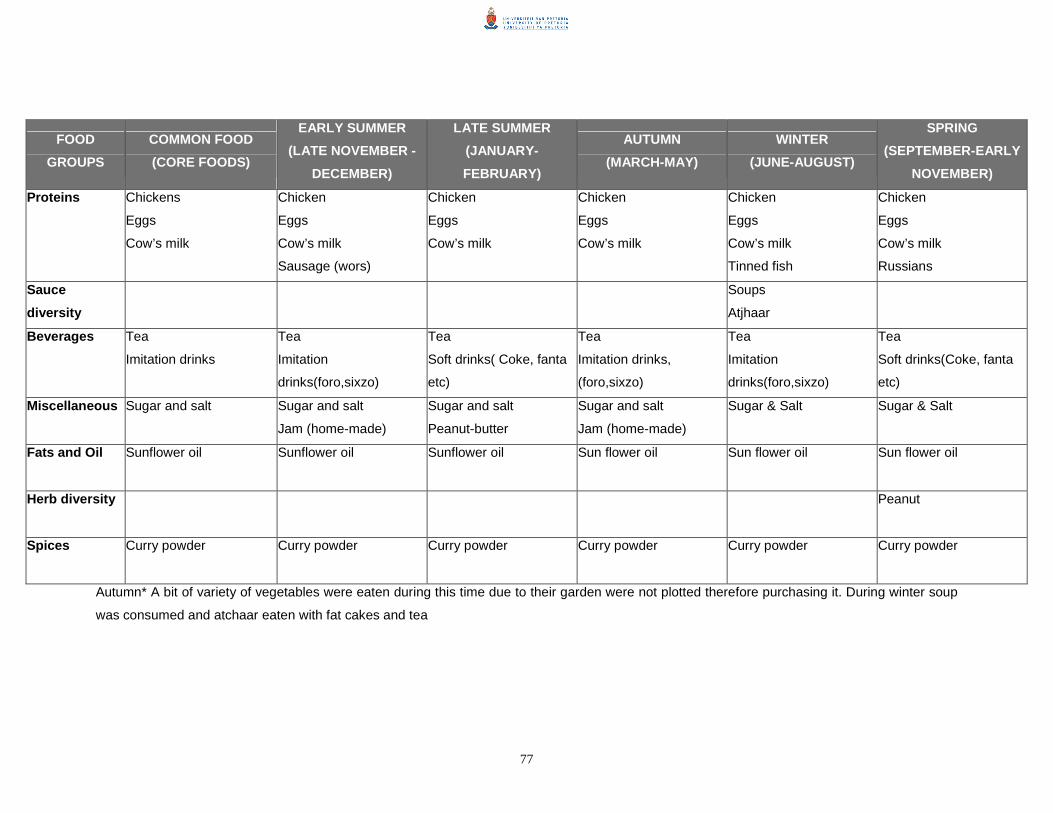
77
FOOD
GROUPS
COMMON FOOD
(CORE FOODS)
EARLY SUMMER
(LATE NOVEMBER -
DECEMBER)
LATE SUMMER
(JANUARY-
FEBRUARY)
AUTUMN
(MARCH-MAY)
WINTER
(JUNE-AUGUST)
SPRING
(SEPTEMBER-EARLY
NOVEMBER)
Proteins Chickens
Eggs
Cow’s milk
Chicken
Eggs
Cow’s milk
Sausage (wors)
Chicken
Eggs
Cow’s milk
Chicken
Eggs
Cow’s milk
Chicken
Eggs
Cow’s milk
Tinned fish
Chicken
Eggs
Cow’s milk
Russians
Sauce
diversity
Soups
Atjhaar
Beverages Tea
Imitation drinks
Tea
Imitation
drinks(foro,sixzo)
Tea
Soft drinks( Coke, fanta
etc)
Tea
Imitation drinks,
(foro,sixzo)
Tea
Imitation
drinks(foro,sixzo)
Tea
Soft drinks(Coke, fanta
etc)
Miscellaneous Sugar and salt Sugar and salt
Jam (home-made)
Sugar and salt
Peanut-butter
Sugar and salt
Jam (home-made)
Sugar & Salt Sugar & Salt
Fats and Oil Sunflower oil Sunflower oil Sunflower oil Sun flower oil Sun flower oil Sun flower oil
Herb diversity Peanut
Spices Curry powder Curry powder Curry powder Curry powder Curry powder Curry powder
Autumn* A bit of variety of vegetables were eaten during this time due to their garden were not plotted therefore purchasing it. During winter soup
was consumed and atchaar eaten with fat cakes and tea
78
All the households consumed maize meal stiff porridge and bread most
frequently as their staple food. The same vegetables were consumed in every
household (See Table 4.18). The preferred fruit reported to be affordable was
apples, while the other fruits were eaten mostly during harvesting time in
summer. The proteins consumed came from chicken, eggs and cow’s milk.
The milk and eggs were also purchased from the farmer at a subsidized price.
The most affordable drink was tea and the cheap imitation cold drinks that
they purchased from the spaza shop, for example foro, sixo, drink o’pop and
cool-aid sweet. They used sugar and salt for cooking, or in their tea etc. For
flavour, curry powder was used.
4.2.6 Dietary diversity scores
4.2.6.1 Interpretation of dietary diversity data
The variety of foods eaten by the households was investigated by calculating
the number of foods consumed over a period of seven days, similar to
previous research done (Hatloy et al, 1998: 893). A list of food items from
various identified food groups, as specifically those that are indicative of
dietary diversity (Hatloy et al, 1998:893), was compiled and used to
investigate what food the farm worker households consumed and normally
purchased (See Addendum B). The list was compiled from a basic food list
and additions were made to complete the list to include those food items
typically consumed in this area and by this cultural group. The list was then
tested out in a pilot study conducted in this community of all the types of foods
that they typically consumed over a period of seven days. The food list was
again adapted to omit foods never used and by adding those that were left out
before.
Investigations were done using these compiled lists in the four different
seasons in order to describe seasonal variation. During summer, the
investigations were done twice because of the longer duration of the summer
season in South Africa. Therefore five seasonal periods were used, namely
early summer, late summer, autumn, winter and spring. During the early

79
summer, most of the people still consumed a limited variety of food as most
foods produced only delivered products that were available to consume later
in summer. Late summer therefore tended to be a period with a higher variety
in diet.
To evaluate the food variety scores it would be unfair to expect all the
members of the community to consume all possible food items. Therefore, the
utilization of foods in normal diets was considered. A summary of food intake
with complete menu items (gained from 24 hour-recall data from Moopa –
research report in progress) consumed by household members on Oranje
farm was used to compile a scoring system for low, medium and high intakes
of various food items, in order to analyze the food variety scores (FVS) and
food group diversity scores (FGDS).
The actual number of different food items used was counted to give full details
of food consumed by household members in seven days. These included their
breakfasts, lunches, suppers and the types of food that they snacked on
between meals. Three different sample menus were used to calculate low,
medium and high individual food variety. For high variety, a normal diet with a
highly varied meal plan was used to generally recommend a varied food
intake that considered all basic food groups. For medium variety, a highly
varied diet for food availability, as observed on Oranje farm was used, and for
low variety, the standard diets as observed on Oranje farm, as compared with
very low numbers of food, was used.
Sample menus of these examples will be reported in Tables 4.19 to 4.21 and
subsequently discussed. The variety was calculated in a similar way as with
the scoring system – each food type is counted only once in a day. In other
words the variety does not concern the number of portions consumed, but
only the types of food mentioned. Maize meal would therefore only count
once. The current menu of low-income households as observed from 24h-
recall data included a low variety of food items (See Table 4.19).

80
TABLE 4.19: CURRENT MENU OF LOW-INCOME HOUSEHOLD
MEMBERS ON ORANJE FARM (LOW VARIETY)
MENU VARIETY OF FOODS CONSUMED IN 7 DAYS
Breakfast
3 cups of soft porridge with sugar
3-4 Slices of brown bread with
home made jam
Tea with sugar
Milk
1
1
1
1
Snack
2 cups of mageu (home made) or sometimes bought
1
Lunch
300g Stiff maize meal porridge/ bread
Eggs/ chicken feet & heads/ chicken liver/ dried beans
Traditional merogo
Spinach/cabbage/pumpkin/tomatoes/onions
1
4
1
5
Snack
Bread with home made jam
Tea with sugar and milk
Apple
1
Supper Same as lunch
Total count of consumed items 17 *Tea and sugar are not considered as nutritious foods. Every food item is counted once and
not repeated.
Firstly the above meal pattern (menu) was used/ consumed by household
members on Oranje farm in seven days (See Table 4.19). It included all the
common foods that were consumed by household members in this community
on a daily basis. Secondly, a menu that represented a family utilizing medium
variety compared to those with limited income was constructed from the 24h-
recalls of this community (See Table 4.20).

81
TABLE 4.20: TYPICAL MENU CONSUMED BY HOUSEHOLD MEMBERS
ON ORANJE FARM (MEDIUM VARIETY)
MENU VARIETY OF FOOD CONSUMED IN
7 DAYS
Breakfast
Soft maize meal porridge with
milk and sugar
Brown bread with
Home made jam or
Peanut butter
Tea with sugar and
Cow’s milk (unpasteurized)
1
1
1
1
1
1
Snack
Tea with milk and sugar
Brown bread with
Home made jam or
Peanut butter
Mageu
1
Lunch
Pap/ Rice /Bread /Dumpling /Stamp
Eggs/ Cow milk/Tinned fish/ Chicken feet &heads/ chicken pierces/ chicken livers/
meat bones
Soya beans/ Russians/ Wors
Traditional merogo
Other vegetables: Spinach/ onions/tomatoes/ pumpkin/ cabbage/ potatoes/ green
beans/ carrots
5
3
3
3
1
8
Supper
Similar to lunch
(They prepare more food for supper during lunch time)
Fruits in between meals
Apples/ Bananas/Orange
Peaches and Apricots and grapes (specially during summer)
3
3
Total amount of foods consumed 36
*Tea and sugar are not considered as nutritious foods. Every food item is counted once and
not repeated.
Thirdly, a recommended (or ideal) normal menu with very high variety
(according to the guidelines under ideal circumstances) was compiled to use
in comparison with the menu consumed by the household members on Oranje
farm in order to calculate the ideal number of foods to be eaten by an
individual in seven days. This menu served as an example of a balanced meal
or a recommended menu that included all the different food items which must
be eaten each daily by an individual. This is a menu that could be used by an

82
individual despite their race, or culture, with a greater variety of food and
higher income levels (See Table 4.21).
TABLE 4.21: NORMAL RECOMMENDED MENU CONSUMED BY AN
INDIVIDUAL PERSON (HIGH VARIETY)
MENU VARIETY OF FOOD CONSUMED IN 7 DAYS
Breakfast
Cereals
Milk
Proteins
7
1
7
Snack
Starch
Fillings
7
7
Lunch
Starch
Protein
Vegetables
7
7
7
Snack
Fruits
7
Supper
Starch
Protein
2 vegetable A & B
7
7
14
Total count of foods 84
7 items indicate a different food item used every day of the week
These menus were used in interpreting the data, in order to calculate a food
variety score that have a greater variety of foods providing nutrients needed
by the body. It was concluded that less than 30 food items consumed over a
period of seven days would indicate low variety. More than 30 foods, but less
than 60 (30-60) foods would indicate medium variety, while more than 60
foods would indicate a high variety of foods consumed over seven days.
4.2.6.2 Dietary diversity from 12 mixed food groups
The number of food groups used in the analysis of dietary diversity data
varied throughout the reported research (Ruel, 2002:29). The food variety
scores over 151 individual food items and food group diversity scores were
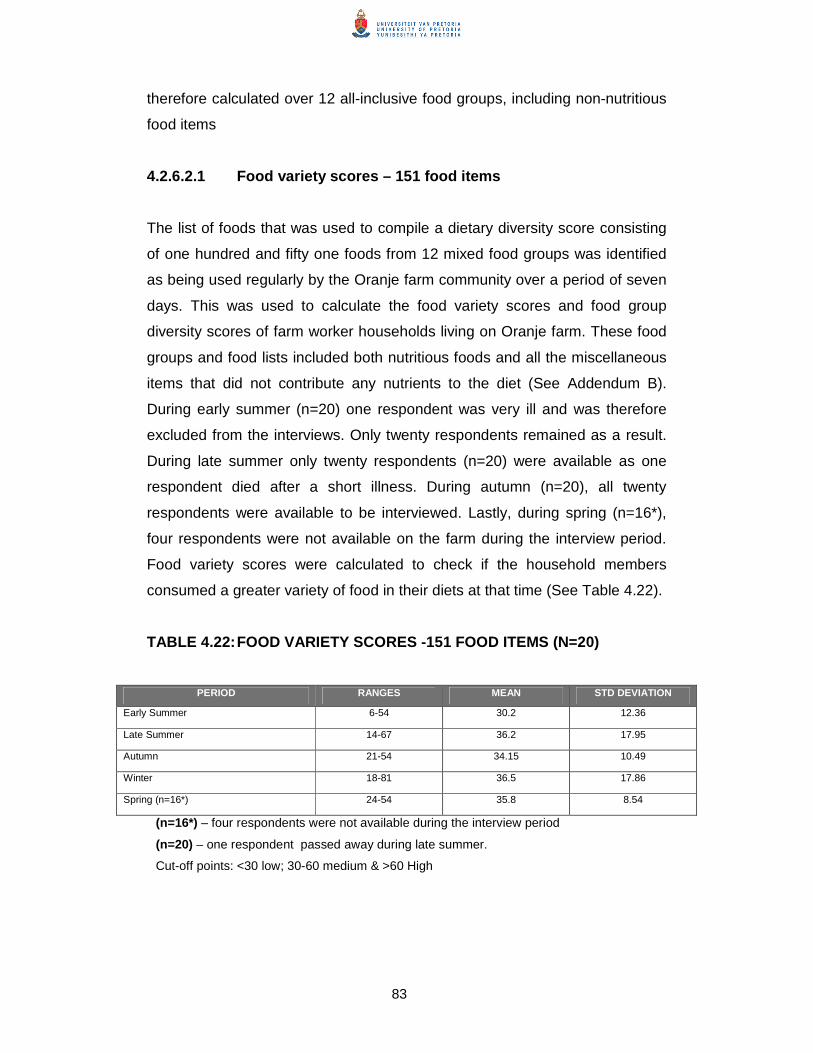
83
therefore calculated over 12 all-inclusive food groups, including non-nutritious
food items
4.2.6.2.1 Food variety scores – 151 food items
The list of foods that was used to compile a dietary diversity score consisting
of one hundred and fifty one foods from 12 mixed food groups was identified
as being used regularly by the Oranje farm community over a period of seven
days. This was used to calculate the food variety scores and food group
diversity scores of farm worker households living on Oranje farm. These food
groups and food lists included both nutritious foods and all the miscellaneous
items that did not contribute any nutrients to the diet (See Addendum B).
During early summer (n=20) one respondent was very ill and was therefore
excluded from the interviews. Only twenty respondents remained as a result.
During late summer only twenty respondents (n=20) were available as one
respondent died after a short illness. During autumn (n=20), all twenty
respondents were available to be interviewed. Lastly, during spring (n=16*),
four respondents were not available on the farm during the interview period.
Food variety scores were calculated to check if the household members
consumed a greater variety of food in their diets at that time (See Table 4.22).
TABLE 4.22: FOOD VARIETY SCORES -151 FOOD ITEMS (N=20)
PERIOD RANGES MEAN STD DEVIATION
Early Summer 6-54 30.2 12.36
Late Summer 14-67 36.2 17.95
Autumn 21-54 34.15 10.49
Winter 18-81 36.5 17.86
Spring (n=16*) 24-54 35.8 8.54
(n=16*) – four respondents were not available during the interview period
(n=20) – one respondent passed away during late summer.
Cut-off points: <30 low; 30-60 medium & >60 High

84
According to Hatloy et al. (1998:893), the food variety score (FVS) is defined as
the number of different individual food items consumed over a seven-day period.
The food variety score was calculated using one hundred and fifty one food items
– these were the number of different mixed food items mentioned by the whole
community for the particular time period researched. The least number of food
items consumed in seven days varied from six to twenty four food items, which
relates to a variety of only one to three different food items per day.
The highest number of food items consumed varied between 54 and 81, which
relates to seven to eleven different items per day. The mean intake for all the
seasons varied between 30.2 and 36.5 which relate to 4 to 5 different food items
per day. During both early summer and late summer, similar results were found.
Half of the respondents (n=10) had low scores as they consumed less than 30
different food items in seven days. The remaining half (n=10) consumed more
than 30 foods but less than 60, thus achieving a medium food variety score.
During the winter it seemed as if the respondents had tried to eat a better variety
of foods, as they consumed 18-81 food items, however, more than half (n=11)
still consumed less than 30 foods in seven days. Seven respondents had
medium scores and consumed more than 30 foods, while only two respondents
(n=2) actually qualified as having high scores, as they consumed more than 60
foods in seven days. Only one person consumed 81 food items in seven days.
This could be attributed to the high variety of foods that the two full time
employees ate at the guesthouse on the farm during working hours. During
autumn (55%, n=11) and spring (n=81.25%, n=13), most respondents had
medium scores, as they consumed more than 30 foods but less than 60 foods in
seven days.

85
4.2.6.2.2 Food group diversity scores – 12 food groups
Once the food variety scores had been calculated, the food group diversity
scores were calculated to assess whether the household members consumed an
adequate variety of the twelve different groups of foods in their diets (See Table
4.23).
TABLE 4.23: FOOD GROUP DIVERSITY SCORES – 12 FOOD GROUPS
(N=20)
PERIOD RANGES MEAN STD DEVIATION
Early Summer 4-12 9.3 1.980
Late Summer 8-12 9.55 1.225
Autumn 8-11 9.6 0.882
Winter 9-12 10.65 0.745
Spring (n=16*) 8-12 10.62 1.024
(n=16*) – four respondents were not available during the interview period
(n=20) – one respondent passed away during late summer.
Cut-off points: Low=1-4; Medium= 5-7; High= 8-12
The food group diversity score (FGDS) was defined by Hatloy (1998:893) as the
number of food groups consumed over a period of seven days. The maximum
score that could be achieved was twelve, from all the food groups utilized in
seven days (See Addendum B). The food group diversity score was calculated
from all the individual mixed food items used during the seven days from the
identified twelve food groups. The food group scores were high in all the
seasons, indicating good variety with regard to utilization of the different food
groups. All the respondents consumed eight to twelve food groups in seven days.
The lowest intake occurred in early summer when only four food groups were
used, and it was only in autumn where they did not consume all the food groups.
The mean Dietary diversity score varied between 9.3 to 10.65 between the five
seasons

86
4.2.6.3 Dietary diversity from nine nutritious food groups
The food variety scores and food group diversity scores were calculated over
nine (9) nutritious food groups(See Addendum C) in order to determine if the
variety of nutritious food items consumed would be different to the variety of food
items including non-nutritious food items like beverages and spices actually
consumed. In previous research it was apparent that twelve (12) mixed food
groups, including all possible food items, were used widely. During 2004-2005 a
working group of the FAO came together and decided to use only the nine
nutritious food groups to indicate variety (Steyn, Nel, Nantel, Kennedy, &
Labadarios 2006: 645). This was used to assess the following:
• the effect of miscellaneous food items
• nutritious foods eaten more often or not.
4.2.6.3.1 Food variety scores – 109 food items
A second analysis was done using only the nine (9) nutritious food groups, in
order to determine if the variety of nutritious items consumed would be different
to the variety of items including non-nutritious food items, such as beverages and
spices. This analysis used only the nine food groups contributing nutrients to the
diet from the established food variety list and therefore only utilized 151 food
items. These 151 food items consumed by this community were thus re-allocated
to the new grouping and re-evaluated. The variety of food items eaten by the
households was investigated in the same manner by calculating the number of
foods consumed (from these nine groups) over a period of seven day days (See
Addendum C). These new groups did not include all the miscellaneous food
items that do not contribute nutrients to the diet. The list was compiled similar to
the first list, but due to the lowered number of food groups, only one hundred and
nine foods were used to calculate the new food variety and food group diversity
scores of the community on Oranje farm. The calculations were done for the
same periods as before (early summer, late summer, autumn, winter and spring).
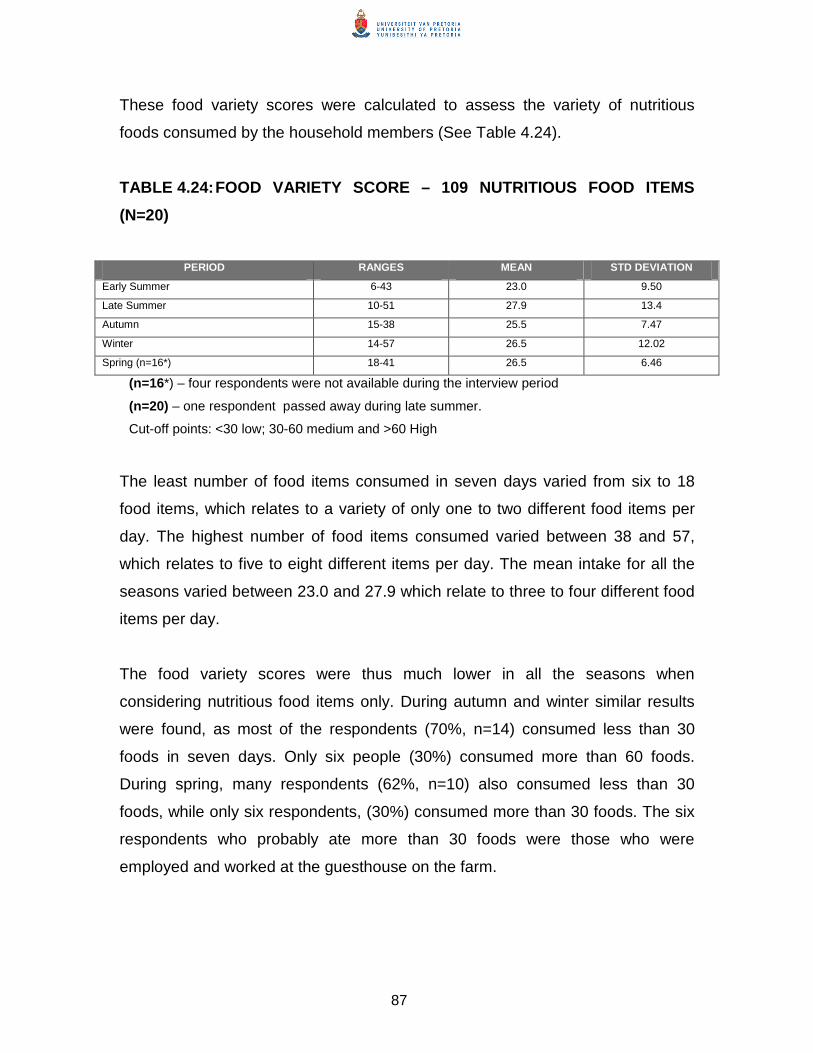
87
These food variety scores were calculated to assess the variety of nutritious
foods consumed by the household members (See Table 4.24).
TABLE 4.24: FOOD VARIETY SCORE – 109 NUTRITIOUS FOOD ITEMS
(N=20)
PERIOD RANGES MEAN STD DEVIATION
Early Summer 6-43 23.0 9.50
Late Summer 10-51 27.9 13.4
Autumn 15-38 25.5 7.47
Winter 14-57 26.5 12.02
Spring (n=16*) 18-41 26.5 6.46
(n=16*) – four respondents were not available during the interview period
(n=20) – one respondent passed away during late summer.
Cut-off points: <30 low; 30-60 medium and >60 High
The least number of food items consumed in seven days varied from six to 18
food items, which relates to a variety of only one to two different food items per
day. The highest number of food items consumed varied between 38 and 57,
which relates to five to eight different items per day. The mean intake for all the
seasons varied between 23.0 and 27.9 which relate to three to four different food
items per day.
The food variety scores were thus much lower in all the seasons when
considering nutritious food items only. During autumn and winter similar results
were found, as most of the respondents (70%, n=14) consumed less than 30
foods in seven days. Only six people (30%) consumed more than 60 foods.
During spring, many respondents (62%, n=10) also consumed less than 30
foods, while only six respondents, (30%) consumed more than 30 foods. The six
respondents who probably ate more than 30 foods were those who were
employed and worked at the guesthouse on the farm.

88
The guesthouse serves food daily and is a venue for function such as weddings
and large receptions and guests are always visiting. These respondents have to
cook and prepare beds for them. They have the opportunity to taste different
types of foods prepared for the guests. During winter, the ranges were high due
to the fact that a funeral was catered for on the farm, and the respondents
working in the guesthouse had the time and opportunity to eat more foods.
During early summer, more respondents (80%, n=16) consumed less than 30
foods and the remaining three (20%) consumed less than 30 foods with only one
who consumed 43 foods in seven days. This might be due to most of the
respondents reported to be saving money for Christmas in order to purchase
good food items for Christmas. This explains why the average mean for early
summer was lower than the overall scores for the other seasons.
This was in contrast with late summer where more respondents consumed more
food items because of Christmas time. Most of the households prepared and
bought a greater variety of foods. Almost half of the respondents (45%, n=8)
consumed 30-50 foods, and only one consumed 51 foods in seven days.
4.2.6.3.2 Food group diversity scores – nine food groups
Food group diversity scores were calculated to assess whether the household
members consumed food items from different nutritious food groups to have a
greater variety in their diets (See Table 4.25).

89
TABLE 4.25: FOOD GROUP DIVERSITY SCORE - NINE NUTRITIOUS FOOD
GROUPS (N=20)
PERIOD RANGES MEAN STD DEVIATION
Early Summer 4-9 7.9 1.21
Late Summer 6-9 8.1 1.02
Autumn 7-9 8.45 0.605
Winter 8-9 8.8 0.410
Spring (n=16*) 8-9 8.62 0.50
(n=16*) – four respondents were not available during the interview period
(n=20) – one respondent passed away during late summer.
Cut-off points: Low= 1-4; Medium= 5-6 ; High= 7-9
The food group diversity score was calculated over nine nutritious food groups
used over seven days. The FGDS was high in almost all the seasons. During
autumn, winter and spring similar results were found. During autumn most
respondents (95%, n=19) consumed from eight to nine food groups, while all the
respondents that were available during spring (100%, n=16) consumed eight to
nine food groups in seven days. These indicate high diversity scores. During
early summer most respondents (90%, n=18) also consumed seven to nine
groups in seven days. During late summer, most respondents (90%, n=18)
consumed seven to nine food groups and only two people (10%) had a medium
score as they consumed six food groups in seven days. The mean dietary
diversity scores varied between 7.9 to 8.8 between the five seasons.
4.2.7 Food variety scores from the nine nutritious food groups
Although most food groups were consumed in seven days, resulting in “high”
dietary diversity, it was clear in this community that the numbers of food items
(individual food variety) eaten within the various food groups were low. To
provide a better understanding of the variety experienced within the various
groups, the number of food items eaten in seven days per group by each
respondent were calculated and compared with one another.

90
The diet was classified according to nine food groups as recommended by FAO
(Steyn et al, 2006:645). The number of respondents who had consumed similar
quantities of food items in the groups could be grouped together to show how
many items were mostly consumed per group (See Table 4.26, 4.27 & 4.28).
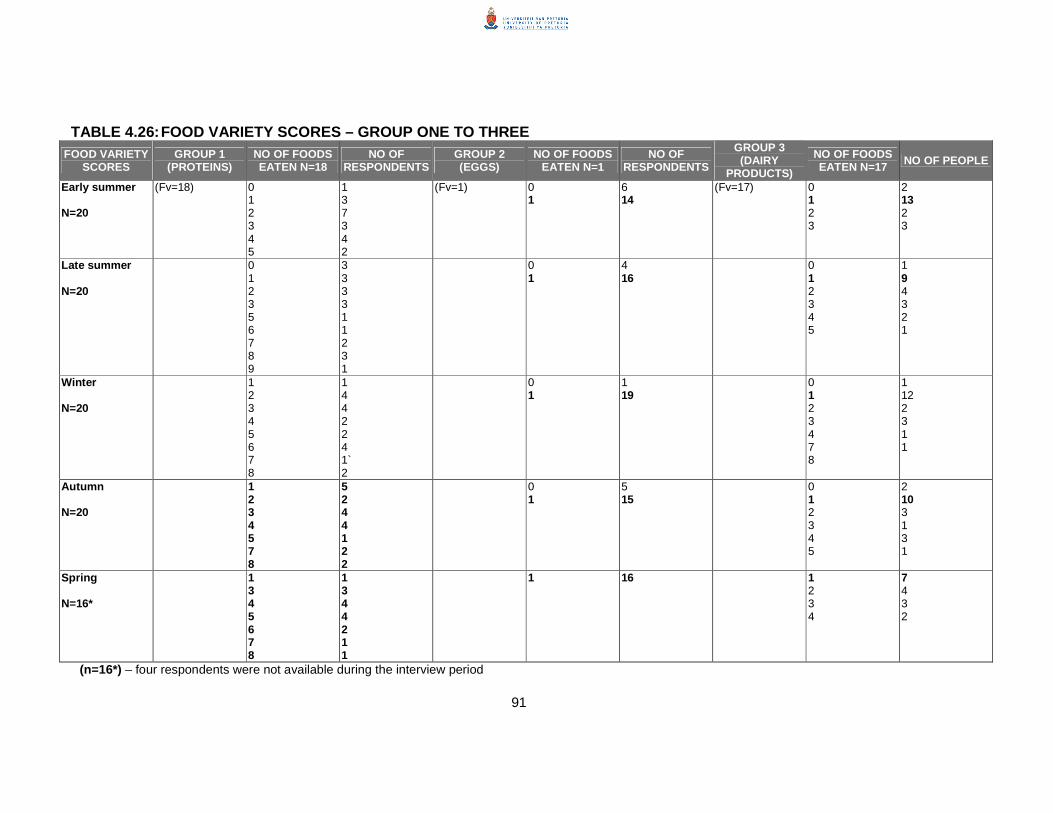
91
TABLE 4.26: FOOD VARIETY SCORES – GROUP ONE TO THREE FOOD VARIETY
SCORES GROUP 1
(PROTEINS) NO OF FOODS EATEN N=18
NO OF RESPONDENTS
GROUP 2 (EGGS)
NO OF FOODS EATEN N=1
NO OF RESPONDENTS
GROUP 3 (DAIRY
PRODUCTS)
NO OF FOODS EATEN N=17 NO OF PEOPLE
Early summer N=20
(Fv=18) 0 1 2 3 4 5
1 3 7 3 4 2
(Fv=1) 0 1
6 14
(Fv=17) 0 1 2 3
2 13 2 3
Late summer N=20
0 1 2 3 5 6 7 8 9
3 3 3 3 1 1 2 3 1
0 1
4 16
0 1 2 3 4 5
1 9 4 3 2 1
Winter N=20
1 2 3 4 5 6 7 8
1 4 4 2 2 4 1` 2
0 1
1 19
0 1 2 3 4 7 8
1 12 2 3 1 1
Autumn N=20
1 2 3 4 5 7 8
5 2 4 4 1 2 2
0 1
5 15
0 1 2 3 4 5
2 10 3 1 3 1
Spring N=16*
1 3 4 5 6 7 8
1 3 4 4 2 1 1
1 16 1 2 3 4
7 4 3 2
(n=16*) – four respondents were not available during the interview period
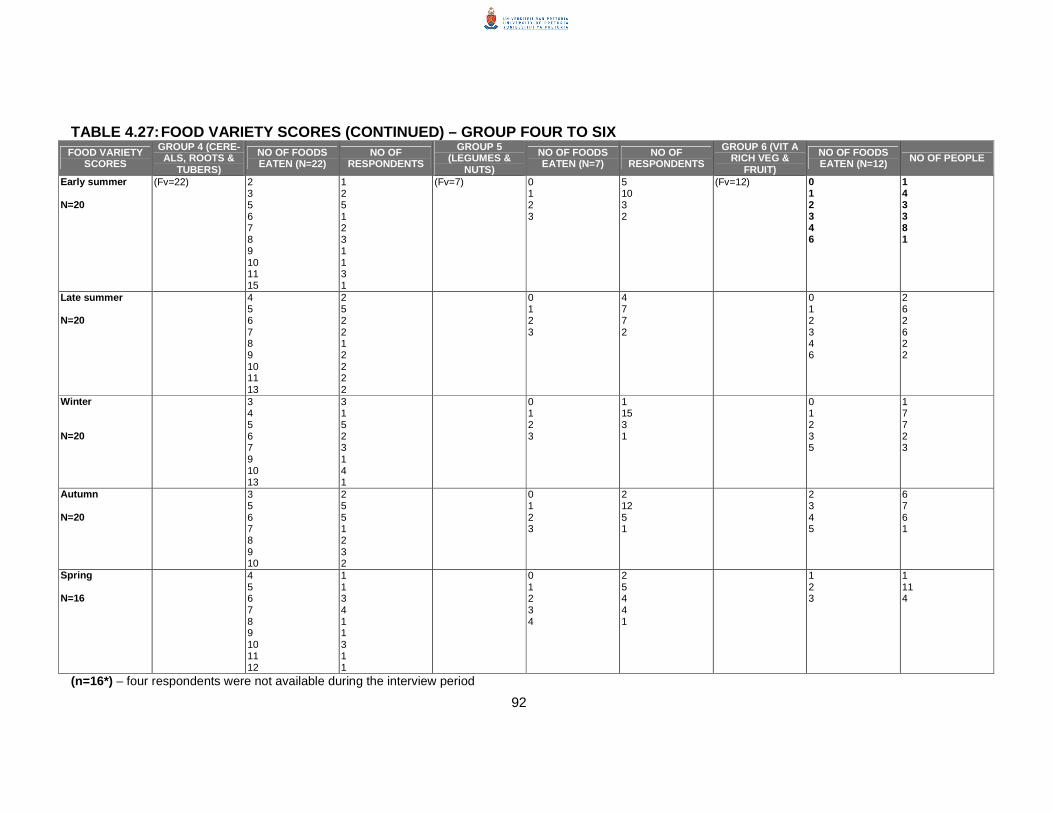
92
TABLE 4.27: FOOD VARIETY SCORES (CONTINUED) – GROUP FOUR TO SIX FOOD VARIETY
SCORES
GROUP 4 (CERE-ALS, ROOTS &
TUBERS)
NO OF FOODS EATEN (N=22)
NO OF RESPONDENTS
GROUP 5 (LEGUMES &
NUTS)
NO OF FOODS EATEN (N=7)
NO OF RESPONDENTS
GROUP 6 (VIT A RICH VEG &
FRUIT)
NO OF FOODS EATEN (N=12) NO OF PEOPLE
Early summer N=20
(Fv=22) 2 3 5 6 7 8 9 10 11 15
1 2 5 1 2 3 1 1 3 1
(Fv=7) 0 1 2 3
5 10 3 2
(Fv=12) 0 1 2 3 4 6
1 4 3 3 8 1
Late summer N=20
4 5 6 7 8 9 10 11 13
2 5 2 2 1 2 2 2 2
0 1 2 3
4 7 7 2
0 1 2 3 4 6
2 6 2 6 2 2
Winter N=20
3 4 5 6 7 9 10 13
3 1 5 2 3 1 4 1
0 1 2 3
1 15 3 1
0 1 2 3 5
1 7 7 2 3
Autumn N=20
3 5 6 7 8 9 10
2 5 5 1 2 3 2
0 1 2 3
2 12 5 1
2 3 4 5
6 7 6 1
Spring N=16
4 5 6 7 8 9 10 11 12
1 1 3 4 1 1 3 1 1
0 1 2 3 4
2 5 4 4 1
1 2 3
1 11 4
(n=16*) – four respondents were not available during the interview period

93
TABLE 4.28: FOOD VARIETY SCORES (CONTINUED) – GROUP SEVEN TO NINE FOOD VARIETY
SCORES GROUP 7 (OTHER FRUITS & JUICES)
NO OF FOODS EATEN N=14
NO OF RESPONDENTS
GROUP 8T (OTHER
VEGETABLES)
NO OF FOODS EATEN N=11
NO OF RESPONDENTS
GROUP 9 (OILS, FATS & ANIMAL FATS)
NO OF FOODS EATEN
N=5 NO OF PEOPLE
Early summer N=20
(Fv=14) 0 1 2 3 4 5 7
2 5 2 7 2 1 1
(Fv=11) 0 1 2 3 4 5 6
2 1 2 4 5 5 1
(Fv=5) 0 1 2 3
3 7 9 1
Late summer N=20
0 1 2 3 4 6 7 8 9 11
4 1 2 3 3 2 1 1 2 1
1 2 3 4 5 6 8 10
3 2 4 4 2 2 2 1
1 2 3
8 9 3
Winter N=20
1 2 3 4 5 6 7 9
4 6 4 1 1 1 2 1
1 2 3 4 5 6 8
1 3 6 5 1 3 1
1 2 3
8 5 7
Autumn N=20
0 1 2 3 4 7 10
1 7 6 3 1 1 1
1 2 3 4 5 6 7
2 3 2 3 2 7 1
0 1 2 3
1 6 10 3
Spring N=16
0 1 2 3 4 5
4 2 5 2 1 2
1 2 3 4 5 6
1 3 3 5 3 1
1 2
7 9
(n=16*) – four respondents were not available during the interview period *Total numbers of food items per group are indicated as (Fv=*) Group 1= Flesh foods (meat, poultry, fish) Group 2 =Eggs Group 3 =Dairy products Group 4 =Cereals, roots & tubers Group 5 =Legumes and Nuts Group 6 =Vit A rich vegetables & fruits Group 7 =Other fruits (and juices) Group 8 =Other vegetables Group 9 =Oils, Fats & Animal fats

94
Most of the respondents consumed a poor variety of protein foods from group
one in their meals. For example during early summer seven respondents each
consumed only two protein foods while only two respondents consumed five
different food items in seven days. In late summer, six respondents consumed
seven to nine food items from group one in seven days. From group one only
one respondent consumed no protein foods in early summer while in late
summer they were three respondents.
In winter, six, three and two items respectively, were consumed by four
respondents each; in autumn, most respondents (five) consumed only one
food item, while four to five different food items were consumed by four
respondents each in spring. In most seasons, three to five different proteins
were consumed in seven days.
Almost all respondents consumed eggs from group two in all the seasons, as
all had chickens in the yard – thus eggs were readily available. For example,
during early and late summer, as well as autumn, fourteen to sixteen
respondents consumed eggs.
Out of the seventeen dairy products mentioned in group three, most
respondents consumed only one item (cow‘s milk) in all the seasons. This
indicates a poor variety of dairy foods consumed probably resulting in low
Calcium intakes and low intake.
Most of the respondents consumed a poor variety of cereals from group four
throughout the seasons. In this study, maize meal, bread and, sometimes rice,
were consumed daily by household members, resulting in poor variety. Two to
three respondents (most likely those employed in the guest house) consumed
a maximum of ten to fifteen cereals.
One to three legumes and nuts were consumed during all the seasons. This
included sugar beans, cowpeas and jugo beans. In all the seasons, fourteen
respondents consumed nothing from group five. Vitamin A rich green leafy

95
vegetables & fruits were consumed in limited amounts from group six by most
respondents.
A maximum of one to three items from group six were consumed in a week in
all the seasons. This included spinach, pumpkin, and wild leafy vegetables
(fresh and dried).
In all the seasons, most of the respondents consumed low variety of fruits
(and juices) from group seven in their meals. Only two to five respondents
consumed seven to eleven varieties of fruits (and juices) from all the seasons,
except during spring, when only two respondents consumed five food items.
For example, one respondent consumed eleven food items from group seven
during late summer and ten items during autumn – other fruits (and juices).
These were probably respondents who were working at the guesthouse
cooking and cleaning. Additionally, summer fruits were generally harvested in
this period.
From group eight, which included vegetables, one to five different vegetables
were consumed by most respondents, leading to a low variety. The
vegetables consumed included onions, cabbage, turnips, tomatoes and green
beans. Most of the respondents consumed two to three items from group nine,
including oil, fats & animal fats, like butter, sunflower oil, and lard. This
indicates a better variety of fats used by the women. This links with the
respondent’s body mass indicators that were greater than 30, indicating
obesity.
In addition, the anthropometric measurements of the respondents were
assessed to determine if dietary diversity of adult women living in farm worker
households on Oranje farm correlated to their body mass index. The data was
investigated in all five seasons to get clear information about the dietary
diversity.
The food variety and food group diversity scores per season were used as a
comparison. The food variety scores will be compared first, and then the food
group diversity score will be compared (See Table 4.29).

96
TABLE 4.29: CORRELATION OF BODY MASS INDEX AND DIETARY
DIVERSITY PER SEASON
FOOD VARIETY
N MEAN STD DEV MEDIAN
PEARSON
CORRELATIO
COEFFICIENTS
SEASONS (21) 29.41 9.05 29
Early summer 20 23.05 9.50 23 -0.031
Late summer 20 27.95 13.5 23 0.165
Autumn 20 25.50 7.47 26 0.013
Winter 20 26.50 12.03 21 -0.152
Spring. 16 26.50 6.46 25. -0.211
FOOD GROUP DIVERSITY N MEAN STD DEV MEDIAN
PEARSON
CORRELATION
COEFFICIENTS
Early summer 20 7.90 1.21 8.0 0.049
Late summer 20 8.10 1.02 8.0 0.210
Autumn 20 8.45 0.60 8.5 0.453
Winter 20 8.80 0.41 9.0 -0.304
Spring. 16 8.63 0.50. 9.0 -0.215
The results in all the seasons indicated no correlation between dietary
diversity and body mass index of the respondents. No relationship was found.
The reason might be kilojoules and energy expenditure affects BMI more so
than diet diversity. Dietary diversity tool were found not to be good
measurements.
4.3 DISCUSSION OF RESULTS
4.3.1 Biographic information
Under biographic information five aspects were reported, namely age, marital
status, number of children, socioeconomic status and educational status. For
this research study adult women were interviewed. This study formed part of a
larger study where models for nutritional intervention in rural communities in
South Africa were developed (Green, 2004:7). The women were seen as the
gatekeepers for access to the households and their activities on the farm. For

97
this research study, adult women from various households were chosen as
the unit of analysis and spokespersons for the community, mainly because
women were the ones that mostly prepared food and bought groceries. The
women in this study were aged between 26 and 57 years.
4.3.1.1 Poor educational status affecting their purchasing
Most of the respondents (62%, n=13) in this study were not educated and did
not have adequate knowledge on nutrition. Due to lack of education on
nutrition, they bought food for the sake of eating and did not take into
consideration the nutrition requirements of food by checking the quality or
variety of such food. During observations, it was clear that most of the
households require education or skills on nutrition due to a way they purchase
their food, which was found to be the same. This was verified through
observing their shelves during interviews. In addition it was also clear that
most respondents did not have extensive knowledge about different types of
food. This was seen during interviews when food models and pictures of food
were shown to them, in order to indicate the food items that were eaten at
home. Therefore by improving family nutrition, women can improve the quality
of life in rural communities. Investing in women’s education increases
women’s capabilities, expands opportunities available to them and empowers
them to exercise choices (Green, 2004:44).
These findings also indicate a link between a lack in education and dietary
diversity leading to poor nutrition. Lack of education in this study is in line with
the findings of Steyn et al (1999:28) that states that the educational status
(level of schooling) of the mother has a direct relationship with the nutritional
status of the child. Therefore, if you educate the women, you save the
children. Empowering women is also a key issue in achieving household food
security and increasing women’s education is the key ingredient for women’s
empowerment (Green, 2004:44).

98
4.3.1.2 Employment status and income level
Socio-economic factors such as income, access to arable land, and the
availability to generate income, determines the ability of the households to
obtain food, either by their own production, or through purchasing (Steyn et al,
1999: 37; Kgaphola & Boshoff, 2002:66). This relates to this study in that the
majority of the respondents living in these households were unemployed (See
Table 4.2), thus affecting their dietary diversity. Those who were employed
(n=6), were earning lower salaries and only a small percentage of their
income could be used to buy food. Salaries were generally R1000.00 or less
per month, which was not enough to allow people to purchase enough
resources to satisfy their basic needs, thus leading to poverty. Most
households were dependent on the women’s husbands or partners (57%,
n=12) to support their families with money in order to have food in the house,
while few (28.5%, n=6) depended on state money; these being either being
pensions or children’s grants.
These findings are not surprising, since the employment status of the parents
normally determines whether sufficient economic resources will be available
at household level, including cash to purchase food (Steyn et al, 1999:37).
The level of income will determine the quantity and quality of food purchased.
The findings in this study therefore confirm those of the Department of Social
Services, Population and Development (2001: 8) indicated that rural
households are affected by poverty the most. The reason for that is their
inability to command sufficient resources to satisfy their basic needs,
invariably also leading to poor dietary diversity.
4.3.2 Anthropometric measurement
To prevent and treat obesity in black women, more should be known about
the underlying causes of obesity among these women in order to develop
appropriate and culturally accepted interventions. In a study by Kruger,
Venter, Vorster and Margetts, (2002:422) it was found that women with higher
incomes and lower physical activity were at the greatest risk of an increased

99
BMI. Physical inactivity showed the strongest association with measures of
obesity. This information supports the findings in this study in that most
women on the farm were unemployed, with low incomes and lower physical
activity levels. They were, however, also at the greatest risk of an increased
BMI. Half of the women (n=10) living in the farm worker households on the
farm were obese. Their body mass index (BMI) ranged from 31 - 48kg/m2,
indicating extreme obesity. Four of the women were overweight, with BMI’s
ranging from 26 to 29 (See Table 4.5). During observations it was revealed
that all the women who were unemployed mostly spent their time at home
doing nothing. They sat in the sunlight and waited for their husbands to come
back home from work, which contributed to the obesity problem. Therefore
factors such as higher parity and lower level of physical activity may contribute
to the tendency of black women to gain weight. In South Africa, in a study
done in a remote area KwaZulu Natal with poor women, 40.0% were found to
be overweight and 31.6% were obese (Walker, Adam & Walker, 2001: 370).
Researchers from Tufts University (Harvard Women’s Health Watch, 1999: 7)
determined that people who ate a wide variety of foods from any food group
tended to consume a greater number of kilojoules from that food group.
Moreover, consuming a large variety (and a large number of kilojoules) from
certain food groups —sweets, snacks, condiments, entrees, and
carbohydrates -were linked to increased body fat. However, the results from
this study show that the majority of the respondents consumed a poor variety
of most food groups, but also that they consumed extremely large quantities
of one or two staple foods, which together with poor activity levels, might have
had an effect on their increased body mass index (See Table 4.28).
4.3.3 Dietary Diversity
The variety of foods eaten by the households from different food groups was
investigated in this study and compared with other studies in order to
understand their contribution to dietary diversity. After an indepth
100
investigation, a list of food items and food groups was compiled to assess
foods normally eaten and bought in this community (See Table 4.6).
4.3.3.1 Food variety and food group diversity
Cereal diversity group
In this study on Oranje farm, most of the food items used in the group of
cereal diversity, including rice, bread and mageu were bought, with the
exception of maize meal – the staple food in the village. The farmer gave this
staple food, as part of payment to his employees. The maize meal supply was
ample for households – even to share among family and friends. An amount
between 60-80kg maize meal flour (bags from the miller) was given per farm
employee. Due to the large maize meal quantity received, it was therefore
possible to share among those households who did not receive anything, as
they were not working for the farmer. This is similar to other South African
data indicating that purchased maize meal is the staple food in many SA
households. Similar findings were apparent in the National food consumption
survey, indicating that on average the majority (94%) of households used and
purchased maize meal as a staple food. Maize meal flour and brown bread
were consistently procured and consumed by all households in all the
provinces irrespective of income. The percentage of households that did not
buy any of these food items, was small (<3%) (Maunder & Labadarios, 1999:
497).
Fruit & vegetable diversity group
In the Thusa study, dietary intakes of the African population in different stages
of transition in the North West Province were investigated. It was reported that
fruit and vegetable consumption was low in rural areas and only a bit higher in
urban areas (Maclntyre, Kruger, Venter & Vorster, 2002:252). Their reasons
for low intakes of fruit and vegetable were similar to this study of Oranje farm
which was because of harsh climates, poor soil quality, lack of water, loss of
land and migration of men to urban areas. These factors may make cultivation

101
difficult and wild fruit and vegetables do not grow readily everywhere. In the
urban areas, fresh vegetables and fruit were expensive and space for
cultivation limited (MacIntyre et al, 2002: 252). In this farm worker community
on Oranje farm, fresh fruit and vegetables were also expensive and
inaccessible due to distance from shops, and although they had gardening
plots available, this was mountainous terrain with no natural or other water
sources readily accessible to maintain a garden. It required hard work, a lot of
water carrying and dedication to cultivate vegetables in these harsh
conditions. This is in contrast to the traditional African diet, in which a variety
of wild and cultivated vegetables and fruit contributed to the diet (Ladzani,
Steyn & Nel, 1992: 60).
Protein diversity group
Food items in the group of protein diversity of farm worker households
included chicken runners (feet) and heads, tripe (mala-mohodu) or organ
meat, and tinned fish (pilchards or sardines) as the main protein-rich food
items bought. Chicken and eggs were the most common protein source eaten
by all the families, but it was mainly from their own stock accessed – which
they did not sacrifice very often – rather than through purchasing. Milk,
(unpasteurized cow’s milk) was bought from the farmer for an amount of R1
per liter while some households used milk from their own stocks. Although
they did not eat a large quantity of red meat, they did consume other protein
sources (milk, eggs, and chicken) available to them (See Table 4.26). They
also hunted and went fishing at times. Similar to findings of the Thusa study,
the rural and farm strata indicated that more than half of the protein intake
was consumed from plant sources. Since this is a poor source of protein, it
thereby could put people at risk for a lack of essential amino acids in the diets,
i.e. intakes of legumes and cereals that are not balanced (Mclntyre et al,
2002:250).
102
Miscellaneous, fats and beverages diversity group
In this study, selected food items were sometimes bought when extra money
was available – these included tomato sauce, mayonnaise and atchaar.
Miscellaneous items bought on a more regular basis, were sugar, tea, salt,
sunflower oil, curry powder and sometimes peanut butter. This links with the
Thusa study, whereby the most popular form of fat used for food preparation
was sunflower oil, similar to rural, farm and informal settlements. The
respondents living on the farms did not have regular access to shops and due
to their low-income levels; they could only afford the most basic food items.
The use of sweets, cakes and cold drinks was lowest in rural areas and these
reflected both the lack of variety in the diets of rural and farm dwellers and the
availability and affordability of these products in different areas. They also
could not afford to purchase the most basic foods (Mclntyre et al, 2002:253).
Similar results were found at the national level, since the data from the 24-
hour recall indicated that the same food items were purchased and consumed
regularly (tea and sugar) (Steyn & Labadarios, 1999:221).
With regard to beverages, respondents in farm worker households also
bought imitation cold drinks & coffee regularly. Traditional beer was brewed
from sorghum or maize meal and consumed often as part of entertainment.
Alcoholic beverages that were purchased, included beer and wine. On the
national level the mean reported alcohol intakes for the women in urban strata
were low compared to the high alcohol intake in the rural, farm and informal
settlement strata (Mclntyre et al, 2002:253).
4.3.4 Food accessing strategies
Five food accessing strategies were identified in this community namely food
production, purchasing, bartering, gathering/hunting/fishing wild sources,
subsidizing and payment in kind (See Table 4.7). Different households used
different strategies and did not depend only on one strategy. These strategies
were used interchangeably, depending on different circumstances. The food

103
accessing strategies will be discussed individually as indicated in the
conceptual framework.
4.3.4.1 Food production strategy
Food production depends upon natural environmental factors like climate,
water resources, topographical and soil characteristics present. These
factors determine which food items can be produced; and the man-made
environment (including technological developments for processing, storage
and distribution of food) affects which food items will be made available for
consumption (Sims & Smcikiklas-Wright, 1978: 174). The environment of
the household system includes the environment both at the macro-and
micro levels (Kgaphola & Boshoff, 2002: 69). The macro environment
includes the natural & structured systems. The natural/structured systems
are the physical, biological and man-made surroundings within which the
societal system functions. These include the geographical / natural
environment accompanied by biological systems, such as plants and
animals and man-made structures, such as buildings, roads and dams. The
natural environment will also determine the types of animals and plants
available in given geographical areas (Jerome, Pelto & Kandel, 1980:15;
Sims & Smiciklas-Wright, 1978:174).
On Oranje farm, on average, rainfall during the months of October until March
is 780mm. The climate is very moderate and the farm is considered the
warmest in the district. Constraints to farming are either droughts or hail, while
frost never occurs. It snows every year during June, July and August (Green,
2004: 88).
The results showed that most of the farm worker households on Oranje farm
had home food gardens where they cultivated vegetables such as spinach,
green beans, pumpkin, tomatoes, cabbage, beetroot, potatoes, and grew fruit
trees such as peaches and apricots (See Table 4.8). This shows that these
household members depended more on their natural and technological
environment in order to have a variety of food in the house, rather than
104
purchasing. According to Jerome et al, 1980:14 the technological
environment also determines the extent to which a given natural environment
can be exploited to produce food. Improved cultivation and mechanization
practices, for example, have influenced the agricultural potential in some
areas.
Findings in this study also show that most of the farm worker households on
Oranje farm owned livestock such as cattle, chickens and some respondents
also owned pigs. Pigs were mostly sold when they did not have money in the
house. Many households kept chickens in their yards for their products (eggs)
rather than for their meat. Few who owned cattle only slaughtered them for
traditional reasons like rituals and funerals, and not for general use as daily
food. Similarly the case study by Kgaphola and Viljoen (2000:71), reported
that people did not traditionally keep the cattle for food purposes, but only
slaughtered on religious and ceremonial occasions. In addition, most of the
household members on Oranje farm believed in keeping their cattle as a
symbol of wealth, and not to use them to relieve hunger.
Food production by households on Oranje farm was identified as the third
most important choice of food accessing strategies used. All the households
had access to gardening plots (land was available but had to be prepared and
used by each household by free choice). Only one household did not utilize
this privilege mainly due to illness and because of being a single mother. She
promised to cultivate her plot later when her health had improved. These
gardening plots were freely used land given by the farmer and all the families
made vegetable gardens close to their houses – either in front and/or at the
back of the houses. Most of the households cultivated vegetables and fruit for
food consumption purposes (See Table 4.9).
4.3.4.2 Food purchasing strategy
The physical aspects of the structural system in the micro environment will
determine the infrastructure and facilities available to the households. This
includes water, electricity supply, roads, transport and market places

105
available, that may influence food availability (Sims & Smiciklas-Wright, 1978:
174; Kgaphola & Boshoff, 2002: 69). In their macro environment, food could
be purchased from a limited number of shops or suppliers only.
The political, technological, economic and sociocultural subsystem can
influence the accessibility and availability of food in the household (Sanjur,
1982: 38; Deagon & Firebaugh, 1988: 28-38; Sims & Smiciklas-Wright, 1978:
174).
The majority of women living in farm worker households on Oranje farm were
unemployed. They did shopping once a month after payday. The result of the
study are similar to the findings of Kgaphola and Viljoen (2000: 70), whereby
food was also purchased mainly once per month. They usually made a trip to
purchase food from either of the two closest towns, namely Fouriesburg or
Clarens, which were the nearest towns to the farm. Other factors that
influenced their food purchasing, were a lack of transport, high food prices, a
limited variety of shops, lack of knowledge of nutritious food or good food
choices, and utilizing their limited resources optimally. Lack of transport was
found to be one of the most severe problems among the household members
living on the farm, as they had to rely on others for traveling (passers-by) as
no public transport was available close to the farm to take them to the nearest
towns. However, all transport was seen as very expensive for them. Most
respondents purchased their food at the small general dealer in Fouriesburg
only once a month after payday, and at the spaza shop on the farm daily, as
well as from the commercial farm they lived on, on a weekly basis. All the farm
worker households used food purchasing as a strategy for accessing food
items in a house.
4.3.4.3 Food bartering strategy
Food bartering was the least used strategy by farm worker households on
Oranje farm. Few people used this strategy as an additional way of accessing
a variety of different foods in their households. Reasons for not bartering were
the same for all the households in this study, namely that they were not used
106
to exchanging food items amongst families or individuals, as this was a
foreign method in their culture.
In this study, most respondents did not practice food bartering and said, “I do
not believe in bartering and in fact I am not even used to it. People only want
to receive and never give back; I will never try this method”. According to Sims
& Smiciklas-Wright, (1978:174), the individual’s choice of food will always be
influenced by personal factors such as values, attitudes, beliefs and
knowledge – the so-called internal or endogenous factors influencing food
behavior. Oranje farm community’s attitude towards bartering was negative.
The respondents did not believe in bartering at all and were not interested in
trying it even after it was suggested.
4.3.4.4 Food gathering strategy
In addition to the other mentioned food accessing strategies, the entire groups
of farm worker households on Oranje farm depended on gathering food from
the veldt in order to have a larger variety of food in their houses. Gathering of
plant foods, hunting small animals and fishing played an important role in
accessing a larger variety of food for the household members and the
community. Of these, the gathering of the wild leaves was the most common
method of food gathering used in these households, as these were abundant
in the rural area around the farm. This strategy was chosen by this community
as their second choice method to help in accessing food.
Some wild vegetables were collected almost everyday by some households.
When gathering wild leaves from the veldt, the women would wake up early in
the morning to collect wild leaves (merogo) consisting of many varieties of
green leaves. This was done almost everyday or at least two to three times in
a week. Corbett (1988:1110) also identified the collection of wild foods as one
of the coping responses employed by households that are at risk of household
food insecurity. The community of Oranje farm gathered some wild green
leaves known as thepe, seruwe, tjhaku ya kgomo, sempaile, sebitsa,
papasane, tenane, seruwe, and seshwabohloko.(See Table 4.11) to use as a

107
relish to enjoy with their staple food (stiff maize meal porridge). The traditional
leaves were dried in sunlight and could then be stored and eaten after some
days. Unfortunately, the names of these wild leaves were known only by their
traditional names and their dietary contribution was therefore unknown.
These findings confirmed that rural people continued to depend on wild food
in order to have food in the house. This is further confirmed by Ogle et al
(2001:21), who reported that rural people in many countries also continued to
include wild foods in their diets, but the role of this food strategy is still difficult
to capture in conventional dietary assessment. According to Kuhnlein
(2003:36), the traditional food systems of indigenous peoples contain a wealth
of micronutrients that have been poorly described and reported in scientific
literature. This lack of scientific coverage prevents the information from being
included in health training programmes and public-health promotion
programmes (Kuhnlein, 2003:36). All the data from this study, however,
indicated that wild foods played an important role in the dietary diversity of
rural people and must be taken into consideration when assessing their
nutrient intakes and planning nutrition intervention programmes.
Jones, 1963 in Kgaphola and Viljoen, 2000:69, in her study on Swazi nutrition,
indicated that food availability was seasonal and the seasons consequently
dominated the life and food habits of rural Swazis. This was also apparent in
this research study done on Oranje farm. Food gathering, hunting and fishing
played an important role in the access of the household food supply. All the
respondents indicated that they gathered food from the veldt, depending on
the seasonal availability (See Table 4.11).
Food was more plentiful during summer, when most of their cultivated
vegetables and fruits were available, with different wild vegetables in the veldt
and more fishes were available from dams. Wild animals were hunted all year
round, but especially when food was scarce. When food was scarce, the men
and children in the community normally hunted animals or fished in the dam
nearby their houses on the farm, and the women mainly gathered the leaves
from the veldt. The men hunted rabbits with dogs, but these and other wildlife
had become scarce. Guinea fowls (kgaka) are present on the farm and eaten

108
during dry and hungry seasons. Kgaphola and Viljoen (2000: 70), reported
similar findings in their study on the food habits of rural Swazi households,
namely, that the Swazi traditionally also supplemented their diet of cultivated
food with leafy vegetables and fruit from the veldt. From these results it was
clear that the natural environment still had an extensive influence on food
access and the choice of food supplementing the staple food in low-income
rural households.
A study in Vietnam showed that wild vegetables contributed significantly to the
overall micronutrient intakes, mostly carotene, vitamin C and calcium intakes,
but in this study, only the contribution to carotene intake was significantly
higher in the high FVS group. Overall, it was concluded that a food variety
analysis is a useful tool in capturing the dietary role of wild vegetables (Ogle
et al. 2001:21). In contrast to this study, wild vegetables were not analysed
but were consumed in large quantities, therefore contributing to the
respondent’s diets. Food gathering was chosen by this community as the
second method used to have access to food items. This food accessing
strategy was used by the entire household.
4.3.4.5 Payment in kind strategy
What was further indicated by this study was that most farm worker
households depended on this strategy (receiving of food from employer) in
order to have food in the house. Only farm employees benefited from this
strategy. Each employee was given the amount of 60kg or 80kg maize meal
flour, depending on the number of people working for the farmer. Mutton was
also given during the December period as a Christmas present to employees.
A sheep would be slaughtered and shared among employees. This strategy
was found to be unique in the context of South Africa, as this is common
practice on farms. Payment in kind was therefore identified as a new food
accessing strategy in this rural community.

109
4.3.4.6 Ranking of food accessing strategies
On Oranje farm, the household members used four food-accessing strategies,
namely food production, purchasing, gathering and payment in kind. Food
purchasing was identified as the main food accessing strategy for farm worker
households on Oranje farm. Food purchasing, gathering/fishing/hunting of wild
sources of food and own production were the main food accessing strategies
chosen by this community and were ranked in that order. The NFCS
confirmed that food purchasing was the major household food procurement
method in South Africa (Maunder & Labadarios, 1999:511). In the case of
Manhaar Ward, the households employed five similar strategies, namely own
production, purchasing, food gathering, food borrowing and using food grants.
Food purchasing, own production and gathering of wild food, especially leafy
green vegetables, were identified as the main food accessing strategies
ranked in that order (Kgaphola, 2003:221). The only difference being that food
gathering was practiced before food production on Oranje farm in South
Africa.
Gobotswana (1988:140) mentioned similar strategies practiced in the Chobe
District of Botswana, where production, purchasing, grants, and gathering of
food from the wild, including game, were mentioned as food access methods
used by rural households to meet their needs.
The findings from Maanhaar (Kgaphola, 2003:220) suggested that households
used a combination of these food-accessing methods as one long-range
master plan. It was only the extent of usage of different methods that differed
from household to household depending on the socio-economic conditions of
the household. This is supported by Corbett (1988:1102), who indicated that,
even among a group of households with the same basic means of livelihood,
there might be tremendous differences between options open to the strategies
chosen by each household. Therefore, this links to the study, since different
food accessing strategies were used in each household.

110
4.3.5 Dietary diversity issues
4.3.5.1 Food variety
4.3.5.1.1 Meal patterns
Most adults in farm worker households on Oranje farm ate three times a day,
while their children normally ate four times a day. Adult women specifically ate
three prepared meals per day namely breakfast, lunch and supper. The case
study of Swazi reported similar results in their study on the food habits of rural
Swazi households, namely, that three meals were consumed daily (Kgaphola
& Viljoen, 2000:19). Other studies among other ethnic groups also confirmed
this tendency to consume three meals per day instead of two meals per day.
This is the eating pattern traditionally followed by most of the other black
ethnic groups (Oudkerk, 1965:1148; Crous & Borchardt, 1982:29; Brink &
Boshoff, 1983:9; Crous & Borchardt, 1984:41; Crous & Borchardt, 1986:44,
Kgaphola & Viljoen, 2000:19; Marugkar & Pal, 2004:268). Therefore, this
finding indicates that rural meal patterns are similar to the western meal
patterns. The Swazi’s also ate their evening meal together as families,
because they were all at home at that time. The evening meal was considered
the main meal of the day and was served at sunset. The evening meal was
eaten together and the different age and gender groups all gathered at the
great hut for the meal (Jones, 1963:82). Similar patterns were found in this
study, as the evening meal was eaten around seven o’clock with all the family
members together because they were all at home at that time.
4.3.5.1.2 Venues of eating and their frequency of purchasing
Most of the members of the farm worker households ate meals that had been
prepared at home, and they hardly ever ate outside their homes. The reason
was affordability, as it is expensive to eat at restaurants, shops or cafés.
Secondly, distance was a factor, as the farm was far away from the two towns
where they could go to eat. Only four respondents indicated that they

111
occasionally ate at cafés and one respondent ate at take-away venues such
as Kentucky Fried Chicken. These places were visited only once a month.
All the respondents reported purchasing their food from the general dealers
and the local spaza shop on the farm. Similar results were found in the study
by Kgaphola and Viljoen, (2000: 71) on the food habits of rural Swazi
households at Ka-Mantsho in the Badplaas district who reported that they
bought food most frequently at the supermarkets and local shops only. From a
total of ten household investigated most households (n=8) bought their food
once a month, while only two households bought their food twice a month.
The results found from the Swazi clearly indicate that the rural households in
this area did not have access to a variety of stores to purchase their food, thus
resulting in a poor variety of food availability in their households.
4.3.5.1.3 Meal supplies from home
Good community resources are known to have a beneficial effect on the
nutritional status of the young children. Preschool facilities, which cater for
children’s needs during the absence of a working mother, as well as feeding
programmes targeted at feeding young children, provide additional nutritional
support (Steyn et al, 1999:38). In this community of farm worker households,
no preschool facilities were available to mothers. However, a feeding scheme
was present and implemented in the primary school within this community
where children received some nutritional supplements at school namely
nutritious biscuits and a powdered energy drink. This added to the nutritional
intake of the children, but did not really add to the variety in the diet, as it was
only cereal-based products that were given. The drink was not reconstituted
and the children had to consume the dry powder if they wanted it (See Figure
4.13). Therefore in this community most of the respondents did not prepare
lunch boxes for their children when going to school. They rather depended on
the national school feeding scheme supplying food for the children during
break time.

112
FIGURE 4.13: SUPPLEMENTS FROM THE SCHOOL FEEDING
SCHEME
4.3.5.2 Common foods accessed through different food accessing
strategies
The twelve food groups included cereals, vegetables, fruits, proteins, milk
products, fats and oils, sweets, drinks, sauces, herbs, spices, miscellaneous
items and beverages (See Addendum B). The total numbers of one hundred
and fifty one foods were used to calculate the final scores.
However, only nine nutritious groups contributed essential nutrients to the diet
and were thus included because of their nutritional value. All the
miscellaneous items and food items that did not contribute nutrients to the diet
were not used. The nutritious groups included cereals, roots and tubers,
vitamin A rich fruits and vegetables, other vegetables, other fruits, flesh food
(meat, poultry & fish), legumes and nuts, dairy products, eggs as well as oil &
fats (See Addendum C). A total number of one hundred and nine foods were
used to calculate this score.
Cereals – the pattern of consumption of cereals in this study was the same
throughout the whole year, and during all the seasons. The most commonly
consumed staple cereal was maize meal, followed by bread. The other
sources of starch in their daily diet were soft maize meal porridge, soft mabela

113
porridge and rice (See Table 4.18). Kgaphola and Viljoen (2000: 70) reported
similar findings, that maize and bread formed an integral part of the rural
Swazi diet. The ten rural household in the case study also reported maize as
their staple cereal. They also included rice in their diet occasionally. Similar
results were reported at the national level in that the most commonly
consumed cereal items were maize and brown bread (Maunder & Labadarios,
1999: 497, 500).
Vegetables – the farm worker households on Oranje farm depended on
cultivated vegetables in order to have food in the house. Maize meal porridge
was mostly accompanied by vegetables such as potatoes, onions, tomatoes
and cabbage (See Table 4.18). More vegetables were eaten during spring
and summer. Few vegetables were cultivated during winter and autumn,
although they still used preserved products (See Table 4.9). Food shortages
were common during the winter season. During some observations in this
period their gardens were very dry and most did not plant any vegetables at
all. At this stage they rather depended on gathering wild leaves in the veldt.
These gathered wild vegetables contributed to dietary variety and quantity of
food intake. More wild vegetables were collected during late summer and
winter as they were readily available in this period (See Table 4.11). This
might occur due to the fact that their gardens were not cultivated during winter
months, and therefore they depended more on gathering food from the veldt.
Jones (1963:69) reported similar results, where several varieties of wild roots
and tubers were collected and eaten at the end of summer and during winter
months.
Jones (1963:69), as well as Ogle and Grivetti (1985:31) reported similar
findings, where certain European vegetables, for example onions, cabbage
and tomatoes, were becoming a popular part of the Swazi cuisine. Their
research revealed that most of the Swazi households cultivated vegetables
such as carrots, cabbage, spinach, beetroot, chillies, okra and a pumpkin,
which was similar to the findings on Oranje farm, where it was found that most
households cultivated spinach, green beans, pumpkin, tomatoes, cabbage,
114
and beetroot (See Table 4.9). Similar results were found in the NFCS where
the most commonly eaten vegetables were onions, tomatoes and cabbage,
although they were consumed in low amounts (Macintyre et al, 2002:245).
Fruit – the favourite and most commonly consumed fruit that could be
afforded in this community was apples. Most household members reported
that fruit generally was too expensive to purchase. However, cultivated few
fruit on the farm (peaches, apricots and few grapes) were freely available
during summer. Consumption of large quantities of fruit was observed more
during summer than any other seasons (See Table 4.18). In contrast to the
case study by Kgaphola and Viljoen (2000: 71) the participants cultivated fruit
such as oranges, guavas, bananas, and apples and were consuming a variety
of fruits.
Protein rich foods – the respondents ate the same protein rich foods
throughout all the seasons. These included chicken, eggs and cow’s milk.
When more money was available they could afford to purchase additional
food items, like russians and sausages (See Table 4.18). Similar to the case
study by Kgaphola and Viljoen (2000: 72), the participants ate the same
protein food items such as eggs, chicken and cow’s milk.
Miscellaneous, beverages, fats & spices – the respondents on Oranje farm
mostly consumed the same items throughout all the seasons. They used
sunflower oil, sugar, salt and curry powder as their flavourings and spice. All
the respondents drank tea and imitation drinks on a daily basis (See Table
4.18). A slight change was observed during winter, when they consumed food
such as soups and achaar. Traditional beer was made from sorghum and was
drunk almost every day. Maclntyre et al (2002:253) reported that in the North
West province the most popular form of fat was sunflower oil used for
preparation purposes.

115
4.3.6 Dietary diversity scores
Various pictures, examples and containers of foods that might be available
were used during interviews to confirm the types of food written on the
compiled list. One hundred and fifty one food items of mixed origin were
initially selected, from which 109 nutritious food items were identified, and
compiled in a second list. Both were used to calculate the individual food
variety and food group diversity scores of the community on Oranje farm (See
Table 4.22, 4.23, 4.24 & 4.25).
Food variety and food group diversity scores
Single food or food group counts have been the most popular measurement
approaches for dietary diversity in developing countries by different
researchers, probably because of their simplicity (Guthrie & Scheer,
1981:240; Kant, Schatzkin, Harris, Ziegler & Block, 1993: 434; Drewnoski, et
al, 1996:663; Hatloy et al. 1998: 891; Ogle et al. 2001:21; Hoddinott &
Yohannes, 2002: 1). This relates to the Oranje study in the South African
context, where measuring dietary diversity took place by using single food or
food group diversity.
Studies in both developed and developing countries have used a variety of
food and food group classification systems, different numbers of food items
and food groups, and varying reference periods (Ruel, 2002: 7). According to
Ruel (2002; 8), developed countries measure the dietary quality range from
simple indicators such as the percentage of energy from animal sources to
complex indices that combine both nutrients and food components. In
developing countries, dietary quality has often been equated to nutrient
adequacy ratios (Hatloy, et al, 1998: 892).
In this study in South Africa, the food variety score (FVS) was defined as the
number of individual food items consumed over a period of seven days. The
total number of foods included in the food variety scores was 151 items (See
Addendum B) from the twelve food groups including (non nutritious &

116
nutritious) food items. Also, the total number of food items included in the
second investigation of the food variety scores was one hundred and nine
from the nine nutritious food groups (See Addendum C). The total mean of the
food variety scores of the first investigation was 18.6 and 8.62 for the second
investigation of food variety scores in seven days. With both of these
investigations different results were found. The food variety score was
between low and medium for the first investigation using the 151 food items,
but low in the second investigation using only the 109 nutritious food items.
The results from both investigations indicated that, with the food variety
scores that counts all the food items consumed, even miscellaneous items
used can therefore contribute to a false impression of the quality of the diet.
The food variety scores for the twelve food groups indicated that some of the
household members had medium scores while, for the nine nutritious groups
(second investigation), almost all the households’ members were consuming a
lower variety of food items, confirming that fewer nutritious food items were
consumed on a daily basis (See Table 4.26, 4.27, 4.28).
Different results were found in the Vietnam study, which included adult
women, and used the same method to validate the same diversity measures
(FVS and DDS). In contrast to this study food variety scores and dietary
diversity scores (DDS) was measured against nutrient intake and nutrient
density (Ogle et al, 2001:21). The food variety score (FVS) and dietary
diversity scores (DDS) were investigated from a seven day food frequency
questionnaire and included 120 food items and twelve food groups,
respectively.
The results indicated a positive association between the two measures of
diversity and the intake of a variety of nutrients (Ruel, 2002:17). In this study,
the food variety (FVS) and food group diversity scores were investigated
against the access respondents had to food and calculated with reference to
international standards in order to develop a dietary diversity score (DDS) to
be used in the South African context to be able to assess household food
security in the community. The results indicated a positive association
between the two measures of diversity and proved that the tool was a good
117
indicator of household food security. The Oranje farm community was found
not to be food insecure, since food was readily available but could not be
utilized properly.
In addition to the findings of the Oranje farm study about the weight status of
the respondents, no correlation was found between dietary diversity and body
mass index. Food variety and food group diversity scores were used in
comparing the body mass index groups for the respondents per season (See
Table 4.29). In other studies investigating dietary diversity and nutritional
status similar findings were found. The findings were found to be inconsistent,
showing either positive or non-significant relationships, highlighting the lack of
standardization in study methodology and measurements of dietary diversity
(Onyango et al, 1998:485; Tarini et al, 1999:23; Hatloy et al, 2000: 891).

118
Chapter 5
CONCLUSIONCONCLUSIONCONCLUSIONCONCLUSION
5.1 SUMMARY
It is important to determine household food security, because it gives an
indication of the unequal distribution of food and resource. This plays a role in
household’s ability to produce and acquire food. Lack of food and resources
often leads to food insecurity due to, among others, limited dietary diversity (in
different food items or food groups). Formulation of strategies to increase
access to food to ensure appropriate and adequate food and micronutrient
intake is essential to improve dietary diversity and subsequently also HHFS.
Developments of various HHFS measurements are essential for planning,
targeting, monitoring and evaluating interventions. Multiple and interrelated
determinants are involved. It is known that inadequate dietary intake is one of
the primary immediate determinants of malnutrition (Bellamy, 1998: 25).
The underlying determinants of adequate food intake are household food
security and adequate and appropriate care for women and children. In order
to determine the most important causes of poor dietary intake in women and
children and to propose an effective intervention strategy, a conceptual
framework was developed with the aim of highlighting and ensuring that all the
most important causal factors need to be investigated. The UNICEF
Conceptual framework of malnutrition (Bellamy, 1998:24) was used to

119
illustrate the important factors that affect the nutritional status of adult women
and children in a community which ultimately lead to malnutrition.
The aim of this research was to describe the contribution of food accessing
strategies to dietary diversity of farm worker households with the aim of
identifying their dietary diversity level and its contribution to HHFS. A cross-
sectional survey design was used. The sample included adult women (18-65
years) (N=21) responsible for the food in a full community of farm worker
households on a farm (Oranje farm) in the Free State Province of South
Africa. A structured questionnaire was used to gather data on demographics
and food accessing strategies, with special reference to food production,
purchasing, bartering, gathering, and payment in kind, as well as dietary
diversity. Due to the sample size, the findings of the research cannot be
generalized to all farm worker households. However, valuable information was
collected on current food accessing strategies among households that can
serve as a foundation for other larger studies to be conducted in SA.
Since this study is transferable, the diversity tool established can be used on
other commercial farms in the Free State Province or in similar rural SA
communities. This tool can assist in determining household food security
problems in other areas in SA. The SAS and BMDP statistical packages were
used in analysing data, mainly using frequency and means procedures, and
calculating standard deviations. Other inferential statistical procedures
included the Mann-Whitney test and Friedman parametric tests. The food
variety and food group diversity scores were calculated. Scores were also
compared between the four seasonal periods to find which foods were
consumed most frequently in the different seasons.
5.1.1 Motivation of the study
The researcher‘s interest in this study started while working as a fieldworker
for the larger project on this farm. Their sample was at the time also taken
from the community of farm worker households living on Oranje Farm. A poor
variety of food and obvious limitations in nutrition knowledge and application

120
of food distribution were particular problems that were observed in this
community. Their diets were very monotonous, dominated by starchy food
intake (mainly from maize meal given by the farmer as part of payment).
Infrequent protein consumption was also observed as little or no animal
products (mainly chickens available) were consumed, and few fruits and
vegetables were consumed, depending on seasons and availability (Green,
2004). Most of the adult women in the community were unemployed which
contributed to poverty and poorly diversified diets. The researcher was thus
motivated to investigate and describe the food access strategies and, in the
process, test a simple tool for measurement of food variety and food group
diversity. Subsequently, the DD levels of these women were evaluated
against their anthropometric measurement (BMI) in an attempt to assess
household food security in this community.
5.1.2 Results
The results revealed that five food-accessing strategies were used, namely
purchasing, production, gathering (wild vegetables, hunting, and fishing),
bartering and payment in kind. These findings are consistent with other
studies in showing that food purchasing, food gathering and food production
are the main food accessing strategies that were used and no household
depends solely on one food accessing method. The research study found
that the two most common food accessing strategies used were purchasing
(general dealer) and gathering (wild vegetables, hunting, and fishing). Since
gathered food items like wild vegetables and fruit played the most important
role in the dietary diversity levels on commercial farms, nutritionists will have
to identify and promote the nutritious food items that also form part of the food
based dietary guidelines in South Africa. More research is needed on this
matter. Most people also depended on food production (86%) by cultivating
vegetables (spinach, green-beans, pumpkin, tomatoes, and cabbage) and fruit
(peaches and apricots). Agricultural researchers must intervene by providing
agricultural skills, to farm worker households to help in improving their
gardening skills in order to have a higher variety of food items available to
121
them. This was further investigated and implemented on Oranje farm in order
to improve their DD status.
Despite all the food accessing strategies used by the women, the bartering
strategy was hardly ever used. Food bartering was seldom practised (19%),
mainly due to customs and lack of knowledge. Therefore, this indicated that
more interventions are still needed to help people in rural areas to gain
knowledge about the different food accessing strategies and how employing
these strategies could help them to have more varied diets in order to alleviate
household food security. Food received as payment in kind (maize meal) was
common (76%). It is evident from the research findings that, in order to
alleviate poverty or household food insecurity in rural areas, especially on
commercial farms, the owners of the farms should be involved to combat this
problem. This can be in the form of subsidizing food items and giving food
items that will form part of payment.
The first choice method of food access in these households was purchasing
(76%), followed by gathering (19%) and producing (4%). People seldom ate
outside their own homes (76%), except for children receiving food at school
from feeding schemes (90%). The meals of the children from the feeding
scheme were not meeting the requirements of the nutritional status of the
children, therefore, food policies must be available to specifically will deal with
feeding schemes. Dietary diversity was limited for cereals (maize meal
porridge, bread), vegetables (spinach or wild vegetables (green leaves), green
beans, pumpkin), fruit (apples), milk (cow’s milk), proteins (eggs, chicken),
and other miscellaneous products (tea, sugar, salt, curry powder, sunflower
oil).
The weight status (weight and height) of the adult women was measured in
order to check correlation between body mass index and their dietary
diversity. Although most of the women were found to be overweight and
obese despite their poor diversity in the households. No relationship was
found. The reason might be calories and energy expenditure affects BMI more
so than diet diversity. This links with the previous research where dietary

122
diversity was linked with nutrient adequacy. It was found that improved dietary
diversity will result in improved BMI (Hatloy, 1998: 894). This study might be
attributed to the fact that most of the respondents were unemployed and
normally spent their time without any activities. In addition, they consumed
large quantities of carbohydrates, for example maize meal porridge, while
their physical activity levels were very low, resulting in poor energy output that
could not balance their huge energy intakes from the starchy staple foods.
This limited energy output might have leaded them to being overweight.
All the different strategies played an important role in the dietary diversity of
farm worker households on Oranje farm. Although their first method of choice
was to purchase food in order to have food in the house, they also depended
on what they got from their natural environment (gathering, hunting and
fishing).
The results indicated that limited food accessing strategies were utilised or
that many of the strategies were not used optimally resulting in limited dietary
diversity, ultimately affecting household food security status of farm worker
households. The contribution of food accessing strategies was found to be
positive in a sense that farm worker households were not found to be food
insecure. The negative contribution was that all of the households did not
know how to utilize the food. Their meals were found to lack variety and were
very monotonous. This information can be used to formulate strategies and
develop interventions to increase the number of food access strategies
utilized and to improve utilisation thereof in order to improve dietary diversity
and household food security.
Overall, this study showed that it was possible to predict household food
security of household members by simply calculating the food variety scores
and food group diversity scores of households as an indication of their dietary
diversity. These results revealed which households were food secure and
insecure, and provided an overall picture of the dietary diversity of the whole
community.

123
5.2 FINAL CONCLUSION
Conclusions that were drawn from the research were formulated according to
the sub-problems as stated in chapter 3 (See page 36).
5.2.1 Food accessing strategies
♦ The first sub-problem formulated for this research study was:
“Which foods were accessed through food production to contribute to dietary
diversity of farm worker households on Oranje farm?”
Foods that were accessed through food production contributing to dietary
diversity of farm worker households on Oranje farm were identified by different
methods of cultivation used by the community. This included producing
vegetables, fruit as well as livestock in order to have access to food. Different
types of cultivated vegetables consumed by this community were found (See
Table 4.9) and were normally planted during summer and spring. In this
community fruit was not consumed in large quantities except during summer,
when fruit consumption was plentiful (See Table 4.9). During other seasons
such as autumn and spring, the community indicated that they did not
cultivate any vegetables or fruit, thereby contributing negatively to their dietary
diversity. The only fruit eaten during harvest time were peaches and apricots
which were from their trees and those on the farm that they were given access
to. Therefore this clearly indicates that the community of Oranje farm
depended on what food they got from their natural environment. This
statement is supported by Jerome et al (1980: 15) and Kgaphola & Boshoff
(2002: 69) indicating that the natural environment determine the types of
animals and plants available in a geographical area and that the man-made
structures such as buildings, roads and dams as well are determined by the
natural environment. The livestock that they owned included chickens, cattle
and pigs. Chickens were used both for meat and eggs while a cattle was used
only for its milk products.

124
♦ The second sub-problem formulated for this research study was:
“Which foods were accessed through food purchasing to contribute to dietary
diversity of farm worker households on Oranje farm?”
The foods accessed through food purchasing to contribute to dietary diversity
were also identified by the different venues used to purchase their groceries
(See Table 4.10 & 4.8). They purchased food items only at three venues (See
Table 4.16), but most foods were purchased at the general dealer (n=19).
Several factors, including lack of transport, limited nutrition knowledge, limited
variety of shops and not utilizing their food properly, influenced their food
purchasing behaviour. All the farm worker households used this food
accessing strategy.
♦ The third sub-problem formulated for this research study was:
“Which foods were accessed through food bartering to contribute to dietary
diversity of farm worker households on Oranje farm?”
The foods accessed through food bartering to contribute to dietary diversity
were also investigated. Very few of the households used this strategy, and
thus it could be concluded that food bartering was seldom used. Most of the
respondents did not use this strategy regularly and most did not know how to
use it. They felt uncomfortable about the principles involved in food bartering
and were mostly afraid that people would not reciprocate once they start using
this type of food access method. People generally thought that it would be
like loaning food and that they would never receive food back. This strategy
seems to be one of the most logical strategies to use and employ in
communities such as this one, and need to be included in a nutrition
education program.
♦ The fourth sub-problem formulated for this research study was:
“Which foods were accessed through food gathering to contribute to dietary
diversity of farm worker households on Oranje farm?”
125
The foods accessed through food gathering to contribute to dietary diversity
were also identified by three different methods used by this community (See
Table 4.7). Different types of wild vegetables were consumed by this
community (See Table 4.8 & 4.11) and were gathered during summer and
spring. Different animals were hunted and fishes were caught as a source of
protein (See Table 4.8). Wild vegetables continued to play an important role in
dietary diversity of rural people (Jones, 1963:48; Corbet, 1988: 1099; Ogle et
al, 2001: 21; Kuhnlein, 2003: 33), as was confirmed by this research study.
♦ The fifth sub-problem formulated for this research study was:
“Which foods were accessed through payment in kind to contribute to dietary
diversity of farm worker households on Oranje farm?”
The foods accessed through payment in kind that contribute to dietary
diversity were also identified as those being food products received by those
individuals working on the farm or subsidized by the farmer. Households
received monthly rations of maize meal but also sporadically other products
specifically linked to the festive season or holidays. They were also able to
purchase food at a subsidized price from the farmer (See Table 4.8). Only the
farmer’s employees benefited from this strategy.
♦ The sixth sub-problem formulated for this research study was:
“Which foods were accessed through others means to contribute to dietary
diversity of farm worker households on Oranje farm?”
No other strategies were found.
5.2.2 Dietary diversity
♦ The seventh sub-problem formulated for this research study was:
“To determine the dietary diversity (food variety and food group diversity
scores) of farm worker households on Oranje Farm”
126
The food variety and food group diversity scores were determined by
compiling a list of individual food items and food groups in order to investigate
the dietary diversity of this community. Firstly, a list was compiled with 151
food items and twelve food groups including non-nutritious food items (Hatloy
et al, 1998:893). Secondly a list was compiled containing 109 food items and
nine food groups this time only including nutritious food items and food groups
(Steyn et al, 2006: 645). This helped to assess the effect of miscellaneous
food items and the amount of nutritious foods The food variety and food
group diversity scores for both the two investigations were calculated for farm
worker households in order to check if the household members consumed a
variety of food in their diets. The food variety scores were found to be low
mean 151 food varieties (30.2 to 36.5)) and 109 food varieties (23.0 to 27.9)).
The food group diversity scores were found to be high mean twelve food
groups (9.3 to 10.65) between the five seasons and nine food groups (7.9 to
8.8)) between the five seasons. This finding therefore indicates that these
households were not experiencing hunger and had some household food
security, as they had food available to consume even though they had to
employ a number of food accessing strategies to obtain their food. However
diversity within the various food groups was limited, resulting in poor dietary
diversity and poor nutritional diversity. This would be the main focus of any
nutrition education program that aims to alleviate the broader problems of
food security.
♦ The eighth sub-problem formulated for this research study was:
”How does all the food access strategies contribute to dietary diversity of farm
worker households on Oranje Farm?
Different food accessing strategies were identified and described in order to
find out how all the strategies contributed to dietary diversity (See Figure 5.1
mind map). Different strategies contributed differently.
127
♦ The ninth sub-problem formulated for this research study was:
”How does the dietary diversity of adult women of farm worker households on
Oranje Farm relate to their body mass index?”
The height and weight of all the adult women were taken and recorded to
calculate their body mass index. The majority of the women were obese (See
Table 4.5). Correlations of body mass index and their dietary diversity per
season were calculated (See Table 4.29). No relationship was found. In
conclusion more diversity does not always links with higher weights. In this
study the majority of women were obese but consuming poor variety of diet.
5.3 RECOMMENDATIONS
5.3.1 Recommendations from this research study
The results and conclusions were used to compile a mind map of the dietary
diversity issues and related food access problems (See Figure 5.1).
From the mind map it was possible to identify which strategies were utilized
most and least in various seasons (See Table 5.1).

128
FIGURE 5.1: MIND MAP OF THE DIETARY DIVERSITY ISSUES

129
TABLE 5.1: SUMMARY OF LEVELS OF UTILIZATION OF FOOD
ACCESSING STRATEGIES IN THE SEASONS
SEASONS FOOD ACCESSING STRATEGIES
Periods Production Purchasing Gathering Bartering Payment in kind
Summer *** ** *** ? ***
Autumn - * - ? **
Winter - * - ? **
Spring ** * ** ? **
* Less frequently; ** Frequently; *** More frequently;? Not really practiced; - Not done
It is clear from table 5.1 and mind map (See Figure 5.1) that almost all the
strategies were practiced and utilized during the summer season. Second on
the list was spring. The reason for this was that food is plentiful during these
two seasons, especially the summer period, when most of their cultivated
vegetables and fruits were available. The different wild vegetables, as well as
fish, were highly available. The festive season also affected their dietary
diversity, since a variety of food was purchased and spared in pre-preparation
for Christmas day. Different events such as weddings and parties held on the
farm and for the guest house on the farm impacted on the variety of food
available to the women working there. Most of the foods accessing strategies
were not practiced during autumn and spring, leading to poor dietary diversity.
Interventions need to be done during these two seasons to improve their
dietary diversity as well as their accessing strategies. The intervention can
include preserving variety of fruits and vegetables that are harvested during
summer in-order to be used on seasons where food is not plenty. This can be
used during autumn and winter period (See Table 5.1).
Education should focus on the following:
♦ Season – agricultural skills about crops cultivated and harvested during
autumn and winter should be improved. This can also include preservation
skills about fruit and vegetables.
♦ Strategies – education about other different food accessing strategies as
well as teaching them about bartering, or other known food accessing
strategies, should be taught in order for them to practice these during

130
autumn and winter. Improved practices would also aid in improved dietary
diversity and household food security.
5.3.2 Recommendations for future research
The following is recommended in light of the findings of this study and the
summary in Figure 5.1.
♦ It is recommended that the dietary diversity tool used in this study be used
with a large population group from different farms or other rural
communities to enhance generalisability of the findings.
♦ A “three day recall” investigation of household dietary diversity should be
conducted as a “seven day recall” is too long and therefore not easily
remembered.
♦ National food based dietary guidelines should include indigenous plants as
they play an important role in dietary diversity. This will help nutritionists to
identify and promote the indigenous nutritious food items most prevalent in
each area of the country.
♦ Only women were interviewed in this study. However, in order to have a
better idea of the comprehensive dietary diversity of a family, it would be
ideal if men are included as part of a study as well.
♦ More research should be done to identify different food accessing
strategies and to provide agricultural skills to farm worker households to
help in improving their gardening skills, in order to have a variety of food
items in their households.
Since the community on Oranje farm already used some gardening (although
limited) to improve their food intake, it was decided to improve their
knowledge and skills by educating them particularly on vitamin A-rich

131
vegetable gardening. With the help of the Agricultural Research Council
(Pretoria), the production of orange-fleshed sweet potato and other vitamin A
rich vegetables, like spinach, carrots, and butternut was promoted and
demonstrated, and daily consumption of these crops was strongly
recommended.
Certain different varieties of orange-fleshed sweet potato have sufficient beta-
carotene content to be considered a good source of provitamin A. Orange –
fleshed sweet potato helps in addressing vitamin A deficiency. Strategies
focusing on food diversification to address vitamin A deficiency aim to
increase the availability of, access to, and subsequently the consumption of
vitamin A – rich foods. Foods of plant origin are affordable and many
households have to rely on orange-fleshed fruit (e.g paw-paw and mango)
and vegetables (e.g. carrots, orange sweet –fleshed sweet potato, butternut,
pumpkin) as well as dark green leafy vegetables as their sole source of
vitamin A (Faber, Laurie & Venter, 2006:14).
This project was specifically focused on the relationship between vitamin A
and the identification of foods rich in vitamin A. Part of the education was also
to show the community the importance of home gardens as a source of foods
high in vitamin A. All the households were given seed, fertilizer, sweet potato
cuttings and even measuring sticks to plant in their own home gardens. A
nursery garden was also planted for the community to care for themselves, so
that everyone could have products and get seedlings continuously for their
home gardens. It was found to be a positive strategy to use. However, close
monitoring is required when introducing new strategies in communities until
they have adopted these as part of their food accessing methods (See Figure
4.14).

132
FIGURE 5.2: TEACHING THE COMMUNITY ABOUT VITAMIN A
(GARDENING)
5.4 LIMITATIONS OF THE STUDY
Some limitations in this study were found in the use of food variety analysis
that relied on the seven-day recall method for adult women. Recalling the
number of food items consumed over a period of seven days was difficult,
because most participants reported that it was a too long period. The food
variety scores (FVS) were found to be low in all the seasons when counting
the scores; however, it was clear that the community consumed an even less
varied diet during the season of early summer. This was due to the fact that
there was not enough food in the house together with the fact that they were
making arrangements for saving money for Christmas. Therefore, the number
of food items eaten over seven days was even less than during other periods.
The methodology used in this study can be transferred to other studies in the
Southern African context. The findings cannot be generalized based on the
information found, as the sample used was small. The tool used to calculate
the score was designed / focused specifically with the South African low-
income community in mind and the focus of the research project was to test
the instrument and to determine the viability of a DD and FV measure in a
scoring system that would be easy to implement and quick to calculate,
especially in an illiterate community.

133
References
ARIMOND, M & RUEL, M. 2002. Summery indicators for infants and child
feeding practices: An example from Ethiopia Demographic and Health Survey
2000. Food Consumption and Nutrition Division Discussion Paper.
Washington DC. International Food Policy Research Institute.
BABBIE, E. & MOUTON, J. 2001. The practice of social research. South
African edition. Cape Town. Oxford.
BELLAMY, C. 1998. The state of the world’s children. New York. UNICEF.
BMDP. Statistical software, Inc. 1993. Los Angels.
BRINK, A & BOSHOFF, E. 1983. Babavoeding in Garankuwa,
Bophuthatswana: Voedselverbruik en maaltydpatrone. Tydskrif vir Dietkunde
en Huishoudkunde. 11 (1): 9-13.
BROMILOW, C. 2001. Problem plants of South Africa. A guide to the
identification and control of more than 300 invasive plants and other weeds.
Briza. South Africa.
BUDLENDER, D. 1993. Community agency for social enquiry. Paper
presented at the Conference on Food Security in South Africa. Johannesburg,
June.
134
CORBETT, J. 1988. Family and household coping strategies. Third World
Quarterly. 16(9): 1099-1112.
CROUS, JM & BORCHARDT, S. 1982. Eetgewoontes van Pedi-huisgesinne
in Atteridgeville. Tydskrif vir Dieetkunde en Huishoudkunde. 10 (1): 29-31.
CROUS, JM & BORCHARDT, S. 1984. Dieetpatrone van Venda-gesinne in
Atteridgeville. Tydskrif vir Dieetkunde en Huishoudkunde. 12 (2): 41-44.
CROUS, JM & BORCHARDT, S. 1986. Dieetpatrone van Venda-gesinne in
Tshikundu Malema. Tydskrif vir Dieetkunde en Huishoudkunde. 14 (2): 44-47.
DEAGON, RE, & FIREBAUGH, FM. 1988. Family resource management.
Principles and application. 2nd ed. Boston. Allyn & Bacon.
DEPARTMENT OF SOCIAL SERVICES, POPULATION AND
DEVELOPMENT: POPULATION UNIT. 2001. Demographics of poverty in
Mpumalanga. Revised ed. Nelspruit. The Provincial Department of Social
services, Population and Development, Mpumalanga.
DERRICKSON, JP, SAKAI, M & ANDERSON, J. 2001. Interpretations of the
“Balanced Meal” Household food security Indicator. Society Nutrition
Education. 33(3) 155-160.
DREWNOSKI, A, HENDERSON, SA, SHORE, AB, FISCHLER, C.
PREZIOSKI, P & HERCBERG, S. 1996. Diet quality and dietary diversity in
France: Implication for the French paradox. Journal of American Dietetic
Association. 96: 663-669.
ENGLE, PL, BENTLEY, M & PELTO, G. 2000. The role programmes: current
research and a research agenda. Proceedings of the Nutrition Society. 59: 25-
35.

135
ENGLE, PL, LHOTSKA, L. & ARMSTRONG, H. 1997. The care initiative.
Assessment, Analysis & Action to improve care for nutrition. New York:
UNICEF.
FABER, M, LAURIE, S & VENTER, S. 2006. Home-gardens to address
vitamin A deficiency in South Africa: A food-based approach. ARC-
Roodeplaat Vegetable and Ornamental Plant Institute. Pretoria. South Africa.
FABER, M & BENADE, AJS. 2003. Integrated home gardening and
community-based growth monitoring activities to alleviate vitamin A deficiency
in a rural village in South Africa. 32: 24-30.
FAO, 1997. Agriculture, Food & Nutrition for Africa. Rome.
FERGUSON, E. 1993. Seasonal Food Consumption patterns and dietary
diversity of rural preschool. Ghanaian and Malawian children. Ecology of Food
and Nutrition. 29: 219-234.
FERNANDEZ, E, NEGRI, E, LA VECCHIA, C & FRANCESCHI, S. 2000. Diet
diversity and colorectal cancer. Preventative Medicine. 31: 11-14.
FOOD AND AGRICULTURAL ORGANISATION OF UNITED NATIONS. 1998
Rural women and food security: current situation and perspective. Rome Food
and Agricultural Organization of the United Nations.
FOOD SECURITY WORKING GROUP (AGRICULTURAL POLICY UNIT).
1997. Food security policy for South Africa. A discussion document. Pretoria.
The Department of Agriculture and land affairs.
GENTHE, B, STRAUSS, N, SEAGER, J.R, VUNDULE, C, MAFORAH, F &
KFIR, R. 1997. The effect of type of water supply on water quality in a
developing community of South Africa. Water Science Technology 35 (11-12),
35-40

136
GIBNEY, M. & VORSTER, H. 2001. South African Food Based Dietary
Guidelines. South African Journal of Clinical Nutrition. 14 (3): S2.
GREEN, F. 2004. A community based model for nutritional interventions.
Dissertation (PHD). Department of Consumer Science. University of Pretoria
(UP).
GOBOTSWANG, K. 1998. Household strategies of accessing food in
Botswana - The case of Chobe. In Mugabe M., Gabotswang, K. & Holmboe-
ottensen, G. (Eds). 1998. From food and security to nutrition security in
Botswana. Gabarone. National Institute of Development Research and
Documentation (NIR), University of Botswana and Department of General
Practice and Community Medicine (IASAM), University of Oslo.
GOLDEN, MHN. 1991. The nature of nutritional deficiency in relation to
growth failure & poverty. Acta. Paediatr. Second. Suppl. 374: 95-110.
GOPALAN, C. 2001. Achieving household nutrition security in societies in
transition: An overview. Asia. Pacific Journal of Clinical Nutrition. 10: S10-S11.
GULDAN, GS, ZEITLIN, MF, BEISER, AS, SUPER, CM, GERSHOFF, SN &
DATTA, S.1993. Maternal education and child feeding practices in rural
Bangladesh. Social Science and Medicine 36: 925-935
GUTHRIE, HA. & SHEER, JC. 1981. Validity of a dietary score for assessing
nutrient adequacy. Journal of the American Dietetic Association. 78: 240-245.
HARVARD WOMEN’S HEALTH WATCH. 1999. Dietary Diversity and body
fat. Nutrition. 6: 1-3.
HATLOY, A, TORHEIM, LE. & OSHAUGH, A. 1998. Food variety a good
indicator of nutritional adequacy of the diet? A case study from urban area in
Mali. European Journal of Clinical Nutrition. 52: 891-898.

137
HATLOY, AJ, HALLUND, MM, DIARA & OSHAUGH, A. 2000. Food variety,
socio-economic status and nutritional status in rural urban and rural areas in
Koutiala (Mali). Public Health Nutrition. 3 (1) 57-65.
HODDINOTT, J. 1999. Choosing outcome indicators of household food
security. International Food Policy Research Institute. North West.
Washington. USA.
HODDINOT, J & YOHANNES, Y. 2002. Dietary diversity as food security
indicator. Food and Nutrition Technical Assistance, Academy for Educational
Development. Washington, DC.
HSU-HAGE, B & WALHLQVIST, ML. 1996. Food variety of adult Melbourne
Chinese: a case study of population in transition. World Rev. Nutrition. 79: 53-
69
INTERGRATED NUTRITION PROGRAMME (INP). 1998. Broad Guidelines
for Implementation. Draft document 5. January 1988.
JEROME, NW, PELTO, GG & KANDEL, RF. 1980. An ecological approach to
nutritional anthropology. In Jerome, NW, Kandal, RF & Pelto, GH. 1980.
Nutritional anthropology. New York. Redgrave
JONES, SM. 1963. A study of Swazi nutrition. Durban. Institute of Social
Research. University of Natal.
KANT, K, SCHATZKIN, A, HARRIS, TA, ZIEGLER, RG & BLOCK, G. 1993.
Dietary diversity and subsequent mortality in the First National Health and
Nutrition Examination Survey Epidemiologic Follow-up Study. American
Journal of Clinical Nutrition. 57: 434-40.
KAVISHE, FP. 1995. Investing in nutrition at the national levels: an African
perspective. Proceedings of the Nutrition Society. 54 (2): 367-378.

138
KENNEDY, G, NANTEL, G & SHETTY, P. 2003. The scourge of “hidden
hunger”: global dimensions of micronutrient deficiencies. 32 (1-14.
KENNEDY, E & HADDAD, L. 1992. Food security and Nutrition. Food Policy.
17 (1): 2-6.
KGAPHOLA, MS. 2003. Food accessing strategies & utilization patterns of
rural households in Manhaar Ward. MPUMALANGA. Dessertation (PHD).
Department of Consumer Science. University of Pretoria (UP).
KGAPHOLA, MS & BOSHOFF, E. 2002. Proposal for a conceptual frame of
reference to study household‘s food accessing strategies and utilisation
patterns. Journal of Family Ecology and Consumer Science. 30:65-74.
KGAPHOLA, MS & V.ILJOEN, AT. 2000. Food habits of rural Swazi
households: 1939-1999, Part 1: Technological influences on Swazi food
habits. Journal of Family Ecology and Consumer Sciences. 28: 68-74.
KGAPHOLA, MS & V.ILJOEN, AT. 2004. Food habits of the rural Swazi
households: 1939-1999. Part 2: Socio-structural and ideological influences on
Swazi food habits. Journal of Family Ecology Sciences 32: 16-25.
KING, EM & ALDERMAN H. 2001. Empowering women to achieve Food
Security. International Food Policy Research Institute (IFPRI) 2020 vision.
Focus 6 Policy Brief 6 of 12 Washington DC. IFPRI.
KRUGER, HS, VENTER, CS, HESTER, H, VORSTER, DSC &
MARGARETTS, BM. 2002. Physical Inactivity is the major determinant of
obesity in black women in the North West Province, South Africa: The Thusa
Study. Nutrition. 18: 422-427.
KRUGER, R. 1999. Feeding practices and nutritional status of children (aged
0-3) in two clinics in the Moretele district. Dissertation (M. Dietetics).
University of Pretoria.

139
KRUGER, R. 2004. Assessment of dietary diversity and food coping
strategies of farm worker household on commercial farm in South Africa to
address household food security. Research Development Programme. 2004
to 2006. Department of Consumer Science. UP.
KUHNLEIN, HV. 2003. Micronutrient nutrition and traditional food systems of
indigenous peoples. Journal of the American Dietetic Association. 32: 33-37
LABADARIOS, D. 1999. Micronutrient deficiencies among South Africans.
South African Medical Journal. Feb 89(2): 4-6.
LADO, C. 2001. Environmental and socio-economic factors behind food
security a policy strategy in Botswana. Development of Southern Africa. 18
(2):141-168.
LADZANI, R, STEYN, NP & NEL, JH. 1992. A socio-economic profile of
households in semi rural areas of Lebowa with specific reference to dietary
habits. South African Journal of Food Science Nutrition. 4: 60-3.
LATHAM, MC. 1997. Human nutrition in the developing world. Food and
Agricultural Organization of the United Nations Rome. FAO.
LEE, RD & NIEMAN, DC .2003. Nutritional assessment. 3rd ed. Boston.
McGraw Hill.
MAcINTYRE, UE, KRUGER, HS, VENTER, CS & VORSTER, HH. 2002.
Dietary intakes of African population in different stages of transition in the
North West Province, South Africa: the Thusa study. Nutrition research. 22:
239-256.
MARSH, R. 1998. Building on traditional gardening to improve household food
security. Food Nutrition and Agriculture, No22/23.
140
MAUNDER, ENW, MATJI, J & MOLEO TH. 2001. South African Food Based
Dietary Guidelines. South African Journal of Clinical Nutrition. 14 (3): S7-S11.
MAUNDER, E & LABADARIOS, D. 1999. The food procurement and
household inventory method. In Labadarios, D (Ed). The National Food
Consumption Survey (NFCS): Children aged 1-9 years, South Africa, 1999.
Pretoria. The Department of Health.
MAXWELL, D, AHIADEKE, C, LEVIN, C, AMAR-KLEMESU, M, ZAKARIAH, S
& LAMPTEY, GM. 1999. Alternative food security indicators: revisiting the
frequency and severity of ‘coping strategies’. Food Policy. 24: 411-429.
McINTOUCH, EN. 1995. America food habits. Westport. Praeger Publ.
MCLACHLAN, M & KUZWAYO, P. 1997. Bold Choices: A Framework for
understanding the causes and consequences of malnutrition: Making the
South African Strategy Works; Drafts report. July.
MOOPA, I. Food coping strategies and the nutritional status of women living
farm worker households on Oranje Farm in the Fouriesburg district (RSA).
Masters thesis in preparation. Department of Consumer science. University of
Pretoria. UP.
MOUTON, J. 1996 Understanding social research. Pretoria. Van schaik.
MARUGKAR, AD & PAL, PP. 2004. Intake of nutrients and food sources of
nutrients among the Khasi tribal women of India. Nutrition. 20:268-273.
NAIDOO, S, PADAYACHEE, GN & VERBURGH AD. 1993. The impact of
Social & Political factors on nutrition in South Africa. SA Journal of Clinical
Nutrition. 6(3): 20-26.
OBERT, JC. 1986. Community Nutrition. 2nd Edition. London: Collier
Macmillan.
141
OGLE, BM & GRIVETTI, LV. 1985. Legacy of the chameleon: edible wild
plants in the Kingdom of Swaziland, Southern Africa. A cultural, ecological,
nutritional study. Part 3: Cultural and ecological analysis. Ecology of Food and
Nutrition. 17: 31-40.
OGLE, BM, HUNG, PH & TUYET, HT. 2001. Significance of wild vegetables
in micronutrient intakes of women in Vietnam: an analysis of food variety. Asia
Pacific of Clinical Nutrition. 10 (1): 21-30.
ONYANGO, AW. 2003. Dietary diversity, child nutrition and health in
contemporary African Communities. Department of Nutrition for health and
development, WHO. Switzerland. Elsivier.
ONYANGO, A, KOSKI, KG.& TUCKER, KL. 1998. Food diversity versus
breastfeeding choice in determining anthropometrics status in rural Kenyan
toddlers. International Journal of Epidemiology. 27: 484-489.
OUDKERK, ACF. 1965. Eating habits of urban Bantu, with special reference
to the school-going child. South African Medical Journal. 18 (12): 1148-1150.
POPKIN, BM.1994. The nutrition transition in low income countries: An
emerging crisis. Nutrition Review. 52:285-298.
RUEL, MT. 2002. Is dietary diversity an indicator of food security or dietary
quality? A review of measurement issues and research needs. Food
Consumption and Nutrition Division (FCND) no 140. Washington D.C.
SANJUR, D. 1982. Social and Cultural perspective in nutrition. Englewood
Cliffs, NJ Prentice Hall.
SAS. Institute inc., SAS. CARY, N.C: Institute Inc., 1999
142
SAYED, N .2002. Graduate reading fundamentals of nutrition security in rural
development. In Schonfeldt, H (Ed). Nutrition security in rural communities.
Pretoria. Flemish Interuniversity Council.
SIMS, LS & SMICIKLAS-WRIGHT, H. 1978. An ecological systems
perspective. Its application to nutrition policy, program design and evaluation.
Ecology of Food and Nutrition. 7: 173-179.
SOUTH AFRICAN VITAMIN A CONSULTATIVE GROUP (SAVACG). 1996.
Anthropometric, vitamin A, iron and immunization status in children aged 6-71
months. South African Medical Journal. 86:354-357.
STEYN, AGW, SMITH, CF, DUTUIT, SHC & STRASHEIM, C. 1999. Modern
statistics in practice. Van Schaik Publishers
STEYN, N.P, LABADARIOS, D & HUSKISSON, J. 1999. General introduction.
In Labadarios, D. (Ed). National Food Consumption Survey. Pretoria.
Department of Health: Directorate of Nutrition.
STEYN, NP & LABADARIOS, D. 1999. Dietary intake: 24 hour recall method.
In Labadarios, D. (Ed). National Food Consumption Survey. Pretoria.
Department of Health: Directorate of Nutrition.
STEYN, NP, NEL, JH, NANTEL, G, KENNEDY, G & LABADARIOS, D. 2006.
Food variety and dietary diversity scores in children: are they good indicators
of dietary adequacy. Public Health Nutrition. 9 (5): 644-650.
TAREN, D & CHEN, J. 1993. A positive association between extended
breastfeeding and nutritional status in rural Hubei Province. People’s Republic
of China. American Journal of Clinical Nutrition. 58: 862-867.
TARINI, A, BAKARI, S & DELISLE, H. 1999. The overall nutritional quality of
the diet is reflected in the growth of Nigerian children. Saute. 9: 23-31.

143
THOMAS, EP, SEAGER, JR & MATHEE, A. 2002. Environmental health
challenges in S.A: policy lessons from case studies. Health and Place.
UNITED STATES AGENCY FOR INTERNATIONAL DEVELOPMENT
(USAIDS). 1992. Economic rationale for investigating in micronutrient
programs; A policy brief based on new analyses. Washington. DC. United
States Policy determination definition of food security.
VAN WYK, BE. 2005. Food plants of the world. Identification, Culinary uses
and nutritional value. Cape Town.
WHITNEY, EN & ROLFES, SR. 2002. Understanding Nutrition. 9th EDITION.
London. Wadsworth.
WALKER, ARP, ADAM, F & WALKER, BF. 2001.World pandemic of obesity:
the situation in Southern African populations. Public Health. 115: 368-372.
WHO/FAO. 1996. Preparation and use of food based dietary guidelines.
Geneva. Nutrition programme.
WHO/FAO. 2002. Human vitamin and mineral requirements. Report of a joint
FAO/WHO expert consultation. Rome.
WORLD BANK. 1988. The challenge of hunger in Africa: a call to action.
Washington: International Bank for Reconstruction and Development.
WORLD BANK. 1986. World development report. New York: Oxford
University Press

144
Addendum A
DIETARY DIVERSITY QUESTIONNAIREDIETARY DIVERSITY QUESTIONNAIREDIETARY DIVERSITY QUESTIONNAIREDIETARY DIVERSITY QUESTIONNAIRE
BIOGRAPHIC INFORMATION
Please answer each of the following questions as best you can by placing a cross (x) in the
appropriate space. All your answers are strictly confidential and anonymous.
NAME:_______________________________________________
HOUSE NUMBER:_____________
Weight of the participant
Height of the participant
1. How old are you?
MARITAL STATUS
2. What is your marital status?
Single
Married
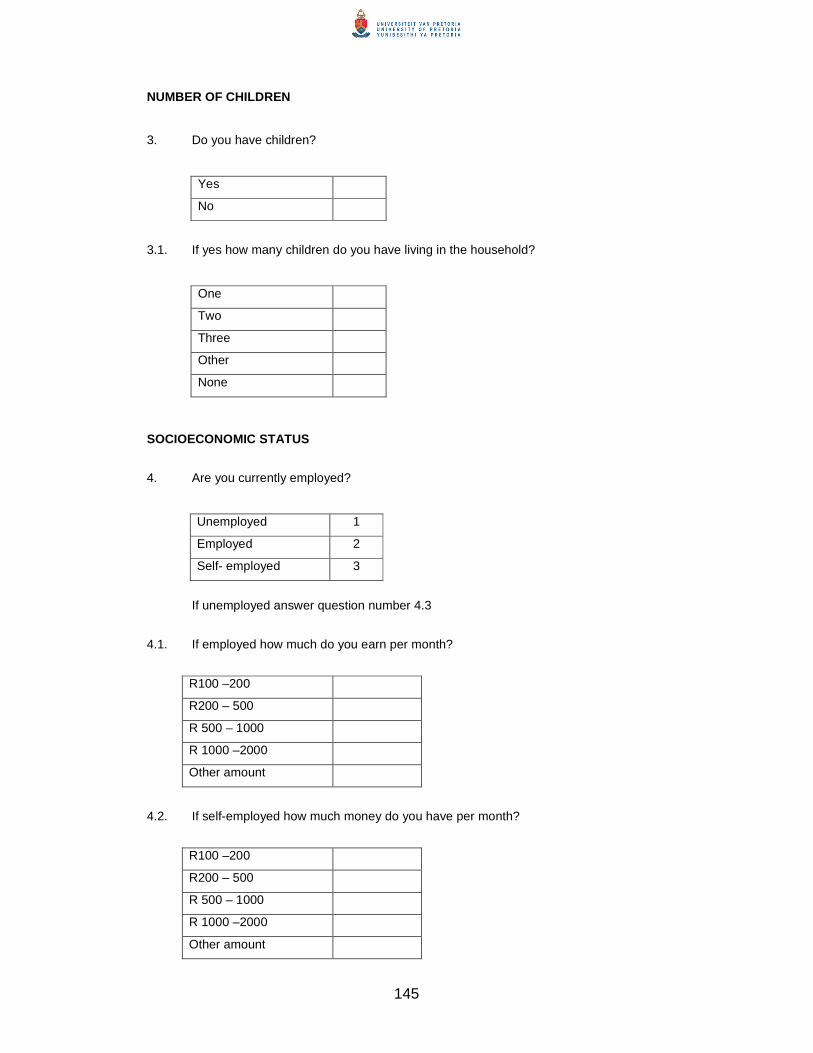
145
NUMBER OF CHILDREN
3. Do you have children?
Yes
No
3.1. If yes how many children do you have living in the household?
One
Two
Three
Other
None
SOCIOECONOMIC STATUS
4. Are you currently employed?
Unemployed 1
Employed 2
Self- employed 3
If unemployed answer question number 4.3
4.1. If employed how much do you earn per month?
R100 –200
R200 – 500
R 500 – 1000
R 1000 –2000
Other amount
4.2. If self-employed how much money do you have per month?
R100 –200
R200 – 500
R 500 – 1000
R 1000 –2000
Other amount

146
4.3. If unemployed where do you get money to buy food for the household?
Friends
Relatives
Child‘s father or husband
Mother
Father
Sister
Brother
Pension
Other
If given money, who is receiving it?
……………………………………………………………………………..
4.3.1. How much total amount coming into the household per month?
R100 –200
R200 – 500
R 500 – 1000
R 1000 –2000
Other amount
EDUCATIONAL STATUS
5. What level of education do you have?
Less than standard 1 1
Standard 1-4 2
Standard 5 3
Standard 6 4
Standard 7 5
Standard 8 6
Standard 9 7
Standard 10 8
Other 9

147
FOOD ACCESS AND DIETARY DIVERSITY
Access strategies
• FOOD PRODUCTION
6. Does any member of your household have access to any agriculture land or garden
plot?
Yes 1
No 2
7. What is the area of the plot? Enter size
Length
Height
8. How did your household acquire access to this plot?
Inherited 1
Purchased 2
Freely used land 3
Other 4
9. Do you use this plot?
Yes 1
No 2
If no, why? ………………………………………………………………..
..............………………………………………………………………….

148
10. Do you cultivate any food products (vegetable & fruits) for household food
consumption?
Yes 1
No 2
10.1 Do you produce (grow) your own vegetables?
Yes 1
No 2
10.2 If yes, what do you grow? Name the 5 items you grow throughout the different
seasons.
Vegetables Summer, winter, spring, autumn
10.3 Do you produce (grow) your own fruits?
Yes 1
No 2
10.4 If yes, what do you grow? Name the 5 items you grow throughout the different
seasons.
Fruits Summer, winter, spring, autumn
11. Do you have livestock (animals)?
Yes 1
No 2
If no, proceed to number 12

149
11.1 If you have livestock (yes answered to question 9), why do you have livestock?
…………………………………………………………………………………..
11.2 If yes, which do use as food or their products (you may mark more than one).
LIVESTOCK YES/NO
( 1 / 2)
END USE
Cattle 1 / 2
Chicken 1 / 2
Goats 1 / 2
Sheep 1 / 2
Pigs 1 / 2
Other (specify)
• FOOD GATHERING
12. Do you gather food from the veldt?
Yes 1
No 2
If no, proceed to 13
12.1 If yes, what do you gather? Name the 5 items you gather and the season in which
you gather the food?
Gathered food (Summer, spring, winter, autumn)
13. Do you hunt animals?
Yes 1
No 2

150
13.1 If yes, what animals are hunted as food? Give 5 items and season.
Animals Season
14. Do you fish?
Yes 1
No 2
If yes, give 5 items what and when (Season) do you fish?
Fish Season
• FOOD PURCHASING
15. Where do you buy most of your food? (Mark only one).
Hypermarket 1
Supermarket 2
Local shops 3
Spaza shops 4
Café 5
Street hawkers 6
Commercial farm (subsidized) 7
Market 8
Other 9

151
15.1 How often do you buy food (Mark only one).
Everyday 1
Once a week/everyday 2
3-4 times a week 3
Every second week 4
Once a month 5
Other 6
• FOOD BARTERING
16. Do you practice food bartering?
Yes 1
No 2
If no, why? ……………………………………………………………………….
16.1 If yes what do you barter with? Name 3
Food
16.2 With whom do you barter?
Friends 1
Neighbours 2
Relatives 3
Other 4
• PAYMENT IN KIND
17. Do you receive any food products that you can use in your household from the farm?
Yes 1
No 2

152
17.1 If yes what and when do you get those products? List 5 of them and their frequency
Food Daily, weekly, monthly, yearly
QUESTIONS TO TRIANGULATE PREVIOUS QUESTIONS
• EATING HABITS/PATTERNS
18. What method do you mostly use to get food in the house? (Name one).
Buy it 1
Produce it/ grow it myself 2
Receive it 3
Gather it from veldt/hunt it 4
Bartering
other 5
18.1 How often do you use the method?
Everyday 1
Once a week/everyday 2
3-4 times a week 3
Every second week 4
Once a month 5
Other 6
18.2 What second method do you use to get food in the house?
....................………………………………………………………………
…………………………………………………………………………….

153
18.3 How often do you use the method?
Everyday 1
Once a week/everyday 2
3-4 times a week 3
Every second week 4
Once a month 5
Other 6
18.4 What third method do you use to get food in the house?
...............……………………………………………………………………..
………………………………………………………………………………..
18.5 How often do you use the above method?
Everyday 1
Once a week/everyday 2
3-4 times a week 3
Every second week 4
Once a month 5
Other 6
19. How many meals do adults in the household normally eat per day?
One 1
Two 2
Three 3
Other 4
20. How many meals do your children normally eat per day?
One 1
Two 2
Three 3
Other 4

154
21. How many prepared meals (plate of food) do you personally eat per day?
One 1
Two 2
Three 3
Other 5
22. How many times do you snack (eat and / or drink) “in between” these meals?
TIME FOOD OR BEVERAGE
One
Two
Three
Other
23. Does your household eat meals together?
Yes 1
No 2
23.1 If no, how do they eat their meals?
………………………………………………………………………
………………………………………………………………………
24. What is the most commonly eaten food in your family? List three and RANK THEM .
• FOOD PREPARATION
25. Do you sometimes eat anywhere else than your own home?
Yes 1
No 2

155
25.1 If yes, where do you mostly eat? Choose one.
Restaurant
Shop
Café
None
Other
25.2 How often do you visit the above mentioned?
Everyday 1
Once a week/everyday 2
3-4 times a week 3
Every second week 4
Once a month 5
Other 6
25.3 Do you always prepare lunch box for your husband when going to work?
Yes 1
No 2
25.4 If no, where does he eat?
………………………………………………………………………
………………………………………………………………………
25.5 Do you always prepare lunch box for yourself when going to work?
Yes 1
No 2
25.6 If no, explain.
………………………………………………………………………
………………………………………………………………………

156
25.7 What do you normally prepare for lunch box? Name 3
25.8 Do you also prepare lunch box for your children to carry to school?
Yes 1
No 2
25.9 If no, where and what do they eat?
………………………………………………………………………
………………………………………………………………………
25.10 If yes what do they eat? Name 3 & RANK THEM .
Food
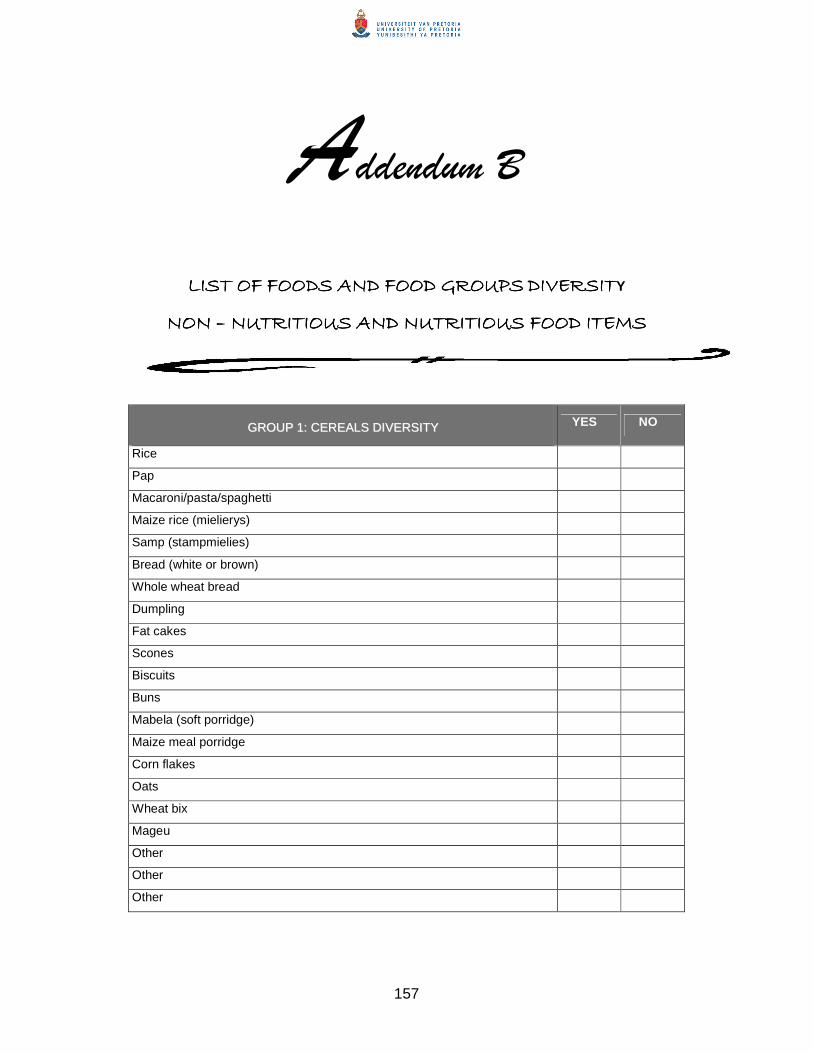
157
Addendum B
LIST OF FOODS AND FOOD GROUPSLIST OF FOODS AND FOOD GROUPSLIST OF FOODS AND FOOD GROUPSLIST OF FOODS AND FOOD GROUPS DIVERSITDIVERSITDIVERSITDIVERSITY
NON NON NON NON –––– NUTRITIOUS AND NUTRITI NUTRITIOUS AND NUTRITI NUTRITIOUS AND NUTRITI NUTRITIOUS AND NUTRITIOUS FOOD ITEMSOUS FOOD ITEMSOUS FOOD ITEMSOUS FOOD ITEMS
GGRROOUUPP 11:: CCEERREEAALLSS DDIIVVEERRSSIITTYY YES� NO�
Rice
Pap
Macaroni/pasta/spaghetti
Maize rice (mielierys)
Samp (stampmielies)
Bread (white or brown)
Whole wheat bread
Dumpling
Fat cakes
Scones
Biscuits
Buns
Mabela (soft porridge)
Maize meal porridge
Corn flakes
Oats
Wheat bix
Mageu
Other
Other
Other

158
GGRROOUUPP 22:: VVEEGGEETTAABBLLEESS DDIIVVEERRSSIITTYY YYEESS NNOO
Onions
Cabbage (red / green)
Beet root
Pumpkin (boerpampoen)
Rhubarb
Potatoes
Turnips (raap)
Gem-squash (lemoenpampoen)
Tomatoes
Green beans (fresh)
Sugar beans (dried)
Peas (fresh – green)
Peas (dried)
Cow peas
Jugo beans
Sweet potato
Carrots
Merogo
Spinach
Butternut
Cauliflower
Chili (red/green)
Lettuce
Mushroom
Baby marrow
Green pepper
Sweet-corn (baby)
Corn-on-the-cob (white)
Garlic
Other
Other
Other
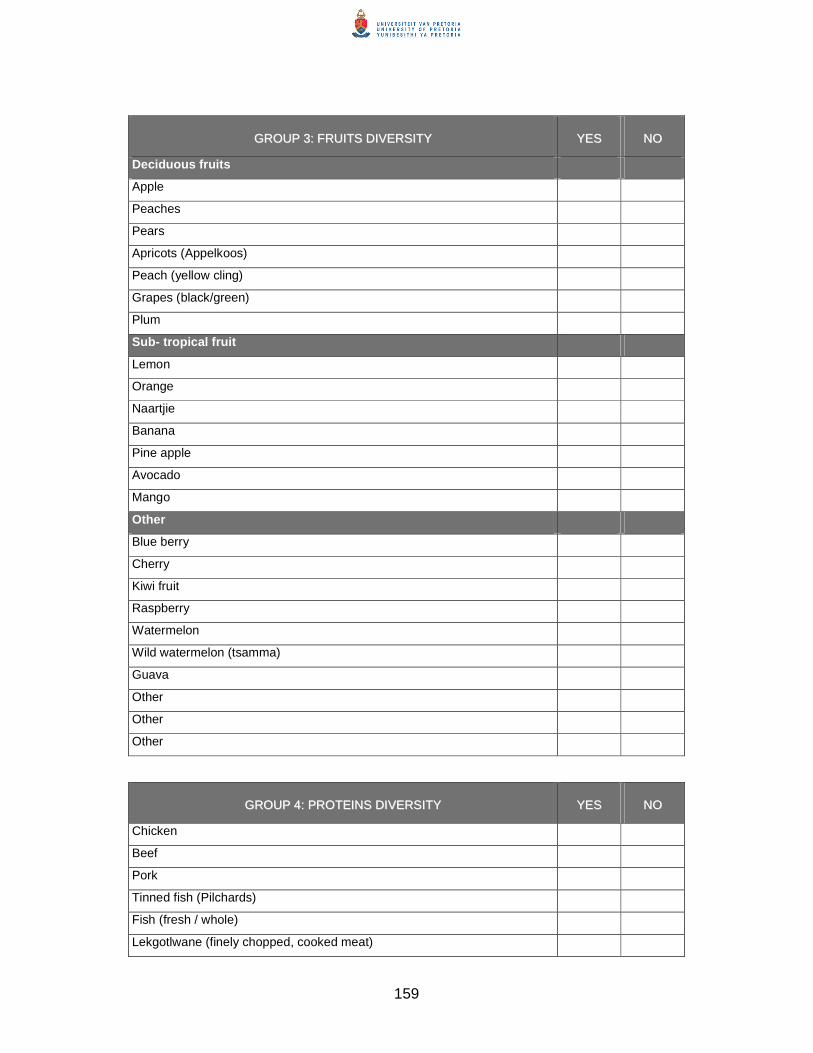
159
GGRROOUUPP 33:: FFRRUUIITTSS DDIIVVEERRSSIITTYY YYEESS NNOO
Deciduous fruits
Apple
Peaches
Pears
Apricots (Appelkoos)
Peach (yellow cling)
Grapes (black/green)
Plum
Sub- tropical fruit
Lemon
Orange
Naartjie
Banana
Pine apple
Avocado
Mango
Other
Blue berry
Cherry
Kiwi fruit
Raspberry
Watermelon
Wild watermelon (tsamma)
Guava
Other
Other
Other
GGRROOUUPP 44:: PPRROOTTEEIINNSS DDIIVVEERRSSIITTYY YYEESS NNOO
Chicken
Beef
Pork
Tinned fish (Pilchards)
Fish (fresh / whole)
Lekgotlwane (finely chopped, cooked meat)

160
Mutton
Tinned fish (Tuna)
Chicken runners & heads
Chicken livers
Goat (meat)
Mogodu & malana (Tripe)
Dried meat (biltong)
Viennas
Russians
Sausage (wors)
Steak
Tuckey
Polony
Eggs
Other
Other
Other
GGRROOUUPP 55:: MMIILLKK PPRROODDUUCCTTSS DDIIVVEERRSSIITTYY YYEESS NNOO
Milk, unpasteurized (cow)
Evaporated milk (unsweetened)
Maas/ inkomasi
Powdered milk
Skim or low-fat milk (pasteurized)
Full cream milk (pasteurized)
Cheese
Custard
Ice cream
Yoghurt
Ultramel
Yogisip
Other
Other
Other

161
GGRROOUUPP 66:: DDRRIINNKKSS DDIIVVEERRSSIITTYY YYEESS NNOO
Juice (100% pure juice e.g. Ceres / Liquifruit)
Juice (<100% pure / imitation juice)
Imitation drinks (sweeto,sixo,oros etc)
Soft drinks (Coke, Fanta etc.)
Milo / hot chocolate
Tea (Joko, rooibos etc)
Coffee (instant e.g. Frisco)
Other
Other
Other
GGRROOUUPP 77:: SSAAUUCCEE DDIIVVEERRSSIITTYY YYEESS NNOO
Tomato sauce
Mayonnaise
Chutney
Chakalaka
Atchar
Salad dressing
Soups
Other
Other
Other
GGRROOUUPP 88:: MMIISSCCEELLLLAANNEEOOUUSS DDIIVVEERRSSIITTYY YYEESS NNOO
Sugar
Jam
Jam (home made)
Liver pate
Peanut butter
Salt
Jelly
Marmite
Fish paste
Syrup (golden)

162
Other
Other
Other
GGRROOUUPP 99:: FFAATTSS,, OOIILL && SSWWEEEETTSS DDIIVVEERRSSIITTYY YYEESS NNOO
Butter
Sunflower oil
Margarine
Lard
Salad oil
Chappies
Chocolates
Chips (Simba)
Cheese curls
Other
Other
GGRROOUUPP 1100:: HHEERRBBSS DDIIVVEERRSSIITTYY YYEESS NNOO
Pumpkin herbs
Pecan nut
Peanut
Mint
Other
Other
Other
GGRROOUUPP 1111:: SSPPIICCEESS DDIIVVEERRSSIITTYY YYEESS NNOO
Chicken
Barbecue
Garlic
Pork
Curry powder (Rajah)
Paprika
Chili powder
Nutmeg
Turmeric

163
Parsley
Other
Other
Other
GGRROOUUPP 1122:: BBEEVVEERRAAGGEESS DDIIVVEERRSSIITTYY YYEESS NNOO
Beer
Wine (red or white)
Umqombothi
Traditional beer
Other
Other
Other
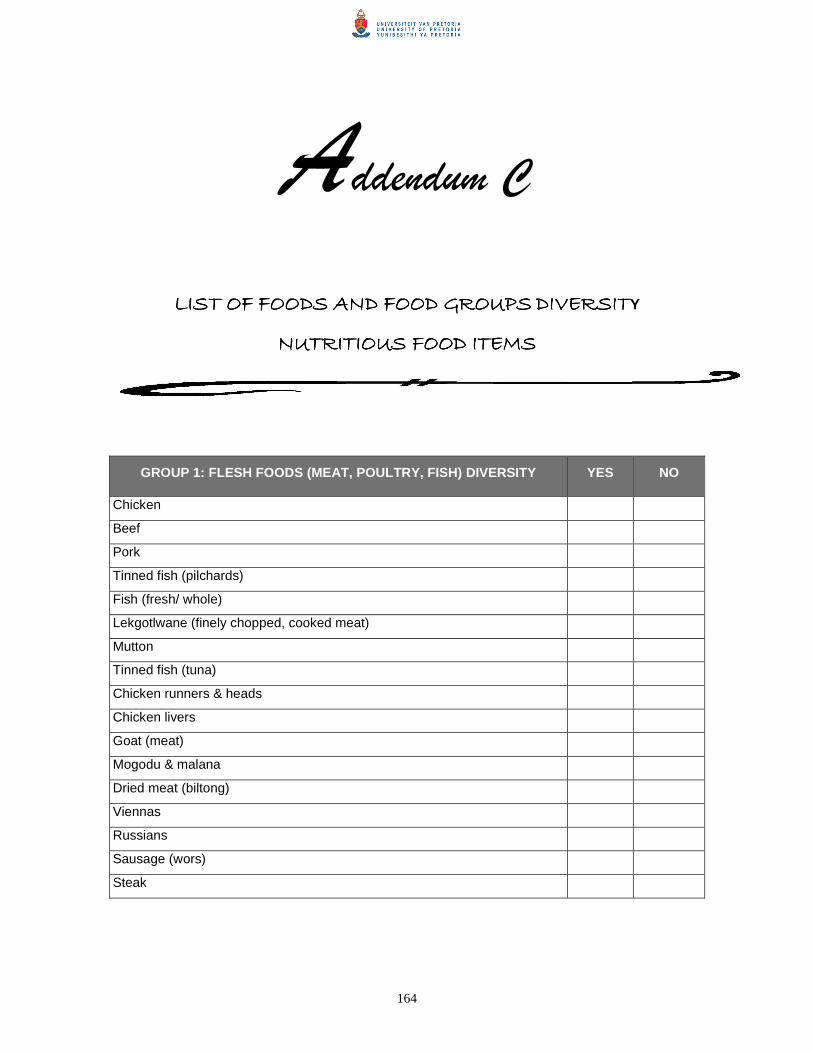
164
Addendum C
LIST OF FOODS AND FOOD GROUPSLIST OF FOODS AND FOOD GROUPSLIST OF FOODS AND FOOD GROUPSLIST OF FOODS AND FOOD GROUPS DIVERSITDIVERSITDIVERSITDIVERSITY
NUTRITIOUS FOONUTRITIOUS FOONUTRITIOUS FOONUTRITIOUS FOOD ITEMSD ITEMSD ITEMSD ITEMS
GROUP 1: FLESH FOODS (MEAT, POULTRY, FISH) DIVERSITY YES NO
Chicken
Beef
Pork
Tinned fish (pilchards)
Fish (fresh/ whole)
Lekgotlwane (finely chopped, cooked meat)
Mutton
Tinned fish (tuna)
Chicken runners & heads
Chicken livers
Goat (meat)
Mogodu & malana
Dried meat (biltong)
Viennas
Russians
Sausage (wors)
Steak
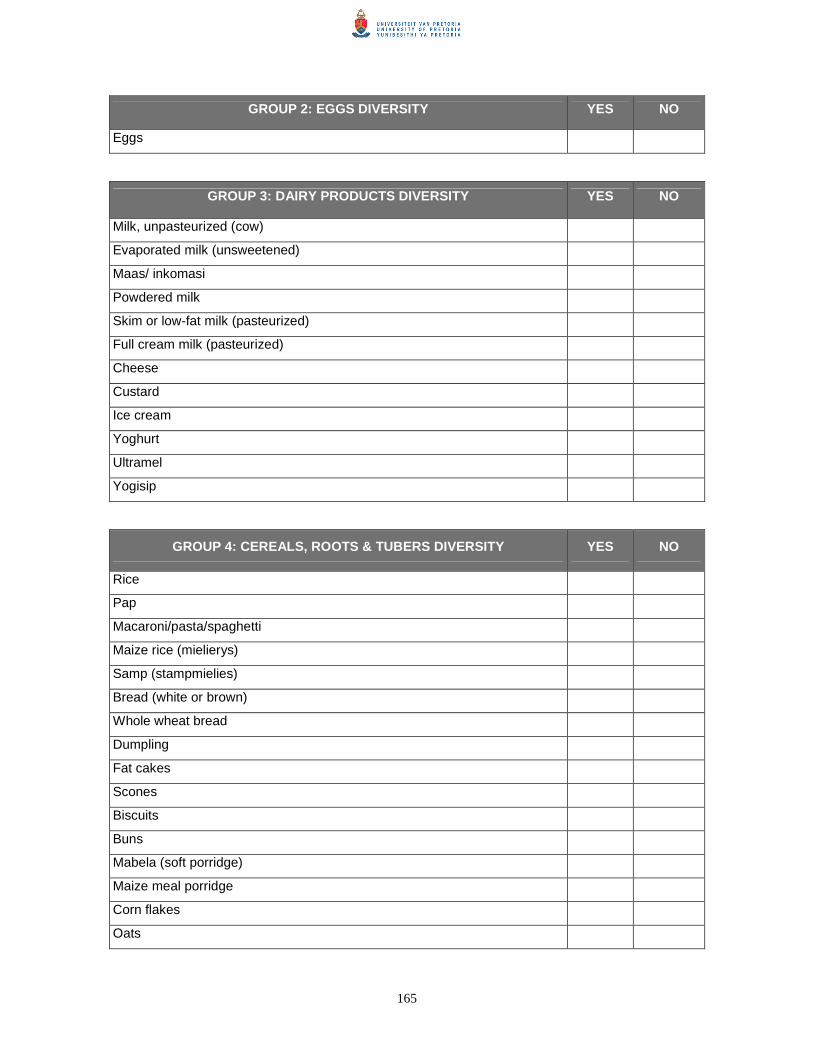
165
GROUP 2: EGGS DIVERSITY YES NO
Eggs
GROUP 3: DAIRY PRODUCTS DIVERSITY YES NO
Milk, unpasteurized (cow)
Evaporated milk (unsweetened)
Maas/ inkomasi
Powdered milk
Skim or low-fat milk (pasteurized)
Full cream milk (pasteurized)
Cheese
Custard
Ice cream
Yoghurt
Ultramel
Yogisip
GROUP 4: CEREALS, ROOTS & TUBERS DIVERSITY YES NO
Rice
Pap
Macaroni/pasta/spaghetti
Maize rice (mielierys)
Samp (stampmielies)
Bread (white or brown)
Whole wheat bread
Dumpling
Fat cakes
Scones
Biscuits
Buns
Mabela (soft porridge)
Maize meal porridge
Corn flakes
Oats

166
Wheat bix
Mageu
Potatoes
Sweet potatoes
Umqombothi
Traditional beer
GROUP 5: LEGUMES AND NUTS YES NO
Sugar beans
Peas (dried))
Cow peas
Jugo beans
Peanut butter
Peacan nut
Peanut
GROUP 6: VITAMIN A RICH FRUITS & VEGETABLES DIVERSITY YES NO
Pumpkin
Carrots
Wild leafy vegetables (morogo)
Fresh and dried
Spinach
Butternut
Apricots (Appelkoos)
Peach (yellow cling)
Mango
GROUP 7: OTHER FRUITS (AND JUICES) DIVERSITY YES NO
Deciduous fruits
Apple
Peaches
Pears
Grapes (black/green)
Plum

167
Sub- tropical fruit
Lemon
Orange
Naartjie
Banana
Pine apple
Avocado
Blue berry
Cherry
Kiwi fruit
Raspberry
Watermelon
Wild watermelon (tsamma)
Guava
Juices
Juice (100% pure juice e.g. Ceres / Liquifruit)
GROUP 8: OTHER VEGETABLES DIVERSITY YES NO
Onions
Cabbage
Beetroot
Rhubarb
Turnips (raap)
Gem-squash (lemoenpampoen)
Tomatoes
Green beans (fresh)
Peas (fresh – green)
Cauliflower
Chili (red/green)
Lettuce
Mushroom
Baby marrow
Green pepper
Sweet-corn (baby)
168
Corn-on-the-cob (white)
Garlic
GROUP 9: OILS AND FATS DIVERSITY YES NO
Butter
Sunflower oil
Margarine
Lard
Salad oil