the contribution of giant fields to united states oil production
TRANSCRIPT

U.S. DEPARTMENT OF THE INTERIOR
U.S. GEOLOGICAL SURVEY
THE CONTRIBUTION OF GIANT FIELDS TO UNITED STATES OIL PRODUCTION AND RESERVES
by
James W. Schmoker
Open-File Report 99-131
This report is preliminary and has not been reviewed for conformity with U.S. Geological Survey editorial standards or with the North American Stratigraphic Code. Any use of trade, product or firm names is for descriptive purposes only and does not imply endorsement by the U.S. Government.
U.S. Geological Survey, Mail Stop 939, Denver Federal Center, Denver, CO 80225
1999

INTRODUCTION
In the U.S., an oil field is regarded as "giant" if the sum of cumulative production and remaining (proved) reserves exceeds 100 million barrels of oil (mmbo). Giant fields account for a very small fraction of the total number of oil fields discovered in the U.S., but their importance to U.S. production - past and future - vastly exceeds their numerical proportion.
This report presents and interprets production and reserves data for giant U.S. oil fields, for the purpose of better understanding and forecasting U.S. oil production and the U.S. resource base. The primary data used here are arranged by location in two tables. Table 1 provides data for giant U.S. oil fields as of 1/1/98: this table contains field name and location; year of discovery; annual production in 1997; cumulative production, remaining reserves, and the sum of these two quantities (estimated total recovery) as of 1/1/98; and the ratio of remaining reserves to 1997 annual production. Table 2 lists those fields of Table 1 for which production and reserves data were also published in 1990: this table introduces columns for cumulative production, remaining reserves, and estimated total recovery as of 1/1/90; and the change in estimated total recovery between 1/1/90 and 1/1/98.
The data of Table 1 offer a snapshot of production and reserves characteristics of giant fields at one point in time. The estimated size (cumulative production plus proved reserves) of an oil field can change significantly over a relatively short time span because proved reserves are dependent upon factors that do not remain constant: the data of Table 2 capture changes in the sizes of many of these giant fields in the first eight years of the 1990's.
PRODUCTION AND RESERVES AS OF 1/1/98
The list of giant U.S. oil fields presented in Table 1, derived from the International Petroleum Encyclopedia (1998), is probably not exhaustive but appears to be reasonably complete. The implicit assumption is made here that Table 1 is sufficiently inclusive to warrant analysis. Table 1 could be incomplete due to: 1) the general vagaries of data collection and data bases; 2) omission of older fields that recently attained giant-field status; and 3) omission of recently discovered large fields.
Perspectives
The 293 giant U.S. oil fields, of which 16 have estimated total recoveries exceeding 1 billion barrels of oil (bbo), account for about 58% of the discovered oil in the U.S., and for 59% of cumulative U.S. oil production (Figure 1). These fields have contributed substantially to the economic development of the U.S.
As of 1/1/98, the estimated total recovery of oil from all giant fields in the U.S. was 113.1 bbo (Figure 1), which is roughly equivalent to that of Iran or Kuwait (see Masters and others, 1994). Only the Former Soviet Union has produced more oil (128.1 bbo) than the 101.8 bbo produced from giant U.S. oil fields (International Petroleum Encyclopedia, 1998). The giant U.S. oil fields, of themselves, would constitute a world-class oil "country".
The median discovery year for giant U.S. oil fields is 1935, and 90% of their recoverable oil has been produced (Figure 1). Their median and average ratios of remaining oil reserves to annual oil production are low. These data show that the giant oil fields of the U.S. form a mature
1

producing sector. However, production from these fields is still significant, even on a world scale. Production from giant U.S. oil fields averaged 3.65 mmbo/day in 1997, which is equal to 57% of daily U.S. oil production (Figure 1) and is a rate exceeded worldwide only by Saudi Arabia and the Former Soviet Union (International Petroleum Encyclopedia, 1998).
Fields Having Significant Remaining Potential
The previous discussion did not differentiate between giant fields which have significant remaining potential and those which appear to be in terminal decline. The former fields represent the future of the group; the latter fields have become, at a National perspective, part of history.
The remaining potential of giant U.S. oil fields is evaluated here on the basis of remaining reserves (as of 1/1/98) and annual production (in 1997). Figure 2 shows that, for both measures of remaining potential, relatively few fields account for most of the oil.
Fifty percent of 1997 annual production from all giant U.S. oil fields came from just 11 fields and 80% was supplied by 55 fields (Figure 2A). The distribution of remaining reserves is yet more uneven. As of 1/1/98, 50% of remaining reserves in all giant U.S. oil fields resided in just six fields and 80% was accounted for by 42 fields (Figure 2B).
Using the somewhat arbitrary criteria that giant fields having significant remaining potential are those that account for either 80% of total annual production or 80% of total remaining reserves, 59 giant U.S. oil fields are identified here as having significant remaining potential (Table 3). Of these, 38 fields qualify with respect to both annual production and remaining reserves.
The giant U.S. oil fields having significant remaining potential (Table 3) form a diverse group. They are distributed among 10 states, although most are located in Texas, California, and Louisiana (Figure 3). Common geologic features among these fields, other than access to an excellent oil-charge system, are not obvious, nor are they obvious for giant U.S. oil fields in general.
Field-Size and Oil-Volume Distributions
The field-size distribution of the 293 giant U.S. oil fields listed in Table 1 is extremely skewed (Figure 4A). The coefficient of skewness is 9.1. (A skewness coefficient greater than 1.0 is commonly considered to indicate a highly skewed distribution.) Note that the eye tends to be fooled by Figure 4A: the logarithmic size-category axis, necessary to construct a legible figure, greatly foreshortens the larger field-size categories and thus reduces the apparent skewness.
One hundred and fifty-one fields (almost 52%) have sizes between 100 and 200 mmbo, whereas only eight fields (about 3%) have sizes in the much larger range between 1,600 and 12,800 mmbo (Figure 4A). The biggest field of the group (Prudhoe Bay) is about 65 times larger than the median field of 194 mmbo. If this ratio were to be applied to the height of humans, a median adult height of 5.5 feet would imply the existence of people as tall as 358 feet.
Approximately equal volumes of oil are attributed to field-size categories 1, 2, and 3 (Figure 4B). The volume of oil ascribed to field-size categories 4 through 7 tends to decrease as

size category increases. (Data for size categories 6 and 7 are erratic because each category contains only one field.)
The U.S. is the most thoroughly explored large petroleum region in the world. As such, the field-size and oil-volume distributions for discovered giant U.S. oil fields (Figure 4) might provide as close an approximation to a natural (in situ) population of such fields as is presently known. For this reason, the distributions of Figure 4 could have value as analogs for some of the less explored regions of the world.
CHANGES IN FIELD SIZES BETWEEN 1/1/90 AND 1/1/98
The sizes (estimated total recoveries) of U.S. oil fields commonly change over time, in response to a large number of geological, technical, economic, and regulatory factors (e.g., Arrington, 1960; Attanasi and Root, 1994; Gautier and others, 1995; Schmoker and Crovelli, 1998). Recent changes in the sizes of 209 giant U.S. oil fields (of the 293 fields considered in the previous sections) can be examined here, using the production and reserves data as of 1/1/90 that are provided in Table 2.
Field-Size Changes Measured as Percentages
The great majority (96%) of the fields listed in Table 2 were 20 or more years old at the beginning of 1990; about two-thirds were discovered prior to 1941 (Figure 5). Almost all the fields are well past the period of initial development in which large changes in estimated total recovery can be expected to occur as a field is delineated and production practices are optimized. All U.S. fields are subject to a standard system for reporting remaining reserves, which minimizes capricious field-size changes. One might therefore think that after many years of development and production, the remaining potential of most of these giant oil fields should be well established, but Figure 6 shows that this is not the case.
Of the 209 fields in the data set of Table 2, the size of only 30 fields (14%) remained essentially unchanged on a percentage basis (larger or smaller by 0.5% or less) between 1/1/90 and 1/1/98 (Figure 6A). Sixty-five fields (31%) increased or decreased in size by 0-.5 to 4% in this eight-year period, 52,6^^ (25%) changed in size by 4 to 10%, and 62 fields (30%) changed in size by more than 10%. (These percentage changes are relative to 1/1/90 sizes.) From these data it is apparent that significant adjustments in estimated total recovery have been the norm, and not the exception, for giant U.S. oil fields in the first eight years of the 1990's.
Furthermore, Figure 6A shows that field-size increases outnumbered field-size decreases by more than two to one. Excluding the 30 fields with little percentage change, 126 fields increased in size whereas 53 fields decreased in size.
Production and reserves data as of 1/1/90 are available for 48 of the 59 giant U.S. oil fields having significant remaining potential. The percent-change distribution for these 48 fields (Figure 6B) is weighted more heavily to the right than the distribution for the entire group of giant fields (Figure 6A). Of the fields with significant remaining potential, the size of seven fields remained essentially unchanged on a percentage basis, 37 fields increased in size, and only four fields decreased in size (Figure 6B). More than half of these fields (54%) increased in size by over 10%.

The group of giant U.S. oil fields having significant remaining potential has been buoyed by large recent increases (1/1/90 - 1/1/98) in field sizes (Figure 6B). These large field-size increases could be the result of high annual production rates; conversely, large field-size increases could drive annual production rates. Cause and effect are here complexly interwoven.
Field-Size Changes Measured as Barrels of Oil
Of the 209 giant U.S. oil fields in the data set of Table 2, the size of 29 fields (14%) increased or decreased by only 1 rnmbo or less between 1/1/90 and 1/1/98 (Figure 7A). Sixty- seven fields (32%) increased or decreased in size by 1 to 10 rnmbo in this eight-year period, 73 fields (35%) changed in size by 10 to 40 rnmbo, and 40 fields (19%) changed in size (larger or smaller) by more than 40 rnmbo. Changes in estimated total recovery of tens of millions of barrels were common for giant U.S. oil fields in the first eight years of the 1990's (Figure 7A).
The distribution of Figure 7 A is weighted toward the right, indicating that field-size increases have added substantially more oil than has been lost by field-size decreases. A number of giant U.S. oil fields have had extraordinarily long reserves lives and are declining at rates below expectations, largely because of the tendency for their estimated total recoveries to increase with time (Hatcher and Tussing, 1997).
The net change in estimated total recovery of the 209 giant U.S. oil fields contributing to Figure 7A (that is, the sum of the 209 individual field-size changes) is an increase of 5,896 rnmbo. This volume is equal to 2.5 years of U.S. oil production, assuming average daily production at the 1997 rate of 6.40 mmbo/day (Figure 1).
Of the 48 giant U.S. oil fields having significant remaining potential that are contributing to Figure 7B (a subset of the 59 fields of Table 3), 35 (73%) increased in size by more than 20 rnmbo in the first eight years of the 1990's. The net change in estimated total recovery of these 48 fields is an increase of 6,439 rnmbo (compared to a net increase of 5,896 rnmbo for the parent set of 209 giant fields).
As shown in Figure 7B, the size of two fields having significant remaining potential increased by more than 1,000 rnmbo between 1/1/90 and 1/1/98: these Alaskan fields are Prudhoe Bay (2,631 rnmbo) and Kuparuk River (1,094 rnmbo). The 12 fields of Figure 7B with field-size increases between 100 and 1,000 rnmbo ar° M^Tvay-Sunset (440 rnmbo, California), Wasson (288 rnmbo, Texas), Belridge S. (268 rnmbo, California), Spraberry Trend (201 rnmbo, Texas), Slaughter (176 rnmbo, Texas), Endicott (153 mmbo, Alaska), Seminole (148 mmbo, Texas), Levelland (130 mmbo, Texas), Rangely (117 mmbo, Colorado), Sho-Vel-Tum (115 mmbo, Oklahoma), Giddings (113 mmbo, Texas), and Cowden N. (111 mmbo, Texas). At the other extreme, East Texas field (Texas) decreased in size by 616 mmbo, and Elk Hills field (California) decreased by 65 mmbo.
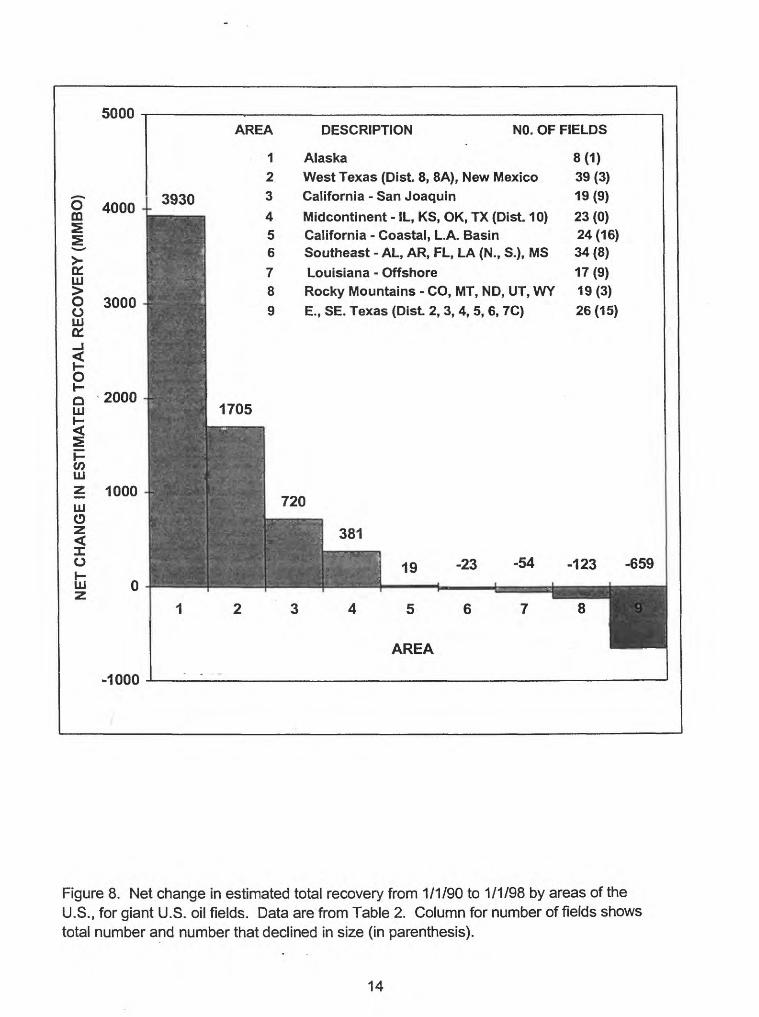
Field-Size Changes by Location
Regional differences in patterns of field-size changes exist among the 209 giant U.S. oil fields of Table 2 (Figure 8). The giant fields of five areas had a net increase in estimated total recovery between 1/1/90 and 1/1/98, whereas the giant fields of four areas had a net decrease (Figure 8). The North Slope of Alaska provided the largest net increase, followed by the Permian Basin of West Texas and New Mexico, the San Joaquin Basin of southern California,

and basins of the Midcontinent. The Los Angeles Basin and coastal areas of California (area 5) showed a positive but relatively insignificant net change in estimated total recovery.
Each of the three areas that encompass the U.S. Gulf Coast (areas 6, 7, and 9) had net decreases in estimated total recovery of giant fields (Figure 8). The net change in area 9 would be negative even if the East Texas field (which decreased in size by 616 mmbo) were excluded. In the Rocky Mountains (area 8), only three of 19 giant fields decreased in size, but these decreases were large enough to place the area into the negative-change category.
Producing areas within the U.S. differ from one another with respect to factors affecting field-size changes, such as geologic characteristics, oil-field practices, and perhaps reserves- reporting patterns. Figure 8 illustrates how these differences can lead to very dissimilar regional perceptions of the volume of discovered but yet-to-be-produced oil in the U.S.
SUMMARY
1. In the U.S., a giant oil field is one whose size exceeds 100 mmbo. This study examines 293 giant fields (Table 1), using data as of 1/1/98. Recent changes in the sizes of 209 of these fields (Table 2) are also investigated, using production and reserves data as of 1/1/90.
2. Giant oil fields are still important to the U.S. energy picture (Figure 1). Average daily production in 1997 from giant fields was 3.65 mmbo/day (57% of total U.S. oil production), and remaining reserves were 11.3 bbo (50% of total U.S. remaining oil reserves).
3. Among the 293 giant U.S. oil fields, 59 fields account for 80% of total annual production (in 1997) and 80% of total remaining reserves (as of 1/1/98). These 59 fields (Table 3) are identified here as giant fields having significant remaining potential.
4. The field-size distribution of giant U.S. oil fields (Figure 4), which provides a possibleanalog for some less explored regions of the world, is highly skewed. One hundred and fifty- one fields have sizes between 100 and 200 mmbo, whereas only eight fields have sizes in the much larger range between 1,600 and 12,800 mmbo.
5. Although the median discovery year of giant U.S. oil fields is 1935, changes in field size (larger or smaller) of tens of millions of barrels were common between 1/1/90 and 1/1/98. The number of fields that increased in size outnumbered those that decreased in size by more than two to one (Figures 6, 7).
6. Changes in individual field sizes in the first eight years of the 1990's were highly variable. Some of this variability is related to regional location (Figure 8). Overall, the estimated total recovery of the 209 giant U.S. oil fields for which necessary data are available for analysis increased by 5,896 mmbo, equal to about 2.5 years of current U.S. oil production. The estimated total recovery of a subset of 48 giant fields having significant remaining potential increased by 6,439 mmbo.

REFERENCES CITED
Arrmgton, J.R., 1960, Predicting the size of crude reserves is key to evaluating exploration programs: Oil & Gas Journal, v.58, no. 9 (February 29), p. 130-134.
Artanasi, E.D., and Root, D.H., 1994, The enigma of oil and gas field growth: American Association of Petroleum Geologists Bulletin, v. 78, no. 3, p. 321-332.
Gautier, D.L., Dolton, G.L., Takahashi, K.I., and Varnes, K.L., eds., 1995, 1995 Nationalassessment of United States oil and gas resources - Results, methodology, and supporting data: U.S. Geological Survey Digital Data Series DDS-30.
Hatcher, D.B., and Tussing, A.R., 1997, Long reserves lives sustain prospects for independents in the U.S. lower 48: Oil & Gas Journal, v. 95, no. 46 (November 17), p. 49-59.
International Petroleum Encyclopedia, 1990, U.S. fields with reserves exceeding 100 million bbl (data table): Tulsa, OK, PennWell Publishing Co., 378 p.
International Petroleum Encyclopedia, 1998, U.S. fields with ultimate oil recovery exceeding 100 million bbl (data table): Tulsa, OK, PennWell Publishing Co., [CD-ROM].
Masters, C.D., Artanasi, E.D., and Root, D.H., 1994, World petroleum assessment and analysis: Proceedings of the 14th World Petroleum Congress, Chichester, England, John Wiley and Sons, v. 5, p. 529-541.
Schmoker, J.W., and Crovelli, R.A., 1998, A simplified spreadsheet program for estimating future growth of oil and gas reserves: Nonrenewable Resources, v. 7, no. 2, p. 149-155.

General
Number and estimated total oil recovery of all giant fields: 293 fields, 113.1 bbo Number and estimated total oil recovery of giant fields >1 bbo: 16 fields, 42.4 bbo Estimated total U.S. oil recovery: 195.6 bbo
Median discovery year of giant fields: 1935
Median size of giant fields: 194 mmbo Average size of giant fields: 386 mmbo
Annual and Cumulative Production
Average daily oil production in 1997 from all giant fields: 3.65 mmbo/day Average daily U.S. oil production in 1997: 6.40 mmbo/day Average daily U.S. oil consumption in 1996: 17.40 mmbo/day
Cumulative oil production from all giant fields: 101.8 bbo Cumulative U.S. oil production: 173.2 bbo
Remaining Reserves
Remaining (proved) oil reserves in all giant fields: 11.3 bbo Remaining (prove !) T. T S. oil reserves: 22.4 bbo
Median remaining oil reserves/annual oil production ratio of giant fields: 5.7 years Average remaining oil reserves/annual oil production ratio of giant fields: 8.3 years Average remaining U.S. oil reserves/annual U.S. oil production ratio: 9.6 years
Figure 1. Numerative overview of giant U.S. oil fields (fields larger than 100 mmbo) as of 1/1/98. Data are from Table 1 and International Petroleum Encyclopedia (1998). [mmbo = million barrels of oil. bbo = billion barrels of oil.]

100
50 100 150 200 250
GIANT-OIL-FIELD RANK BY ANNUAL PRODUCTION
300
B
;£UJ
O
50 100 150 200 250
GIANT-OIL-FIELD RANK BY REMAINING RESERVES
300
Figure 2. Cumulative percent of total annual production in 1997 (A) and of total remaining reserves as of 1/1/98 (B) for giant U.S. oil fields. Data are from Table 1.

New Mexico
Louisiana
California
Texas
10 15
NUMBER OF FIELDS
20
Figure 3. Locations of giant U.S. oil fields having significant remaining potential. These fields are defined and listed in Table 3.

100-200200-400400-800800-16001600-32003200-64006400-12800
FIELD-SIZE CATEGORY
2345
FIELD-SIZE CATEGORY
Figure 4. Number of fields (A) and volume of oil (estimated total recovery as of 1/1/98) (B) by field-size category, for giant U.S. oil fields. Data are from Table 1.
10

0!<LLJ
LU
O O CO
O
10 15 20 25»« - .~~---NUMBER OF FIELDS
30 35
Figure 5. Discovery year of giant U.S. oil fields for which production and reserves data as of 1/1/90 and 1/1/98 are available. Data are from Table 2.
11

UJ Li. LL. O
X. Ul CO
-69 -30 -25 -20 -15 -10 -6 -4 -2 -.5 .5 2 4 6 10 15 20 25 30 73
CHANGE IN FIELD SIZE (PERCENT)
B
CO 0
UJ LL. LL. O
QL LU CQ
-30 -25 -20 -15 -10 -6 -4 -2 -.5 .52 4 6 10 15 20 25 30 73
CHANGE IN FIELD SIZE (PERCENT)
Figure 6. Number of giant U.S. oil fields (A) and number of giant U.S. oil fields having significant remaining potential (B) by change in field size - measured in percent - from 1/1/90 to 1/1/98. Data are from Tables 2 and 3.
12

A35 -T
30 -
S 25-_jUJ
t 20-
OS 15-m
D 10z
5-
0 -0
3
V"»f »**"
8
' S
16
I y
12
9
" 2
29
.24
6
I :
, 4?
9 ;
!
28
n
'
26
u j^
- j:
19
\
i
'v « I "
2;"***
-1000-100-40 -20 -10-5-1 1 5 10 20 40 1001000-2700
CHANGE2700
IN FIELD SIZE (MMBO)
B
CO Q_J UJ
u_ O X.UJ CD
-1000-100-40-20 -10-5-1 1 5 10 20 401001000 -2700 2700
CHANGE IN FIELD SIZE (MMBO)
Figure 7. Number of giant U.S. oil fields (A) and number of giant U.S. oil fields having significant remaining potential (B) by change in field size - measured in million barrels of oil - from 1/1/90 to 1/1/98. Data are from Tables 2 and 3.
13
5000 -I
0 4000 CDS
tt
8!0 3000 -UJ
3O
0 2000 -UJ
COUJ
z 1000 -UJ0zX O
uj o -
-1000
AREA DESCRIPTION NO. OF FIELDS
1 Alaska 8(1)2 West Texas (Dist. 8, 8A), New Mexico 39 (3)
3930 3 California - San Joaquin 19(9) ~+.,.*-+ > 4 Midcontinent - IL, KS, OK, TX (Dist. 10) 23(0)
-, 5 California - Coastal, L.A. Basin 24(16)~ 3 6 Southeast -AL.AR, FL, LA (N., S.), MS 34(8)
_ Jj 7 Louisiana - Offshore 17(9) mmmam s Rocky Mountains - CO, MT, ND, UT, WY 19(3)
^^B 9 E., SE. Texas (Dist. 2, 3, 4, 5, 6, 7C) 26(15)
j^HRH5 1705Up: - \
^FK "
B 72°B ' ' * *' 1 381Bt --- -n^n ^| 19 -23 -54 -123 -659
' ' * 4^Ei^fc-
1 2 3 4 5 6 7 8 j; 9
AREA ^^B |
Figure 8. Net change in estimated total recovery from 1/1/90 to 1/1/98 by areas of the U.S., for giant U.S. oil fields. Data are from Table 2. Column for number of fields shows total number and number that declined in size (in parenthesis).
14
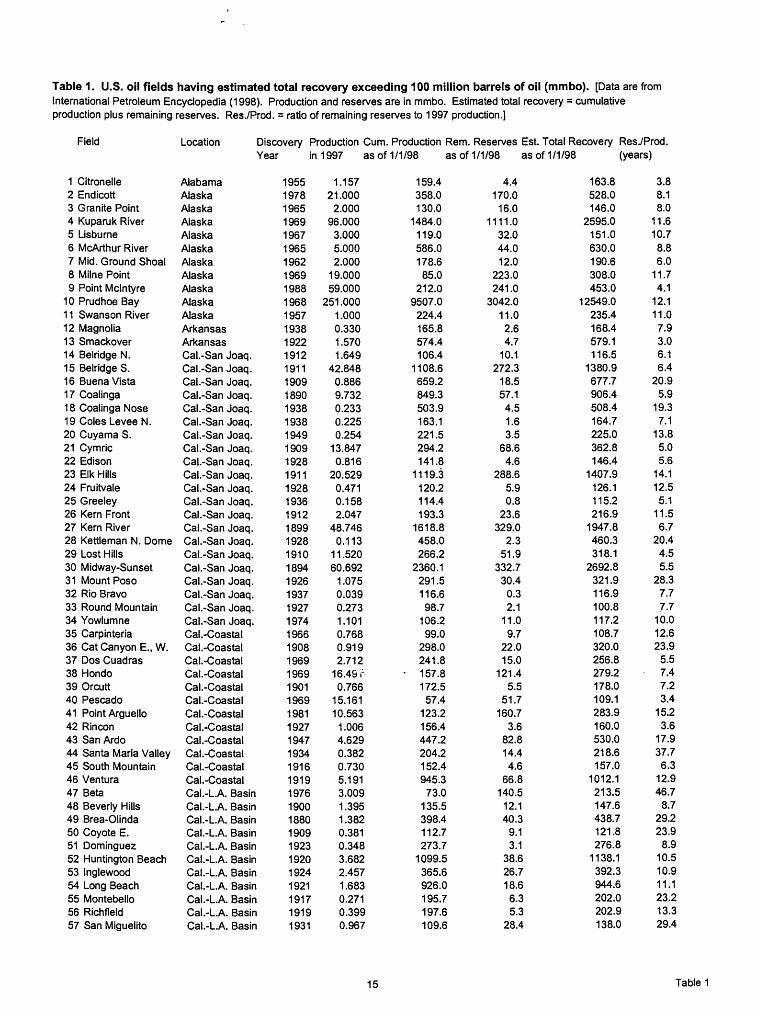
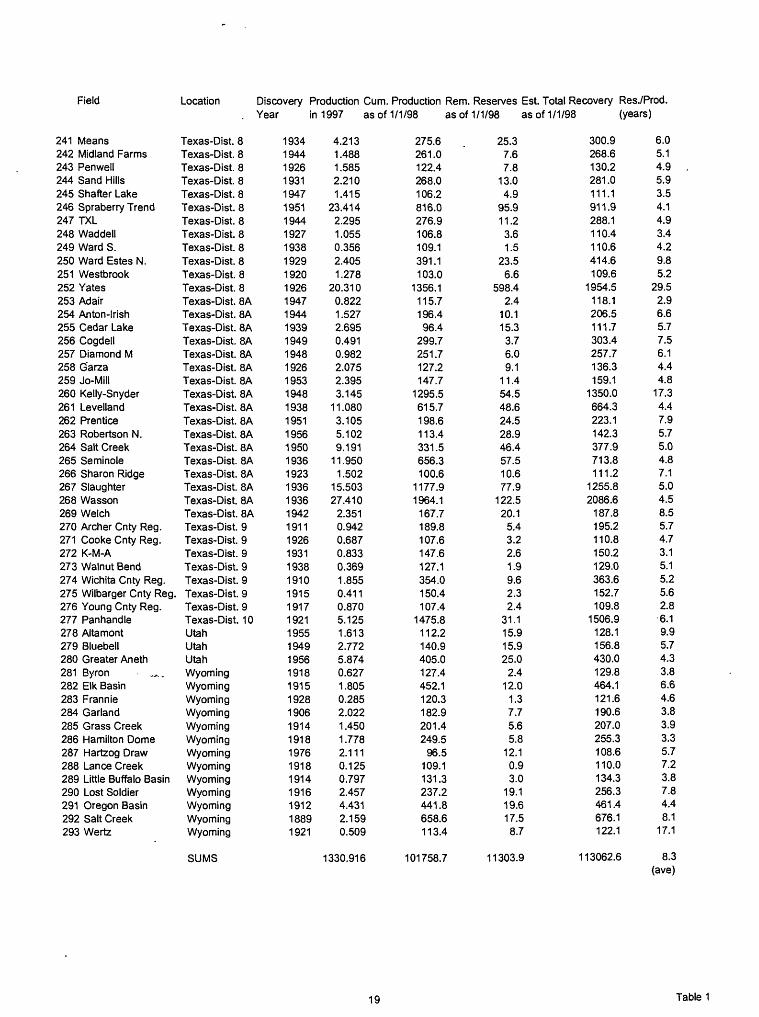
Table 1. U.S. oil fields having estimated total recovery exceeding 100 million barrels of oil (mmbo). [Data are from International Petroleum Encydopedia (1998). Production and reserves are in mmbo. Estimated total recovery = cumulative production plus remaining reserves. Res./Prod. = ratio of remaining reserves to 1997 production.]
Field Location Discovery Production Cum. Production Rem. Reserves Est. Total Recovery Res./Prod. Year in 1997 as of 1/1/98 as of 1/1/98 as of 1/1/98 (years)
1 Citronelle2 Endicott3 Granite Point4 Kuparuk River5 Lisburne6 McArthur River7 Mid. Ground Shoal8 Milne Point9 Point Mclntyre
10 Prudhoe Bay1 1 Swans on River12 Magnolia13 Smackover14 Belridge N.15 Belridge S.16 Buena Vista17 Coalinga1 8 Coalinga Nose19 Coles Levee N.20 Cuyama S.21 Cymric22 Edison23 Elk Hills24 Fruitvale25 Greeley26 Kern Front27 Kern River28 Kettleman N. Dome29 Lost Hills30 Midway-Sunset31 Mount Poso32 Rio Bravo33 Round Mountain34 Yowlumne35 Carpinteria36 Cat Canyon E., W.37 Dos Cuadras38 Hondo39 Orcutt40 Pescado41 Point Arguello42 Rincon43 San Ardo44 Santa Maria Valley45 South Mountain46 Ventura47 Beta48 Beverly Hills49 Brea-Olinda50 Coyote E.51 Dominguez52 Huntington Beach53 Inglewood54 Long Beach55 Montebello56 Richfield57 San Miguelito
AlabamaAlaskaAlaskaAlaskaAlaskaAlaskaAlaskaAlaskaAlaskaAlaskaAlaskaArkansasArkansasCal.-San Joaq.Cal.-San Joaq.Cal.-San Joaq.Cal.-San Joaq.Cal.-San Joaq.Cal.-San Joaq.Cal.-San Joaq.Cal.-San Joaq.Cal.-San Joaq.Cal.-San Joaq.Cal.-San Joaq.Cal.-San Joaq.Cal.-San Joaq.Cal.-San Joaq.Cal.-San Joaq.Cal.-San Joaq.Cal.-San Joaq.Cal.-San Joaq.Cal.-San Joaq.Cal.-San Joaq.Cal.-San Joaq.Cal.-CoastalCal.-CoastalCal.-CoastalCal.-CoastalCal.-CoastalCal.-CoastalCal.-CoastalCal.-CoastalCal.-CoastalCal.-CoastalCal.-CoastalCal.-CoastalCal.-L.A. BasinCal.-L.A. BasinCal.-L.A. BasinCal.-L.A. BasinCal.-L.A. BasinCal.-L.A. BasinCal.-L.A. BasinCal.-L.A. BasinCal.-L.A. BasinCal.-L.A. BasinCal.-L.A. Basin
195519781965196919671965196219691988196819571938192219121911190918901938193819491909192819111928193619121899192819101894192619371927197419661908196919691901196919811927194719341916191919761900188019091923192019241921191719191931
1.15721.000
2.00096.000
3.0005.0002.000
19.00059.000
251.0001.0000.3301.5701.649
42.8480.8869.7320.2330.2250.254
13.8470.816
20.5290.4710.1582.047
48.7460.113
11.52060.692
1.0750.0390.2731.1010.7680.9192.712
16.49 r0.766
15.16110.563
1.0064.6290.3820.7305.1913.0091.3951.3820.3810.3483.6822.4571.6830.2710.3990.967
159.4358.0130.0
1484.0119.0586.0178.685.0
212.09507.0
224.4165.8574.4106.4
1108.6659.2849.3503.9163.1221.5294.2141.8
1119.3120.2114.4193.3
1618.8458.0266.2
2360.1291.5116.698.7
106.299.0
298.0241.8
- 157.8172.557.4
123.2156.4447.2204.2152.4945.3
73.0135.5398.4112.7273.7
1099.5365.6926.0195.7197.6109.6
4.4170.0
16.01111.0
32.044.012.0
223.0241.0
3042.011.02.64.7
10.1272.3
18.557.14.51.63.5
68.64.6
288.65.90.8
23.6329.0
2.351.9
332.730.4
0.32.1
11.09.7
22.015.0
121.45.5
51.7160.7
3.682.814.44.6
66.8140.5
12.140.3
9.13.1
38.626.718.6
6.35.3
28.4
163.8528.0146.0
2595.0151.0630.0190.6308.0453.0
12549.0235.4168.4579.1116.5
1380.9677.7906.4508.4164.7225.0362.8146.4
1407.9126.1115.2216.9
1947.8460.3318.1
2692.8321.9116.9100.8117.2108.7320.0256.8279.2178.0109.1283.9160.0530.0218.6157.0
1012.1213.5147.6438.7121.8276.8
1138.1392.3944.6202.0202.9138.0
3.88.18.0
11.610.78.86.0
11.74.1
12.111.07.93.06.16.4
20.95.9
19.37.1
13.85.05.6
14.112.5
5.111.56.7
20.44.55.5
28.37.77-7
10.012.623.9
5.57.47.23.4
15.23.6
17.937.76.3
12.946.7
8.729.223.9
8.910.510.911.123.213.329.4
15 Table 1

Field Location Discovery Production Cum. Production Rem. Reserves Est. Total Recovery Res./Prod. Year in 1997 as of 1/1/98 as of 1/1/98 as of 1/1/98 (years)
58 Santa Fe Springs Cal.-LA. Basin59 Seal Beach Cal.-L.A. Basin60 Torrance Cal.-L.A. Basin61 Yorba Linda Cal.-L.A. Basin62 Wilmington Cal.-L.A. Basin63 Rangely Colorado64 Jay Florida65 Clay City Illinois66 Dale Consolidated Illinois67 Lawrence Illinois68 Louden Illinois69 Main Illinois70 New Harmony Illinois71 Salem Illinois72 Bemis-Shutts Kansas73 Chase-Silica Kansas74 El Dorado Kansas75 Hall-Gurney Kansas76 Kraft-Prusa Kansas77 Trapp Kansas78 Bay Marchand 2 Louisiana-Off.79 Breton Sound 20 Louisiana-Off.80 Eugene Island 126 Louisiana-Off.81 Eugene Island 175 Louisiana-Off.82 Eugene Island 276 Louisiana-Off.83 Eugene Island 330 Louisiana-Off.84 Garden Banks 426 Louisiana-Off.85 Grand Isle 16 Louisiana-Off.86 Grand Isle 43 Louisiana-Off.87 Grand Isle 47 Louisiana-Off.88 Green Canyon 65 Louisiana-Off.89 Main Pass 35 Louisiana-Off.90 Main Pass 41 Louisiana-Off.91 Main Pass 69 Louisiana-Off.92 Main Pass 144 Louisiana-Off.93 Main Pass 299 Louisiana-Off.94 Main Pass 306 Louisiana-Off.95 Main Pass 31 1 Louisiana-Off.96 Miss. Canyon 194 Louisiana-Off.97 Ship Shoal 1 1 3 Louisiana-Off.98 Ship Shoal 207 Louisiana-Off.99 Ship Shoal 208 Louisiana-Off.
100 S. Marsh Island 128 Louisiana-Off.101 South Pass 24 Louisiana-Off.102 South Pass 27 Louisiana-Off.103 South Pass 61 Louisiana-Off.104 South Pass 62 Louisiana-Off.105 South Pass 65 Louisiana-Off.106 South Pass 89 Louisiana-Off.107 S. Timbalier21 Louisiana-Off.108 West Delta 30 Louisiana-Off.1 09 West Delta 73 Louisiana-Off.1 1 0 West Delta 79 Louisiana-Off.1 1 1 Avery Island Louisiana-S.112 Bay de Chene Louisiana-S.113 Bay St. Elaine Louisiana-S.114 Bayou Sale Louisiana-S.1 1 5 Black Bay W. Louisiana-S.116 Caillou Island Louisiana-S.117 Cote Blanche Bay W. Louisiana-S.118 Cote Blanche Island Louisiana-S.
1919192419221930193219331970193819401906193819061938193819281931191719311937193719491953195019561964193019871948195619551984195119571948196719621969197719801955196719621974195019541968196519651969193919491962196619421941192819411953193019401948
0.7320.5160.7890.449
19.7797.5293.7770.9750.0771.7430.8851.0540.6190.9391.0240.6650.7120.6870.3510.6655.3112.0020.6893.2961.8098.655
22.7062.6592.8841.4127.1330.4503.8411.9591.6146.9030.9792.8603.2132.0190.5102.1 ?u1.4054.8502.4027.9142.1881.4407.2901.6434.7793.8030.8440.6110.3310.2220.3371.2142.8820.3181.315
619.9208.9220.9
91.12497.3
833.6395.4409.8105.5414.8396.6246.8160.3234.9254.2309.4306.0154.0131.6234.2695.2114.2122.695.489.1
341.373.1
285.9302.8
94.693.599.4
258.5261.9113.7109.2212.4
76.6161.0100.494.8
184.1114.3284.7152.1203.1127.9121.0154.1234.5496.8230.4148.0100.0
99.1167.5165.4159.6625.3188.2188.5
12.87.6
18.010.2
290.970.423.1
6.30.75.33.65.83.12.96.23.04.13.82.23.6
40.98.85.1
15.915.647.593.418.448.121.846.5
3.817.713.012.445.1
5.427.259.024.1
6.012.78.9
27.913.429.212.5
9.241.6
8.429.649.611.0
2.62.31.01.34.6
16.42.85.3
632.7216.5238.9101.3
2788.2904.0418.5416.1106.2420.1400.2252.6163.4237.8260.4312.4310.1157.8133.8237.8736.1123.0127.7111.3104.7388.8166.5304.3350.9116.4140.0103.2276.2274.9126.1154.3217.8103.8220.0124.5100.8196.8123.2312.6165.5232.3140.4130.2195.7242.9526.4280.0159.0102.6101.4168.5166.7164.2641.7191.0193.8
17.514.722.822.714.79.46.16.58.43.04.15.55.03.16.14.55.85.56.35.47.74.47.44.88.65.54.16.9
16.715.46.58.44.66.67.76.55.59.5
18.411.911.85.96.35.85.63.75.76.45.75.16.2
13.013.04.36.94.53.93.85.78.84.0
16 Table 1

Field
119 Delta Farms120 Garden Island Bay121 Golden Meadow122 Grand Bay123 HackberryE.124 HackberryW.125 Iberia126 Jennings127 Lafitte128 LakeBarre129 Lake Washington130 Leeville131 Quarantine Bay132 Romere Pass133 Timbalier Bay onsh.134 Venice135 Vinton136 Weeks Island137 West Bay138 White Castle139 Caddo-Pine Island140 Delhi141 Haynesville142 Homer143 Nebo-Hemphill144 Rodessa145 Baxterville146 Heidelberg147 Tinsley148 Cabin Creek149 Cut Bank150 Elk Basin151 Pennel
152 Pine153 Blinebry-Drinkard154 Denton155 Empire-Abo156 Eunice-Monument157 Grayburg-Jackson158 Hobbs159 Langiie-Mattix160 Maljamar161 Vacuum162 Beaver Lodge163 Bowlegs164 Burbank165 Cement166 Gushing167 Earlsboro168 Eola-Robberson169 Fitts170 Glen Pool171 Golden Trend172 Healdton173 Hewitt174 Little River175 Oklahoma City176 Postle177 Seminole178 Sho-Vel-Tum179 Sooner Trend
Location Discovery Production Cum. Production Rem. Reserves Est. Total Recovery Res./Prod. Year in 1997 as of 1/1/98 as of 1/1/98 as of 1/1/98 (years)
Louisiana-S.Louisiana-S.Louisiana-S.Louisiana-S.Louisiana-S.Louisiana-S.Louisiana-S.Louisiana-S.Louisiana-S.Louisiana-S.Louisiana-S.Louisiana-S.Louisiana-S.Louisiana-S.Louisiana-S.Louisiana-S.Louisiana-S.Louisiana-S.Louisiana-S.Louisiana-S.Louisiana-N.Louisiana-N.Louisiana-N.Louisiana-N.Louisiana-N.Louisiana-N.MississippiMississippiMississippiMontanaMontanaMontanaMontanaMontanaNew MexicoNew MexicoNew MexicoNew MexicoNew MexicoNew MexicoNew Mexicoi^..- MexicoNew MexicoN. DakotaOklahomaOklahomaOklahomaOklahomaOklahomaOklahomaOklahomaOklahomaOklahomaOklahomaOklahomaOklahomaOklahomaOklahomaOklahomaOklahomaOklahoma
1944193419381938192719281917190119351929193119311937195019381937191019451940192919051944192119191940193519441944193919531926191519551951194519491957192919291928193519261929195119271920191719121926192119331905194519131919192719281960192619191965
0.2711.1070.3200.5590.3170.3980.2350.1370.6332.0951.6940.3130.8880.3010.7950.2000.1723.0110.9030.2271.8990.0330.6300.2861.5510.2110.9371.9960.3381.2140.4590.4441.9050.7570.9590.5190.5562.3874.0592.9490.9441.5358.0150.9880.0710.6721.0771.0370.0870.3741.8200.4132.3661.2791.6180.0890.4181.4890.125
10.8002.714
120.3230.7139.0177.4112.7148.899.9
118.2264.7214.8260.2145.9179.9100.9306.6186.1163.4246.3237.1
93.5383.6213.5177.6101.4102.8109.1252.2196.0224.8102.2168.2100.195.5
113.7142.2145.2228.3147.4118.5339.4135.1158.6508.5123.5163.7543.7143.1508.6203.5139.9219.6333.9502.3348.7285.7142.5823.3115.9195.0
1298.2327.6
2.23.81.22.04.02.10.81.23.5
11.96.73.06.21.6
12.63.41.8
13.07.56.6
10.92.93.81.38.71.45.25.61.36.82.01.3
11.43.34.12.12.96.6
18.317.74.67.3
31.25.11.12.85.95.80.81.58.34.6
21.04.25.41.85.86.41.0
52.116.9
122.5234.5140.2179.4116.7150.9100.7119.4268.2226.7266.9148.9186.1102.5319.2189.5165.2259.3244.6100.1394.5216.4181.4102.7111.5110.5257.4201.6226.1109.0170.2101.4106.9117.0146.3147.3231.2154.0136.8357.1139.7165.9539.7128.6164.8546.5149.0514.4204.3141.4227.9338.5523.3352.9291.1144.3829.1122.3196.0
1350.3344.5
8.13.43.83.6
12.65.33.48.85.55.74.09.67.05.3
15.817.010.54.38.3
29.15.7
87.96.04.55.66.65.52.83.85.64.42.96.04.44.34.05.22.84.56.04.94.83.95.2
15.54.25.55.69.24.04.6
11.18.93.33.3
20.213.94.38.04.86.2
17 Table 1

Field Location Discovery Production Cum. Production Rem. Reserves Est. Total Recovery Res./Prod. Year in 1997 as of 1/1/98 as of 1/1/98 as of 1/1/98 (years)
180 St. Louis181 Darst Creek182 Luling-Branyon183 Pearsall184 Greta185 Lake Pasture186 TomO'Connor187 West Ranch188 Anahuac189 Barbers Hill190 Con roe191 Giddings192 Goose Creek193 Hastings E.194 High Island195 Hull196 Humble197 Magnet Withers198 Manvel199 Oyster Bayou200 Raccoon Bend201 Sour Lake202 Thompson203 Tomball204 Webster205 W. Columbia206 Agua Dulce-Stratton207 Borregos208 Kelsey209 Plymouth210 Seeligson211 TCB212 White Point E.213 Van214 East Texas215 Fairway216 Hawkins217 Neches218 Quitman 219Talco220 Stephens Cnty Reg.221 Big Lake222 McCamey223 Pegasus224 Andector225 Block 31226 Cowden N.227 Cowden S.-Foster-J228 Dollarhide229 Dune230 Fuhrman-Mascho231 Fullerton232 Goldsmith233 Hendrick234 Howard-Glasscock235 latan E.236 Jordan237 Kermit238 Keystone239 Mabee240 McElroy
OklahomaTexas-Dist. 1Texas-Dist. 1Texas-Dist. 1Texas-Dist. 2Texas-Dist. 2Texas-Dist. 2Texas-Dist. 2Texas-Dist. 3Texas-Dist. 3Texas-Dist. 3Texas-Dist. 3Texas-Dist. 3Texas-Dist. 3Texas-Dist. 3Texas-Dist. 3Texas-Dist. 3Texas-Dist. 3Texas-Dist. 3Texas-Dist. 3Texas-Dist. 3Texas-Dist. 3Texas-Dist. 3Texas-Dist. 3Texas-Dist. 3Texas-Dist. 3Texas-Dist. 4Texas-Dist. 4Texas-Dist. 4Texas-Dist. 4Texas-Dist. 4Texas-Dist. 4Texas-Dist. 4Texas-Dist. 5Texas-Dist. 6Texas-Dist. 6Texas-Dist. 6Texas-Dist. 6Texas-Dist. 6Texas-Dist. 6Texas-Dist. 7BTexas-Dist. 7CTexas-Dist. 7CTexas-Dist. 7CTexas-Dist. 8Texas-Dist. 8Texas-Dist. 8
I. Texas-Dist. 8Texas-Dist. 8Texas-Dist. 8Texas-Dist. 8Texas-Dist. 8Texas-Dist. 8Texas-Dist. 8Texas-Dist. 8Texas-Dist. 8Texas-Dist. 8Texas-Dist. 8Texas-Dist. 8Texas-Dist. 8Texas-Dist. 8
1925192919221936193319531934193819351916193119711906193419221918190519361931194119271902192119331937191719281945193819251925194419381928193019601940195319481931191619231925194919461945193019301945193819301942193419261925192619371928193019431926
0.3880.5510.9291.8050.2770.9502.8950.7890.1530.1851.160
16.5900.4881.0611.0620.4110.2150.9160.3150.3390.3690.4941.1020.1881.9250.1500.2120.0310.0520.0750.0810.0400.0221.559
19.2131.8253.1580.4310.6050.8333?98
0.3730.1300.8140.4651.1149.5955.0152.8801.1491.2016.6554.1980.3574.2152.1370.6110.2711.4142.4407.455
181.1159.2155.7153.3150.9100.1787.7391.9288.2113.5742.4457.0122.9707.0140.3171.7
99.7121.3103.5164.6104.8102.7487.9123.1596.2102.5148.3114.9116.1124.2272.8113.6104.7541.7
5271.4210.1865.2110.1129.6284.9172.7133.6126.3143.4186.3238.6598.3560.9219.0199.4117.1412.1799.3256.4447.9165.3135.5116.5325.7108.1540.1
1.43.13.4
29.71.63.9
15.15.21.20.84.9
66.91.83.23.02.21.15.51.41.51.57.05.71.09.22.01.40.60.81.90.70.60.68.3
110.212.820.4
1.62.76.5
15.71.40.73.72.47.8
50.528.417.86.33.2
35.226.9
1.820.812.73.01.65.5
13.736.4
182.5162.3159.1183.0152.5104.0802.8397.1289.4114.3747.3523.9124.7710.2143.3173.9100.8126.8104.9166.1106.3109.7493.6124.1605.4104.5149.7115.5116.9126.1273.5114.2105.3550.0
5381.6222.9885.6111.7132.3291.4188.4135.0127.0147.1188.7246.4648.8589.3236.8205.7120.3447.3826.2258.2468.7178.0138.5118.1331.2121.8576.5
3.65.63.7
16.55.84.15.26.67.84.34.24.03.73.02.85.45.16.04.44.44.1
14.25.25.34.8
13.36.6
19.415.425.3
8.615.027.3
5.35.77.06.53.74.57.84.83.85.44.55.27.05.35.76.25.52.75.36.45.04.95.94.95.93.95.64.9
18 Table 1
Field
241 Means242 Midland Farms243 Penwell244 Sand Hills245 Shatter Lake246 Spraberry Trend247 TXL248 Waddell249 Ward S.250 Ward Estes N.251 Westbrook252 Yates253 Adair254 Anton-lrish255 Cedar Lake256 Cogdell257 Diamond M258 G'arza259 Jo-Mill260 Kelly-Snyder261 Levelland262 Prentice263 Robertson N.264 Salt Creek265 Seminole266 Sharon Ridge267 Slaughter268 Wasson269 Welch270 Archer Cnty Reg.271 Cooke Cnty Reg.272 K-M-A273 Walnut Bend274 Wichita Cnty Reg.275 Wilbarger Cnty Reg.276 Young Cnty Reg.277 Panhandle278 Altamont279 Bluebell280 Greater Aneth281 Byron282 Elk Basin283 Frannie284 Garland285 Grass Creek286 Hamilton Dome287 Hartzog Draw288 Lance Creek289 Little Buffalo Basin290 Lost Soldier291 Oregon Basin292 Salt Creek293 Wertz
Location Discovery Production Cum. Production Rem. Reserves Est. Total Recovery Res./Prod. . Year in 1997 as of 1/1/98 as of 1/1/98 as of 1/1/98 (years)
Texas-Dist. 8Texas-Dist. 8Texas-Dist. 8Texas-Dist. 8Texas-Dist. 8Texas-Dist. 8Texas-Dist. 8Texas-Dist. 8Texas-Dist. 8Texas-Dist. 8Texas-Dist. 8Texas-Dist. 8Texas-Dist. 8ATexas-Dist. 8ATexas-Dist. 8ATexas-Dist. 8ATexas-Dist. 8ATexas-Dist. 8ATexas-Dist. 8ATexas-Dist. 8ATexas-Dist. 8ATexas-Dist. 8ATexas-Dist. 8ATexas-Dist. 8ATexas-Dist. 8ATexas-Dist. 8ATexas-Dist. 8ATexas-Dist. 8ATexas-Dist. 8ATexas-Dist. 9Texas-Dist. 9Texas-Dist. 9Texas-Dist. 9Texas-Dist. 9Texas-Dist. 9Texas-Dist. 9Texas-Dist. 1 0UtahUtahUtahWyomingWyomingWyomingWyomingWyomingWyomingWyomingWyomingWyomingWyomingWyomingWyomingWyoming
SUMS
19341944192619311947195119441927193819291920192619471944193919491948192619531948193819511956195019361923193619361942191119261931193819101915191719211955194919561918191519281906191419181976191819141916191218891921
4.2131.4881.5852.2101.415
23.4142.2951.0550.3562.4051.278
20.3100.8221.5272.6950.4910.9822.0752.3953.145
11.0803.1055.1029.191
11.9501.502
15.50327.410
2.3510.9420.6870.8330.3691.8550.4110.8705.1251.6132.7725.8740.6271.8050.2852.0221.4501.7782.1110.1250.7972.4574.4312.1590.509
1330.916
275.6261.0122.4268.0106.2816.0276.9106.8109.1391.1103.0
1356.1115.7196.496.4
299.7251.7127.2147.7
1295.5615.7198.6113.4331.5656.3100.6
1177.91964.1
167.7189.8107.6147.6127.1354.0150.4107.4
1475.8112.2140.9405.0127.4452.1120.3182.9201.4249.5
96.5109.1131.3237.2441.8658.6113.4
101758.7
25.37.67.8
13.04.9
95.911.23.61.5
23.56.6
598.42.4
10.115.3
3.76.09.1
11.454.548.624.528.946.457.510.677.9
122.520.1
5.43.22.61.99.62.32.4
31.115.915.925.0
2.412.0
1.37.75.65.8
12.10.93.0
19.119.617.58.7
11303.9
300.9268.6130.2281.0111.1911.9288.1110.4110.6414.6109.6
1954.5118.1206.5111.7303.4257.7136.3159.1
1350.0664.3223.1142.3377.9713.8111.2
1255.82086.6
187.8195.2110.8150.2129.0363.6152.7109.8
1506.9128.1156.8430.0129.8464.1121.6190.6207.0255.3108.6110.0134.3256.3461.4676.1122.1
113062.6
6.05.14.95.93.54.14.93.44.29.85.2
29.52.96.65.77.56.14.44.8
17.34.47.95.75.04.87.15.04.58.55.74.73.15.15.25.62.86.19.95.74.33.86.64.63.83.93.35.77.23.87.84.48.1
17.1
8.3(ave)
19 Table 1

Tab
le 2. G
iant U
.S. o
il fields o
f Tab
le 1 for w
hich
pro
du
ction
and
reserves as of 1/1/90 are availab
le. [D
ata as of 1/1/98 are repeated from
Table 1.
Data as o
f 1/1/90 are from
International Petroleum
Encyclopedia (1990).
Production and reserves are in m
mbo.
Estim
ated total recovery = cumulative production plus rem
aining reserves.]
Field
1 C
itronelle2 E
ndicott3 G
ranite Point
4 Kuparuk R
iver5 Lisburne6 M
cArthur R
iver7 M
id. Ground S
hoal8 P
rudhoe Bay
9 Sw
anson River
10 Sm
ackover11
BelridgeS
.12 B
uena Vista
13 Coalinga
14 Coalinga N
ose15 C
oles Levee N.
16 Cuyam
a S.17 C
ymric
18 Edison
19 Elk H
ills20 F
ruitvale21
Greeley
22 Kern F
ront23 K
ern River
24 Kettlem
an N. D
ome
25 Lost Hills
26 Midw
ay-Sunset
27 Mount P
oso28 R
io Bravo
29 Yow
lumne
30 Carpinteria
31 Cat C
anyon E.. W
.32 D
os Cuadras
33 Hondo
34 Orcutt
35 Rincon
36 San A
rdo37 S
anta Maria V
alley38 S
outh Mountain
39 Ventura
40 Beta
Location D
iscovery C
um. P
roduction Rem
. Reserves E
st. Total R
ecovery Cum
. Production R
em. R
eserves Est. T
otal Recovery
Change in E
st. Y
ear as o
f 1/1/90 as of 1/1/90
as of 1/1/90
as of 1/1/98 as of 1/1/98
as of 1/1/98
Total Recovery
Alabam
aA
laskaA
laskaA
laskaA
laskaA
laskaA
laskaA
laskaA
laskaA
rkansasC
al.-San Joaq.
Cal.-S
an Joaq.C
al.-San Joaq.
Cal.-S
an Joaq.C
al.-San Joaq.
Cal.-S
an Joaq.C
al.-San Joaq.
Cal.-S
an Joaq.C
al.-San Joaq.
Cal.-S
an Joaq.C
al.-San Joaq.
Cal.-S
an Joaq.C
al.-San Joaq.
Cal.-S
an Joaq.C
al.-San Joaq.
Cal.-S
an Joaq.C
al.-San Joaq.
Cal.-S
an Joaq.C
al.-San Joaq.
Cal.-C
oastalC
al.-Coastal
Cal.-C
oastalC
al.-Coastal
Cal.-C
oastalC
al.-Coastal
Cal.-C
oastalC
al.-Coastal
Cal.-C
oastalC
al.-Coastal
Cal.-L.A
. Basin
1955197819651969196719651962196819571922191119091890193819381949190919281911192819361912189919281910189419261937197419661908196919691901192719471934191619191976
149.682.1
111.9616.1
49.4535.8158.6
6733.2211.3559.7737.3648.8764.1499.8160.9218.7209.1135.7927.7116.1112.8174.5
1253.0456.8183.9
1938.8269.5116.287.490.3
290.4216.9
99.5166.7149.9411.9199.6146.7901.5
46.0
5.2293.0
17.0885.0161.040.0
8.03185.0
8.08.0
375.136.7
151.08.32.36.5
85.231.4
545.513.2
1.653.8
694.51.1
66.7314.4
73.11.2
21.027.144.850.0
102.49.4
13.7119.338.911.390.2
168.3
154.8375.1128.9
1501.1210.4575.8166.6
9918.2219.3567.7
1112.4685.5915.1508.1163.2225.2294.3167.1
1473.2129.3114.4228.3
1947.5457.9250.6
2253.2342.6117.4108.4117.4335.2266.9201.9176.1163.6531.2238.5158.0991.7214.3
159.4358.0130.0
1484.0119.0586.0178.6
9507.0224.4574.4
1108.6659.2849.3503.9163.1221.5294.2141.8
1119.3120.2114.4193.3
1618.8458.0266.2
2360.1291.5116.6106.299.0
298.0241.8157.8172.5156.4447.2204.2152.4945.3
73.0
4.4170.0
16.01111.0
32.044.012.0
3042.011.04.7
272.318.557.1
4.51.63.5
68.64.6
288.65.90.8
23.6329.0
2.351.9
332.730.4
0.311.09.7
22.015.0
121.45.53.6
82.814.44.6
66.8140.5
163.8528.0146.0
2595.0151.0630.0190.6
12549.0235.4579.1
1380.9677.7906.4508.4164.7225.0362.8146.4
1407.9126.1115.2216.9
1947.8460.3318.1
2692.8321.9116.9117.2108.7320.0256.8279.2178.0160.0530.0218.6157.0
1012.1213.5
9.0152.9
17.11093.9
-59.454.224.0
2630.816.1'11.4
268.5-7.8-8.70.31.5
-0.2
68.5-20.7-65.3-3.20.8
-11.40.32.4
. 67.5
439.6-20.7
-0.58.8
-8.7-15.2-10.177.3
1.9-3.6-1.2
-19.9-1.020.4-0.8
20T
able 2

Field
41 Beverly H
ills42 B
rea-Olinda
43 Coyote E.
44 Dom
inguez45 H
untington Beach
46 Inglewood
47 Long Beach
48 Montebello
49 Richfield
50 Santa Fe S
prings51 S
eal Beach
52 Torrance53 W
ilmington
54 Rangely
55 Jay56 C
lay City
57 Lawrence
58 Louden59 M
ain60 N
ew H
armony
61 Salem
62 Bem
is-Shutts
63 Chase-S
ilica64 El D
orado65 H
all-Gurney
66 Trapp67 B
ay Marchand 2
68 Eugene Island 330
69 Grand Isle 16
70 Grand Isle 43
71 Main P
ass 4172 M
ain Pass 306
73 Miss. C
anyon 19474 S
hip Shoal 207
75 Ship S
hoal 20876 S. M
arsh Island 12877 S
outh Pass 27
78 South P
ass 6179 S
outh Pass 62
80 South P
ass 6581 S. Tim
balier 2182 W
est Delta 30
83 West D
elta 73
Location D
iscovery C
um. P
roduction Rem
. Reserves Est. Total R
ecovery Cum
. Production R
em. R
eserves Est. Total Recovery C
hange in Est. Y
ear as of 1/1/90
as of 1/1/90 as of 1/1/90
as of 1/1/98 as of 1/1/98
as of 1/1/98 Total R
ecovery
Cal.-L.A
. Basin
Cal.-L
A B
asinC
al.-L
A Basin
Cal.-L.A
. Basin
Cal.-L.A
. BasinC
al.-L.A. Basin
Cal.-L.A
. BasinC
al.-L.A. B
asinC
al.-L.A. Basin
Cal.-L.A
. Basin
Cal.-L.A
. Basin
Cal.-L.A
. Basin
Cal.-L.A
. BasinC
oloradoFloridaIllinoisIllinoisIllinoisIllinoisIllinoisIllinoisK
ansasK
ansasK
ansasK
ansasK
ansasLouisiana-O
ff.Louisiana-O
ff.Louisiana-O
ff.Louisiana-O
ff.Louisiana-O
ff.Louisiana-O
ff.Louisiana-O
ff.Louisiana-O
ff.Louisiana-O
ff.Louisiana-O
ff.Louisiana-O
ff.Louisiana-O
ff.Louisiana-O
ff.Louisiana-O
ff.Louisiana-O
ff.Louisiana-O
ff.Louisiana-O
ff.
1900188019091923192019241921191719191919192419221932193319701938190619381906193819381928193119171931193719491930194819561957196919801967196219741954196819651965193919491962
124.4386.1109.2269.8
1071.5348.2912.0193.0190.6614.0203.9213.6
2318.9751.7365.4396.1397.3389.5235.3154.5227.4245.2303.0299.4147.1227.4606.3277.7267.3277.4240.8203.6121.488.6
163.781.0
131.8160.4108.6104.8218.3451.8192.8
40.552.612.76.9
66.951.415.09.7
26.08.1
13.334.3
469.035.051.26.05.02.85.03.83.53.43.61.83.13.6
50.047.382.080.520.476.671.837.261.720.068.940.079.485.345.141.782.2
164.9438.7121.9276.7
1138.4399.6927.0202.7216.6622.1217.2247.9
2787.9786.7416.6402.1402.3392.3240.3158.3230.9248.6306.6301.2150.2231.0656.3325.0349.3357.9261.2280.2193.2125.8225.4101.0200.7200.4188.0190.1263.4493.5275.0
135.5398.4112.7273.7
1099.5365.6926.0195.7197.6619.9208.9220.9
2497.3833.6395.4409.8
414.8396.6246.8160.3234.9254.2309.4306.0154.0234.2695.2341.3285.9302.8258.5212.4161.094.8
184.1114.3152.1203.1127.9121.0234.5496.8230.4
12.140.3
9.13.1
38.626.718.66.35.3
12.87.6
18.0290.970.423.16.35.33.65.83.12.96.23.04.13.83.6
40.947.518.448.117.75.4
59.06.0
12.78.9
13.429.212.59.28.4
29.649.6
147.6438.7121.8276.8
1138.1392.3944.6202.0202.9632.7216.5238.9
2788.2904.0418.5416.1420.1400.2252.6163.4237.8260.4312.4310.1157.8237.8736.1388.8304.3350.9276.2217.8220.0100.8196.8123.2165.5232.3140.4130.2242.9526.4280.0
-17.30.0
-0.1
0.1-0.3-7.3
17.6-0.7
-13.710.6-0.7-9
.0
0.3117.3
1.914.017.87.9
12.35.16.9
11.85.88.97.66.8
79.8,
63.8-45.0
-7.0
15.0-62.426.8
-25.0-2
8.6
22.2-35.231.9
-47.6-59.9-20.532.9
5.0
21Table 2

Field
84 Bay de C
hene85 B
ay St. E
laine86 B
ayou Sale
87 Black B
ay W.
88 Caillou Island
89 Cote B
lanche Bay W
.90 D
elta Farm
s91
Garden Island B
ay92 G
olden Meadow
93 Grand B
ay94 H
ackberry E.95 H
ackberry W.
96 Jennings97 Lafffle98 Lake B
arre99 Lake W
ashington100 Leeville101
Quarantine B
ay102 T
imbalier B
ay onsh.103 V
enice104 V
inton105 W
eeks Island106 W
est Bay
107 Caddo-P
ine Island108 D
elhi109 H
aynesville110 H
omer
111 R
odessa112 B
axterville113 H
eidelberg114 T
insley115 C
ut Bank
116 Pine
117 Denton
118 Em
pire-Abo
119 Eunice-M
onument
120 Hobbs
121 M
aljamar
122 Vacuum
123 Beaver Lodge124 Burbank125 E
ola-Robberson
126 Fitts
Location D
iscovery C
um. P
roduction Rem
. Reserves E
st. Total R
ecovery Cum
. Production R
em. R
eserves Est. T
otal Recovery C
hange in Est.
Year
as of 1/1/90 as of 1/1/90
as of 1/1/90 as of 1/1/98
as of 1/1/98 as of 1/1/98
Total Recovery
Louisiana-S.
Louisiana-S.
Louisiana-S.
Louisiana-S.
Louisiana-S.
Louisiana-S.
Louisiana-S.
Louisiana-S.
Louisiana-S.
Louisiana-S.
Louisiana-S.
Louisiana-S.
Louisiana-S.
Louisiana-S.
Louisiana-S.
Louisiana-S.
Louisiana-S.
Louisiana-S.
Louisiana-S.
Louisiana-S.
Louisiana-S.
Louisiana-S.
Louisiana-S.
Louisiana-N.
Louisiana-N.
Louisiana-N.
Louisiana-N.
Louisiana-N.
Mississippi
Mississippi
Mississippi
Montana
Montana
New
Mexico
New
Mexico
New
Mexico
New
Mexico
New
Mexico
New
Mexico
N. D
akotaO
klahoma
Oklahom
aO
klahoma
1941192819411953193019401944193419381938192719281901193519291931193119371938193719101945194019051944192119191935194419441939192619511949195719291928192619291951192019211933
96.8165.3162.1147.0604.7183.0115.7222.4136.1170.9109.5143.4116.6256.6205.1245.0142.2173.4297.2182.8161.3227.0229.5364.2212.3169.198.8
106.4241.4177.2220.3163.1106.4139.6221.6128.3304.4146.8442.8113.0537.6134.0202.4
17.524.82.68.3
71.545.0
6.730.8
3.63.47.15.00.58.2
19.013.76.7
15.023.26.70.5
20.315.110.034.1
1.51.51.18.29.72.5
36.44.42.1
48.48.0
20.03.3
40.015.27.57.49.5
114.3190.1164.7155.3676.2228.0122.4253.2139.7174.3116.6148.4117.1264.8224.1258.7148.9188.4320.4189.5161.8247.3244.6374.2246.4170.6100.3107.5249.6186.9222.8199.5110.8141.7270.0136.3324.4150.1482.8128.2545.1141.4211.9
99.1167.5165.4159.6625.3188.2120.3230.7139.0177.4112.7148.8118.2264.7214.8260.2145.9179.9306.6186.1163.4246.3237.1383.6213.5177.6101.4109.1252.2196.0224.8168.2113.7145.2228.3147.4339.4158.6508.5123.5543.7139.9219.6
2.31.01.34.6
16.42.82.23.81.22.04.02.11.23.5
11.96.73.06.2
12.63.41.8
13.07.5
10.92.93.81.31.45.25.61.32.03.32.12.96.6
17.77.3
31.25.12.81.58.3
101.4168.5166.7164.2641.7191.0122.5234.5140.2179.4116.7150.9119.4268.2226.7266.9148.9186.1319.2189.5165.2259.3244.6394.5216.4181.4102.7110.5257.4201.6226.1170.2117.0147.3231.2154.0357.1165.9539.7128.6546.5141.4227.9
-12.9-21.6
2.08.9
-34.5-37.0
0.1-18.7
0.55.10.12.52.33.42.68.20.0
-2.3-1.2
0.03.4
12.00.0
20.3-30.010.82.4
. 3.07.8
14.73.3
-29.36.25.6
-38.817.732.715.856.9
0.41.40.0
16.0
22T
able 2

Field
127 Glen P
ool128 G
olden Trend
129 Healdton
130 Hew
itt131 O
klahoma C
ity132 P
ostle133 S
ho-Vel-T
um134 S
ooner Trend
135 Greta
136 Lake Pasture
137 Tom
O'C
onnor138 W
est Ranch
139 Anahuac
140 Conroe
141 G
iddings142 M
agnet Withers
143 Oyster B
ayou144 T
hompson
145 Tom
ball146 W
ebster147 A
gua Dulce-S
tratton148 B
orregos149 K
elsey150 P
lymouth
151 S
eeligson152 TC
B153 W
hite Point E.
154 Van
155 East T
exas156 Fairw
ay157 H
awkins
158 Neches
159 Quitm
an160 B
ig Lake161 A
ndector162 B
lock 31163 C
owden N
.164 C
owden S
.-Foster-J.
165 Dollarhide
166 Dune
167 Fullerton168 G
oldsmith
169 How
ard-Glasscock
Location D
iscovery C
um. P
roduction Rem
. Reserves E
st. Total R
ecovery Cum
. Production R
em. R
eserves Est. T
otal Recovery C
hange in Est.
Year
as of 1/1/90 as of 1/1/90
as of 1/1/90 as of 1/1/98
as of 1/1/98
as of 1/1/98 T
otal Recovery
Oklahom
aO
klahoma
Oklahom
aO
klahoma
Oklahom
aO
klahoma
Oklahom
aO
klahoma
Texas-D
ist. 2T
exas-Dist. 2
Texas-D
ist. 2T
exas-Dist. 2
Texas-D
ist. 3T
exas-Dist. 3
Texas-D
ist. 3T
exas-Dist. 3
Texas-D
ist. 3T
exas-Dist. 3
Texas-D
ist. 3T
exas-Dist. 3
Texas-D
ist. 4T
exas-Dist. 4
Texas-D
ist. 4T
exas-Dist. 4
Texas-D
ist. 4T
exas-Dist. 4
Texas-D
ist. 4T
exas-Dist. 5
Texas-D
ist. 6T
exas-Dist. 6
Texas-D
ist. 6T
exas-Dist. 6
Texas-D
ist. 6T
exas-Dist. 7C
Texas-D
ist. 8T
exas-Dist. 8
Texas-D
ist. 8T
exas-Dist. 8
Texas-D
ist. 8T
exas-Dist. 8
Texas-D
ist. 8T
exas-Dist. 8
Texas-D
ist. 8
1905194519131919192819601919196519331953193419381935193119711936194119211933193719281945193819251925194419381928193019601940195319481923194619451930193019451938194219341925
328.8477.8336.4270.4817.1107.5
1184.3299.4148.189.5
754.3382.2285.6730.0270.8112.4160.9476.1121.4577.2147.0114.2115.1123.1271.7113.0104.1524.7
5044.0194.8828.4105.0122.6130.4182.5223.1501.6509.5196.3185.3355.4762.0409.1
4.125.0
7.812.05.0
13.851.016.112.010.948.6
8.514.431.0
140.33.5
17.423.8
9.616.024.420.036.0
3.155.352.2
6.212.2
953.515.735.6
5.17.23.05.9
12.036.531.38.9
16.414.827.321.4
332.9502.8344.2282.4822.1121.3
1235.3315.5160.1100.4802.9390.7300.0761.0411.1115.9178.3499.9131.0593.2171.4134.2151.1126.2327.0165.2110.3536.9
5997.5210.5864.0110.1129.8133.4188.4235.1538.1540.8205.2201.7370.2789.3430.5
333.9502.3348.7285.7823.3115.9
1298.2327.6150.9100.1787.7391.9288.2742.4457.0121.3164.6487.9123.1596.2148.3114.9116.1124.2272.8113.6104.7541.7
5271.4210.1865.2110.1129.6133.6186.3238.6598.3560.9219.0199.4412.1799.3447.9
4.621.04.25.45.86.4
52.116.9
1.63.9
15.15.21.24.9
66.95.51.55.71.09.21.40.60.81.90.70.60.68.3
110.212.820.4
1.62.71.42.47.8
50.528.417.86.3
35.226.920.8
338.5523.3352.9291.1829.1122.3
1350.3344.5152.5104.0802.8397.1289.4747.3523.9126.8166.1493.6124.1605.4149.7115.5116.9126.1273.5114.2105.3550.0
5381.6222.9885.6111.7132.3135.0188.7246.4648.8589.3236.8205.7447.3826.2468.7
5.620.58.78.77.01.0
115.029.0-7.6
3.6-0.1
6.4-10.6-13.7112.8
10.9-12.2
-6.3-6.9
12.2-21.7-18.7-34.2
-0.1
-53.5-51.0-5.0
. 13.1
-615.912.421.6
1.62.51.60.3
11.3110.748.531.64.0
77.136.938.2
23T
able 2

Field
170 latan E.171 Jordan172 K
eystone173 M
cElroy
174 Means
175 Midland F
arms
176 Sa
nd
hills
177 Spraberry T
rend178 TX
L179 W
addell180 W
ard Este
sN.
181 Westbrook
182 Yates
183 Anton-lrish
184 Cogdell
185 Diam
ond M186 K
elly-Snyder
187 Levelland188 P
rentice189 S
alt Creek
190 Sem
inole191
Slaughter
192 Wasson
193 Welch
194 Panhandle
195 Altam
ont196 G
reater Aneth
197 Byron
198 Elk B
asin199 F
rannie200 G
arland201
Grass C
reek202 H
amilton D
ome
203 Hartzog D
raw204 Lance C
reek205 Little B
uffalo Basin
206 Lost Soldier
207 Oregon B
asin208 S
alt Creek
209 Wertz
Location D
iscovery C
um. P
roduction Rem
. Reserves E
st. Total R
ecovery Cum
. Production R
em. R
eserves Est. T
otal Recovery
Change in E
st. Y
ear as of 1/1/90
as of 1/1/90 as of 1/1/90
as of 1/1/98 as of 1/1/98
as of 1/1/98 Total R
ecovery
Texas-D
ist. 8T
exas-Dist. 8
Texas-D
ist. 8T
exas-Dist. 8
Texas-D
ist. 8T
exas-Dist. 8
Texas-D
ist. 8T
exas-Dist. 8
Texas-D
ist. 8T
exas-Dist. 8
Texas-D
ist. 8T
exas-Dist. 8
Texas-D
ist. 8T
exas-Dist. 8A
Texas-D
ist. 8AT
exas-Dist. 8A
Texas-D
ist. 8AT
exas-Dist. 8A
Texas-D
ist. 8AT
exas-Dist. 8A
Texas-D
ist. 8AT
exas-Dist. 8A
Texas-D
ist. 8AT
exas-Dist. 8A
Texas-D
ist. 10U
tahU
tahW
yoming
Wyom
ingW
yoming
Wyom
ingW
yoming
Wyom
ingW
yoming
Wyom
ingW
yoming
Wyom
ingW
yoming
Wyom
ingW
yoming
1926193719301926193419441931195119441927192919201926
,19441949
:i1948
;194819381951195019361936193619421921195519561918191519281906191419181976191819141916191218891921
145.8129.9314.7472.2234.4245.6250.5672.1265.0101.3367.090.0
1199.3179.0293.5240.8
1253.5500.0166.3257.8541.1
1047.71738.1
147.21429.3
91.8359.6121.6434.8116.9165.4187.5232.8
72.3107.9121.2210.7396.4634.3103.8
9.21.67.8
50.214.215.019.339.0
5.03.2
73.614.0
755.221.139.914.796.534.415.025.025.032.060.011.014.0
228.825.0
6.722.8
4.16.46.66.0
277.90.39.05.8
25.020.211.0
155.0131.5322.5522.4248.6260.6269.8711.1270.0104.5440.6104.0
1954.5200.1333.4255.5
1350.0534.4181.3282.8566.1
1079.71798.1
158.21443.3320.6384.6128.3457.6121.0171.8194.1238.8350.2108.2130.2216.5421.4654.5114.8
165.3135.5325.7540.1275.6261.0268.0816.0276.9106.8391.1103.0
1356.1196.4299.7251.7
1295.5615.7198.6331.5656.3
1177.91964.1
167.71475.8
112.2405.0127.4452.1120.3182.9201.4249.5
96.5109.1131.3237.2441.8658.6113.4
12.73.05.5
36.425.3
7.613.095.911.23.6
23.56.6
598.410.13.76.0
54.548.624.546.457.577.9
122.520.131.115.925.02.4
12.01.37.75.65.8
12.10.93.0
19.119.617.58.7
178.0138.5331.2576.5300.9268.6281.0911.9288.1110.4414.6109.6
1954.5206.5303.4257.7
1350.0664.3223.1377.9713.8
1255.82086.6
187.81506.9
128.1430.0129.8464.1121.6190.6207.0255.3108.6110.0134.3256.3461.4676.1122.1
23.07.08.7
54.152.38.0
11.2200.8
18.15.9
-26.05.60.06.4
-30.02.20.0
129.941.895.1
147.7176.1288.529.663.6
-192.545.4
. 1.56.50.6
18.812.916.5
-241 .61.84.1
39.840.021.6
7.3
SU
MS
79284.514244.8
93529.389599.5
9825.899425.3
5896.0
24T
able 2

Table 3. Giant U.S. oil fields of Table 1 having significant remaining potential (those that account for 80% of annual production or 80% of remaining reserves). [Data are sorted by rank with respect to annual production. Rank with respect to remaining reserves is also shown. Production and reserves are in mmbo.]
ID No. Table 1
Field Rank- Rank- Production Rem. Reserves production rem. reserves in 1997 as of 1/1/98
10 Prudhoe Bay4 Kuparuk River
30 Midway-Sunset9 Point Mclntyre
27 Kern River 15 BelridgeS.
268 Wasson 246 Spraberry Trend
84 Garden Banks 4262 Endicott
23 Elk Hills 252 Yates
62 Wilmington 214 East Texas
8 Milne Point 191 Giddings 38 Hondo
267 Slaughter 40 Pescado21 Cymric
265 Seminole29 Lost Hills
261 Levelland 178 Sho-Vel-Tum
41 Point Arguello17 Coalinga
226 Cowden N. 264 Salt Creek
83 Eugene Island 330 161 Vacuum 103 South Pass 6163 Rangely
240 McElroy 106 South Pass 8988 Green Canyon 6593 Main Pass 299
231 Fullerton oon o-oater Aneth
78 Bay Marchand 246 Ventura
277 Panhandle 263 Robertson N. 227 Cowden S.-Foster-J.
6 McArthur River 101 South Pass 24 108 West Delta 3043 San Ardo
291 Oregon Basin 234 Howard-Glasscock 241 Means 232 Goldsmith 157 Grayburg-Jackson90 Main Pass 41
109 West Delta 7364 Jay96 Miss. Canyon 194
260 Kelly-Snyder47 Beta86 Grand Isle 43
SUMS
123456789
1011121314151617181920212223242526272829303132333435363738394041424344454647484950515253545559616468
1249581417181173616102315203122263034291227323836485321454137394662422449545640575219747161597982336725281335
251.00096.00060.69259.00048.74642.84827.41023.41422.70621.00020.52920.31019.77919.21319.00016.59016.49115.50315.16113.84711.95011.52011.08010.80010.5639.7329.5959.1918.6558.0157.9147.5297.4557.2907.1336.9036.6555.8745.3115.1915.1255.1025.0155.0004.8504.7794.6294.4314.2154.2134.1984.0593.8413.8033.7773.2133.1453.0092.884
1076.883
3042.01111.0332.7241.0329.0272.3122.595.993.4
170.0288.6598.4290.9110.2223.066.9
121.477.951.768.657.551.948.652.1
160.757.150.546.447.531.229.270.436.441.646.545.135.225.040.966.831.128.928.444.027.929.682.819.620.825.326.918.317.749.623.159.054.5
140.548.1
9524.1
25 Table 3