the contribution of the lymph hearts in compensation for ... · the contribution of the lymph...
TRANSCRIPT

Portland State UniversityPDXScholar
Dissertations and Theses Dissertations and Theses
1986
The contribution of the lymph hearts in compensation for acutehypovolemic stress in the toad Bufo marinusMark BaustianPortland State University
Let us know how access to this document benefits you.Follow this and additional works at: http://pdxscholar.library.pdx.edu/open_access_etds
Part of the Biology Commons, and the Physiology Commons
This Thesis is brought to you for free and open access. It has been accepted for inclusion in Dissertations and Theses by an authorized administrator ofPDXScholar. For more information, please contact [email protected].
Recommended CitationBaustian, Mark, "The contribution of the lymph hearts in compensation for acute hypovolemic stress in the toad Bufo marinus"(1986). Dissertations and Theses. Paper 3517.
AN ABSTRACT OF THE THESIS OF Mark Baustian for the Master of
Science in Biology presented June 20, 1986.
Title: The Contribution of the Lymph Hearts in Compensation for
Acute Hypovolemic Stress in the Toad Bufo marinus.
APPROVED BY MEMBERS OF THE THESIS COMMITTEE:
Marcolm Lea
The Marine Toad Bufo marinus was used as a model for an
investigation of the rate and volume pumping capacity of the amphibian
lymph heart. B. marinus is a widely studied terrestrial toad which
would be expected to experience a hypovolemic stress as a consequence
of evaporative water loss when it is away from water.
Currently published data on the role of the lymphatic system in
amphibians are inadequate and contradictory. Estimates of the rate of
formation of lymph and the role of the lymph hearts in returning this
fluid to the circulation are not based on actual volume determinations
:2
but rather estimates derived from changes in hematocrit using published
values of plasma and blood volume. The lymph hearts are known to be
vital to the maintainence of normal fluid compartment physiology and to
increase their rate of activity during episodes of hypovolemic stress.
Yet, significant redistribution of body fluids following hemorrage
appears to occur in animals without lymph hearts.
In this study, plasma and blood volumes were determined by the dye
dilution technique using injected Evan's blue dye to label the plasma.
Eight intact and 6 animals with their lymph hearts destroyed were
hemorrhaged to 78% and 75% of their initial blood volumes, respectively.
Changes in blood volume were measured following the hemorrhage by
analysis of Evan's blue washout and hemodilution.
The intact animals completely compensated for the acute stress by
17.5 min following hemorrhage. In that time, recovery to 94% of control
blood volume was determined by the Evan's blue technique and to 104% by
hematocrit dilution. The corresponding rates of fluid return were 0.21
ml/min and 0.33 ml/min, respectively. Analysis of the extracellular
fluid volume label, thiocyanate (SCN-), which was simultaneously
injected, indicates that the compensation resulted from redistribution
of the extracellular fluid.
Similar experiments done on animals which had their lymph hearts
destroyed by cauterization indicated no capacity to replace lost blood
volume. Following hemorrhage to 75% of initial blood volume recovey was
to only 77% as determined by Evan's blue washout. Post hemorrhage
changes in hematocrit indicated continued depletion of blood volume over
the same period. This discrepancy is the result of under estimation of
Evan's blue washout caused by 2 factors, the method of analysis and
introduction of label to the lymph pool during the course of the
experiment.
3
Plasma and lymph protein concentration was measured to determine
the extent of protein redistribution following lymph heart destruction.
No significant change in protein concentration was found in either
compartment.
The conclusions of the study are that B. marinus can fully recover
from an acute volume stress of 20% within 20 min by mobilizing
extra-vascular lymph at the rate of approximately 0.2 to 0.3 ml/min and
that functional lymph hearts are necessary to accomplish this response.

THE CONTRIBUTION OF THE LYMPH HEARTS IN
COMPENSATION FOR ACUTE HYPOVOLEMIC
STRESS IN THE TOAD BUFO MARINUS
by
MARK BAUSTIAN
A thesis submitted in partial fulfillment of the requirements for the degree of
MASTER OF SCIENCE
in
BIOLOGY
Portland State University
1986

TO THE OFFICE OF GRADUATE STUDIES AND RESEARCH:
The members of the committee approve the thesis of
Mark Baustian presented June 20, 1986.
Philip
Malcolm Lea
APPROVED:
Richard Petersen, Head, Department of Biology
Bernard Ross, Dean of Graduate Studies and Research
ACKNOWLEDGEMENTS
The author is deeply indebted to those named below and to many
more unnamed without whose selfless contributions this undertaking would
not have been possible.
Stanley Hillman, whose impact on my life can neither be measured
nor described.
Those faculty, Philip Withers, Richard Forbes and Malcolm Lea,
whose personal commitment to excellence keeps me up nights.
My financial beneficiaries who are (in exponentially decreasing
order): my parents, "Tradin' John", the State of Oregon and the Federal
Gov' t (tie) •
My friends, peers and roommates: Terry & Rush, Lou, Alan, Wayne
and Zyg.
Those not previously named who read, reviewed and offered critical
comment on this manuscript.
My girlfriend.
The pizza chefs and cabbies who keep Portland on the go.
And finally, Dean Ross, for his unwavering pursuit of fundamental
tradition and meaning in this work.
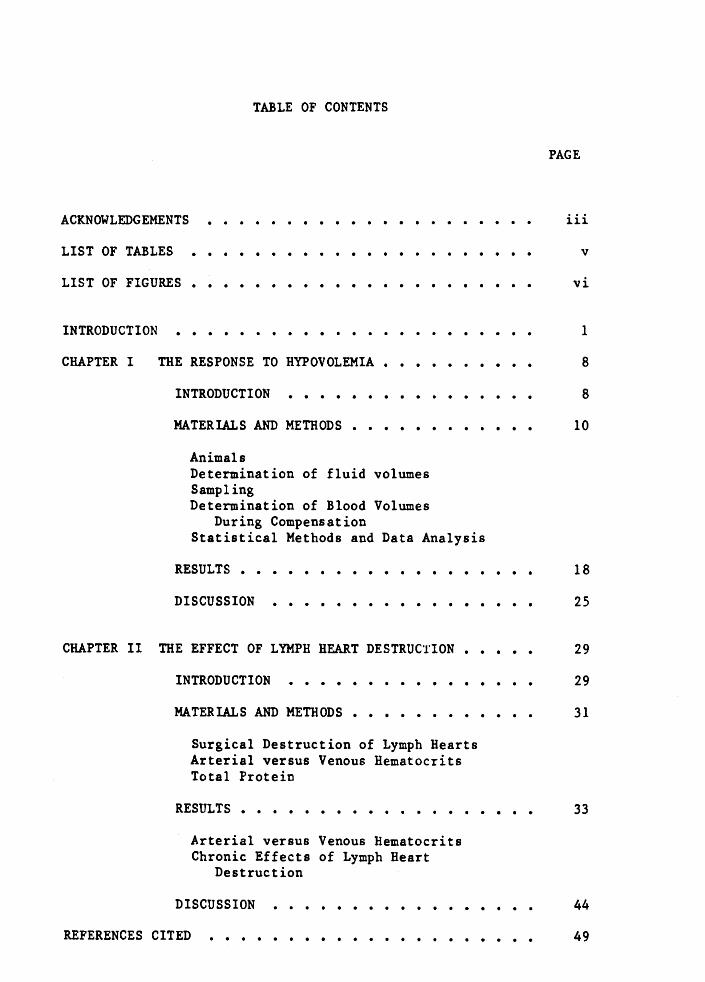
TABLE OF CONTENTS
ACKNOWLEDGEMENTS . . . . . . . . . LIST OF TABLES
LIST OF FIGURES • . . . . . . . . INTRODUCTION . . . . . . . . . . . . . . CHAPTER I THE RESPONSE TO HYPOVOLEMIA •
INTRODUCTION . . . . . . . . MATERIALS AND METHODS •
Animals Determination of fluid volumes Sampling Determination of Blood Volumes
During Compensation Statistical Methods and Data Analysis
RESULTS • • . . . . DISCUSSION
CHAPTER II THE EFFECT OF LYMPH HEART DESTRUCTION •
INTRODUCTION . . . . . . . . . MATERIALS AND METHODS ••
Surgical Destruction of Lymph Hearts Arterial versus Venous Hematocrits Total Protein
RESULTS . . . . . . . . . . . Arterial versus Venous Hematocrits Chronic Effects of Lymph Heart
Destruction
. . .
DISCUSSION . . . . REFERENCES CITED . . . . . . . . .
PAGE
iii
v
vi
1
8
8
10
18
25
29
29
31
33
44
49
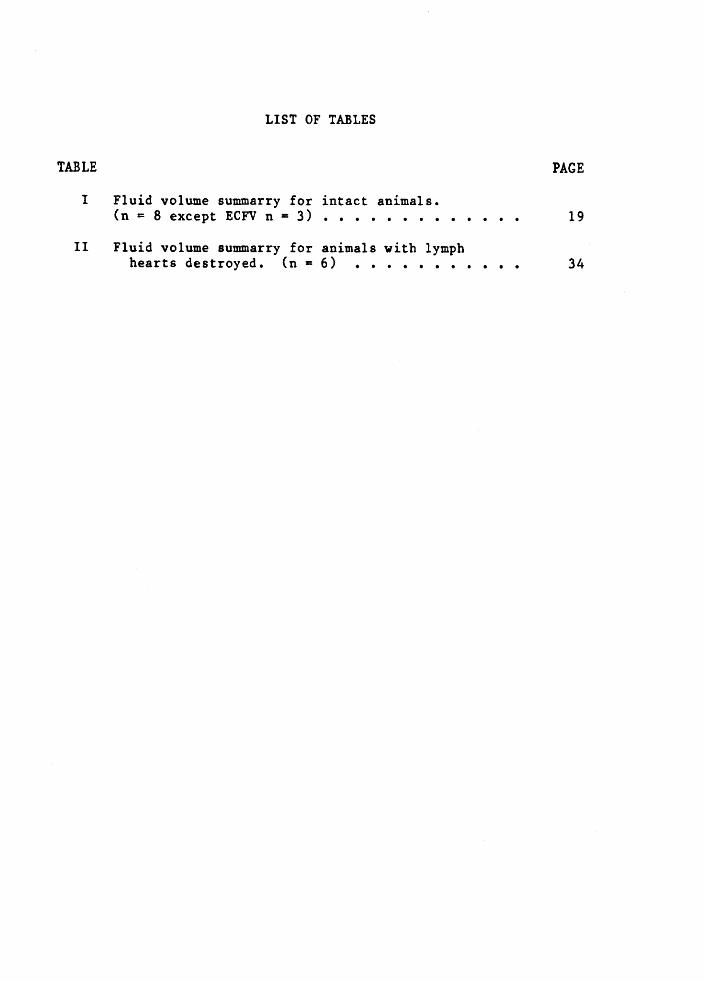
LIST OF TABLES
TABLE PAGE
I Fluid volume summarry for intact animals. (n = 8 except ECFV n = 3) . . . . . . . . 19
II Fluid volume summarry for animals with lymph hearts destroyed. (n = 6) . . . . . . . . . . . 34

LIST OF FIGURES
FIGURE
s.
6.
7 •
1. Body fluid compartmentation in Bufo marinus.
2.
3.
4.
Data after Shoemaker (1964). TBW =Total body water, BV • Blood volume, ECFV • Extracellular fluid volume, PV = Plasma volume, IsFV = Interstitial fluid volume and ICFV = Intracellular fluid volume ••••••••
Example of raw data from hypovolemia experiment using an intact animal ••••••••
Percent change in Evan's blue concentration (EB) and hematocrit (Bet) following hemorrhage in intact animals. Mean +- 2 SE, (n • 8) ••••••••••••••••••
Blood volume as a percent of control in intact animals. Mean+- 2 SE, (n = 8). Values determined from Evan's blue (EB) and hematocrit (Hct). Error in BV stippled (+- 2 SE) ••••••••••
. . . .
Distribution of thiocyanate ions during acute hypovolemia in individual intact animals • • • • • •
Percent change in Evan's blue concentration (EB) and hematocrit (Bet) following hemorrhage in animals with lymph hearts destroyed. Mean +- 2 SE, (n • 6) ••••••••••
Blood volume as a percent of control in animals with lymph hearts destroyed. Mean+- 2 SE, (n • 6). Values determined from Evan's blue (EB) and hematocrit (Hct) Error in BV stippled (-- 2 SE) •••• . . . . .
PAGE
4
17
22
25
27
39
41

8.
9.
Blood volume recovery as a percent ot volume hemorrhaged, determined from Evan's blue washout in intact animals (LH+, n = 8)) and animals with lymph hearts destroyed (LR-, n • 6). Mean+- 2 SE ••••••••.••••
Blood volume recovery as a percent of volume hemorrhaged, determined from hematocrit washout in intact animals (LH+, n = 8) and animals with lymph hearts destroyed (LH-, n • 6). Mean+- 2 SE •••••
vii
43
45
INTRODUCTION
Amphibians face potentially severe water balance stress whether in
aquatic or aerial situations. Because their skin presents a minimal
barrier to water flux, they experience either a diffusional water load
in hypoosmotic environments or, when in air, they evaporate water at a
rate equal to a free surface of water. Yet, amphibians occupy diverse
habitats ranging from totally aquatic to fully terrestrial.
Many unique adaptations are expressed to meet this dichotomous
challenge to hydrational homeostasis. Thorson (1955, 1964) reported
that extracellular fluid volume (ECFV) was correlated with degree ot
terrestriality. Hillman (1980) has shown that the more dehydration
tolerant species have larger blood volumes than the less tolerant
aquatic forms. The amphibian lymphatic system is also unique.
Capacious subcutaneous lymph spaces (sacs) are present and two pair of
functional lymph hearts persist in adults (see Kampmeier (1959) for a
description of lymph heart phylogeny). Carter (1979) has proposed that
in aquatic situations these structures provide a pathway for water
influx that by-passes the general circulation.
2
This thesis reports on aspects of lymph heart function that may be
adaptive in terrestrial situations. Bufo marinus was used as the model
in this study. This fully terrestrial toad has been widely studied with
respect to its normal fluid compartment physiology and is a particularly
suitable laboratory model because of its large size.
The normal partitioning of body water in B. marinus is depicted in
Figure 1. The values given are from Shoemaker (1964). As shown, the
total body water (TBW) is partitioned into intracellular (ICF) and
extracellular (ECF) fluid compartments. The ECF compartment is divided
into interstitial fluid (IsFV) and plasma (PV) volumes. Shoemaker
(1964) has shown that two major constituents of the !CF, skeletal muscle
and liver tissue, maintain their hydrational status during dehydration
in B. marinus. In addition, erythrocytes volume regulate when faced
with a hyperosmotic stress (Zygmunt, 1984). Fluid exchange between the
!CF and ECF compartments seems unlikely to have an important effect on
the acute responses to blood loss reported here and will not, therefore,
be considered further.
The vascular space is composed of three sub- compartments. The
hatched area in Figure 1 represents the cell fraction of whole blood. A
hematocrit (Bet) of 20% is shown. The cellular fraction is divided into
solid and fluid components. The extracellular component of blood is the
plasma and, as indicated by the dashed lines, is readily exchangeable
with the interstitial fluid.
The forces promoting fluid flux at the capillary wall are
described as Starling forces and their balance normally results in net
filtration. Guyton (1984) provides a detailed description of these

3
Figure 1. Body fluid compartmentation in Bufo marinus. Data after Shoemaker (1964). TBW =Total body water, BV =Blood volume, ECFV = Extracellular fluid volume, PV • Plasma volume, lsFV • Interstitial fluid volume and ICFV = Intracellular fluid volume.

%8L MSJ.
5
forces and their normal balance in humans. Plasma filtration into the
interstitial fluid compartment results from the combined action of
intravascular hydrostatic pressure, negative interstitial fluid pressure
and the colloid osmotic pressure (COP) of tissue fluid.
Return of plasma filtrate to the vascular space occurs both at the
level of the capillaries and the lymphatic system. The relatively
higher COP of plasma tends to draw fluid into the vascular compartment;
while, excess water and protein are collected in the tissues by the
lymphatic vessels and returned to the lo~ pressure, i.e., venous, side
of the vascular circuit. In the amphibia these fluid spaces communicate
via the lymph hearts which are depicted in Figure 1 as simple tube
hearts protected from retrograde flow by one way valves. That portion
of the total extracellular fluid that can be mobilized to augment
vascular volume during acute hypovolemic stress is represented by the
stippled area in Figure 1. No value is given for the volume of this
space.
This model assumes an animal that is fully hydrated, with an empty
bladder, under conditions of negligible evaporative water loss. (This
is an ecologically atypical situation for these animals, as they would
seldom be fully hydrated away from water with an empty bladder.) To
investigate the capacity for fluid exchange between the plasma and
interstitial fluid spaces, however, it is necessary that ancillary
avenues for fluid exchange be eliminated.
Proportional decreases in all fluid compartments would be
predicted as a result of evaporative water loss, if water freely
equilibrated between the fluid compartments of terrestrial amphibians.

6
Maintainance of blood volume, in particular, within normal physiologic
limits is important for a variety of reasons. Total blood oxygen
content and cardiac output are both volume limited. Blood pressure, an
important factor in normal fluid exchange, is critically volume
dependent.
Shoemaker{l964) reports that when deprived of water, B. marinus
exhibit an initial decrease in plasma {hence blood) volume but that this
volume stabilizes over water deficits between 5 and 20 %. Unpublished
data from our own lab indicates that Bets are maintained below predicted
levels for water deficits up to 20%. The adaptive value of such a
response for a terrestrial amphibian faced with ephemeral water supplies
is apparent.
Teleologically, it seems reasonable that terrestrial amphibians
would defend their blood volume during periods ot dehydration. A
variety of evidence suggests that mechanisms exist which could do this.
However, there is little unambiguous data available to support
quantitative assessment of the adaptive value of such a response. Even
in the more restricted case of compensation for hemorrhagic loss of
blood, there is no clear quantitative understanding of the role, if any,
played by the lymph hearts.
Experiments were done to better quantify the role of the lymph
hearts during an acute challenge to fluid compartment homeostasis.
First, the magnitude of the compensatory response to hypovolemia was
investigated in intact animals. Then, similar experiments were done
using animals with destroyed lymph hearts. The difference in response
between the two treatments should estimate the contribution ot the lymph

7
hearts to fluid mobilization in the resting, hydrated toad. Additional
experiments were done on lymph heart destroyed animals to investigate
some variables relevant to the interpertation of these primary data.
CHAPTER I
THE RESPONSE TO HYPOVOLEMIA
INTRODUCTION
A rapid compensatory response to hemorrhage induced hypovolemia
has been demonstrated in members of all terrestrial vertebrate classes
(see, Middler et al. (1968), Lillywhite & Smith (1981)). In addition to
other acute cardiovascular responses, evidence suggests that lymphatic
fluid is mobilized to augment reduced vascular volumes. This shift of
lymph between extravascular and vascular compartments could occur either
across the capillary walls or via enhanced lymphatic drainage of the
tissues.
Transcapillary filling promoted by changes in the Starling balance
of forces at the capillary wall has great potential to move large
volumes of fluid rapidly. This is due, in part, to the large surface
area for exchange and the proximity of the extravascular lymph reservoir
to the vascular space across the capillary wall. Enhanced lymph heart
activity would also increase lymph flow, to the extent that lymph is
returned to the circulation by way of the lymph hearts.

Middler et al. (1968) have reported an observable change in
frequency of lymph heart beat following experimentally induced
hypovolemia in toads. Foglia & Braun-Menendez {1941) have shown
variation in heart beat frequency in adrenalectomized and
hypophysectomized animals and with variation in temperature. These
neurogenic organs possess a normally irregular, contralaterally
asynchronous beat which, in the case of the posterior pair, can be
directly observed through the skin.
9
Middler et al. (1968) attempted to estimate the response to acute
hypovolemia in Bufo marinus. Hemodilution to 58% of prehemorrhage Hcts
was observed in intact animals following hemorrhage. Although a second
marker (1131 radio-iodinated serum albumin) was used in some studies,
the authors did not make use of it to determine ab~olute fluid volumes
and volume shifts. A similar response, however, was seen in animals
with their lymph hearts destroyed leading the authors to conclude that
lymph hearts are not uniquely responsible for the response. Thus, while
the lymph hearts seem to represent a potential pathway for lymph return,
other acute mechanisms may account for the observed hypovolemic
compensation.
In the study reported here, volume compensation following
hemorrhage was measured in intact animals using two markers for the
plasma space. Use of an injected dye allows for determination of
absolute volumes; while, simultaneous analysis of changes in
concentration ot the injected dye and the endogenous erythrocyte
provides a check against fluctuations in the concentration of either
marker that may arise from non-compensatory factors. Experience with~

10
marinus has shown that considerable changes in Bet occur as a result of
activity. These changes, which may exceed 25%, rapidly abate upon
cessation of activity. Similar responses are known in other vertebrate
groups (Lillywhite & Smits, 1984).
MATERIALS AND METHODS
Animals
Adult Bufo marinus (n • 42) obtained from commercial suppliers
were used in this study. Animals were maintained unfed with free access
to water prior to experimentation. Both male and female subjects (mass
158g to 366g) were examined. No attempt was made to determine sexual
differences in the responses tested.
All animals were fitted with a PE-90 cannula (dead space • 0.1 ml)
in the ventral abdominal vein and allowed to recover in a clean plastic
container with free access to water for 24 hours prior to
experimentation. Cannulas were kept filled with heparinized saline
between samplings to prevent clotting. Masses were recorded following
evacuation of animals bladders before each experiment.
Determination of fluid volumes
Evan's blue dye and thiocyanate ions (SCN-) were used to measure
plasma volume and extracellular fluid volume, respectively. Standard
dye dilution techniques, as described in Shoemaker (1964) or Lillywhite
& Smith (1981), were modified as follows to meet the requirements ot
this study. 300 uL of a 1:3 dilution of 10% Evan's blue was injected
through the cannula immediately following collection of a control blood

11
sample. Two hundred uL of 20% NaSCN was administered as either the
Evan's blue diluent or separately following injection of the Evan's blue
dye.
Evan's blue standards were prepared by adding appropriate volumes
of the Evan's blue solution to 2 mL of 3% BSA. Twenty uL of each
standard and the plasma samples were added to 1.0 mL distilled water and
the optical density (O.D.) determined at 600 nm on a dual beam spectro
photometer.
Thiocyanate standards were prepared by adding appropriate volumes
of the SCN- solution to 5.0 ml 0.9% NaCl. Forty uL of each sample was
pipetted into 1.4 mL 10% TCA to precipitate plasma proteins and
protein-bound Evan's blue dye. Standards were similarly acidified,
although no protein or dye was present. After centrifugation of
samples, 1.0 mL 5% FeNO in 2.5% HNO was added to 1.0 mL of supernatant
from each sample and standard and the O.D. determined at 480 nm on a
dual beam spectrophotometer.
Plasma volume (PVinit) was calculated by dividing the volume of
Evan's blue dye injected by the concentration of dye determined from the
intercept of a semilog plot ot pre-hemorrhage sample concentrations.
Initial blood volume (BVinit) was calculated from the plasma volume by.
equation 1 using the mean of the prehemorrhage Hcts (mean control
hematocrit, MCHCT)
BVinit = PVinit I (1 - MCHCT I 100). (1)

'" -..
12
Extracellular fluid volume was calculated by dividing the volume of SCN
injected by the concentration of SCN- obtained from a sample taken after
an equilibration period of 60 min.
Sampling
In order to depict the time course for changes in plasma volume
using a dye which is gradually lost from the plasma space, it is first
necessary to establish an initial rate of loss for the dye. This was
done by taking 5 post-injection samples at 15 minute intervals (see
below for individual sample protocol.) After collection of the fifth
sample the cannula was allowed to drain into a heparinized 10 ml syringe
until a volume of blood equal to 2.0% of the animal's body mass had been
removed. This blood was retained for reinfusion after completion of the
experiment.
Following hemorrhage, the acute phase of compensation was
surveyed. Pilot studies indicated that post-hemorrhage recovery would
be rapid, therefore, as many samples as possible were taken during this
period. Five post-hemhorrage samples were collected at 5 min intervals.
An additional 4 samples were taken at 15 min intervals to reestablish
the baseline rate of dye loss following compensation. Including the
control sample, 15 samples were collected in all.
In order to assure that samples obtained were representative of
the general circulation and not peculiar to the local environment of the
cannula, the following protocol was used to obtain all samples. Saline
filling the cannula was allowed to drain off and an empty syringe barrel
was fitted to the cannula. The syringe was allowed to fill with 0.1 to

...
0.2 ml of blood and removed. Two heparinized micro-hematocrit tubes
were filled with approximately 40 ul of blood each. The previously
drawn blood was then reinfused and the cannula flushed with 0.1 ml of
heparinized saline. Hematocrits were determined after centrifugation
for 5 minutes and plasma samples were refrigerated for colorimetric
analysis, as previously described.
13
Animals were sampled unanaesthetized. To avoid complications due
to extemporaneous activity caused by intermittent handling during
sampling each animal was kept in a plastic container placed over a grate
through which the cannula was accessible. It was desired that the
animals be tested at rest, as Hct was found to fluctuate with activity.
However, B. marinus are prone to struggle when confined or restrained
and periodically would engage in vigorous activity bouts.
Determination of Blood Volumes During Compensation
Plasma and blood volumes following hemorrhage (PVi & BVi) were
determined by subtracting the volume hemorrhaged (VH) and (VH * (1 - HctH
I 100)) from the initial blood and plasma volumes, respectively. Here,
HctH is the Hct at the time of hemorrhage •

•,
14
Plasma and blood volumes (PVi & BVi) following hemorrhage were
calculated from observed changes in the concentration of Evan's blue and
Hct using equations 2 and 3.
PVi = PVinit * Cnc ~
BVi = BVinit * (Hcti) *CV - VH*Hctn
where: Cnc
Ci Hctn CV VH Hcti ti
=
= --= = = =
(Hctn> CV
concentration of dye at hemorrhage corrected by extrapolation of prehemorrhage concentrations to ti dye concentration at ti hematocrit at hemorrhage volume of cells initially present volume of blood hemorrhaged hematocrit at ti time sample was taken
(2)
(3)
The term Cnc in the numerator of equation 2 corrects for the
continued loss ot dye during the period of compensation, assuming a rate
of dye loss equal to the pre-hemorrhage rate. This is a conservative
assumption as a decrease in blood pressure following hemorrhage would
likely result in a concomitant decrease in filtration of dye.
The cell volume remaining after hemorrhage (CVn) was calculated by
equation 4 as
CVn = (BVi - VH) * Hctn. (4)
··-.
15
This volume of cells is used in equation 5 to calculate post hemorrhage
blood volumes (BV ) from the plasma volumes determined from the Evan's
blue washout.
BV = PV + CV (S)
Statistical Methods and Data Analysis
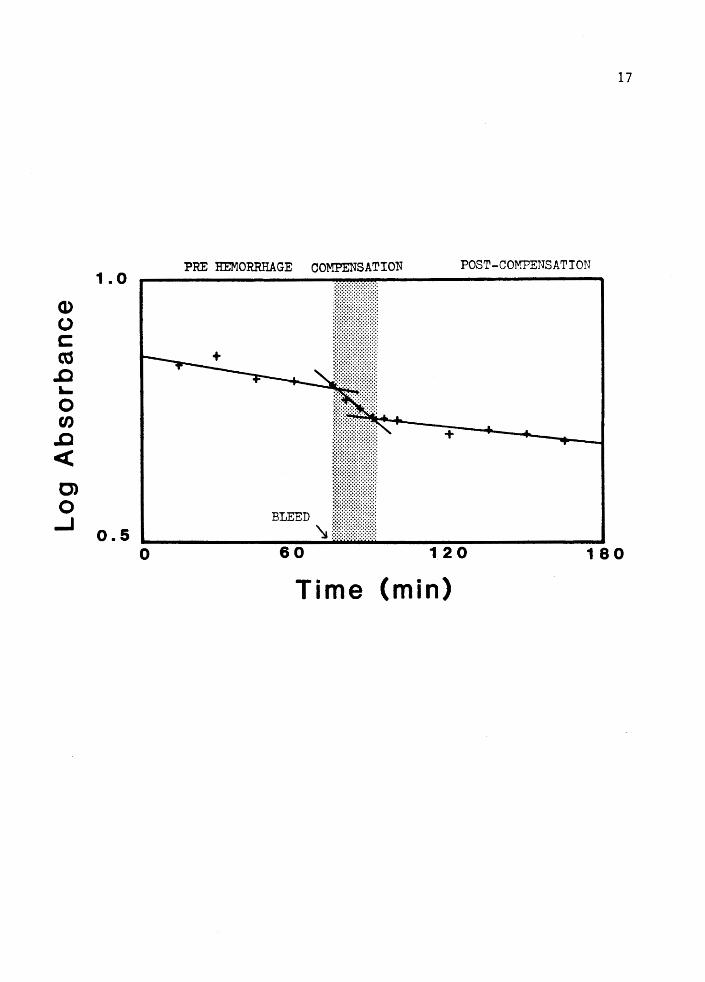
The fundamental analysis of washout curves for the experiments
described in Chapters 1 and 2 was done as follows. Each experimental
trial was analysed for time trends in the data. The intervals sutended
by these trends are depicted in Figure 2. The sample taken just before
hemorrhage was considered to be the last element of the pre-hemorrhage
interval and the first element of the putative compensation interval.
The intersection of the compensation and post-compensation intervals was
determined using the multiple regression method described by Draper and
Smith (1981) in their discussion of analysis of time trends in data.
Actual analysis was done using the Multiple Regression: Subprogram
Regression of Statistical Package for the Social Sciences (SPSS) by Nie
et al. (1975). Analysis was done using semi-log plots of raw absorbance
data. All reasonable groupings of the data were analysed and the
compensation interval was taken to end at the sample following the
predicted intersection point of the model having the smallest residual
sum of squares.
Testing for significance of differences between the slopes of
lines within the intervals so determined was done using the analysis of
variance method for tests of more than 2 slopes described by Zar (1984).
Time to recovery (TTR) was considered to be the time of the compensation

Figure 2. Example of raw data from hypovolemia experiment using an intact animal.
16
(U!W) 0W!J. 09 .. 0 z .. 09 0
s·o r 0
<C
> + c- (JJ
0 .., c-Q) :::J 0 CD
0 ... NOliLVSN&iWO~hLSOd
L1
18
interval; therefore, TTR for individual animals is a multiple of the 5
min sampling intervals used.
RESULTS
Fluid volume determinations for the 8 animals used in this study
are shown in Table 1. The degree of hypovolemic stress was calculated
individually for each animal as the ratio of blood volume removed (VH)
to BVinit•
If compensation were to occur during the time course of these
experiments, 3 time trends should appear in the dye concentration data.
Between the times of dye injection and hemorrhage a slow exponential
decrease in dye concentration should accompany the unavoidable loss of
dye from the vascular space (see Figure 2, pre-hemorrhage.)
Following hemorrhage, concentration should decline precipitously
as unlabled fluid fills the vascular space to compensate for the deficit
(see Figure 2, compensation.) Acute compensation can be inferred if
slopes ot the first and second time trends are significantly different.
The magnitude of the response can be estimated from the divergence of
these two lines during the period of compensation. Compensation hes
ended when the decline in concentration brought about by the hemorrhage
has ceased (see Figure 2, post-compensation.) The expected contours in
the absorbance data were observed in all control animals tested. In all
cases, the slope of the compensation time trend was significantly
different from the others.
The profiles for Evan's blue concentration and Bet are shown in
Figure 3. As can be seen, both decline precipitously following

TABL
E I
FLU
ID
VOLU
ME
SUM
MAR
Y FO
R IN
TACT
AN
IMA
LS
(n
I nit
i t11
In
itia
l T
ime
To
Pla
sma
Heu
ato
crit
B
lood
S
tres
s ft
ecov
er
Vol
ume
Vol
ume
(ml I
lOO
g)
(ml/
lOO
g)
( ·,:.)
(m
in)
Mea
n 7.
32
21
9.25
22
.3
17.5
S.E
. .5
6 2
.9
.52
1. 2
1.
3
Ran
ge
5. 2
4 -
10. 3
6 13
-
35
7. 6
6 -
11. 9
2 16
.6-2
4.9
15
-25
8,
ex
cep
t EC
FV
n 3
)
Rec
over
y R
ecov
ery
Vol
ume
Rat
e
( .. :. )
(m
l/m
in)
E.11
. H
ct
E.B
. H
ct
96
107
. 21
. 33
3.5
3
.05
.06
87-1
10
47
-llh
.0
7-.4
7 .1
2-.6
7
Ex
tracell
ula
r F 1
u i d
V
o 1 um
e
(ml /
lOO
g)
49
.9
5.9
41
.6
-61
.4
~
\0
20
hemorrhage, with Evan's blue concentration attaining constancy after
about 15 min post hemorrhage. Means of the Hct determined values in
Figure 3 fall within 2 SE of the mean dye determined values. It can be
seen, however, that Hct as a % of control continues to decline over the
full 25 mins shown and that 2 SE of the Hct determinations fail to
capture the mean of the dye values at 20 and 25 min post-hemorrhage.
Hemodilution exceeds Evan's blue washout at every interval.
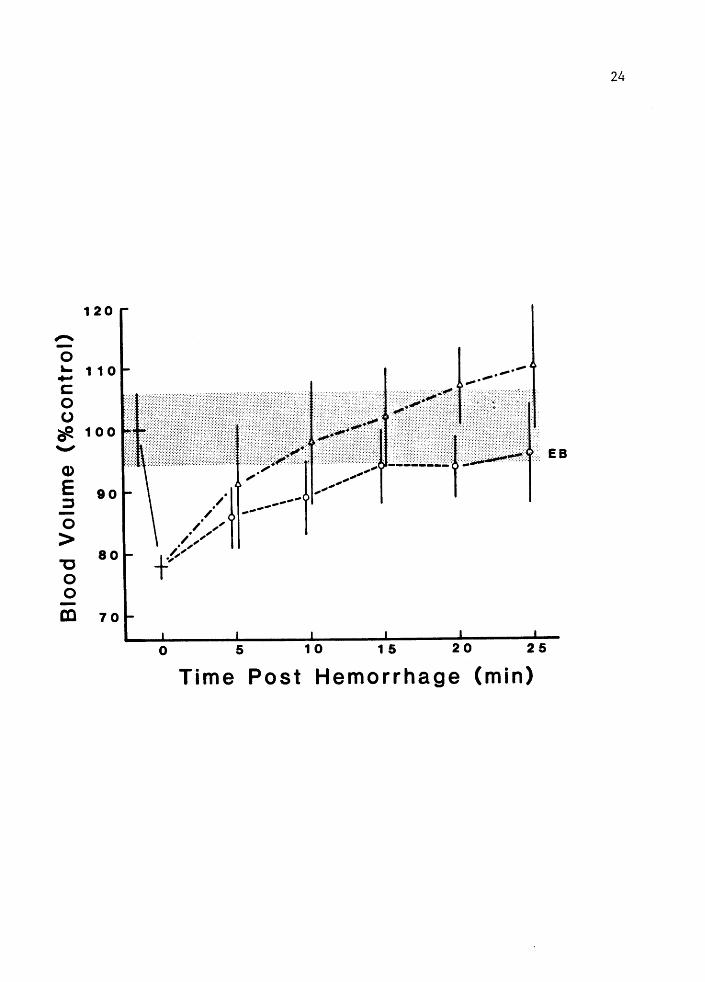
Blood volume recovery data is shown in Figure 4. This figure is an
algebraic variant of Figure 3 and as expected depicts similar
relationships between estimates derived using the two markers. It can
be seen that compensation as inf erred from the dye washout is complete
15 min post hemorrhage; while the profile of Hct determined volumes
would suggest that compenstion continued through 25 min.
These experimental results are also summarized in Table 1. The
percent recovery shown in Figure 4 is lower than that given in Table 1
because variation in individual TTR's have not been corrected for in the
abscissa. The time to recovery reported is the arithmatic mean of
individually determined recovery times measured as multiples of the five
minute sample intervals. Of the 8 individuals tested, 5 recovered in 15
min, 2 in 20 min and 1 only after 25 min.
Percent recovery volume is the mean ratio of the recovery blood
volume at TTR and BVinit for each individual. Percent recovery is given
using volume estimates based o~ the washout of both markers. The values
are not significantly different. The recovery rates shown are means of
slopes obtained from individual blood volume profiles during the
interval of compensation.

Figure 3. Percent change in Evan's blue concentration (EB)and hematocrit (Hct) following hemorrhage in intact animals. Mean+- 2 SE, (n = 8).
21

(U!W) aBe4JJOW9H ISOd 9W!l sz oz 9 .. 0 .. 9 0
zz
09
OL
08
08
0 0 :::s n <D :::s ... .., $.\) ... 0 :::s
" oe. 001. n 0 :::s ... ..,
01. .. 0 .._,

Figure 4. Blood volume as a percent of control in intact animals. Mean+- 2 SE, (n • 8). Values determined from Evan's blue (EB) and hematocrit (Hct). Error in BVO stippled (+- 2 SE).
23
(U!W) a6e4JJOW0H ISOd 0W!1 oi 9 .. 01. 9 0
OL aJ
08
08
0 0 c. < 0 c:: 3 (1)
"' 00 &. -ae. 0 0 :::J
0 .. .. :::;-0
oi 1.
25
The effect of hemorrhage on the distribution of SCN- is shown in
Figure 5. Following an equilibration period of about 45 min the decline
in the log transformed absorbance is linear. No perturbations of this
linearity can be attributed to the h£mcrrbage or concomitant
compensation. Determination of absolute ECFV was not done on this data.
The value for ECFV given in Table 1 is from an independant determination
done on 3 toads. One of these toads provided data that has been
incorporated into this study. The other 2 are included in the study
which follows.
DISCUSSION
Published values for plasma volume determined by dye dilution
using Evan's blue dye vary considerably. Thorson (1964) provides a
plasma volume estimate of 4.7ml I lOOg for Bufo marinus, whereas,
Shoemaker (1964) reported mass specific plasma volumes more than double
this amount for the same species (11.lml I lOOg). The value determined
in this study (7.3ml I lOOg) agrees closely with the value given by
Prosser & Weinstein (1950) that is commonly used as an estimate (7.0ml I
lOOg).
In order for dye dilution estimates of fluid volumes to be
accurate it is necessary for the concentration of dye in the samples
taken to equal the mean concentration ot the space being measured
(Lawson, 1962). Thorson makes the claim that circulatory mixing was
complete over the sampling period used; however, the dramatically lower
values reported suggest a sampling period longer than 30 min post
injection may be desirable.
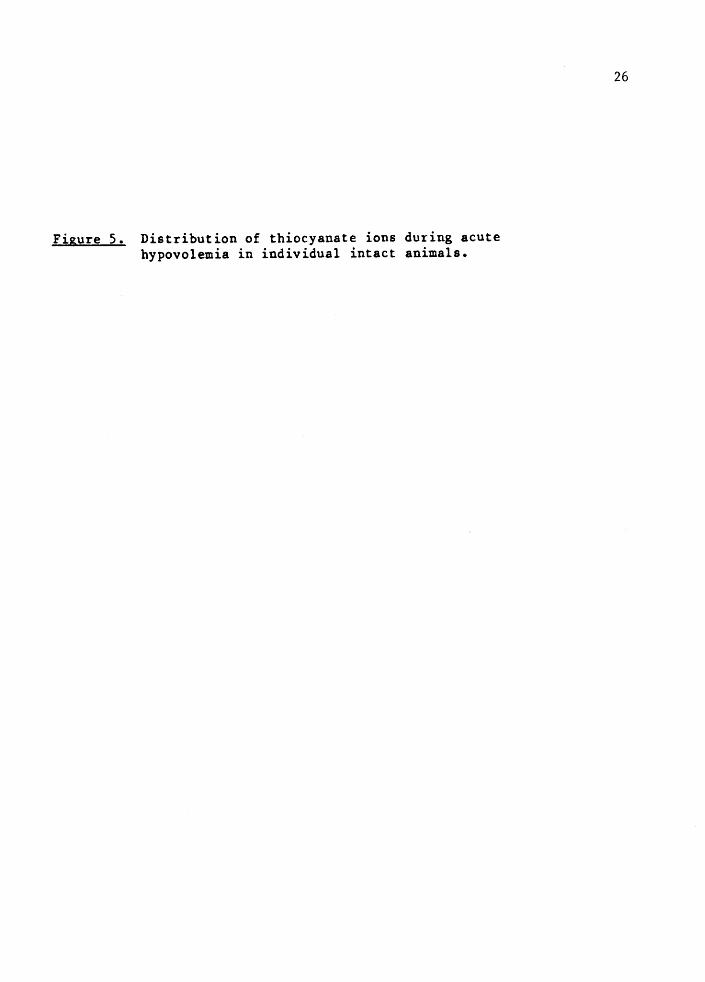
Figure S. Distribution of thiocyanate ions during acute hypovolemia in individual intact animals.
26

(U!W) 9W!l 0 g .. 0 z .. oe 09 0£ 0
£ . r-0 (Q
" . > C"
"' g • 0 ~
C" Q)
9. :l (')
CD
l. .

28
The coefficient of variation of the blood volume estimate (15.9%)
is lower than for the plasma volume estimates (21.6%). Variation in Hct
and plasma volume appear to be coupled, indicating that the controlled
variable is blood volume. Animals with lower red cell volumes have
correspondingly higher plasma volumes and vice versa.
The discrepancy between the estimates of compensation based on dye
washout versus hemodilution probably arise from 2 sources. First, the
assumption that dye filtration following hemorrhage proceeds at a rate
consistent with that observed before bleeding probably leads to an
underestimate of dye washout. Perhaps more significant, however, may be
the return of label to the circulation over time as dye accumulates in
the lymph.
These results are comparable to those obtained by Middler et al.
(1968). Bet washout to 58% of control followed hemorrhagic stress of
approximately 50% (3.5mL/100g) in their study. In the study reported
here a mean hemorrhagic stress of 22.3% produced a washout of 71%. The
Middler study does not provide sufficient data to justify a comparison
of the TTR.
The rate and precision of blood volume regulation following acute
blood loss determined in this study are remarkable, although not
entirely unexpected. As previously described, changes in Bet following
activity of 27% to 36% have been seen among toads in our lab. The
activity induced hemoconcentration is reduced to 25% after 20 - 30 min
rest. This would suggest that a volume deficit comensurable with the
observed increase in Bet has been replaced in that period of time.
CHAPTER II
THE EFFECT OF LYMPH HEART DESTRUCTION
INTRODUCTION
A variety of studies have suggested that the lymph hearts are
vital to the maintainance of normal fluid compartment physiology.
Folglia (1939, 1941) has shown that fatal hemoconcentration and edema
follows the loss of functional lymph hearts in Bufo aboretum, indicating
net transfer of fluid from vascular to extravascular spaces. This
result was observed whether the hearts were destroyed by electrocautery,
in which case the lymph channel was destroyed, or were simply
denervated, in which case only the beating of the heart was arrested.
This led Foglia (1941) to characterize the hearts as suction pumps.
The rate of lymph formation and the capacity of the lymph hearts·
to return this fluid to the circulation have been the subject of many
investigations. Ito (1926) reported hemoconcentration of S - 46% in 10
mins following lymph heart destruction. If this change results solely
from stoppage of lymph flo~, an animal with a 7% plasma volume must be
cycling a volume of lymph equal to S times its body mass per day.

30
Conklin (1930) attempted to verify these results after
destruction of the posterior hearts alone. She was able to manipulate a
subset of her data to produce agreement with the results of Ito. Ten
years later, however, Foglia (1939) was able to show that a single
functional lymph heart is sufficient to forestall the fatal consequences
of lymph heart destruction and presumably acute hemoconcentration as
well.
Two conclusions are implicit in these studies. First, that volume
of fluid, which lost produces the observed hemoconcentration, must
normally be returned to the circulation. Second, all this fluid is
returned via the lymph hearts as the volume lost is the result of net
capillary filtration.
In 1968, Middler et al. took the opposite approach. Hemodilution
following acute hypovolemia was determined both in intact animals and
animals without lymph hearts. Intact animals showed Hct reduction to
84% and 47% of control; however, lymph heart destroyed animals
hemodiluted to 37% of initial Hct. The observation that lymph heart
contraction rate increased following hemorrhage in the intact animals
suggests that the lymph hearts contribute to compensation. The
magnitude of this contribution is the difference in hemodilution between
the two treatments.
The minor contribution of the lymph hearts to hypovolemic
compensation suggested by the Middler study seems to contradict the
fundamental importance of these organs in maintainence of fluid balance
implied by the studies of Ito (1926), Conklin (1930), Foglia (1939;
1941) and Zwemer & Foglia (1943). Bashir (1967) has determined that the
31
lymph hearts are vital for the return of lymph to the circulation in
Rana catesbeiana. This discrepancy deserves further study. The method
of the previous section is here used to measure the differences in
compensation between animals with and without lymph hearts.
MATERIALS AND METHODS
Surgical Destruction of the Lymph Hearts
Destruction of lymph hearts was done by the method of
electrocautery as described in Foglia (1939). In the discussion that
follows animals without lymph hearts are frequently designated LH- and
intact animals as LH+. Animals were anaesthetized for surgery using
MS-222. Because the lymph hearts lie imbedded in connective tissue, the
persistence of the heart beat during the surgery is a valuble visual aid
to identify the heart during surgery. Therefore, animals were removed
from the anaesthesia as soon as the corneal ref lex was lost since longer
periods of exposure were found to arrest the lymph heart beat.
The anterior lymph hearts lie between the suprascapula dorsally
and the transverse process of the 3rd vertebrae ventrally. They were
exposed by making a l.Scm inscission parallel to the vertebral margin of
the suprascapula and separating the rhomboides muscle from the
musculature of the vertebral column. Heart be4lt was usually not visible
in the anterior hearts. In an effort to assure complete destruction,
all connective tissue in the exposed cavity was cauterized.
The beating of the posterior hearts was readily observable beneath
the overlying skin just lateral to the caudal end of the ilium. A 1.5 -
2.0cm inscission was made through the skin over the region where the
32
pulse was observed. To minimize the burning required to fully destroy
the hearts, excess connective tissue was cut away prior to cauterizing
these structures.
Where hearts were observed beating, application of the current
caused an immediate cessation of the beat; therefore, the location of
each heart was carefully observed before thorough cautery of the area.
All incisions were closed with 3 - 5 single silk sutures. Loss of lymph
through the sutured incisions was minimal provided the animals remained
in an upright posture.
Where sham operations were performed they consisted of making
incisions in the skin and suturing in the normal manner. No cautery of
any tissues was done on these animals.
Following surgery, each animal had its bladder drained and was
weighed. Animals were placed in dry plastic containers to recover. A
moist paper towel was placed over the container to retard evaporative
water loss during recovery. Following 3 hrs recovery the animals
appeared to behave normally.
Sampling of Arterial and Venous Bematocrits
Initial data collected from animals with destroyed lymph hearts
suggested that post-hemorrhage venous Bets may have been biased by
changes in perfusion through the v&scul•r circuits being sampled.
Decreases in blood flow rate (BFR) would tend to promote red blood cell
(RBC) pooling, resulting in sample Bets above mean circulatory Hct.
Five animals were outfitted with ventral abdominal vein and
systemic arch cannulas. Each animal was tested separately following a
sham operation and a day later actual lymph heart cauterization.
Several pre-hemorrhage samples were collected to compare control A/V
Bets. Following hemorrhage of 2ml/100g mass, additional samples were
collected at 5-10 min intervals for 30 min to determine the effect of
hemorrhage on Bets taken from these circuits.
Absolute volume determinations were not done. The animals were
kept unconfined in dry plastic containers covered with moist paper
towels during the course of these experiments.
Total Plasma Protein
33
Plasma samples were taken from a group of 6 lymph heart destroyed
animals every 3 to 6 hours until death. Two of the animals were
similarly sampled for 1 day prior to the lymph heart surgery, following
a sham operation. Plasma samples were collected as previously
described. Lymph samples were obtained, at the same time, through a
small incision in a dorsal lymph sac. Bets were taken and total protein
determined using the biuret method (Sigma Technical Bulletin, Total
Protein kit #540).
RESULTS
Determinations of the initial fluid volumes for the LB- animals
used in the hypovolemia experiments are summarized in Table 2. Mean
plasma and blood volumes for this group
(6.07 +- 0.96 and 7.79 +- 1.04, Mean+- 2 SE) are significantly less
Ct-test, P < 0.05) than for intact animals (7.32 +- 1.12 and 9.52 +-
1.04, Mean+- 2 SE). Bematocrits were higher (24 LB-, 21 LB+) but not

Mea
n
S.E
.
Ran
ge
TABL
E II
FLU
ID V
OLUM
E SU
MM
ARY
FOR
ANIM
ALS
WIT
H LY
MPH
HEA
RTS
DEST
ROYE
D (n
•
6)
Init
ial
Init
ial
Rec
over
y R
ecov
ery
Plas
ma
flem
atoc
rit
Blo
od
Str
ess
Vol
ume
Rat
e V
olum
e V
olum
e cq
{m
l/min
) (m
l /IO
Og)
(m
l /lO
Og)
E
.B.
Hct
E
.B.
Hct
6.07
24
7.
79
25.0
77
61
.0
2 -
.15
.4G
2.
4 .5
4 1
.6
3.5
5.0
.0
15
.04
4. 61
-
7. 7
0 16
-
32
6.49
-9.
71
20.1
-30.
3 68
-
38
49
-83
-.
03
--
27
-.0
6 -
.04
w ~

significantly so. The degree of hemorrhagic stress in this group was
correspondingly higher (25.0%) than for intact animals (23.2%).
35
Evan's blue absorbances were analysed for time trends in the data
using methodology described in Zar (1984). The putative compensation
interval for this analysis was taken to be 20 mins post hemorrhage.
This includes the sample following the mean time to recovery observed
for intact animals. No significant differences CANOVA, P < 0.01) were
found in slopes of the 3 intervals for 6 of the nine animals tested.
Further analysis indicated no substantive difference between the 3
exceptional toads and the control animals; therefore, these surgeries
were considered to have failed and data taken from these animals was
excluded from analysis.
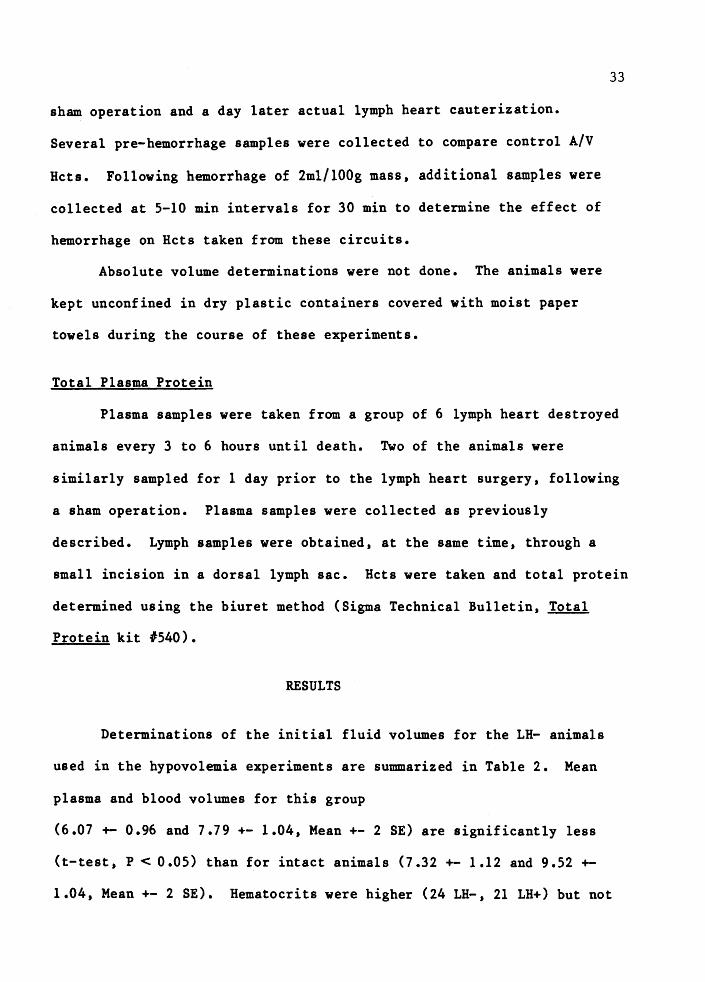
The relative changes in Evan's blue concentration and Hct are
shown in Figure 6. Evan's blue concentration following hemorrhage
remained constant while Hcts rose 28%. Blood volume profiles
constructed from both markers are shown in Figure 7. As would be
predicted from the results in Figure 6, volumes determined from Hct
washout are lower for all intervals, indicating continuing loss of
plasma during the compensation interval. Percent compensation in the
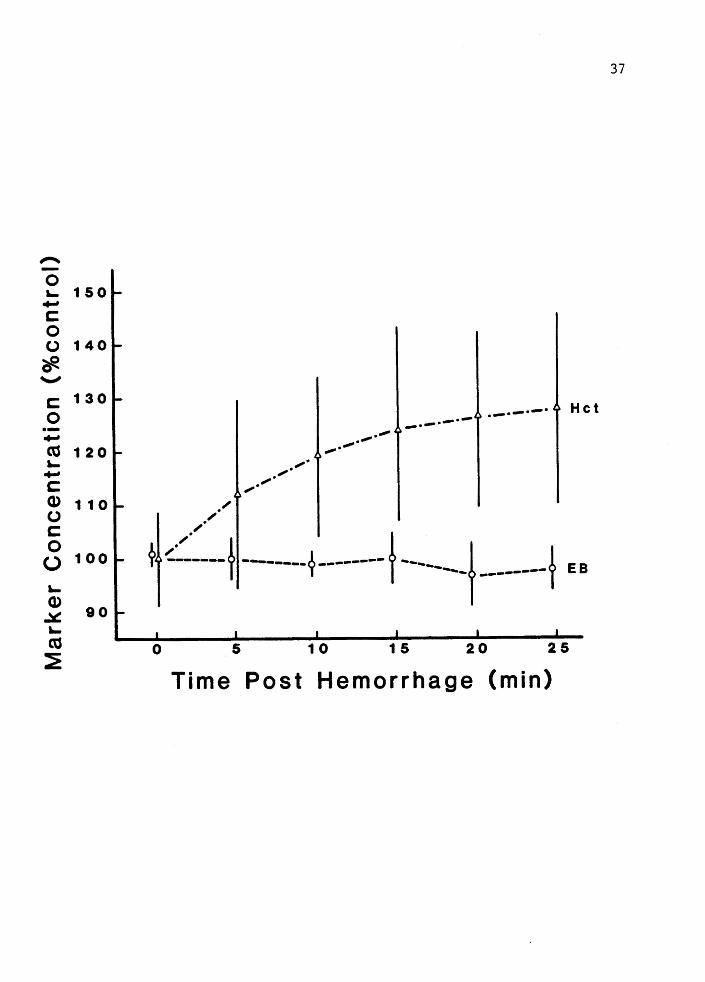
intact and lymph heart destroyed animals is compared in Figures 8 and 9
for the dye and Hct markers, respectively. The ordinate in these
figures was determined by dividing the volume returned to the
circulation by the hemorrhagic stress.

Figure 6. Percent change in Evan's blue concentration (EB) and hematocrit (Hct) following hemorrhage in animals with lymph hearts destroyed. Mean+- 2 SE, (n c 6).
36
L £
(U!W) a6e4JJOW9H isod 9W!.L
sz OZ 9 .. 0 .. 9 0
93 t-------1-----t-------+-----t----./ ~
/,/"
-·-· ·-· -·-· -·-
06
001. 0 0 ::J (')
0.. .. (1)
::J ,.. .., oz .. Q>
0 Ot I. ::J
....... ~
O\rl. (') 0 ::J ,.. 09 .. .., 0

Figure 7. Blood volume as a percent of control in animals with lymph hearts destroyed. Mean+- 2 SE, (n s 6). Values determined from Evan's blue (EB) and hematocrit (Hct) Error in BVO stippled (+- 2 SE).
38

(U!W) a6e4JJ0WaH isod aw11 OZ g l Ol g 0
l I I I I I
-09
I:> H • ·-·-·-· -0 9 -·' -·-·-·-~, ..... __ ·-·-,, ...............
8 3 1 I --+------+---~~: r=~::::-+ -0 L
r------------\ ~ : :
.l:"i!1~:·~\: :\\~\~: .:·:<! < :-
·.
.·.· /:;;., OOl :·
::::: >'.·'. .·: ... ~(. ::
... :,·( :: .. '.:> ::-:.···
:· :::::: ..... ::::: .·.·.·. ... :. ) > :.:::::::: ::::::.: .·.·.·.· ·.· •·• .·.·.·.·.
-0 l l
6£
aJ 0 0 a.
< 0 c: 3 CD
~
oe. ()
0 :::s ,.. .., 0
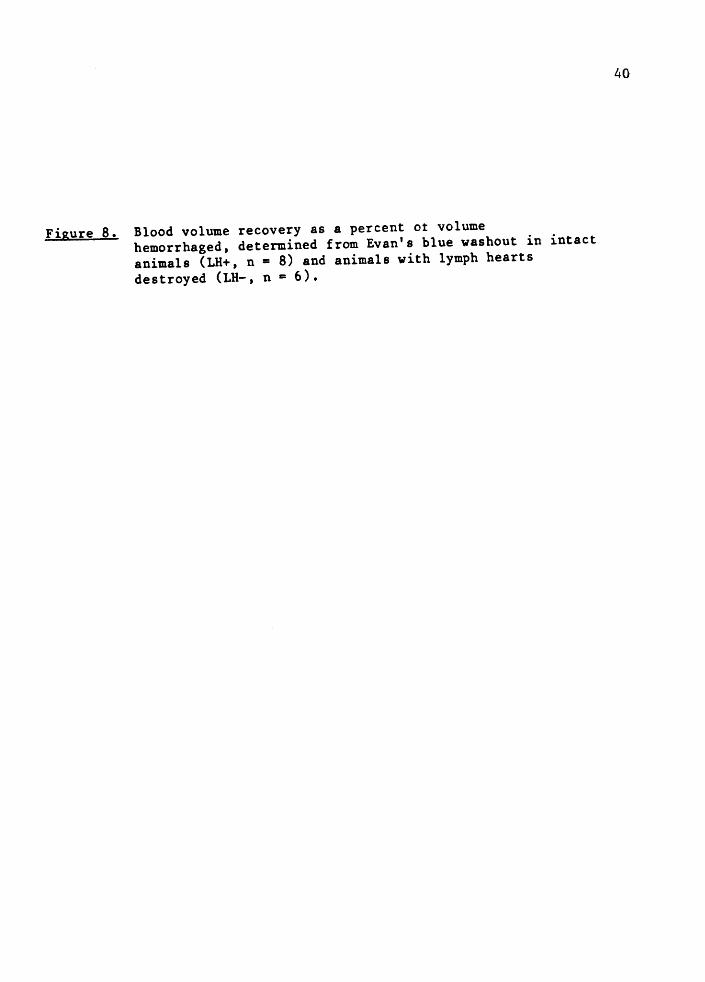
Figure 8. Blood volume recovery as a percent ot volume hemorrhaged, determined from Evan's blue washout in intact animals (LR+, n = 8) and animals with lymph hearts destroyed (LR-, n = 6).
40

(U!W) a6e4JJOW9H ISOd 9W!l
sz oz o~ s 0
0
"' ~ < sz :::s' 0
CD c 3 3 0 CD ... ... :0 09 =:I" Q) CD cc 0 CD 0
< -- -- -- --
SL < CD 0 ... -'< . .....,
00~

Figure 9. Blood volume recovery as a percent of volume hemorrhaged, determined from hematocrit washout in intact animals (LH+, n • 8) and animals with lymph hearts destroyed (LH-, n • 6). Mean+- 2 SE.
42

(U!W) a6e4JJOW9HJS0d9W!! sz oz g a. 0 a. g 0
OS-"" '#. < ';3" 0 (1) -c:
0 3 3 0 (1) .., .., JJ ';3"
09 D> (1)
cc 0 (1) 0
< < (1)
00 a. 0 .., -'< . .....,
09 a.
44
Arterial vs Venous Hematocrits
Arterial Bets tended to be 1-2% higher than venous, in both the
sham operated and lyreph heart destroyed ani~als. Following hemorrtage
in the sham operated animals both arterial and venous Hcts exhibited
characteristic declines. Decreases in arterial Hct ranged from 82% to
63% of control and were generally 5% to 10% lower than corresponding
venous Hcts. In the animals without lymph hearts, the prehemorrhage Hct
protiles paralleled each other as well. Interestingly, the dramatic
post hemorrhage increase in venous Bet observed previously was not seen
in these animals. Both arterial and venous samples showed minor
hemoconcentration.
Chronic Effects of Lymph Heart Destruction
The long term effect of lymph heart destruction on Hct was quite
variable. Hematocrits at death ranged from 28 to 65. Terminal Hct
appears coupled to initial Bet, generally exhibiting about a two fold
increase over the latter.
Protein concentrations in plasma and lymph of the lymph heart
destroyed animals and controls do not differ significantly. Analysis of
the data failed to reveal any time-linked decrease in protein
concentration in either compartment. The ratio of plasma to lymph
protein was 2.6 +- 0.38.
DISCUSSION
The decrease in initial plasma and blood volumes of the lymph
heart destroyed animals compared with the intact animals suggests that a
45
significant loss of plasma occurs over the 3 hour operative and recovery
period. The larger hemorrhagic stress reported for this group further
testifies to this effect.
Mean recovery volume for the animals with destroyed lymph hearts
is only two percent above the mean post hemorrhage volume (Figure 8) and
recovery rates reported are 10% of the values determined for intact
animals. The concentration and volume profiles in Figures 4 and 5
similarly indicate that the lymph heart destroyed animal is unable to
replenish depleted vascular volumes.
In another class, Reptilia, hypovolemic compensation is believed
to occur by transcapillary fluid shifts (Smits and Lillywhite, 1985).
The findings of Middler et al. (1968) would suggest a similar mechanism
is important for B. marinus. The lack of a response by the lymph heart
destroyed animals in this study, however, argues strongly that any
transcapillary mechanism is of secondary importance. Taken together,
the post-operative blood volume decrement in unstressed animals and the
inability to compensate for acute hypovolemic stress, indicate that the
lymph heart pathway is fundamentally important for lymph return.
The two groups also showed differences with respect to the effects
of activity on Hct. Preparation ot animals for experimentation,
ircluding weighing, bladder evacuation and confinement resulted in a
transient erythrocythemia, frequently as large as 40%. This effect
abated after 10 to 20 minutes of quiescence in the intact animal. The
increases in hematocrit following hemorrhage of the lymph heart
destroyed animals (Figure 5) persisted for the 90 min duration of the
experiment.
46
In the control experiments activity bouts were infrequent. In the
lymph heart destroyed group, however, cannula flow was typically weak
and removal of the animal from confinement in order to hemorrhage was
frequently required. The increases in Hct seen in Figure 5 are most
likely attributable to activity associated with this handling.
The A/V Hct studies corroborate this interpretation. The animals
used in this study were handled through out the sampling procedure.
Mean Hcts for this group were higher than for either of the other
groups. The absence of post-hemorrhage erythrocythemia in this group
indicates that the scope for further increase in Hct has been taken up
by the initially elevated Hcts.
The disparity between the dye and red cell markers during this
activity is nonetheless paradoxical. Unless the animal is filtering
plasma, as opposed to serum, a concomitant increase in plasma protein
and hence, protein bound Evan's blue dye should be seen. No evidence of
increased plasma protein concentration was observed (see Figure S.)
This is supported by total plasma protein determinations in the Et~dy of
chronic effects of lymph heart destruction, where no change in plasma
protein concentration was observed. However, if plasma is being
filtered, lymph protein concentrations should be increasing tovard
plasma levels which they are not.
In the preceding study, Evan's blue determinations underesti~at~d
plasma volume recovery relative to Hct determined values. Here, Evan's
blue determinations eppear insensitiv£ to increased filtration rates
encountered during the experiment. Therefore, it can be concluded that
changes in plasma volume are best marked by observing changes in Hct.
47
The importance of the dye used in this study should not be ignored.
Data from the Evan's blue provided the basis for determination of the
volume measurements. In addition the analysis of recovery times could
not have been done using Bets measured as whole number percentages. The
problems related to interpretation of the Evan's blue data for
determining volumes should not compromise the dye washout kinetics
analysis used to determined the duration of the acute phase of the
compensation response. Clearly these results point to the importance of
controling the physiologic state, e.g., stressed vs non-stressed, active
vs non-active, in studies where blood volume is an important parameter.
Survivorship among surgically modified animals averaged 2 days
post surgery. This is consistent with the results of Foglia (1939). It
was mentioned above that application of current from the cautery
electrode caused cessation of the heart beat. The 3 individuals,
previously described, that exhibited anomolous post-hemorrhage blood
volume profiles also differred from the others with respect to
surviorship.
Despite the concerns of Conklin (1930) that the surgery was
traumatic for the animal, no adverse behavioral effect were apparrent.
Experience from this study would suggest that no reasonable effort
should be spared to assure the efficacy of the surgery. In the case of
the compensaton reported by the Middler group for lymph heart destroyed
animals the possibility that the surgeries weren't successful must be
considered. Unfortunately the authors didn't provide any information in
this regard.

48
In response to acute hypovolemic stress of approximately 20% -
25%, intact animals examined here were able to compensate at a rate of
about 0.25 ml/min to achieve full recovery in less than 20 min. This
response was accomplished by redistribution of extracellular fluid.
Cauterization ot the lymph hearts blocks this response. No compensation
occurred in animals with thoroghly destroyed lymph hearts, suggesting
the absence of a transcapillary mechanism for lymph return.

49
REFERENCES CITED
Bashir, A. (1967) Studies on the Blood Volume and Extracellular Fluid Circulation in the Bullfrog Rana Catesbiena. Unpubl. PhD Dissertation. Tulane University.
Carter, D. B. (1979) Structure and Function of the Subcutaneous Lymph Sacs in the Anura (Amphibia). Journal of Herpetology. 13, 321-327.
Conklin R. (1930) The Formation and Circulation of Lymph in the Frog. American Journal of Physiology. 95, 79-90.
Draper, N. & Smith, H. (1981) Applied Regression Analysis. New York: John Wiley & Sons.
Foglia V. G. (1939) Papel Vital de las Corazones Linfaticos del Sapo. Rev. Soc. Argent. Biol. 15, 97-107.
Foglia V. G. (1941) Cause of Death of Toads after Destruction of Their Lymph Hearts. Proc. Soc. of Exp. Biol •• 46, 598-601.
Foglia, V. G. & Braun-Menendez E. (1941) Activity of Toad Lymph Hearts. _ Proc. Soc. Exp. Biol •• 47, 57-59.
Guyton, A. C. (1984) Textbook of Medical Physiology. Phil idelphia: W. B. Saunders.
Hillman, s. S. (1980) Physiologic Correlates of Differential Dehydration Tolerance in Anuran Amphibians. Copeia. 1, 125-129.
Ito, T. (1926) Uber der Flussigkeitsaustausch zwisschen Lymphe und Blut bein Frosch. Pflugger's Archives. 213, 748-756.
Kampmeier, O. (1959) On the Lymphatic Syaten of Ascaphus; Its Evolutionary Significance. Anatomical Record. 132, 343-357.

Lawson H. (1962) The Volume of Blood - a Critical Examination ot Methods for its Measurement. In Handbook of Physiology, sect. 2: Circulation, vol. 1 (ed. W. F. Hamilton & P. Dow), pp. 23-49.
Lillywhite H. B. & Smith L. H. (1981) Haemodynamic Responses to Hemorrhage in the snake Elaphe obsoleta. J. Exp. Biol •• 94, 275-283.
Lillywhite. B. & Smits A. W. (1984) Lability of Blood Volume and its Relation to activity and Hypertension. J. Exp. Biol •• 110, 267-274.
50
Middler S. A. , Kleeman C. R. & Edwards E. (1968) Lymph Mobilization Following Acute Blood Loss in the Toad Bufo marinus. Comp. Biochem. Physiol •• 24, 343-353.
Nie, N., Hull, C., Jenkins, J., Steinbrenner, K. & Bent~dD. (1975) Statistical Package for the Social Sciences. 2 Ed. New York: McGraw Hill.
Prosser C. L. & Weinstein S. J. F. (1950) Comparison of Blood Volume in Animals with Open and with Closed Circulatory Systems. Physiol. Zool •• 23, 113-124
Shoemaker, V (1964) Physiological Effects of Water Deprivation in a Toad Bufo marinus. Unpubl. PhD. Disertation. University of Michigan.
Smits A. W. & Lillywhite H.B. (1985) Maintainance of Blood Volume in Snakes: Transcapillary Shifts of Extracellular Fluids During Acute Hemorrhage. J. Comp. Physiol. B. 155, 305-310.
Thorson T. B. (1955) The Relationship of Water Economy to Terrestrialism in Amphibians. Ecology. 36, 100-116.
Thorson T. B. (1964) Partioning of Body Water in Amphibia. Phyiol. Zool •• 34, 359-399.
Zar (1984) Biostatistical Analysis. Englewood Cliffs Prentice Hall.

51
Zwemer, R. L. & Foglia, V. G. (1943) Fatal loss of plasma volume after lr.ph heart destruction in toads. Proc. Soc. Exp. Biol. Med. 5 , 14-17.
Zygmunt, A. C. (1984) Effects of Dehydration on Hemoglobin Affinity and Blood Cell Volume in Two Anurans. Unpubl. M. s. Thesis. Portland State University.