the cornell digital reading room ergonomics
TRANSCRIPT

THE CORNELL DIGITAL READING ROOM ERGONOMICS CHECKLIST:
DEVELOPMENT AND EVALUATION
A Thesis
Presented to the Faculty of the Graduate School
of Cornell University
In Partial Fulfillment of the Requirements for the Degree of
Master of Science
by
Hrönn Brynjarsdóttir
January 2007

© 2007 Hrönn Brynjarsdóttir
iii
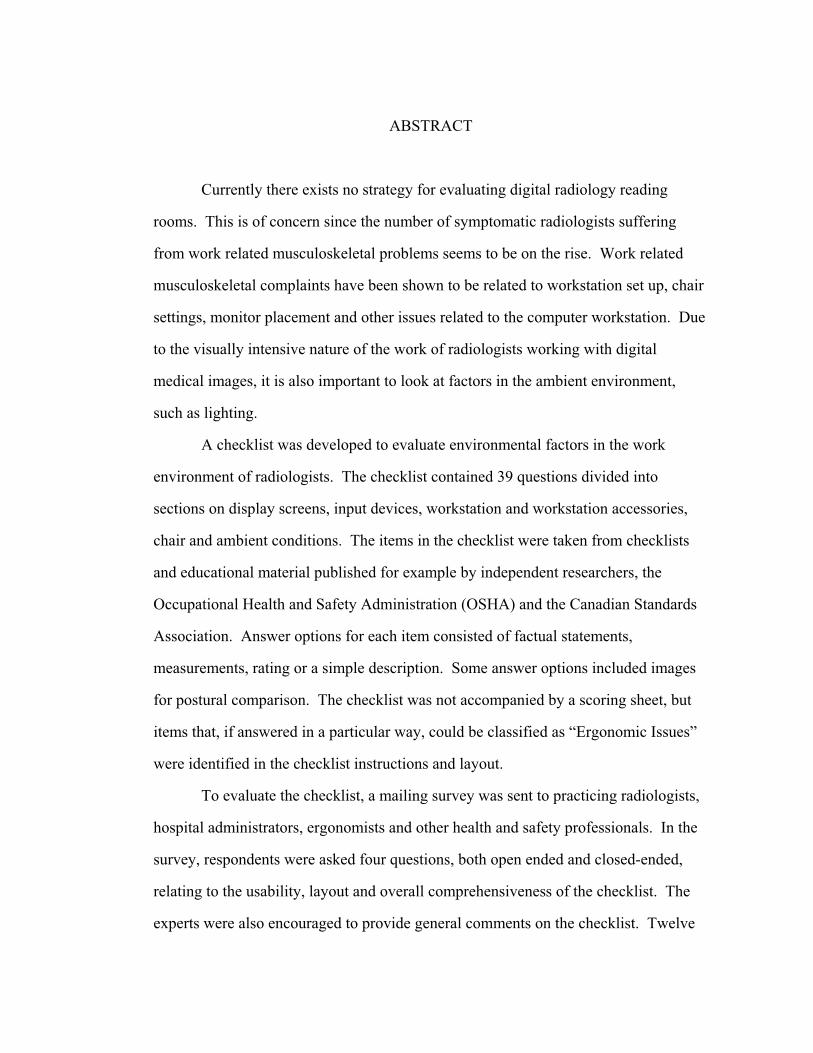
ABSTRACT
Currently there exists no strategy for evaluating digital radiology reading
rooms. This is of concern since the number of symptomatic radiologists suffering
from work related musculoskeletal problems seems to be on the rise. Work related
musculoskeletal complaints have been shown to be related to workstation set up, chair
settings, monitor placement and other issues related to the computer workstation. Due
to the visually intensive nature of the work of radiologists working with digital
medical images, it is also important to look at factors in the ambient environment,
such as lighting.
A checklist was developed to evaluate environmental factors in the work
environment of radiologists. The checklist contained 39 questions divided into
sections on display screens, input devices, workstation and workstation accessories,
chair and ambient conditions. The items in the checklist were taken from checklists
and educational material published for example by independent researchers, the
Occupational Health and Safety Administration (OSHA) and the Canadian Standards
Association. Answer options for each item consisted of factual statements,
measurements, rating or a simple description. Some answer options included images
for postural comparison. The checklist was not accompanied by a scoring sheet, but
items that, if answered in a particular way, could be classified as “Ergonomic Issues”
were identified in the checklist instructions and layout.
To evaluate the checklist, a mailing survey was sent to practicing radiologists,
hospital administrators, ergonomists and other health and safety professionals. In the
survey, respondents were asked four questions, both open ended and closed-ended,
relating to the usability, layout and overall comprehensiveness of the checklist. The
experts were also encouraged to provide general comments on the checklist. Twelve
iv
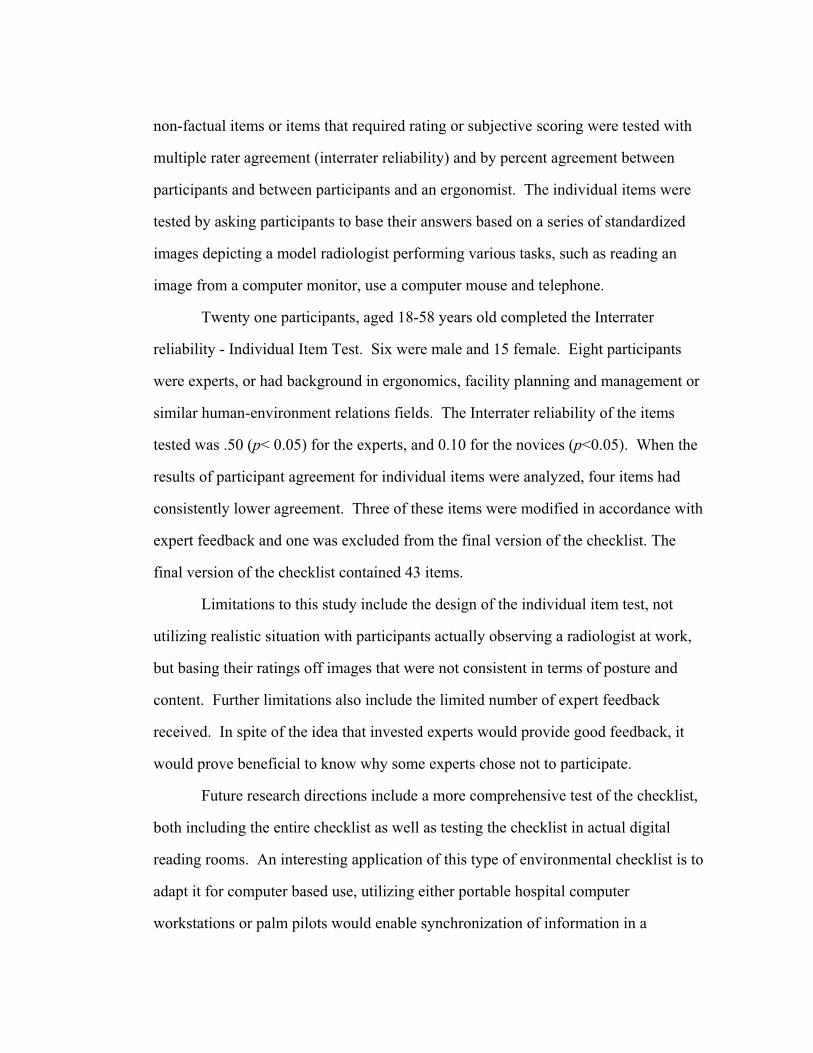
non-factual items or items that required rating or subjective scoring were tested with
multiple rater agreement (interrater reliability) and by percent agreement between
participants and between participants and an ergonomist. The individual items were
tested by asking participants to base their answers based on a series of standardized
images depicting a model radiologist performing various tasks, such as reading an
image from a computer monitor, use a computer mouse and telephone.
Twenty one participants, aged 18-58 years old completed the Interrater
reliability - Individual Item Test. Six were male and 15 female. Eight participants
were experts, or had background in ergonomics, facility planning and management or
similar human-environment relations fields. The Interrater reliability of the items
tested was .50 (p< 0.05) for the experts, and 0.10 for the novices (p<0.05). When the
results of participant agreement for individual items were analyzed, four items had
consistently lower agreement. Three of these items were modified in accordance with
expert feedback and one was excluded from the final version of the checklist. The
final version of the checklist contained 43 items.
Limitations to this study include the design of the individual item test, not
utilizing realistic situation with participants actually observing a radiologist at work,
but basing their ratings off images that were not consistent in terms of posture and
content. Further limitations also include the limited number of expert feedback
received. In spite of the idea that invested experts would provide good feedback, it
would prove beneficial to know why some experts chose not to participate.
Future research directions include a more comprehensive test of the checklist,
both including the entire checklist as well as testing the checklist in actual digital
reading rooms. An interesting application of this type of environmental checklist is to
adapt it for computer based use, utilizing either portable hospital computer
workstations or palm pilots would enable synchronization of information in a

iii
centralized facility database as well as instant access to results and possibly feedback.
It would be very interesting to see an interactive version of this checklist developed
and tested in the future. This is particularly relevant with hospital environments
becoming increasingly a digital workplace.
iii
BIOGRAPHICAL SKETCH
Hrönn Brynjarsdóttir grew up in Reykjavík, Iceland. After getting a
Bachelor’s degree in Psychology from the University of Iceland in 1999, she decided
to take a break from academic pursuits. It was not until she happened to take an
introductory class in Human Factors Engineering with Prof. Alan Hedge in the fall of
2002 that she realized that there actually existed a profession dedicated to some of
Hrönn’s favorite ideas and observations. Observing the interaction between people,
machines and systems in general has been a favorite pastime of Hrönn from the early
days of sorting her mother’s button collection by color, size, shape and texture. This
master's thesis is the culmination of Hrönn's work at the Department of Design and
Environmental Analysis, from which she graduated in October of 2006. Hrönn
currently works as a Human Computer Interaction research specialist with the
Information Science department at Cornell. Her favorite color is red.
iv
ACKNOWLEDGMENTS
I would like to thank the College of Human Ecology Grace C. Dimelow
Fellowship Fund for the generous support of this work.
I am indebted to Valerie Beecher at Syracuse University Hospital and Lisa
Lang at Fingerlakes Health for their input and feedback during the early development
stage of the Cornell Digital Reading Room Ergonomics Checklist.
I gratefully acknowledge the posture models: Maya Haridasan, Erin Lawler
and Anton Villacorta. Thank you all for taking the time out of your busy graduate
work schedules to play “fashion model photo shoot” with me.
Ms. Simona Despa’s suggestions and help with the statistical approach in the
analysis of the results were indispensable.
I am grateful to my committee. I consider myself very fortunate to have had
the opportunity to receive guidance and mentoring from each and every one of my
committee members. Profs. Alan Hedge, Geri Gay and Nancy Wells, I thank you.
I would not have had the courage to go back to school had it not been for the
continued support of my mother and my all time bestest and favoritest fans, the
Thunders and the Lightings.
The lovely Miss Carrie Chalmers and my amazing best friend, Andrew Nef
Dolgert lavished me with love and endless support during the home stretch. I’m there.
Thank you.
v
TABLE OF CONTENTS
BIOGRAPHICAL SKETCH.........................................................................................iii
ACKNOWLEDGMENTS............................................................................................. iv
LIST OF FIGURES......................................................................................................vii
LIST OF TABLES ......................................................................................................viii
CHAPTER 1 – INTRODUCTION.................................................................................1
CHAPTER 2 - THE WORK ENVIRONMENT OF RADIOLOGISTS ........................5 A brief history of digital radiology technology..........................................................5 Problems related to the new technology.....................................................................6 Radiology reading room redesign efforts ...................................................................9
CHAPTER 3 - ELEMENTS IN THE DIGITAL RADIOLOGY WORK
ENVIRONMENT.........................................................................................................14 Display Screens ........................................................................................................14 Workstation ..............................................................................................................19 Chair .........................................................................................................................22Input devices.............................................................................................................26 The Ambient Environment .......................................................................................29
Thermal Conditions ..............................................................................................29 Lighting.................................................................................................................30 Noise .....................................................................................................................35
CHAPTER 4 - EVALUATION TOOLS IN ERGONOMICS.....................................37 Rationale for Posture Based Observational Tools....................................................37 Existing Tools...........................................................................................................38 Comparison of observation based methods..............................................................40 Successful use and design of checklists – Implications for digital radiology ..........41
CHAPTER 5 - METHODS ..........................................................................................44 Checklist Development ............................................................................................44 Pilot Feedback ..........................................................................................................50 Interrater reliability - Individual Item test ................................................................50 Expert Feedback .......................................................................................................53 Validity .....................................................................................................................54
Face validity .........................................................................................................54 Concurrent validity - Predictive validity ..............................................................54 Convergent Validity – Divergent Validity ............................................................55
vi
CHAPTER 6 - RESULTS ............................................................................................56 Individual item test - Interrater Reliability -.............................................................56
Participants ..........................................................................................................56 Individual Item test ...............................................................................................56 Interrater reliability..............................................................................................61
Expert feedback ........................................................................................................62 Expert feedback – Questionnaire .........................................................................63 Expert feedback – Comments ...............................................................................63 Summary of changes to the CDRREC ..................................................................69
CHAPTER 7 - DISCUSSION......................................................................................72 Checklist development results and previous research ..............................................72 Limitations of the present study and future directions .............................................75 Conclusion................................................................................................................79
APPENDIX A ..............................................................................................................81
APPENDIX B...............................................................................................................83
APPENDIX C...............................................................................................................91
APPENDIX D ..............................................................................................................93
APPENDIX E...............................................................................................................94
APPENDIX F .............................................................................................................106
APPENDIX G ............................................................................................................108
References ..................................................................................................................116
vii
LIST OF FIGURES
Figure 1. Digital radiology reading room individual workstation...............................10
Figure 3. CSA and HFES (2002) guidelines for seated work surface dimensions and
clearance for feet, thighs and legs. ...............................................................................21
Figure 4. Sections of the CDRREC. The number of items in each section is
represented below the section name. ............................................................................46
Figure 5. An image created for the CDRREC, before post-processing.......................47
Figure 6. Same image as in Figure 4, after post-processing........................................48
Figure 7. Diagram used as an answer option for question 4. ......................................49
Figure 8. A sample image used for the individual item test ........................................51
Figure 9. Comparison of ergonomists’ and participant glare ratings ..........................58
viii
LIST OF TABLES
Table 1. Basic features, dimensions and ranges recommended for office chairs........24
Table 2. Lighting uniformity recommendations by IRC and IESNA .........................34
Table 3. Contrast values for Question 5 in the CDRREC ...........................................49
Table 4. Items used for individual item test of the CDRREC. ....................................52
Table 5. Percentage agreement between participants (P-P) and between participants
and ergonomist (P-E)....................................................................................................57
Table 6. Number of participant contrast ratings by character luminance....................59
Table 7. Multiple rater agreement for the individual item test, when problematic are
excluded........................................................................................................................62
Table 8. Results from expert feedback questionnaire. .................................................63
Table 9. Expert feedback for the CDRREC: Improvements or changes to current
items .............................................................................................................................64
Table 10. Expert feedback for the CDRREC: Recommendations for new items. .....66
Table 11. Expert feedback for the CDRREC: Questions, general comments and
information. ..................................................................................................................67
Table 12. Number of expert feedback comments by sections in the CDRREC..........68
1
CHAPTER 1 – INTRODUCTION
With the introduction of digital medical imaging technology there have been
many changes both to the work and to the work environment of the radiologist. One
of the more commonly mentioned changes this transition brings is the improvement in
workflow (Reiner and Siegel, 2002). The time it now takes for a simple x-ray to be
processed could potentially be as short as it takes for the computer or network to save
and file the image and for the radiologist to download and view or read that image.
With software support like “Picture Archiving and Communication Systems” (PACS),
radiologists can even attach diagnostic comments directly to the medical image file,
eliminating the time spent arranging meetings or one–on–one consulting with other
radiologists or clinicians (Siegel and Reiner, 2002; See also Reiner, Siegel, Hooper
and Glasser, 1998). Other benefits from this technology include lower radiation doses
and fewer exposures needed due to technical errors (Lee, Siegel, Templeton, Dwyer,
Murphey, Wetzel, 1991).
These changes and improvements in the work of radiologists have, however,
brought about problems. In general, these concerns have to do with the reading room
environment such as the layout of the reading room, the design of the workstation,
lighting, acoustics and air quality (Fratt, 2005; Harisinghani, Blake, Saksena, Hahn,
Gervais, Zalis, Fernandes and Mueller, 2004; Siegel and Reiner, 2002). More
specifically, however, researchers are finding a direct relationship between these
working conditions and physical complaints from radiologists. Ruess, O’Connor,
Cho, Hussain, Howard, Slaughter and Hedge (2003) found that the incidence rate of
carpal tunnel syndrome in one radiology department was 8.3%, which is roughly a
100% higher than the incidence rates of carpal tunnel syndrome in administrative and
clerical staff reported by Nordstrom et al. (as cited in Ruess et al., 2003). In observing
2
the work environment of these radiologists, Ruess and her colleagues (2003) found
that there were significant deficiencies in all areas of the radiology department. All of
the workstations were standard size, configured for right handed use only. There was
limited availability of keyboard or mouse trays in addition to limited availability of
alternative input devices (roller ball mouse). The chairs used were only adjustable in
height and provided limited arm support. An occupational hygienist made a total of
93 recommendations for improvements in the work area of radiologists alone, which is
significant considering that the number of radiologists on staff at this particular
department is just under forty people. Ruess et al. (2003) conclude that this is only an
indication what the situation is like in radiology departments in general.
In spite of the above-mentioned development, little research of these
environmental factors in digital reading rooms has been done, and it seems that the
majority of today’s digital reading rooms are poorly designed for the required tasks
(Horii, Horii, Mun, Benson, & Zeman, 2003). Hospitals with top of the line digital
reading equipment are facing an upsurge in complaints of eye fatigue and strain,
blurred vision, headaches and general musculoskeletal issues from radiologists on staff
(Kolb, 2005; Prabhu, Gandhi and Goddard, 2005). These problems have all been
shown to be related to work with visual display terminals (VDT) in the ergonomic
literature. See for example Carter and Banister (1994) for a review on
musculoskeletal problems related to VDT work. Fagarasanu and Kumar (2003) focus
on carpal tunnel syndrome in relation to keyboard and mouse usage and Grandjean
(1983) discusses the effects of working with VDT in relation to constrained posture
and how this can lead to severe physical problems.
One way to evaluate and prevent work related problems like the ones discussed
above is to use a checklist. Pencil and paper checklists are a well known tool in the
field of ergonomics. Brodie and Wells (1997) describe checklists as the simplest form
3
of observation, where the observer will answer a list of questions with either “yes” or
a “no”. As such, the checklist will have the advantage of being fast, easy to learn, use
and analyze. An example of an ergonomic checklist is the Quick Exposure Check
(QEC), developed by Li and Buckle (1999). The QEC addresses risks for work-
related musculoskeletal disorders by presenting a one page questionnaire with items
pertaining to the back, shoulder/arm, wrist/hand and neck. The observer’s answers are
supplemented with a workers’ assessment as well.
One major disadvantage with simple checklists like the QEC is that the data
collected can potentially be very simple and not as detailed as data collected by more
complex methods. Given the pressures of finance and time limitations in industrial
context, checklists are considered to be a feasible ergonomic tool, providing a quick
estimation or an indication of problems or risk factors in the environment or work
process itself (Dempsey, McGorry, & Maynard, 2005). The design of the Cornell
Digital Reading Room Ergonomics Checklist proposed in the current study deviates
from the simple “yes/no” format by providing answer options in the form of images of
a radiologists’ working posture or requiring the observer to provide measurements of
air velocity, temperature or workstation dimensions. This approach is believed to be a
more thorough evaluation, with the possibility of documentation for follow-up
comparison. As such this instrument will be a feasible possibility for hospital
administrators, looking to improve the work environment of their staff without a major
financial investment.
Dempsey, McGorry and Maynard (2005) surveyed 308 professional
ergonomists and found that 70.5% of the respondents used checklists in their work.
Interestingly, the majority of these professionals used a custom made checklist (by self
or company of employment). This is understandable in the context of differences
4
between companies, work related tasks and the fact that a non-specific checklist might
not be sensitive enough in situations that are highly varied.
The need for checklists, customized or not, becomes more evident in the case
of digital radiology reading rooms, considering that there are currently no standards,
documentation tools or systematic strategies in place that apply to this environment as
a whole.
Objectives
The purpose of the current study was to create and evaluate a concise
ergonomics checklist, custom designed for the work environment of radiologists. The
checklist was evaluated both in terms of expert feedback from radiologists and
practicing ergonomists as well as independent raters. A revised version of the
checklist is presented, as well as ergonomic guidelines for users of the checklist.
5
CHAPTER 2 - THE WORK ENVIRONMENT OF RADIOLOGISTS
This chapter presents a brief description of the history of digital radiology
technology and an overview of some of the ergonomic problems arising due to the
technological changes in the radiological work environment.
A brief history of digital radiology technology
Technology for digital medical imaging has existed since the early seventies,
but it was not until in 1979 that Lemke, Stiehl, Scharnweber and Jackel (as cited in
Horii, 1999a) presented one of the earliest PACS that made the synchronization of
image viewing, sharing and editing possible. Since then, the development of the
digital network for image processing has undergone several evolutionary cycles,
where the main focus remains user interfaces, the system integration with other
information systems and an understanding of the work and tasks performed by
radiologists (Horii, 1999a). According to Hendee, Brown, Stanley, Thrall and Zylak
(1994), the drive for this change in the work for radiologists came from positive
reporting of the technology and the potential for its advances, the desire of the
profession to be on the cutting edge, possibilities for career advancement, financial
benefits and pressure from physicians and patients for radiology to be on the leading
edge with state-of-the-art technology.
Currently the number of radiology facilities that utilize digital imaging
technology is on the rise and the practice of film-based viewing, or “hard copy”
viewing, is consequently being reserved more frequently for archival research and
comparison studies (Lund, Krupinski, Pereles & Mockbee, 1997). The switch from
hard copy to soft copy viewing is considered a revolution in the field of radiology,

6
being labeled a “paradigm shift’ by decision makers and practitioners in radiology
(Andriole, 2003). This revolution took place within the course of only one decade,
and by now new problems related to the organizational context of change and financial
obstacles are a very real issue for the field of radiology.
Bennett, Vaswani, Mendiola and Spigos (2002) describe the process of
digitizing a radiology department and compare the viewing techniques of the
radiologists before and after this change. It is interesting to note their observation of
the tendency of radiologists to approach these two different work processes in the
same way, requiring a multiple monitor set up for viewing one image on each monitor
instead of utilizing an image stacking capability with the digital technology. With
increased exposure and experience to the new technology, Bennett et al. (2002) saw
the work habits changing and conclude that the efficiency of the department is much
better.
The rapid switch and acceptance of the new technology would not have been
possible had it not been for the speed at which technological advancements were being
made to support these new procedural efforts. Horii (2002) points out that the
demands of the work of the radiologists would have quickly ruled out any technology
that was not helpful or caused delays. Further, he states that the impetus to switch
from hard copy to “soft copy” (digital imaging) would have been weak or nonexistent
had the technological follow-through not been available to improve the work.
Problems related to the new technology
The change from hard copy reading to soft copy reading in radiology has
brought about several issues. These are an increase in viewing time spent in front of
the computer monitor, organizational resistance to change, physical complaints and
decreased satisfaction of the work environment.
7
The time spent in front of the computer viewing the computer monitor has
increased dramatically. The time previously required to acquire the images, hang
them on the light boxes in concert with doing the accompanying paperwork could also
be seen as rest time, that is time not spent intensely viewing images for diagnosis and
reporting purposes. Horii (1999b) speculates if this is why Krupinski and Lund (1996,
as cited in Horii, 1999b) found that radiologists were viewing non image areas for a
significant amount of time during each image viewing session in their study. That is,
they were using the non image areas as resting points for their eyes.
Another problem encountered during this transition was of organizational
nature, and is reported in a study by Horii et al. (2000). According to Horii et al.
(2000), the new technology changed work flow processes significantly by delaying the
process of image acquisition to diagnosis by a considerable amount of time. It’s not
unusual to expect problems related with new work procedures however, and
researchers have reported on the successful integration of new work processes (Bryan,
2003; Thrall, 2005). Bramson and Bramson (2004) offer an overview of this problem
and state that even though the financial justification for a new work system can be
easily argued, and that the technology being developed is efficient and advantageous
in many ways, the focus needs to be on the workforce, the employees themselves and
how people react and deal with change.
Other, and more acute problems are eye strain, fatigue, backache, shoulder and
neck pain as well as other musculoskeletal problems that are being reported more
frequently in public literature on digital radiology as well as research literature
(Dakins & Page, 2004; Harisinghani et al., 2004; Ruess et al. 2003). It is very likely
that this problem is underreported, as suggested by Siegel (as cited in Dakins & Page,
2004) since the issue of ergonomic design of digital reading rooms seems to be very
popular in the public literature on digital radiology (see for instance
8
(www.healthimaging.com, www.imagingeconomics.com). However, relatively little
research has been done to address this directly. In fact, the only study published to
date is Ruess et al’s (2003) article in the American Journal of Roentgenology. In their
report, they describe four symptomatic radiologists working for the same radiology
department at a hospital in Hawaii. These radiologists all suffered from carpal tunnel
syndrome or cubital tunnel syndrome, the two most common musculoskeletal
neuropathies that can be traced to computer usage. Ruess et al. also wanted to identify
possible risk factors in the radiology work environment and conclude that given the
shortcomings of the study (a retrospective review of four people), the intensity of the
work of radiologists as well as work habits and environment will increase the risk for
work-related upper extremity musculoskeletal disorders for radiologists.
In 2003, Rumreich and Johnson conducted a radiologist satisfaction survey in
which nearly half of their respondents were either “dissatisfied” or “very dissatisfied”
with the soft copy reading environment. The factors that contributed to overall
dissatisfaction were items such as “workspace ergonomics”, “noise level”, “chairs”,
and “temperature” as well as “room layout”. It is interesting to note that satisfaction
in relation to layout and appropriate lighting were highly correlated to the overall
satisfaction score. Van Ooijen, Koesoema, and Oudkerk (2006) found very similar
results in their study of radiology workspace satisfaction in the Netherlands. One of
their main findings was that workstation functionality parameters such as software
performance, image quality, report generation, et cetera. were rated as far superior to
the workspace ergonomics and comfort. Van Ooijen and his colleagues (2006)
conclude that much more effort needs to be focused on the reading room design as
well as ergonomics.
The findings from the satisfaction studies by Rumreich and Johnson (2003)
and Van Ooijen’s and his colleagues (2006) apply only to the location of the
9
participants in each case, however, the issue of reading room design and how this
affects the performance of the radiologists is evident in the literature (see, for
example: Harisinghani et al., 2004; Horii, et al., 2003; Prabhu et al., 2005).
Radiology reading room redesign efforts
Thus far, the efforts of digital radiology reading room redesign can be
categorized in two ways. The first category relates to the argument of the radiologists’
workstation being very similar to a typical VDT workstation. The digital technology
requires a workstation set up similar to other office type work and so the reading room
is designed as an office space (Harisinghani et al., 2004). In the second category we
see radiology redesign efforts where the only change is that instead of using light
boxes for film viewing, they are now used as ambient light sources (Siegel, & Reiner,
2002). However, neither one of these approaches work completely, as we can see by
the number of health-related complaints and general concern within the field of digital
radiology.
Further, Pomerantz, Protopapas, and Siegel (1999) argue against this kind of
an approach, pointing out that given the added editing possibilities and flexibility of
digital medical imaging, relying on the same design for room layout as for hard copy
reading would result in a very poor utilization of all that PACS has to offer. Thrall
(2005) similarly states that the pressure from hospital management is immense, and
the challenge for radiologists is to live up to high expectations from administration
having “high expectations for both appropriate returns on their investments and the
productive management of the increased institutional resources devoted to radiology”
(p. 790). In other words, it is up to radiologists to prove that the cost of digital
imaging technology is really warranted by increases in productivity and efficiency. It
10
is becoming clearer that this will not be accomplished with a poorly designed work
environment.
But what is really entailed in the work environment of radiologists utilizing
digital imaging technology? Aside from computer monitors, input devices, tables,
chairs and other workstation accessories, Horii (1999b) defines the radiologists’
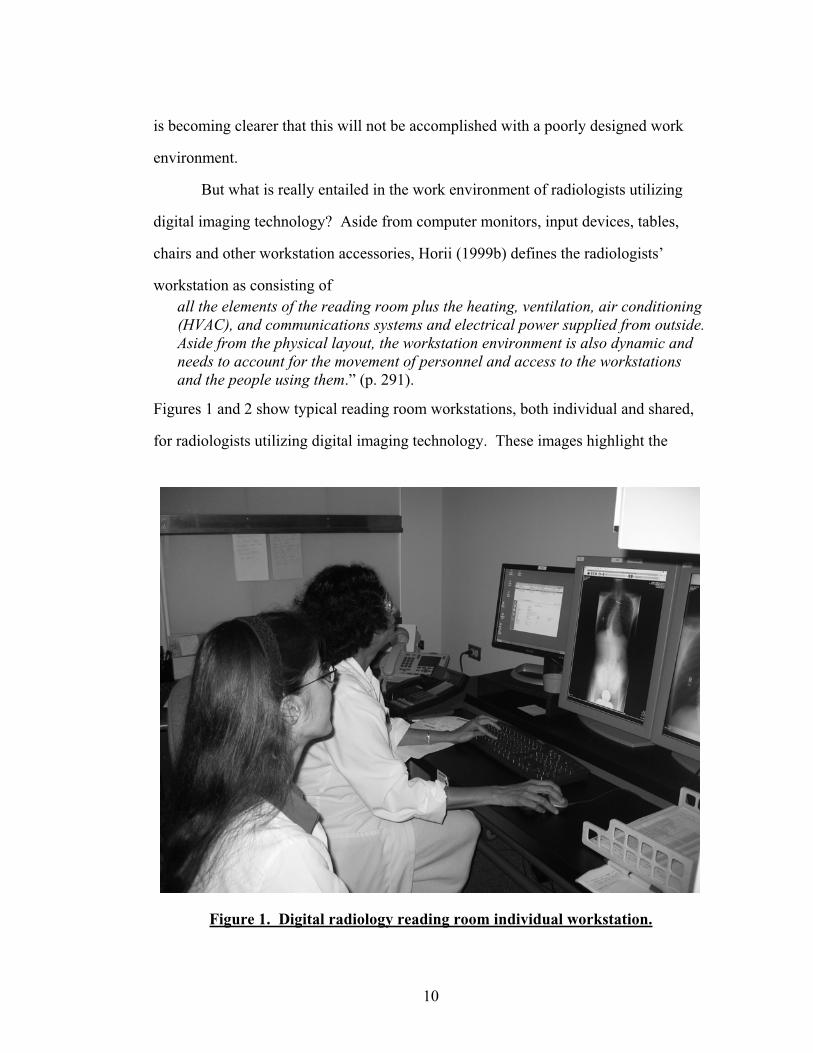
workstation as consisting ofall the elements of the reading room plus the heating, ventilation, air conditioning (HVAC), and communications systems and electrical power supplied from outside.Aside from the physical layout, the workstation environment is also dynamic and needs to account for the movement of personnel and access to the workstations and the people using them.” (p. 291).
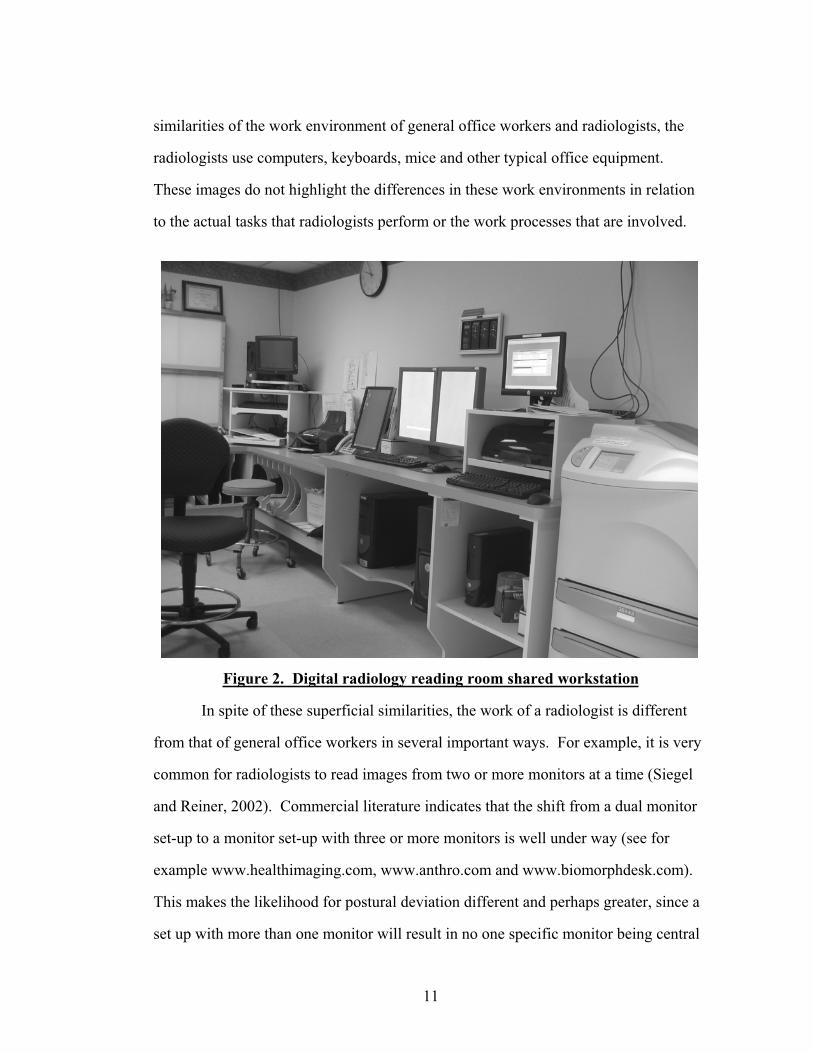
Figures 1 and 2 show typical reading room workstations, both individual and shared,
for radiologists utilizing digital imaging technology. These images highlight the
Figure 1. Digital radiology reading room individual workstation.
11
similarities of the work environment of general office workers and radiologists, the
radiologists use computers, keyboards, mice and other typical office equipment.
These images do not highlight the differences in these work environments in relation
to the actual tasks that radiologists perform or the work processes that are involved.
Figure 2. Digital radiology reading room shared workstation
In spite of these superficial similarities, the work of a radiologist is different
from that of general office workers in several important ways. For example, it is very
common for radiologists to read images from two or more monitors at a time (Siegel
and Reiner, 2002). Commercial literature indicates that the shift from a dual monitor
set-up to a monitor set-up with three or more monitors is well under way (see for
example www.healthimaging.com, www.anthro.com and www.biomorphdesk.com).
This makes the likelihood for postural deviation different and perhaps greater, since a
set up with more than one monitor will result in no one specific monitor being central
12
field of vision. Further research is needed to determine whether this difference is
significant, and if so, harmful.
What also differentiates the work of a general office worker from radiologists’
work is that although radiologists utilize the same workstation set up as regular office
workers, the lighting requirements and considerations are vastly different.
The level of light needed for computer and paper tasks are different than for
intense image viewing. The difference between the luminance of a monitor displaying
an x-ray image versus a text processing document varies in the level of contrast of the
display. The problem is further complicated when the reading room has lighting
design that is optimal for light box reading and not for reading from computer
monitors. Lighting requirements for the digital radiology reading room will be
discussed further in Chapter 3, Elements in the digital radiology work environment.
The radiologists’ work consists almost entirely of intense image viewing with
minimal work done in other computer applications (Prabhu et al, 2005). As reported
in Horii (1992), a radiologist can spend up to four hours reading a single image per
session. There are two important issues here. First, the increased potential for
stationary work posture of the radiologist. Second, the visual intensity of the work is
different and possibly more, since these medical images contain very small but
significant information bits that require high contrast in order to be noticed.
Wang and Langer (1998) give an excellent account of what is involved in the
perceptual processes of viewing medical images, from the initial “quick scan” of the
image to generating the accompanying diagnostic report. They point out that the
performance of the radiologist depends not only on the monitor quality but also on the
quality of the image being viewed and environmental conditions such as background
lighting. A good environment for radiologists would not only ensure efficient reading
and minimize errors, but also minimize fatigue.
13
It can thus be concluded that a moderate to a high stress load accompanies the
work of a radiologist. The pressure to do the work quickly and accurately becomes
tangible when we think about what the repercussions can be from an incorrect reading.
The environmental factors in conjunction with the level of stress can thus amount to a
very unpleasant, if not unhealthy work environment for radiologists. Efforts to
mitigate this level of pressure include an examination of the work processes that take
place within the work environment, a concerned effort from human resources and
employee health. A close look at tangible factors in the work environment itself will
very likely abet the situational effects as well.
The following chapters discuss several important areas in the work
environment of radiologists and how these areas can be examined and adjusted to
support the important work that this profession performs. The chapters on the work
environment of radiologists are followed by a chapter on evaluation tools in
ergonomics and why an observational checklist of the work environment of
radiologists is a feasible approach in the journey to a healthier workplace.
14
CHAPTER 3 - ELEMENTS IN THE DIGITAL RADIOLOGY WORK
ENVIRONMENT
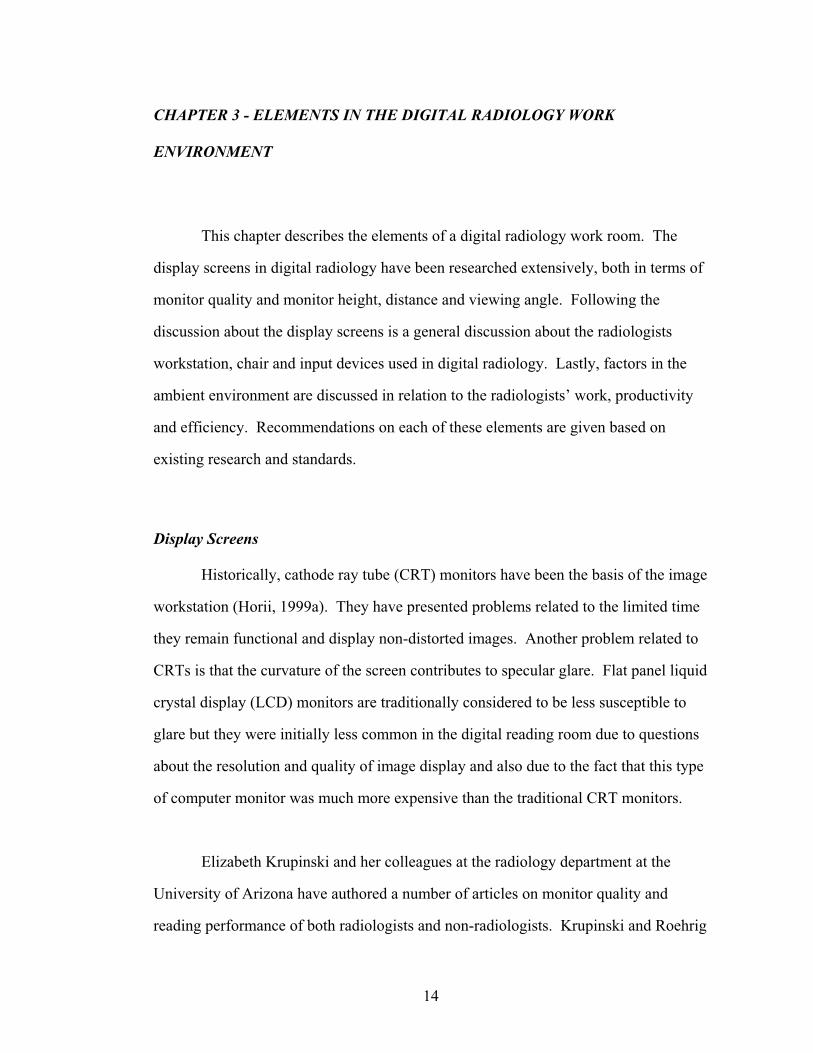
This chapter describes the elements of a digital radiology work room. The
display screens in digital radiology have been researched extensively, both in terms of
monitor quality and monitor height, distance and viewing angle. Following the
discussion about the display screens is a general discussion about the radiologists
workstation, chair and input devices used in digital radiology. Lastly, factors in the
ambient environment are discussed in relation to the radiologists’ work, productivity
and efficiency. Recommendations on each of these elements are given based on
existing research and standards.
Display Screens
Historically, cathode ray tube (CRT) monitors have been the basis of the image
workstation (Horii, 1999a). They have presented problems related to the limited time
they remain functional and display non-distorted images. Another problem related to
CRTs is that the curvature of the screen contributes to specular glare. Flat panel liquid
crystal display (LCD) monitors are traditionally considered to be less susceptible to
glare but they were initially less common in the digital reading room due to questions
about the resolution and quality of image display and also due to the fact that this type
of computer monitor was much more expensive than the traditional CRT monitors.
Elizabeth Krupinski and her colleagues at the radiology department at the
University of Arizona have authored a number of articles on monitor quality and
reading performance of both radiologists and non-radiologists. Krupinski and Roehrig

15
(2002) compared the visual search behavior patterns and task performance of six
participants (radiologists) using a color monitor, a P45 monochrome monitor or a
P104 monochrome monitor. The radiologists were instructed to indicate whether or
not an image contained an abnormality and how confident they were in their decision.
Their eye movements were tracked and recorded with eye tracking equipment that
included a video camera that captured their eye position and software that translated
their relative eye position at any time onto the image being viewed. What Krupinski
and Roehrig (2002) found was that participants made on average significantly fewer
errors when viewing images on the P45 monochrome monitor than the other two
monitors. Use of this monitor also resulted in shortest dwell times for each image on
average, both for true-positive conditions (abnormality present) and false-positive
conditions (abnormality not present). This indicates that the use of a monochrome
monitor is more efficient and likely to produce more accurate readings by radiologists.
In another study, Lund et al. (1997) concluded that there were no statistically
significant differences in the observer performance depending on the viewing method
(CRT monitor versus a traditional light-box). The CRT monitor images did however
receive higher quality ratings and it took observers longer to view images on the
traditional light-boxes.
It appears that the initial debate on the diagnostic accuracy of monitors versus
light boxes has been resolved, but Horii (2002) points out that in order for the
accuracy to be equal or superior for computer monitor reading, environmental factors
such as lighting play a big role and, if improperly designed, can have degrading effects
on reading performance.
Currently the focus has been on determining whether there is a difference in
accuracy reading from CRT monitors versus LCD monitors. In general an LCD flat
monitor is considered to be better in terms of space requirements, weight, energy

16
expenditure and radiation emissions, whereas CRT monitors have a bigger viewing
angle. The bigger viewing angle allows for image viewing by more people at the
same time than the operator sitting directly in front of the monitor (Harisinghani et al.,
2004). Harisinghani et al. (2004) recommend the use of a high brightness, active
matrix LCD monitors for general purposes. This is supported by several studies that
have been conducted by researchers in digital radiology. A recent study by Usami,
Ikeda, Ishigaki, Fukushima, and Shimamoto (2006) indicates that the two types of
display devices are for the most part comparable when looking at observer
performance.
The American Association of Physicists in Medicine (AAPM) published an
extensive report in 2005 giving not only guidelines for the assessment of the monitors
used for medical imaging, but also the illuminance level in the reading room and the
placement of the monitors. Their recommendations on monitor placements are
somewhat vague, though, and there is need for further quality assurance from an
ergonomic standpoint to ensure that the monitors are placed at a height, distance, and
angle that is minimally harmful for the person viewing them.
Monitor Height and Viewing Angle
Babski-Reeves, Stanfield, and Hughes (2005) highlight gaps in the literature
regarding research results and recommendations about optimal monitor height. High
monitor placement is beneficial for viewing angles, neck mobility and lower muscle
load in the shoulder and upper back as well as fewer reports of discomfort (Kumar;
Straker & Mekhora, as cited in Babski-Reeves et al., 2005). Conversely, Babski-
Reeves et al. (2005) report on several studies that indicate that lower monitor
placement results in overall better posture and lower muscle loads in the neck.
Babski-Reeves et al. conclude that this represents a compromise between the visual
17
and the musculoskeletal systems. Due to the nature of functioning for each system, it
is virtually impossible to get one setting of monitor height that will be beneficial for
both. It is thus evident that having a monitor that will adjust in height is essential for
people working intensely with VDTs. Being able to adjust the monitor throughout the
day will ensure non-static posture and prevent discomfort that will eventually lead to
musculoskeletal problems. The monitor height is not only dependent on the actual
monitor settings, though, and the complex relationship between the monitor height, the
chair and desk height settings as well as the task at hand are explored by Babski-
Reeves et al. (2005), Karlquist (1998), Laville (1983) and Lu and Aghazadeh (1998),
among others.
Viewing angle is a complicated parameter that is affected not only by the
height of the monitor but by the type of monitor used as well. The luminance, color
and contrast can change depending on what the angle is. Flat panel displays will in
most cases not be visible from a side angle, whereas the CRT technology will allow
for deviation in the horizontal plane. From an ergonomic standpoint, Ankrum and
Nemeth (1995) state that the “common practice” of placing the top of the monitor at
eye level or lower will be suboptimal for the VDT operator as this could potentially
constrain the neck posture. This is further supported by Fostervold (2003) who
proposed a lower monitor setting that enabled viewing angle of 30-45° below the
horizontal line on the center of the monitor in his review of ergonomic research on
monitor settings. The HFES Computer Workstations Draft Standard for Trial Use
(2002) specifies an optimal viewing angle ranging between ±20° in the horizontal and
vertical planes with respect to the display screen, whereas the Canadian Standards
Association (CSA) Guideline on Office Ergonomics (2000) recommends the range to
be 30° from the horizontal and vertical line of sight (0°).
18
A further consideration is the worker’s visual correction (glasses) and age.
Users of bifocals or trifocal (progressive) corrective lenses benefit from having the
monitor lower than people without corrective lenses, since they view the monitor
through the bottom portion of the lens (CSA, 2000).
Viewing Distance
Carter and Banister (1994) point out that, in essence, the optimal viewing
distance depends on legibility and operator preference. In this sense, flat panel
monitors are preferable, since they have a smaller footprint on the operator desk, are
lighter than the traditional CRT monitors and thus easier to adjust in distance. This
becomes more evident when a workstation is designed for alternating sitting or
standing posture. According to Nylén (2002), an operator at a standing workstation
will tend to lean forward, resulting in a need to move the monitor back for viewing
comfort. In their review of the literature on musculoskeletal problems and VDT work,
Carter and Banister (1994) recommend a range for monitor distance to be from 41-
93cm, or roughly 16-36in. According to the HFDS, the minimum distance should not
be less than 33cm or about 13in (Ahlstrom & Longo, 2003).
Short note about document holders
With an upright document holder, the same parameters for viewing distance
and height apply as with monitor displays. The CSA (2000) recommends that if
needed, a stable and task-appropriate document holder should be placed at the same
height and distance as the computer monitor, preferably right next to the monitor.
This reduces unnecessary head and neck movement as well as eye movements,
including extreme focus adjustments between the monitor and document.

19
Workstation
For most of the recommendations in the literature on workstations, the work is
based on the US Army Anthropometric data reported by Gordon et al (CSA, 2000) and
by military standards developed by the US department of Defense (Ahlstrom &
Longo, 2003). Basic recommendations like reach and clearance can be derived from
these measures, but specifications like optimal monitor placement, keyboard angle and
design and chair specifications are harder to derive from this data, because of the
complex interaction between the posture of the user, workload and other
environmental factors that will either mitigate or worsen the overall effects (Lu &
Aghazadeh, 1998).
The best fit for an individual will be achieved by adjusting the height and angle
of the desk or keyboard tray as well as the chair. Ergonomic standards (HFES, 2002)
and educational literature in ergonomics (Sanders & McCormick, 1993) recommend
that when designing for more than one individual that the anthropometric data used is
the range from the fifth percentile female to the 95th percentile for males. This way,
the majority of the population is accounted for as far as versatility, flexibility and
reach are concerned. It is important to note that the measurements for the
anthropometric data apply for a single dimension only, such as reach or elbow height,
and that when several dimensions are being used, there is potential for error. This
error is not systematic, since people have varying body dimensions that will not be
correlated. One person might have long legs and a short trunk, whereas another
person that is equally tall might have shorter legs and a long trunk. These two people
will require different setups for their workstations. Sanders and McCormick (1993)
cite an example where this type of error excluded 52% of the population, based on
using the 5th and the 95th percentiles in a combination for several dimensions (Bittner,
20
as cited in Sanders & McCormick, 1993). One way to counter a problem such as this
is to design for adjustability.
Sufficient clearance for legs, reach and adjustability are among the necessary
features mentioned by Sanders and McCormick (1993). Other important
considerations are whether or not the workstation will be used by more than one
individual, what the workspace lighting design is, as well as proximity to other
necessary equipment and materials (CSA, 2000). The HFES (2002) stresses that the
adjustability function should be accessible from the relevant posture (seated or
standing) and that it not interfere with the work intended. An example of this is where
the controls on an electronically height adjustable table are located within easy reach
of the operator, yet out of the way to prevent accidental activation. The option of
adjusting the height of the work surface to allow for seated position as well as a
standing position would be beneficial in terms of avoiding a static posture for
prolonged periods in addition to allowing the workstation to be used by more than one
user if needed.
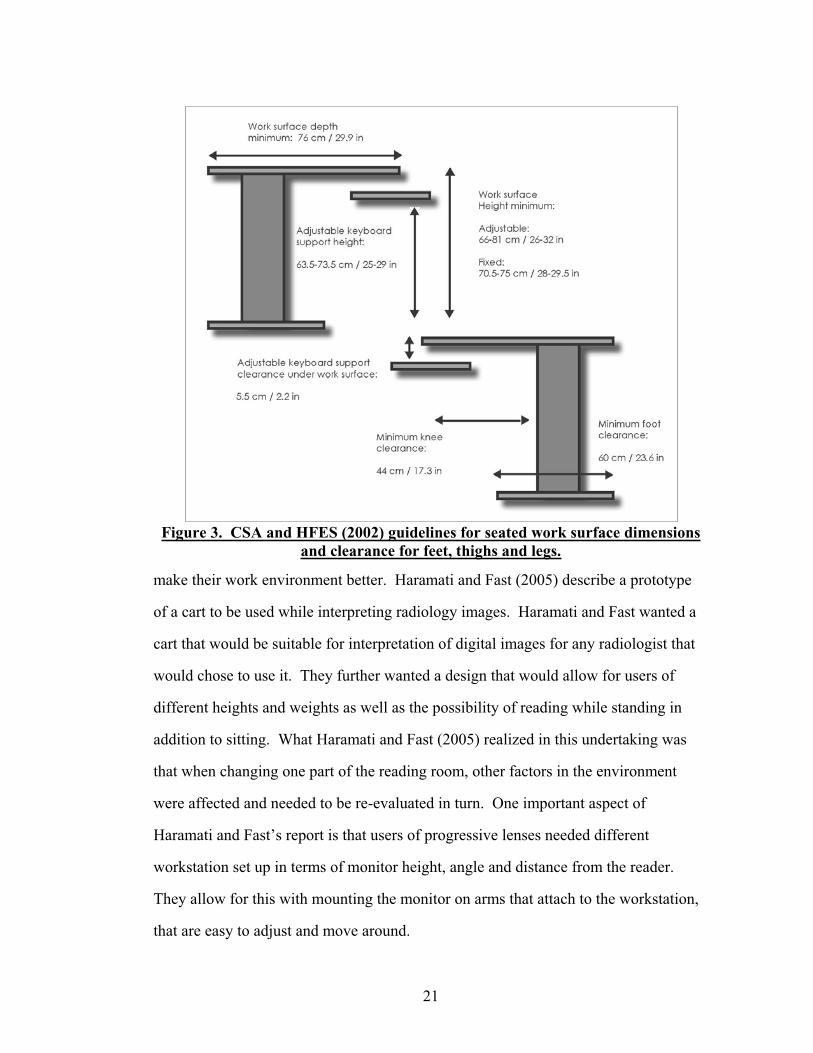
Figure 3 shows some of the CSA (2000) and the HFES (2002) guidelines for
seated work surface dimensions and clearance for feet, thighs and legs with or without
a keyboard tray.
Other specifications for the work surface include sufficient support for the
equipment being used, such as display, keyboard, other input device, a document
holder and other material (CSA, 2000).
Similar to many other areas within the reading room design, minimal attention
has been paid to the design of the work tables or desks of radiologists. In fact, it
appears that radiologists have taken this responsibility upon themselves in order to
21
Figure 3. CSA and HFES (2002) guidelines for seated work surface dimensions and clearance for feet, thighs and legs.
make their work environment better. Haramati and Fast (2005) describe a prototype
of a cart to be used while interpreting radiology images. Haramati and Fast wanted a
cart that would be suitable for interpretation of digital images for any radiologist that
would chose to use it. They further wanted a design that would allow for users of
different heights and weights as well as the possibility of reading while standing in
addition to sitting. What Haramati and Fast (2005) realized in this undertaking was
that when changing one part of the reading room, other factors in the environment
were affected and needed to be re-evaluated in turn. One important aspect of
Haramati and Fast’s report is that users of progressive lenses needed different
workstation set up in terms of monitor height, angle and distance from the reader.
They allow for this with mounting the monitor on arms that attach to the workstation,
that are easy to adjust and move around.
22
Horii (1992) summarized studies showing the amount of work done by
radiologists and what the implications were for the design of their work environment.
The fact that on average, a radiologist can read about 150 patient cases per day (each
containing 3-4 images), interacting with illuminators and other workstation equipment
as well implies that the computer equipment used is very powerful and fast. It is thus
logical to conclude that the design of the supporting work environment, i.e. the work
surface of the computer desk, keyboard tray and other peripherals be available in a
direct and efficient manner to help the radiologist maintain a neutral posture
throughout the day.
Chair
According to Carter and Banister’s review (1994), sitting has been studied
more than any other area in relation to musculoskeletal problems and VDT work. The
overall conclusion is that a major cause of musculoskeletal problems and pain during
VDT usage and other general office work is the fact that most people spend the bulk
of their workday sitting. Technological advances and increased office automation will
further this trend, since office workers now have the option to complete all of their
tasks without having to stand up at all during the workday. Coupled with a chair
design that is not sufficient to support the posture, the potential for musculoskeletal
problems will undoubtedly increase.
When it comes to identifying what constitutes a good chair design, it is
complicated by disagreement among experts on what the optimal seated posture
should be as well as the fact that people don’t necessarily sit the way experts have
traditionally prescribed, with right angles at the hips, knees and ankles (Carter &
Banister, 1994; Gerr, Marcus, Ortiz, White, Jones, Cohen, Gentry, Edwards, Bauer,
23
2000). For instance, Grandjean (1983) found that most VDT operators tended to lean
back in their chairs, extending their legs and neck forward. This puts a tremendous
load on the neck muscles as well as possibly flattening the lumbar lordosis, adding
pressure on the lower back. This is evidenced in the incidence of “daily pains” in the
neck and shoulder areas for VDT workers (Grandjean, 1983) as well as EMG activity
and intervertebral pressure being lower when the backrest is tilted backwards between
90° to 110° (Andersson, as reported in Carter and Banister, 1994).
Ultimately, the ideal seated posture depends on the task and the working
conditions. Upright seating will be problematic in the long run due to the static load
on the spine, especially if the chair does not have a backrest in the lumbar region. The
argument for using a chair without a backrest (also known as a kneeling chair) to
facilitate a forward tilt of the hips and natural curvature of the back can be countered
with the overall cumbersome nature of the design. Carter and Banister (1994) point
out that getting seated and standing up from this type of chairs tends to be difficult,
compression on the knees can cause discomfort and that in general spinal load will be
higher than when the person sits in a chair with a backrest. This is also supported by
Grandjean’s findings from 1983, VDT operators might not prefer this kind of a
posture for work, regardless of whether the preferred posture is better or less harmful.
Leaning backwards in a chair that offers back support will not prove to be more
beneficial either, since the operator will have to crane their neck in order to view the
computer monitor properly.
For the type of work that radiologists perform when viewing digital imaging, it
is safe to assume that a supported upright posture would be most beneficial given the
visual intensity and that there will also be a need for the radiologists to type and other
tasks that will require that input devices and other implements are within easy reach
on the work surface. Leaning backwards will be problematic due to this, as well as the
24
forward tilting posture, since it is more focused on writing and reading from paper
(Dainoff & Mark, as cited in Carter and Banister, 1994).
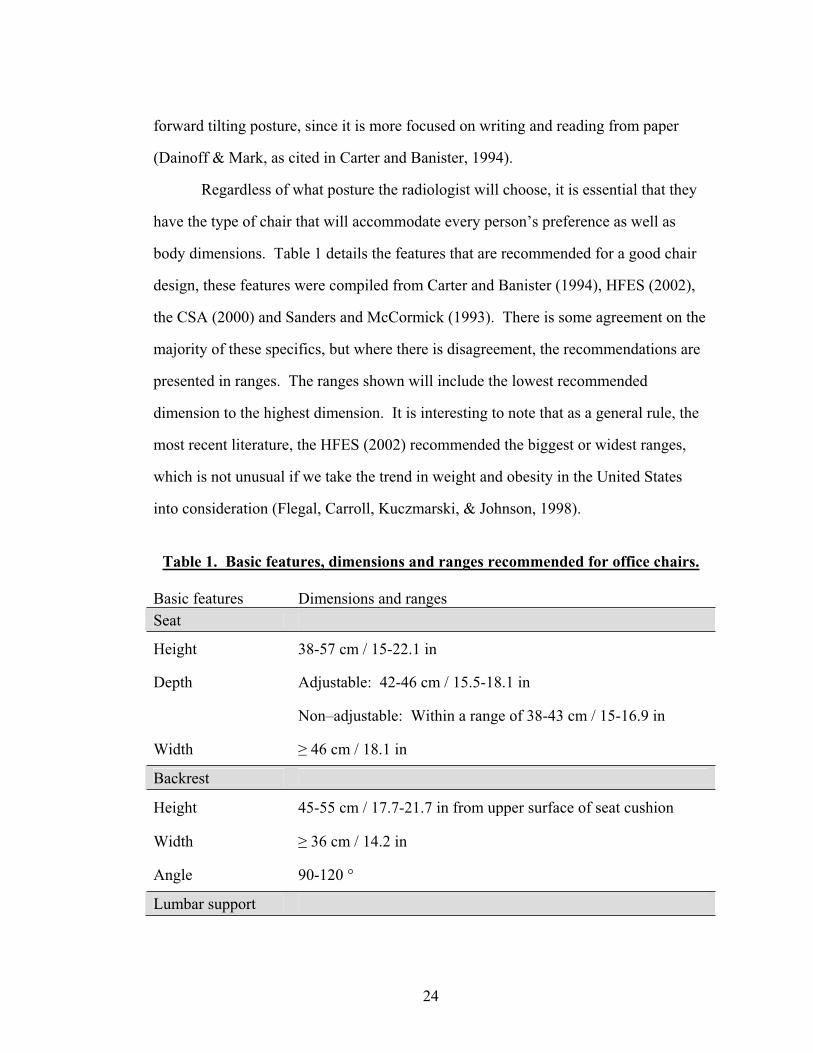
Regardless of what posture the radiologist will choose, it is essential that they
have the type of chair that will accommodate every person’s preference as well as
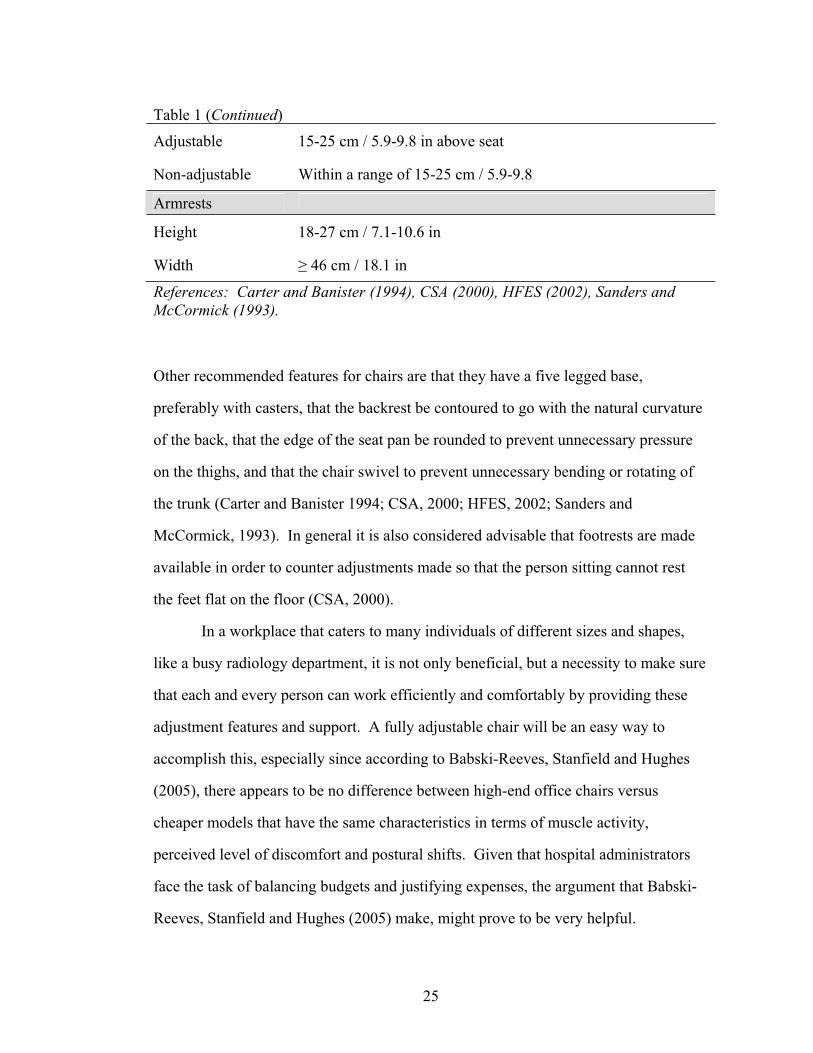
body dimensions. Table 1 details the features that are recommended for a good chair
design, these features were compiled from Carter and Banister (1994), HFES (2002),
the CSA (2000) and Sanders and McCormick (1993). There is some agreement on the
majority of these specifics, but where there is disagreement, the recommendations are
presented in ranges. The ranges shown will include the lowest recommended
dimension to the highest dimension. It is interesting to note that as a general rule, the
most recent literature, the HFES (2002) recommended the biggest or widest ranges,
which is not unusual if we take the trend in weight and obesity in the United States
into consideration (Flegal, Carroll, Kuczmarski, & Johnson, 1998).
Table 1. Basic features, dimensions and ranges recommended for office chairs.
Basic features Dimensions and ranges Seat
Height 38-57 cm / 15-22.1 in
Depth Adjustable: 42-46 cm / 15.5-18.1 in
Non–adjustable: Within a range of 38-43 cm / 15-16.9 in
Width 46 cm / 18.1 in
Backrest
Height 45-55 cm / 17.7-21.7 in from upper surface of seat cushion
Width 36 cm / 14.2 in
Angle 90-120 °
Lumbar support
25
Table 1 (Continued)
Adjustable 15-25 cm / 5.9-9.8 in above seat
Non-adjustable Within a range of 15-25 cm / 5.9-9.8
Armrests
Height 18-27 cm / 7.1-10.6 in
Width 46 cm / 18.1 in
References: Carter and Banister (1994), CSA (2000), HFES (2002), Sanders and McCormick (1993).
Other recommended features for chairs are that they have a five legged base,
preferably with casters, that the backrest be contoured to go with the natural curvature
of the back, that the edge of the seat pan be rounded to prevent unnecessary pressure
on the thighs, and that the chair swivel to prevent unnecessary bending or rotating of
the trunk (Carter and Banister 1994; CSA, 2000; HFES, 2002; Sanders and
McCormick, 1993). In general it is also considered advisable that footrests are made
available in order to counter adjustments made so that the person sitting cannot rest
the feet flat on the floor (CSA, 2000).
In a workplace that caters to many individuals of different sizes and shapes,
like a busy radiology department, it is not only beneficial, but a necessity to make sure
that each and every person can work efficiently and comfortably by providing these
adjustment features and support. A fully adjustable chair will be an easy way to
accomplish this, especially since according to Babski-Reeves, Stanfield and Hughes
(2005), there appears to be no difference between high-end office chairs versus
cheaper models that have the same characteristics in terms of muscle activity,
perceived level of discomfort and postural shifts. Given that hospital administrators
face the task of balancing budgets and justifying expenses, the argument that Babski-
Reeves, Stanfield and Hughes (2005) make, might prove to be very helpful.
26
Input devices
According to Sherbondy, Holmlund, Rubin, Schraedley, Winograd and Napel
(2005) not a lot of work has been done to look at the most efficient ways to navigate
datasets of digital medical images. In fact, their study seems to be the only one
published to date that compares input devices in relation to efficiency and comfort of
the user in digital medical imaging navigation, although Harisinghani et al. (2004)
discuss general issues in keyboard usage in radiology specifically.
Sherbondy and colleagues (2005) compared a pen tablet, trackball, a jog
shuttle wheel and a scroll wheel mouse with artificial and real tasks that were typical
for the work of radiologists. Their participants were five radiologists with three or
more years of experience. Their main finding was that even though a trackball device
is the most commonly used navigation device in medical imaging, it may not be the
most optimal one, especially when navigating large data sets. The input devices that
were favored by the participants were the pen tablet and the jog shuttle wheel. In spite
of some limitations to Sherbondy et al’s study (i.e. sample size, task specificity,
participant’s previous exposure to some input devices and not others) and limited
support by other research in the field, their results give some indication as to what
radiologists might prefer. It is interesting to note that none of the participants
considered the mouse to be useful as a navigation tool, and yet this is the input device
that most commonly is distributed with computer workstations. Sherbondy et al.
(2005) suggest a design of a hybrid input device that will combine velocity control
with a fine position control of the cursor along with haptic feedback similar to that of
the jog-shuttle wheel. They further discuss the implications of using a pen tablet as
opposed to scrolling devices with tasks that require the user to navigate large
longitudinal distances on the monitor. For the pen tablet to be useful in such instances
27
the scrolling function could be located on the pen or pointing device or a function
similar to finger tapping could replace the pen.
According to the 2004 conference proceeding website for the Society for
Computer Applications in Radiology (SCAR), there was another study conducted on
input devices by David Weiss. Weiss compared eight devices, adding a five button
mouse, a joystick controller, a gyroscopic mouse and a “twiddler”, a device that is
strapped onto the controller’s arm and can be programmed with over 1000 functions.
Weiss reports that his participants showed strong preference for simpler input devices
such as the five button mouse, which also offered fine tuned control of the cursor. He
further reported that the five button mouse might have been preferred due to the fact
that it was most familiar to the participants as opposed to the other devices. Weiss’
findings are not surprising if guidelines for general usability are consulted. Fitt’s law
of human performance in relation to time, size of target and distance to target might
help explain these results. However Accot and Zhai (1997) argue that Fitt’s law might
not help explain the performance in tasks that are different than pointing tasks. The
maximum number of functions that can be efficiently controlled by an operator has not
been established with research as of yet (Sanders & McCormick, 1993).
From an ergonomic standpoint, the main concern might not be what input
device is used per se but rather whether or not the input device of choice puts the arm
or hand in a harmful position for an extended time period. The only published study
on the working conditions of radiologists in relation to work related musculoskeletal
disorders by Ruess et al. (2003), looked retrospectively at the work environment of
four symptomatic radiologists. Ruess and her colleagues found that their study
subjects spent on average more time overall at the VDT in comparison to non-
symptomatic radiologists. Further, they had inadequate workstation set up, with
keyboards and computer mice placed either too high, or at an angle that invoked poor
28
posture and increased pressure on the ulnar and median nerves. Ruess et al conclude
that the current technology of digital medical imaging renders radiologists at risk for
work-related, upper extremity musculoskeletal disorders (WRMSD) such as carpal
and cubital tunnel syndromes.
In their study of a small technological company in Israel, Shuval and Donchin
(2005) identified a number of risk factors contributing to the prevalence of WRMSDs
in the company. Women in the company were more predisposed for neck and
shoulder problems, whereas men were more prone to have problems related to the
wrists and hands. Employees that worked more than ten hours a day were at risk, and
in particular, those who spent more than seven hours a day specifically at a VDT.
People with more work experience similarly were more predisposed to WRMD than
less experienced employees. What is important here is that these workers were
working with a dual monitor set-up which relates directly to the working situation for
radiologists. Further, the working hours and the intensity of the VDT work match the
described working habits of radiologist.
In their review of carpal tunnel syndrome in relation to keyboard and mouse
use, Fagarasanu and Kumar (2003) mention that in most applications, mouse usage
accounts for roughly 66%, increasing with drawing applications. Although there are
no studies on this particular topic in radiology, it can be assumed that due to the nature
of the radiologists’ tasks, navigating images, scrolling and zooming with minimal
keyboard use, that this percentage is higher with radiologists than regular office
workers. It is thus safe to conclude that in spite of the scarcity of studies on the work
environment of radiologists that these professionals are at risk for serious work related
musculoskeletal disorders.
29
The Ambient Environment
Thermal Conditions
When the first digital reading room began operating in 1993, it soon became
evident that an important environmental factor had been missed in the planning and
design stages. The thermal output by the equipment associated with the digital
reading technology overloaded the existing air conditioning and ventilation system
and, at times, the temperature in the reading room at the Baltimore VA Hospital
reached 38 degrees Celsius (100F) (Siegel & Reiner, 2002). Some of the
consequences were reduced productivity and increased fatigue among the radiologists,
in addition to expensive equipment being compromised. Siegel and Reiner conclude
that for a proper thermal design of any digital reading room there would need to be
special allowances for the thermal output of the equipment as well as the people, and
that individual temperature controls at each workstation would ensure each reader’s
comfort. Harisinghani et al. come to the same conclusion in their conclusive review of
altered workplace ergonomics in digital radiology reading rooms (2004). More
recently, Prabhu et al. (2005) published a review of their observations of digital
reading rooms in the United Kingdom, confirming the observations of their American
counterparts.
The Human Factors Design Standard specifies the temperature ranges required
for comfort as 21-27°C (70-80°F) for warmer climates or summer and 18-24° (65-
75°F) in a colder climate or winter (Ahlstrom, & Longo, 2003). Since thermal
comfort is influenced by relative humidity, it is important to consider how, as
temperature increases, the relative humidity should decrease to maintain comfortable
and safe environment for work. The HFDS recommends the relative humidity level to
be maintained at 45% at 21°C (70°F) (Ahlstrom, & Longo, 2003). However,
30
according to CSA’s Guideline on Office Ergonomics (2000), the influence of humidity
on sedentary work in moderate temperatures in the range 20-26°C (68-78°F) is slight.
Further, humid environments might be harmful to the technology used in digital
radiology reading rooms as well as the air quality in general. Observations of stuffy
air as well as condensation and mold growth are all direct results of environments that
are too humid (CSA, 2000). Taking the number of factors that contribute to comfort
and safety of the individual in relation to thermal conditions can prove to be
increasingly complicated, and HFDS (Ahlstrom, & Longo, 2003) does recommend
individual control as a general practice. This way, the problem of the relationship
between heat transfer, equipment and human beings becomes manageable and can be
maintained within the range of human tolerance and safety. It is safe to assume that
the recommended practices by the HFDS and CSA will apply to the working
environment of radiologists, even though the study of their environments specifically
has not been conducted. However, further studies in this regard are recommended.
Lighting
Not a lot of research has been done on the optimal digital reading room
lighting environment for radiologists (Horii et al., 2003). Krupinski, Roehrig and
Furukawa (1999) mention that even though the field of digital medical imaging is
expanding, one serious impediment is that optimal display design and performance
factors have yet to be determined. The Illuminating Engineering Society of North
America (IESNA) very recently published An IESNA Recommended Practice:
Lighting for Hospitals and Health Care Facilities (2006). This guidebook does not
specify lighting for digital radiology reading rooms, other than by referring to the
standards for office lighting. As discussed in chapter 2, this recommendation will not
result in a reading environment for radiologists that will be sufficient.
31
Illumination levels
Ishihara et al. (2002) looked at the influence of monitor brightness and room
illuminance on observer performance in two studies. In the first study, 6 participants
viewed images on computer monitors and were asked to diagnose and indicate their
confidence levels for each image. The viewing conditions were two levels of monitor
luminance, 50 and 400 cd/m2 (14.59 and 116.75fL) and three levels of room
illuminance, 20, 120 and 480 lux (1.86; 11.15 and 37.16fc). The participants did
significantly better at 20 lux (1.86fc) than at 480 lux (37.16fc) in both low and high
luminance conditions. For the second study, ten participants viewed images that were
displayed at 50, 200 and 5500 cd/m2 (14.59; 58.37 and 1605.25fL) luminance, with
room illuminance being 20, 120 or 480 lux (1.86; 11.15 and 37.16fc). Here, the worst
performance occurred with room illuminance at 480 lux (37.16fc), regardless of the
luminance conditions. The authors concluded that the optimum room illuminance
levels were at the intermediate level, and that illumination level at 480 lux (37.16fc)
with monitor luminance at 50cd/m2 (14.59fL) should be avoided.
These findings were supported by the study done by Goo, Choi, Im, Lee,
Chung, Han, Park, Kim and Nam (2004). Like Ishihara et al (2002), Goo and his
colleagues looked at the effect of ambient light and monitor luminance on
performance in reading digital medical images. Participants were asked to review
images with three different types of abnormalities (lung nodules, pneumothorax,
interstitial disease) under three different monitor conditions, luminance set at 25, 50
and 100 fL (85.66; 171.31 and 342.63cd/m2) and three different ambient lighting
conditions with illuminance set at 0 lux, 50 lux, and 460 lux (0; 4.65 and 42.74 fc).
These researchers found that monitor luminance did not have a statistically significant
effect on performance for detecting any of the abnormalities. The ambient light level
did affect the participants’ performance in detecting nodules. The higher the light

32
level the worse the performance becomes. Whether these results apply to other digital
imaging needs to be determined, but the American Association of Physicists in
Medicine (AAPM) recommends the illumination levels at diagnostic reading stations
be as low as 2-10 lux (0.19 – 0.93fc) (AAPM, 2005).
Charles et al. (2004) state that looking at the illumination level only tells half
the story. Considerations about the task at hand and other factors in the surrounding
environment need to be addressed as well. They further state that “Any single
illuminance value is likely to satisfy only half of the occupants” (Charles et al., 2004,
p. 40). Findings from individual research (Aarås et al., 2002 ; Charles, Danforth et al,
2004) as well as standards (Ahlstrom and Longo, 2003; Human Factors and
Ergonomics Society, 2002) define the optimum range of illumination levels for office
work with visual display units as ranging from 200 lux to 755 lux (18.58-7014fc).
The Illuminating Engineering Society of North America (IESNA) however
recommends that the ambient illuminance throughout the office space should not
exceed 500 lux (46.45fc) (2000). The lower the illuminance is, the better, according
to IESNA’s Lighting handbook: Reference and Application (2000), since the low
illuminance level will reduce reflections or glare on the computer monitors, only
affecting the screen contrast minimally.
Individual control
In order for any recommended range of illuminance to be beneficial,
researchers agree that adjustability and individual control is important (Harisinghani et
al, 2004; Hedge, 2000; Prabhu et al., 2005). Further research support for individual
lighting control and office work can be found in the publication Workstation Design
for Organizational Productivity from the National Research Council and Institute for
Research in Construction, Canada (Charles et al, 2004).
33
Glare
The minimization of glare is another important recommendation for optimal
lighting conditions that is well supported by research. As an example, Lu and
Aghazadeh (1998) found that ocular discomfort related to glare is a significant
variable in their model of risk factors in VDT workstation systems. The
recommendations for reducing or minimizing glare can roughly be categorized in three
ways. First, minimization of glare can be accomplished with layout or space related
changes, such as facing the visual display unit away from the source of the glare or
using window coverings (Harisinghani et al., 2004). Second, common changes or
applications related to the monitor itself, such as applying a glare filter or tilting the
unit have been known to minimize glare (Sanders and McCormick, 1993). Third, a
change in lighting conditions can help with this issue and the combination of direct
and indirect lighting is commonly recommended in research and other scholarly
publications (for example, see: Aarås et al., 2002; Horii, 1992; Prabhu et al., 2005).
The IESNA (2000) recommends that the maximum luminance in a workplace with
VDTs should not be more than 850cd/m2.
Lighting Uniformity
One of the arguments for recommending the lighting environment to be
uniform or having low contrast ratio stems from the notion of the transient adaptation
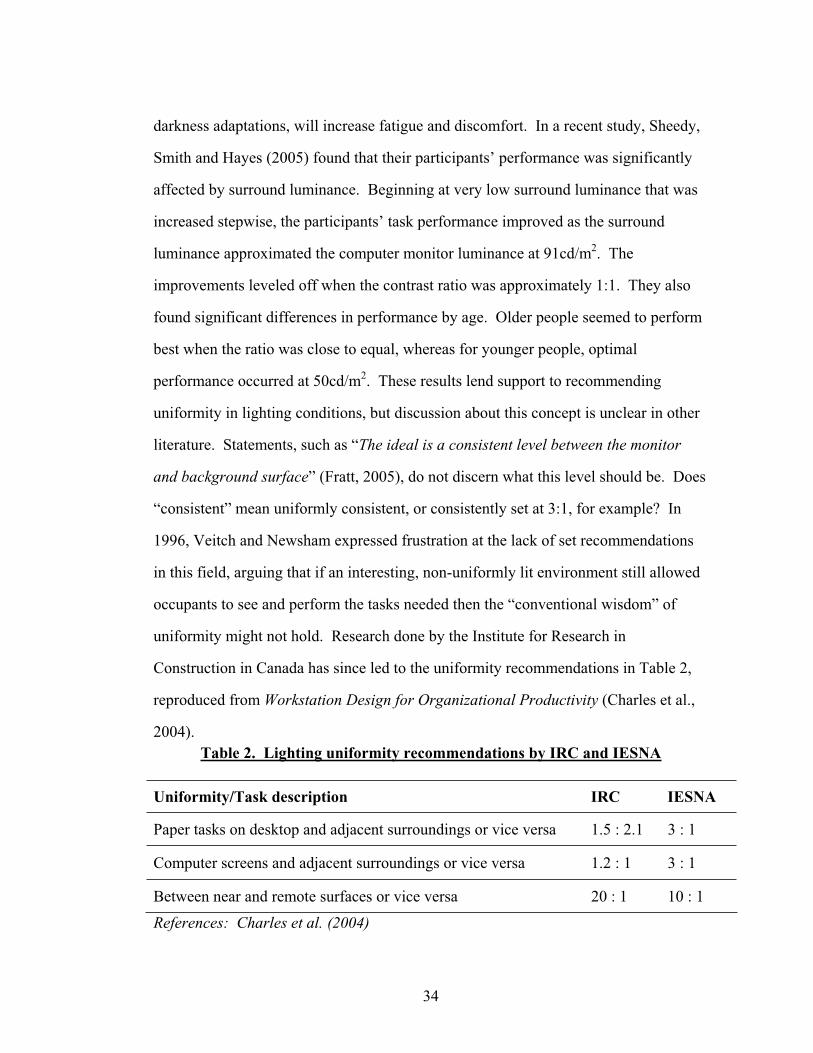
of the eyes. An example of this is what happens when one goes from a well lit area
into a dark room or vice versa. The analogy Sanders and McCormick give is going
into a dark movie theater (1993). As the color receptors (cones) and the black/white
receptors (rods) adapt to the change in light levels, a temporary blindness sets in. This
phenomenon is called the Purkinje Shift (Sanders and McCormick, 1993). Charles et
al. (2004) claim that frequent adaptations, even if they are not as drastic as a complete
34
darkness adaptations, will increase fatigue and discomfort. In a recent study, Sheedy,
Smith and Hayes (2005) found that their participants’ performance was significantly
affected by surround luminance. Beginning at very low surround luminance that was
increased stepwise, the participants’ task performance improved as the surround
luminance approximated the computer monitor luminance at 91cd/m2. The
improvements leveled off when the contrast ratio was approximately 1:1. They also
found significant differences in performance by age. Older people seemed to perform
best when the ratio was close to equal, whereas for younger people, optimal
performance occurred at 50cd/m2. These results lend support to recommending
uniformity in lighting conditions, but discussion about this concept is unclear in other
literature. Statements, such as “The ideal is a consistent level between the monitor
and background surface” (Fratt, 2005), do not discern what this level should be. Does
“consistent” mean uniformly consistent, or consistently set at 3:1, for example? In
1996, Veitch and Newsham expressed frustration at the lack of set recommendations
in this field, arguing that if an interesting, non-uniformly lit environment still allowed
occupants to see and perform the tasks needed then the “conventional wisdom” of
uniformity might not hold. Research done by the Institute for Research in
Construction in Canada has since led to the uniformity recommendations in Table 2,
reproduced from Workstation Design for Organizational Productivity (Charles et al.,
2004).Table 2. Lighting uniformity recommendations by IRC and IESNA
Uniformity/Task description IRC IESNA
Paper tasks on desktop and adjacent surroundings or vice versa 1.5 : 2.1 3 : 1
Computer screens and adjacent surroundings or vice versa 1.2 : 1 3 : 1
Between near and remote surfaces or vice versa 20 : 1 10 : 1
References: Charles et al. (2004)

35
In this table we also see the recommended uniformity levels by IESNA. Here, as with
illumination recommendations previously stated, we see a range of recommendations
that conflict. In the case of digital radiology and reading performance, it is vital that
the lighting conditions support the work that is to be performed; having conflicting or
non-specific recommendations is discouraging at best.
Noise
The sources for noise at the radiologists’ workstation include the equipment,
ventilation and air conditioning system, other radiologists as well as general traffic if
the reading room is centrally located within the department (Haringsinghani et al.,
2004; Horii, 2002). Phone usage, radiologists dictating or conferencing and hospital
public announcement systems can be further sources of interruption (Siegel & Reiner,
2002). None of these can be classified as harmful according to work safety and health
standards, as pointed out by Horii et al. (2003), but with prolonged exposure or
improper mitigation of this environmental sound the effects can be harmful.
According to the HFDS (Ahlstrom, & Longo, 2003), sound levels for work areas
should not exceed levels that interfere with necessary voice, telephone or radio
communication. Fatigue or injury-invoking noise levels should be avoided as well as
levels that will degrade the overall effectiveness of the work process. In defining what
these levels are, the HFDS give two criteria, the A-weighted sound level (dß (A)) and
the speech interference level (SIL). The SIL is a measure in the effectiveness of noise
in masking. The A-weighted sound level is sound pressure level in decibels measured
using a sound level meter with an A-weighting network. The HFDS further specify
that the dß (A) is the desired measurement (Ahlstrom & Longo, 2003).
The results from Rumreich and Johnson’s (2003) and Ooijen et al.’s (2006)
satisfaction surveys indicate that most radiologists would prefer the noise levels to be
36
controlled to a certain extent, but it is also implicitly understood that for some tasks
that go with digital image reading this will be hard. Harisinghani et al. (2004) looked
at a digital radiology reading room and found that the number of radiologists sitting
next to each other while reading and reporting, the absence of acoustic dampening
materials and location of freestanding reading consoles in high traffic areas all
contributed to a noisy and distracting environment for image reading. In fact, Banbury
and Berry (2005) found that even though defined as low-level sound, background
noise such as people talking and phone ringing, not only affected concentration but
were also ‘bothering’ and ‘greatly disturbing’. What is interesting about these results
is that Banbury and Berry’s study was conducted in a working environment that
closely matches most current radiology reading rooms, that of open office layout,
without specific individual offices but workstations in a shared space. For noise
mitigation, sound absorbing panels, carpeting, as well as removable partitions between
workstations are well known solutions (Sanders & McCormick, 1993).
37
CHAPTER 4 - EVALUATION TOOLS IN ERGONOMICS
This chapter provides a brief overview of current debate in ergonomic
measurement theory, the rationale for posture based observational tools and a
description of successful observational tools as well as limitations to observation
based research and data collection.
In spite of what has been established about musculoskeletal problems and how
certain aspects of posture, force, repetition and time will contribute to these problems,
it is still debated in what particular way these factors work together and what other
factors in addition will moderate or exacerbate the effects (Babski-Reeves, Stanfield &
Hughes, 2005; Lu & Aghazadeh 1998; Wells, Norman, Neumann, Andrews, Frank,
Shannon & Kerr, 1997). According to Spielholz, Silverstein, Morgan, Checkoway
and Kaufman (2001), one reason for this debate is that there is a lack of well-defined
exposure assessment methods within the field of ergonomics. Lowe (2004) further
states that there is a lack of standardization in operationalization and scaling in
exposure assessments as well. As a result, Spielholz and his colleagues (2001)
conclude, the existing data might not be all-conclusive.
Rationale for Posture Based Observational Tools
Most postural based observational tools in ergonomics are centered on the
notion of a “neutral zone” or a neutral posture (Hedge, 2004). This neutral zone is the
posture that will not invoke stress or strain on the muscles sufficient to initiate injury.
The idea is then that when a person is in a posture that will deviate from the neutral
zone, the chance for an injury becomes greater; the greater the deviation, the greater
38
the risk. It can be assumed that some discomfort will accompany the deviation if held
for a prolonged time or repeatedly and thus risk and the severity of a postural
deviation can be measured by looking at the posture and the level of discomfort the
person experiences (Hedge, 2004).
Self reported discomfort is a valuable notion when it comes to the early stages
of muscular injury. As Hedge (2004) points out, the sensation of discomfort is not to
be ignored, and changes in the levels of discomfort can potentially give feedback on
whether an implemented change in work processes or methods has made a difference
for better or worse. However, the concept of self-reported discomfort is problematic
due to the level of error or variability between people and how differences in
interpretation and analysis will influence this measurement option. As a result, more
common risk analyses and evaluation tools will be based on posture as the main focus.
Existing Tools
Li and Buckle (1999) give an overview of the existing techniques used in the
field of ergonomics to evaluate risk factors related to musculoskeletal problems.
Among these, the majority are posture-based observation tools. Up until 1974, any
kind of posture recording was made with drawings or photographs with supplementary
narratives, and it wasn’t until Priel developed the first known systematic observational
tool in 1974 (as reported in Li and Buckle, 1999), including an index of upper and
lower limb positions in relation to three orthogonal planes. This was supported by a
drawing of the posture by the observer. Other similar observational tools followed,
such as the Ovako Working Posture Analysing System (OWAS) developed in Finland
in 1977, assessing the magnitude of postural risk and posture targeting, developed by
Corlett, Madeley and Manenica in 1979 (Li and Buckle, 1999). The Rapid Upper
Limb Assessment (RULA) was developed in 1993 by McAtamney and Corlett, and is
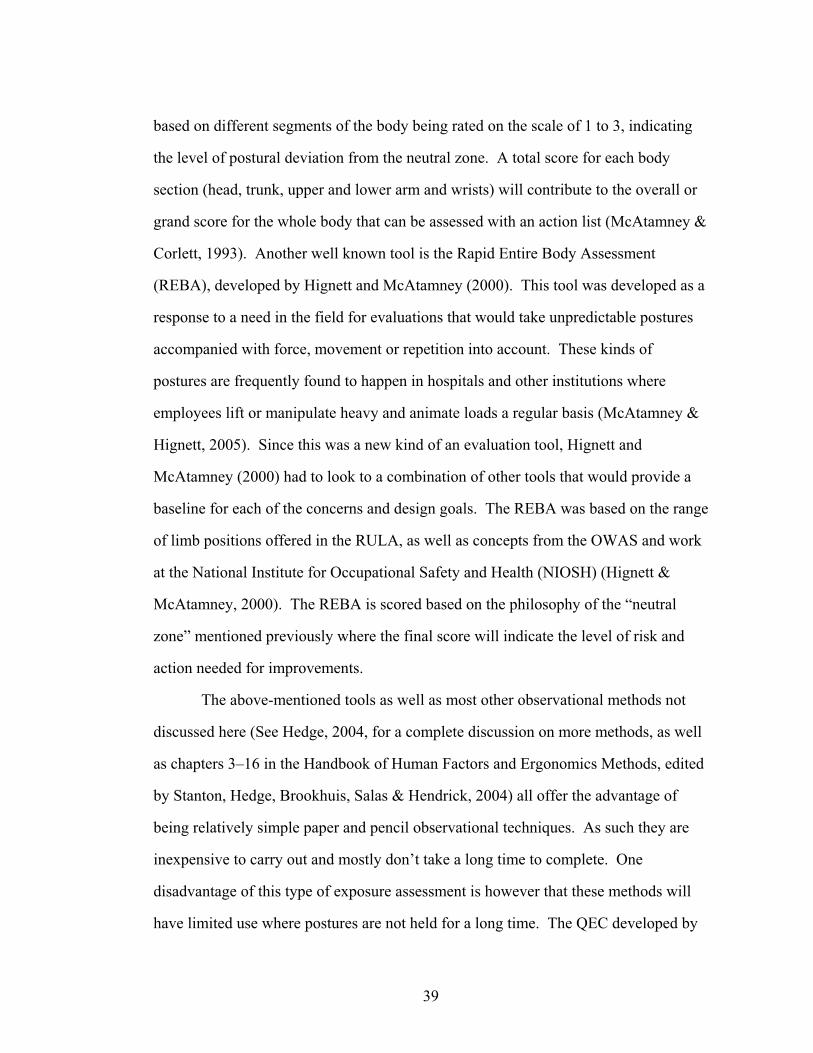
39
based on different segments of the body being rated on the scale of 1 to 3, indicating
the level of postural deviation from the neutral zone. A total score for each body
section (head, trunk, upper and lower arm and wrists) will contribute to the overall or
grand score for the whole body that can be assessed with an action list (McAtamney &
Corlett, 1993). Another well known tool is the Rapid Entire Body Assessment
(REBA), developed by Hignett and McAtamney (2000). This tool was developed as a
response to a need in the field for evaluations that would take unpredictable postures
accompanied with force, movement or repetition into account. These kinds of
postures are frequently found to happen in hospitals and other institutions where
employees lift or manipulate heavy and animate loads a regular basis (McAtamney &
Hignett, 2005). Since this was a new kind of an evaluation tool, Hignett and
McAtamney (2000) had to look to a combination of other tools that would provide a
baseline for each of the concerns and design goals. The REBA was based on the range
of limb positions offered in the RULA, as well as concepts from the OWAS and work
at the National Institute for Occupational Safety and Health (NIOSH) (Hignett &
McAtamney, 2000). The REBA is scored based on the philosophy of the “neutral
zone” mentioned previously where the final score will indicate the level of risk and
action needed for improvements.
The above-mentioned tools as well as most other observational methods not
discussed here (See Hedge, 2004, for a complete discussion on more methods, as well
as chapters 3–16 in the Handbook of Human Factors and Ergonomics Methods, edited
by Stanton, Hedge, Brookhuis, Salas & Hendrick, 2004) all offer the advantage of
being relatively simple paper and pencil observational techniques. As such they are
inexpensive to carry out and mostly don’t take a long time to complete. One
disadvantage of this type of exposure assessment is however that these methods will
have limited use where postures are not held for a long time. The QEC developed by
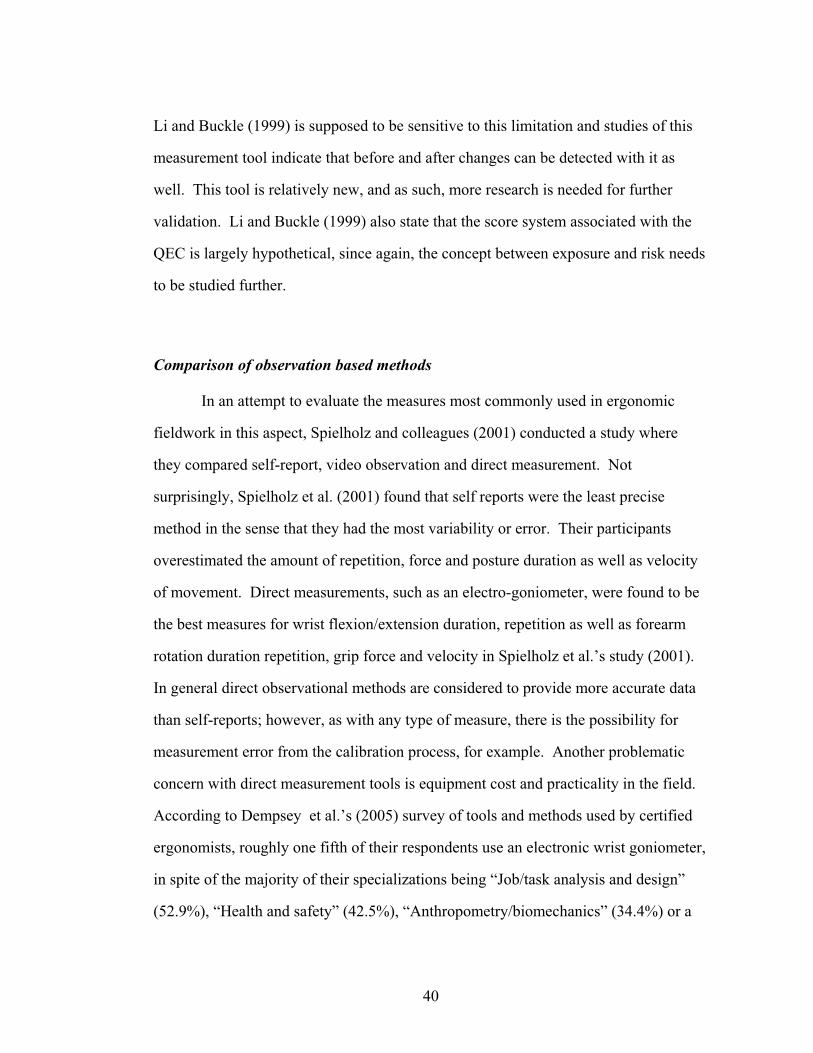
40
Li and Buckle (1999) is supposed to be sensitive to this limitation and studies of this
measurement tool indicate that before and after changes can be detected with it as
well. This tool is relatively new, and as such, more research is needed for further
validation. Li and Buckle (1999) also state that the score system associated with the
QEC is largely hypothetical, since again, the concept between exposure and risk needs
to be studied further.
Comparison of observation based methods
In an attempt to evaluate the measures most commonly used in ergonomic
fieldwork in this aspect, Spielholz and colleagues (2001) conducted a study where
they compared self-report, video observation and direct measurement. Not
surprisingly, Spielholz et al. (2001) found that self reports were the least precise
method in the sense that they had the most variability or error. Their participants
overestimated the amount of repetition, force and posture duration as well as velocity
of movement. Direct measurements, such as an electro-goniometer, were found to be
the best measures for wrist flexion/extension duration, repetition as well as forearm
rotation duration repetition, grip force and velocity in Spielholz et al.’s study (2001).
In general direct observational methods are considered to provide more accurate data
than self-reports; however, as with any type of measure, there is the possibility for
measurement error from the calibration process, for example. Another problematic
concern with direct measurement tools is equipment cost and practicality in the field.
According to Dempsey et al.’s (2005) survey of tools and methods used by certified
ergonomists, roughly one fifth of their respondents use an electronic wrist goniometer,
in spite of the majority of their specializations being “Job/task analysis and design”
(52.9%), “Health and safety” (42.5%), “Anthropometry/biomechanics” (34.4%) or a
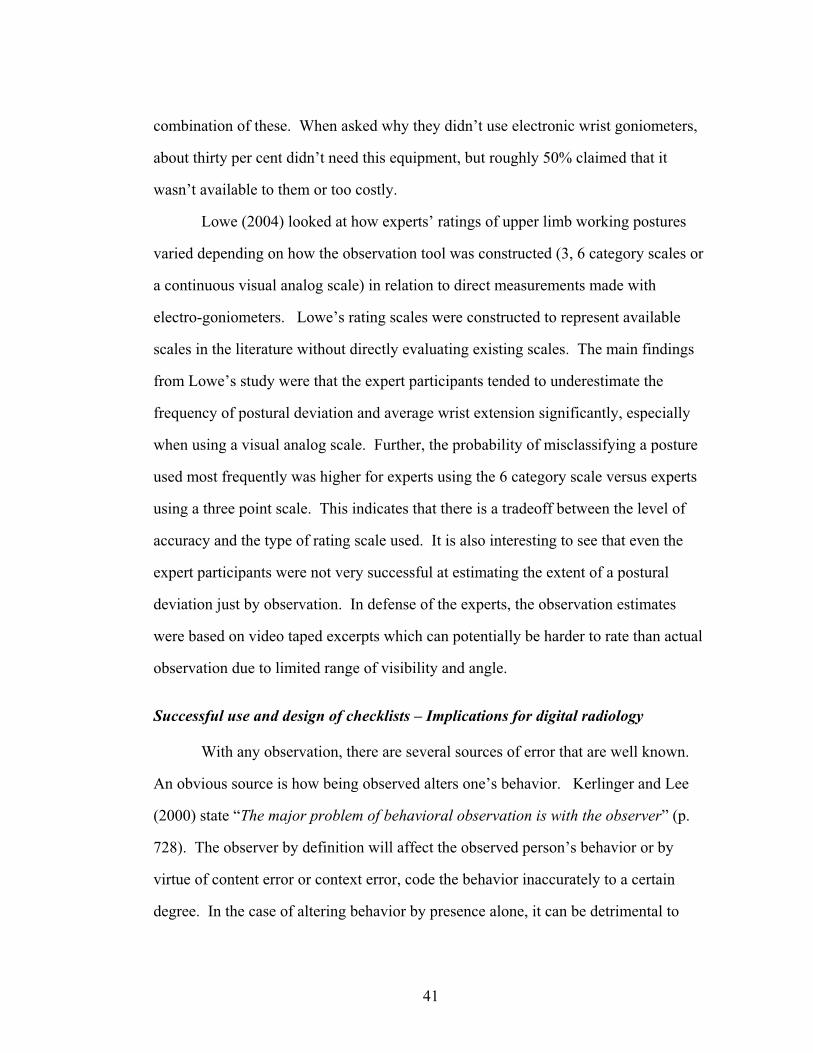
41
combination of these. When asked why they didn’t use electronic wrist goniometers,
about thirty per cent didn’t need this equipment, but roughly 50% claimed that it
wasn’t available to them or too costly.
Lowe (2004) looked at how experts’ ratings of upper limb working postures
varied depending on how the observation tool was constructed (3, 6 category scales or
a continuous visual analog scale) in relation to direct measurements made with
electro-goniometers. Lowe’s rating scales were constructed to represent available
scales in the literature without directly evaluating existing scales. The main findings
from Lowe’s study were that the expert participants tended to underestimate the
frequency of postural deviation and average wrist extension significantly, especially
when using a visual analog scale. Further, the probability of misclassifying a posture
used most frequently was higher for experts using the 6 category scale versus experts
using a three point scale. This indicates that there is a tradeoff between the level of
accuracy and the type of rating scale used. It is also interesting to see that even the
expert participants were not very successful at estimating the extent of a postural
deviation just by observation. In defense of the experts, the observation estimates
were based on video taped excerpts which can potentially be harder to rate than actual
observation due to limited range of visibility and angle.
Successful use and design of checklists – Implications for digital radiology
With any observation, there are several sources of error that are well known.
An obvious source is how being observed alters one’s behavior. Kerlinger and Lee
(2000) state “The major problem of behavioral observation is with the observer” (p.
728). The observer by definition will affect the observed person’s behavior or by
virtue of content error or context error, code the behavior inaccurately to a certain
degree. In the case of altering behavior by presence alone, it can be detrimental to
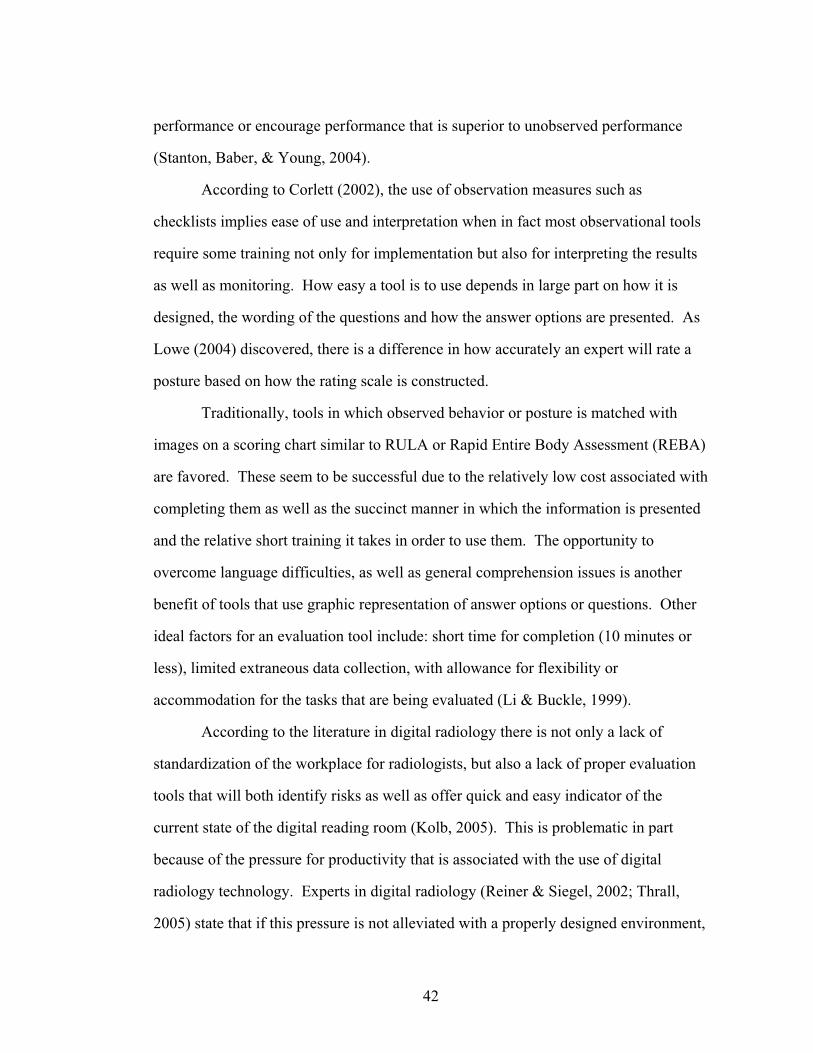
42
performance or encourage performance that is superior to unobserved performance
(Stanton, Baber, & Young, 2004).
According to Corlett (2002), the use of observation measures such as
checklists implies ease of use and interpretation when in fact most observational tools
require some training not only for implementation but also for interpreting the results
as well as monitoring. How easy a tool is to use depends in large part on how it is
designed, the wording of the questions and how the answer options are presented. As
Lowe (2004) discovered, there is a difference in how accurately an expert will rate a
posture based on how the rating scale is constructed.
Traditionally, tools in which observed behavior or posture is matched with
images on a scoring chart similar to RULA or Rapid Entire Body Assessment (REBA)
are favored. These seem to be successful due to the relatively low cost associated with
completing them as well as the succinct manner in which the information is presented
and the relative short training it takes in order to use them. The opportunity to
overcome language difficulties, as well as general comprehension issues is another
benefit of tools that use graphic representation of answer options or questions. Other
ideal factors for an evaluation tool include: short time for completion (10 minutes or
less), limited extraneous data collection, with allowance for flexibility or
accommodation for the tasks that are being evaluated (Li & Buckle, 1999).
According to the literature in digital radiology there is not only a lack of
standardization of the workplace for radiologists, but also a lack of proper evaluation
tools that will both identify risks as well as offer quick and easy indicator of the
current state of the digital reading room (Kolb, 2005). This is problematic in part
because of the pressure for productivity that is associated with the use of digital
radiology technology. Experts in digital radiology (Reiner & Siegel, 2002; Thrall,
2005) state that if this pressure is not alleviated with a properly designed environment,
43
the promise of increased productivity and efficiency will not be fulfilled. Another
problem is that there is also a strong demand for financially viable ergonomic
environments (Kolb, 2005). Without any indication of whether or not the environment
is supporting the work that is supposed to take place in the space, it is hard for hospital
administrators to justify any expense for furniture and computer equipment in addition
to the software framework (PACS). A short and easy to use environmental checklist
of the working environment in a digital reading room, similar to the one proposed in
this paper is an ideal tool to begin looking at the working environment of radiologists.
It will not only assist the radiologists themselves as well as hospital health and safety
enforcers but also hospital administrators as they move towards completely digitizing
the radiology work process.
44
CHAPTER 5 - METHODS
Checklist Development
The goal was to identify items that would represent an intensely used radiology
digital reading room workstation, in terms of duration of work and intensity of
material viewed. Eventually the checklist will be used by ergonomists and facility
planners, so environmental measures such as temperature and air velocity were
included as well as basic measures of the work station, for example: size of work
surface and types of input devices. Since there is not an existing checklist in place that
focuses on the work environment of radiologists, it was further decided to look to
literature on ergonomics in radiology as well as commercial material such as
brochures by furniture makers for hospital and radiology furniture fixtures.
The Cornell Digital Reading Room Ergonomics Checklist (CDRREC) was
devised based on questionnaire items found in thirteen checklists and educational
material published by the government, independent researchers and furniture makers.
Examples of these sources are the Occupational Safety and Health Administration
(OSHA) Ergonomic Solutions: Computer Workstations e-Tool Index for Computer
Work, the Canadian Standards Association’s Z412 Guideline on Office Ergonomics
and the Cornell University Performance Oriented Ergonomic Checklist For Computer
(VDT) Workstations from the Human Factors and Ergonomics Society. A complete
list of all the resources can be found in Appendix A
The following criteria was used in choosing the initial items for the checklist:
The items had to address a work environment with computers, keyboard and
mouse set-up.
45
The items had to address work with visual displays, adjustments and image display
quality.
The items had to address postural issues related to working with visual display
terminals, input devices, document holders and other computer workstation
accessories.
The items had to address issues relevant to office furniture typically used with
visual display terminals, such as adjustments and maintenance.
The items had to address postural and usability issues in working with input
devices commonly used in digital radiology, such as voice recognition,
microphone, headset, joystick, roller ball and foot controlled pedals.
The items had to address ambient environment issues, such as air quality,
temperature, noise and lighting.
The items were arranged in an excel spreadsheet, with columns representing initial
item number (from original checklist), new item number, item and item source. This
allowed for easy manipulation of the items, arranging alphabetically by items or item
source. This arrangement also allowed for easy search of the items as well as side-by-
side comparison of items.
After reviewing a total number of 615 items, it was decided to divide the
checklist into five sections that were put up on separate sheets within the excel
spreadsheet document. These sections can be seen in figure 4.

46
Figure 4. Sections of the CDRREC. The number of items in each section is represented below the section name.
To cut down the number of items for the final checklist, duplicate items were
summarized into one and irrelevant items were deleted from the pool of items. Further
elimination of items was based on a review of the literature for radiology workstations
as well as reviewing commercially available workstations and equipment for
radiologists utilizing digital image technology. Based on these eliminations, the final
number of items to comprise the list was 84. These items make up the 39 questions on
the final checklist. The discrepancy between these two numbers can be explained with
a look at question 7 in the initial version of the CDRREC: “Please check circle if the
images on the screen are: Fuzzy, Hard to read, or Without visible flicker or jitter”.
Here, three items from the initial pool of items have been combined into one question.
Similarly, most other checklist questions in the CDRREC will contain more than one
item from the initial pool of items.
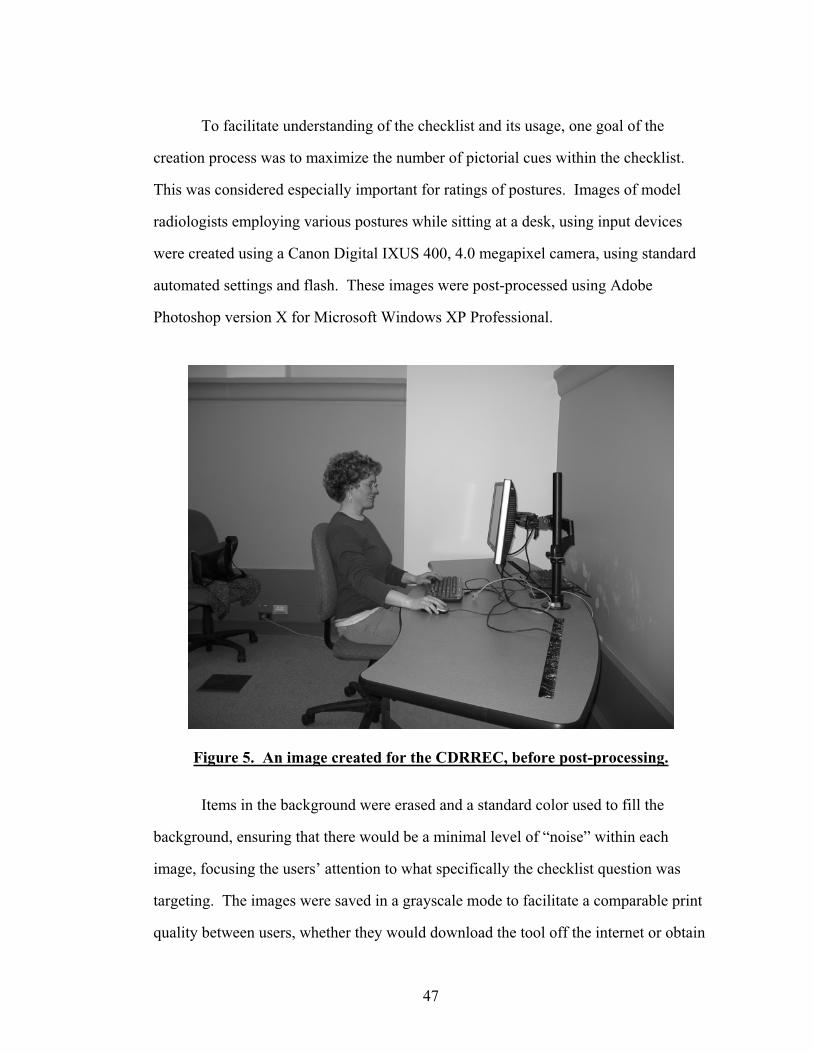
47
To facilitate understanding of the checklist and its usage, one goal of the
creation process was to maximize the number of pictorial cues within the checklist.
This was considered especially important for ratings of postures. Images of model
radiologists employing various postures while sitting at a desk, using input devices
were created using a Canon Digital IXUS 400, 4.0 megapixel camera, using standard
automated settings and flash. These images were post-processed using Adobe
Photoshop version X for Microsoft Windows XP Professional.
Figure 5. An image created for the CDRREC, before post-processing.
Items in the background were erased and a standard color used to fill the
background, ensuring that there would be a minimal level of “noise” within each
image, focusing the users’ attention to what specifically the checklist question was
targeting. The images were saved in a grayscale mode to facilitate a comparable print
quality between users, whether they would download the tool off the internet or obtain
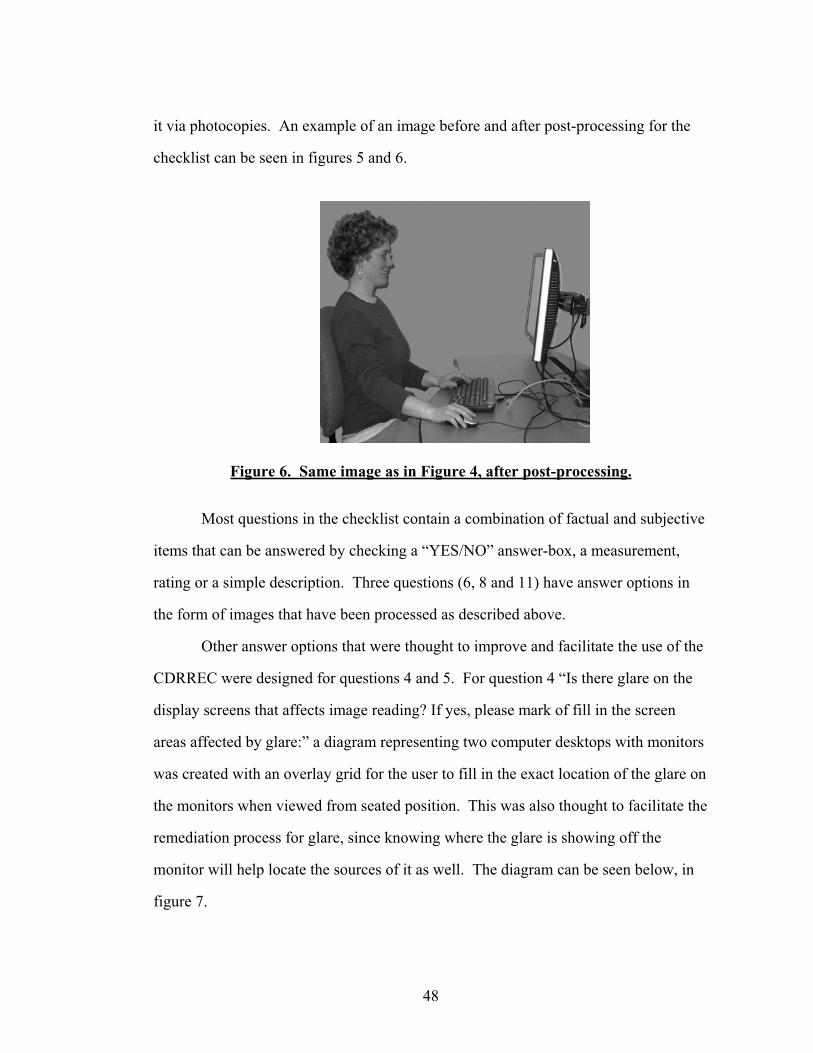
48
it via photocopies. An example of an image before and after post-processing for the
checklist can be seen in figures 5 and 6.
Figure 6. Same image as in Figure 4, after post-processing.
Most questions in the checklist contain a combination of factual and subjective
items that can be answered by checking a “YES/NO” answer-box, a measurement,
rating or a simple description. Three questions (6, 8 and 11) have answer options in
the form of images that have been processed as described above.
Other answer options that were thought to improve and facilitate the use of the
CDRREC were designed for questions 4 and 5. For question 4 “Is there glare on the
display screens that affects image reading? If yes, please mark of fill in the screen
areas affected by glare:” a diagram representing two computer desktops with monitors
was created with an overlay grid for the user to fill in the exact location of the glare on
the monitors when viewed from seated position. This was also thought to facilitate the
remediation process for glare, since knowing where the glare is showing off the
monitor will help locate the sources of it as well. The diagram can be seen below, in
figure 7.
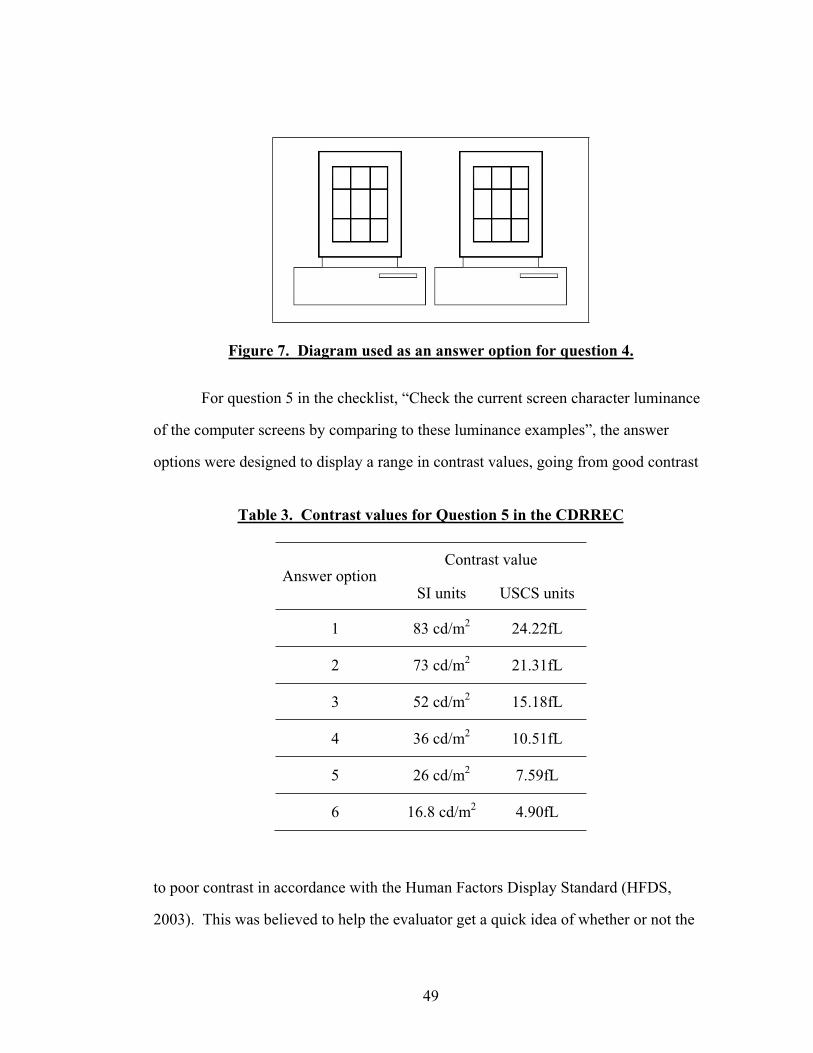
49
Figure 7. Diagram used as an answer option for question 4.
For question 5 in the checklist, “Check the current screen character luminance
of the computer screens by comparing to these luminance examples”, the answer
options were designed to display a range in contrast values, going from good contrast
Table 3. Contrast values for Question 5 in the CDRREC
Contrast value Answer option
SI units USCS units
1 83 cd/m2 24.22fL
2 73 cd/m2 21.31fL
3 52 cd/m2 15.18fL
4 36 cd/m2 10.51fL
5 26 cd/m2 7.59fL
6 16.8 cd/m2 4.90fL
to poor contrast in accordance with the Human Factors Display Standard (HFDS,
2003). This was believed to help the evaluator get a quick idea of whether or not the
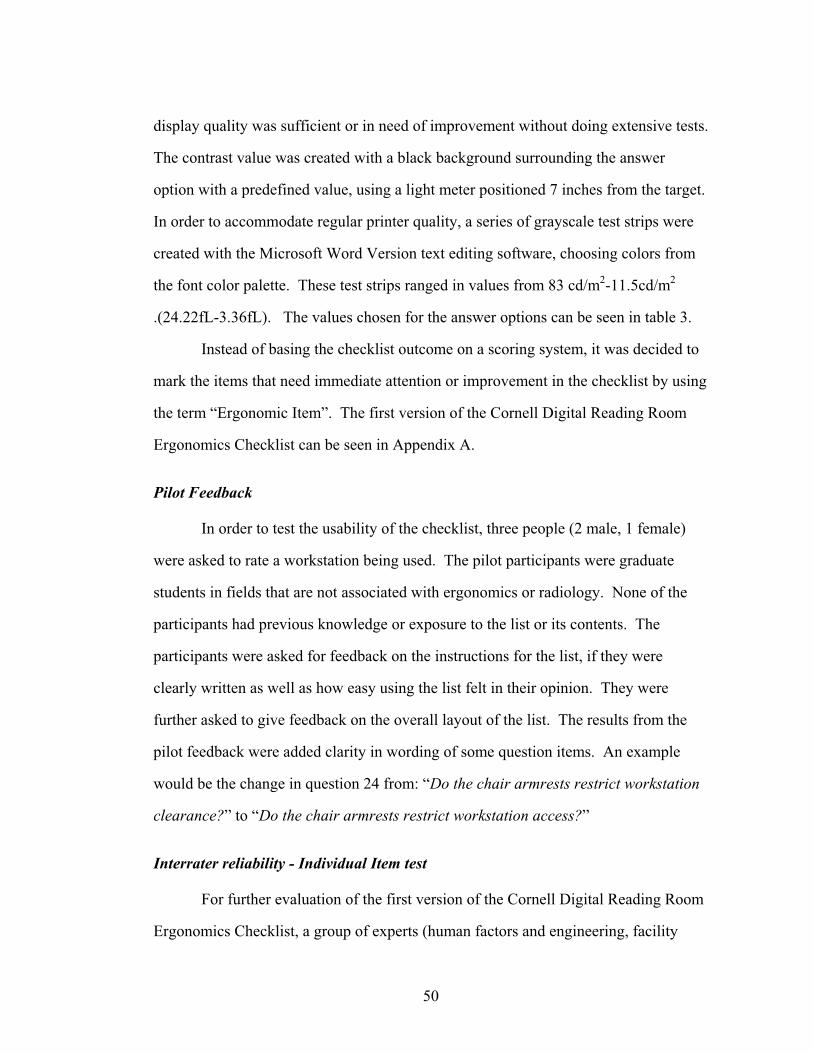
50
display quality was sufficient or in need of improvement without doing extensive tests.
The contrast value was created with a black background surrounding the answer
option with a predefined value, using a light meter positioned 7 inches from the target.
In order to accommodate regular printer quality, a series of grayscale test strips were
created with the Microsoft Word Version text editing software, choosing colors from
the font color palette. These test strips ranged in values from 83 cd/m2-11.5cd/m2
.(24.22fL-3.36fL). The values chosen for the answer options can be seen in table 3.
Instead of basing the checklist outcome on a scoring system, it was decided to
mark the items that need immediate attention or improvement in the checklist by using
the term “Ergonomic Item”. The first version of the Cornell Digital Reading Room
Ergonomics Checklist can be seen in Appendix A.
Pilot Feedback
In order to test the usability of the checklist, three people (2 male, 1 female)
were asked to rate a workstation being used. The pilot participants were graduate
students in fields that are not associated with ergonomics or radiology. None of the
participants had previous knowledge or exposure to the list or its contents. The
participants were asked for feedback on the instructions for the list, if they were
clearly written as well as how easy using the list felt in their opinion. They were
further asked to give feedback on the overall layout of the list. The results from the
pilot feedback were added clarity in wording of some question items. An example
would be the change in question 24 from: “Do the chair armrests restrict workstation
clearance?” to “Do the chair armrests restrict workstation access?”
Interrater reliability - Individual Item test
For further evaluation of the first version of the Cornell Digital Reading Room
Ergonomics Checklist, a group of experts (human factors and engineering, facility
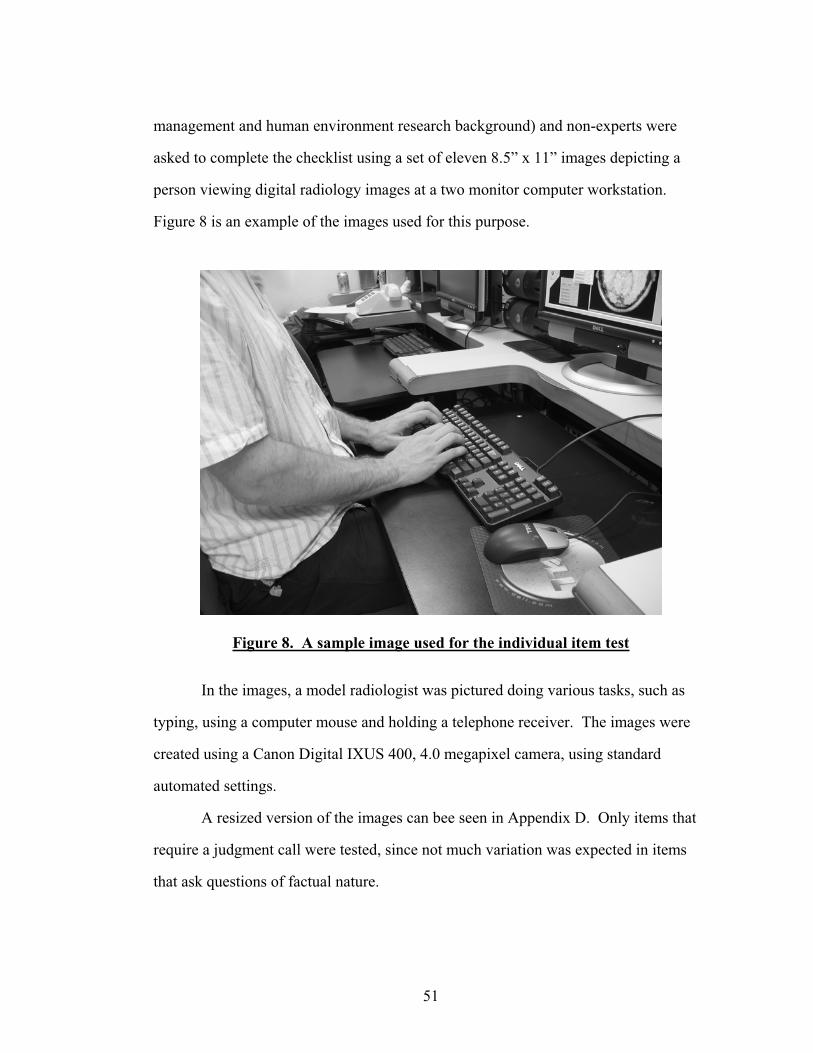
51
management and human environment research background) and non-experts were
asked to complete the checklist using a set of eleven 8.5” x 11” images depicting a
person viewing digital radiology images at a two monitor computer workstation.
Figure 8 is an example of the images used for this purpose.
Figure 8. A sample image used for the individual item test
In the images, a model radiologist was pictured doing various tasks, such as
typing, using a computer mouse and holding a telephone receiver. The images were
created using a Canon Digital IXUS 400, 4.0 megapixel camera, using standard
automated settings.
A resized version of the images can bee seen in Appendix D. Only items that
require a judgment call were tested, since not much variation was expected in items
that ask questions of factual nature.
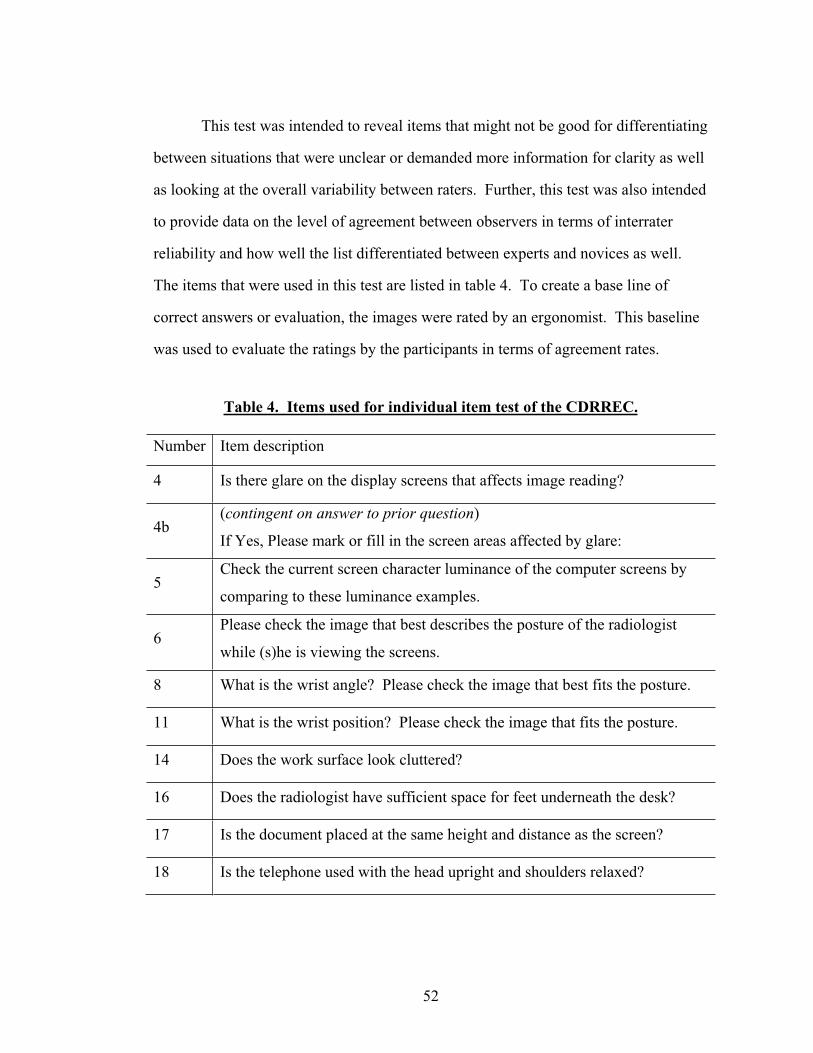
52
This test was intended to reveal items that might not be good for differentiating
between situations that were unclear or demanded more information for clarity as well
as looking at the overall variability between raters. Further, this test was also intended
to provide data on the level of agreement between observers in terms of interrater
reliability and how well the list differentiated between experts and novices as well.
The items that were used in this test are listed in table 4. To create a base line of
correct answers or evaluation, the images were rated by an ergonomist. This baseline
was used to evaluate the ratings by the participants in terms of agreement rates.
Table 4. Items used for individual item test of the CDRREC.
Number Item description
4 Is there glare on the display screens that affects image reading?
4b(contingent on answer to prior question)
If Yes, Please mark or fill in the screen areas affected by glare:
5Check the current screen character luminance of the computer screens by
comparing to these luminance examples.
6Please check the image that best describes the posture of the radiologist
while (s)he is viewing the screens.
8 What is the wrist angle? Please check the image that best fits the posture.
11 What is the wrist position? Please check the image that fits the posture.
14 Does the work surface look cluttered?
16 Does the radiologist have sufficient space for feet underneath the desk?
17 Is the document placed at the same height and distance as the screen?
18 Is the telephone used with the head upright and shoulders relaxed?
53
In terms of percent agreement, the ratings by each participant were compared
to ratings by other participants in, as well as the ergonomists’ rating to estimate the
level of agreement between participants and between participants and the ergonomist.
This method has been used in research to estimate validity and reliability of screening
tools by Engkvist et al. (1995). Multiple observer agreement (King, 2004) was
statistically analyzed using Minitab 14 for Microsoft XP Professional.
Based on the results from the participant percent agreement on individual
items, inconsistent items were excluded in a second round of multiple observer
agreement calculations to investigate whether the level of agreement would improve.
The Cornell Office of Statistical Consulting was contacted to verify the use of this test
and its outcomes. Based on these results, the final version of the Cornell Digital
Reading Room Ergonomics Checklist was created (see Appendix G for a complete
final version).
Expert Feedback
In order to validate the CDRREC further, expert feedback was solicited in four
ways. First, the list, a feedback form and a letter explaining the purpose of the
feedback were mailed individually to a list of 19 practicing radiologists that all utilize
digital medical imaging in their work. Second, thirty copies of the list and a feedback
form were handed out at a major national conference and education seminar on digital
medical imaging, attended by radiologists, hospital managers and other imaging
professionals. Third, the list and the feedback form were made available on-line at
http://ergo.human.cornell.edu/ AHProjects/Hronn06/cudigitalRR.htm. The on-line
version of the feedback form was announced at the above mentioned major national
conference as well. Visitors to this website were encouraged to download the
checklist and the accompanying feedback form and submit electronically. Fourth, a
54
practicing hospital ergonomist was contacted for feedback and comments, using the
same feedback form that was sent to the radiologists. The feedback form consisted of
four closed ended questions, with a comments section after each question to be
analyzed qualitatively by coding and categorizing as well as quantitatively by
analyzing the number and types of comments submitted with content analysis. The
closed ended questions were analyzed quantitatively. The feedback form can be seen
in Appendix B. The letter to the radiologists can be seen in Appendix C.
Validity
Face validity
The purpose of the checklist is to identify and document postural or equipment
set-up related problems or problems related to ambient conditions at a radiologist’s
workstation. Face validity refers to what a test appears to be measuring, whether the
instrument appears to be measure the intended construct. This type of validity is not
quantifiable (Kerlinger & Lee, 2000). It was assumed that since the items all came
from validated sources, checklists and standards based on research, that the face
validity for the CDRREC would be pretty good.
Concurrent validity - Predictive validity
According to Kerlinger and Lee (2000), concurrent and predictive validity are
subcategories of criterion related validity. Concurrent validity refers to the extent that
a test or a measurement would agree with another validated test or measure for the
same thing. The same applies to predictive validity, but with a different twist.
Predictive validity refers to the extent a measurement can be applied to predict a
certain outcome in the future. Kerlinger and Lee (2000) argue that this classification
of predictive validity is vague, and that in a sense all measurements are predictive by

55
definition. It is helpful to look at these two types of validity when validating a new
tool, simply to verify the theoretical foundation of the items within the tool. The
predictive and concurrent validity of the checklist should be fairly good, considering
that all the items in the CDRREC come from sources that have been validated in
practice and theory.
Convergent Validity – Divergent Validity
Kerlinger and Lee (2000) identify construct validity as one of the more
important notions in measurement theory and practice. Not only does this concept
address the question of whether a tool is actually measuring a construct, or whether
hypotheses can be derived from the construct, but also if an alternative hypothesis can
be tested. Suggesting an alternative theory in this case would mean another way of
looking at problems that arise in a working environment than focusing on the
relationship between the worker and their workstation. For this purpose, it is
important to look at whether the CDRREC will provide an outcome similar to other
observation based tools (convergence) of working environments and postures or if the
CDRREC will differ from these measures (divergence). It is suggested that the
CDRREC will fulfill the criteria related to convergence and divergence in relation to
other measurements due to the theoretical foundation on which the CDRREC is built.
56
CHAPTER 6 - RESULTS
Individual item test - Interrater Reliability -
Participants
Twenty one people, age 18 – 58 years old completed the interrater reliability
and individual item test. Six were male and 15 female. Seventeen had completed an
undergraduate or a graduate degree, whereas four had completed high school only.
Eight participants had background in ergonomics, facility planning and management,
and other human environment relations. Thirteen participants had backgrounds that
were not related to human-environment research. The participants were recruited via
flyers on campus and were rewarded with $2.00gift certificates for ice cream at the
Cornell Dairy Bar for their efforts.
Individual Item test
Table 5 shows the items used for the item analysis with the ergonomist ratings,
the participants’ maximum percent agreement in ratings and percent agreement
between participants and the ergonomists’ ratings.
In six instances, the level of percent agreement between participants and
between participants and ergonomist is relatively high (71.4% - 95.2%).
In two instances, the level of agreement between participants and between
participants and ergonomist is moderate, ranging from 50% to 61.9%.
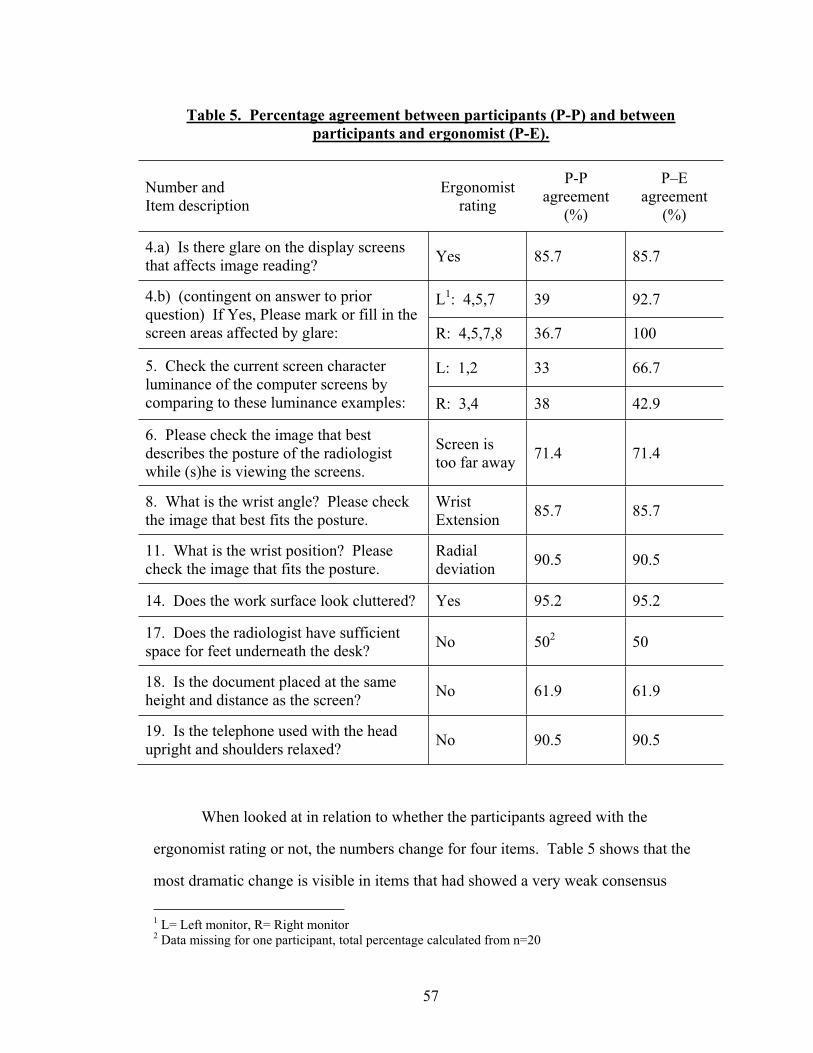
57
Table 5. Percentage agreement between participants (P-P) and between participants and ergonomist (P-E).
Number and Item description
Ergonomist rating
P-Pagreement
(%)
P–Eagreement
(%)
4.a) Is there glare on the display screens that affects image reading? Yes 85.7 85.7
L1: 4,5,7 39 92.7 4.b) (contingent on answer to prior question) If Yes, Please mark or fill in the screen areas affected by glare: R: 4,5,7,8 36.7 100
L: 1,2 33 66.75. Check the current screen character luminance of the computer screens by comparing to these luminance examples: R: 3,4 38 42.9
6. Please check the image that best describes the posture of the radiologist while (s)he is viewing the screens.
Screen is too far away 71.4 71.4
8. What is the wrist angle? Please check the image that best fits the posture.
Wrist Extension 85.7 85.7
11. What is the wrist position? Please check the image that fits the posture.
Radialdeviation 90.5 90.5
14. Does the work surface look cluttered? Yes 95.2 95.2
17. Does the radiologist have sufficient space for feet underneath the desk? No 502 50
18. Is the document placed at the same height and distance as the screen? No 61.9 61.9
19. Is the telephone used with the head upright and shoulders relaxed? No 90.5 90.5
When looked at in relation to whether the participants agreed with the
ergonomist rating or not, the numbers change for four items. Table 5 shows that the
most dramatic change is visible in items that had showed a very weak consensus
1 L= Left monitor, R= Right monitor 2 Data missing for one participant, total percentage calculated from n=20
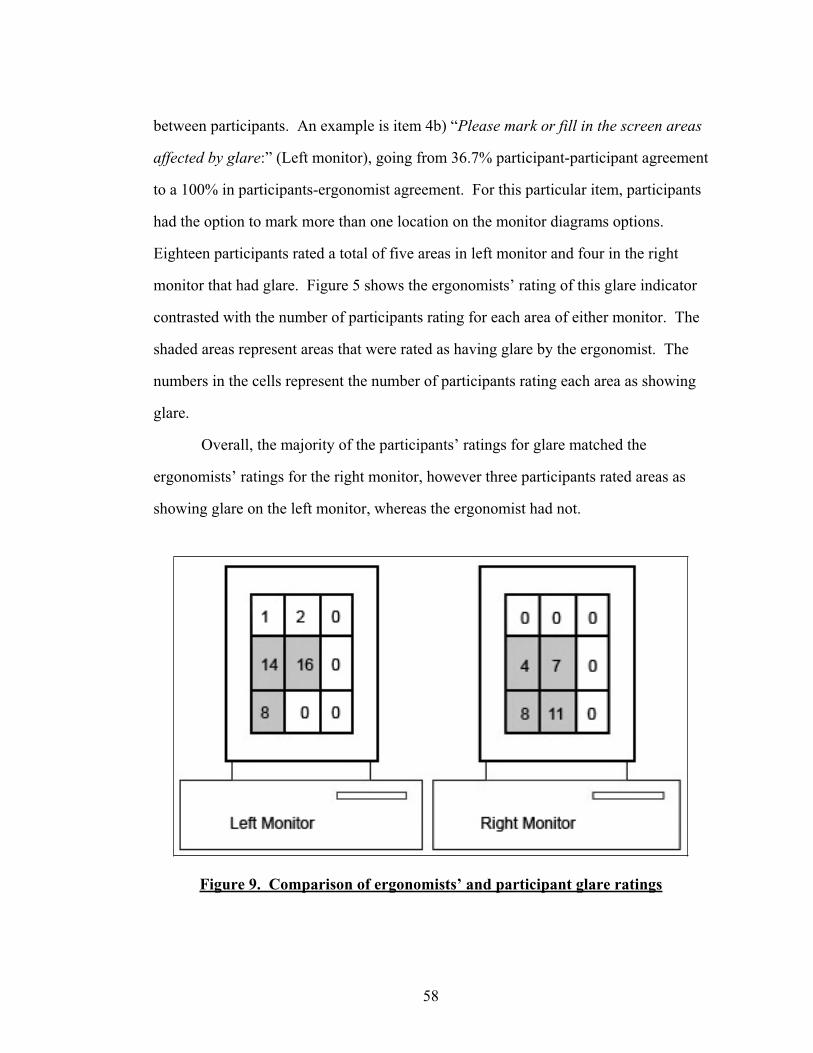
58
between participants. An example is item 4b) “Please mark or fill in the screen areas
affected by glare:” (Left monitor), going from 36.7% participant-participant agreement
to a 100% in participants-ergonomist agreement. For this particular item, participants
had the option to mark more than one location on the monitor diagrams options.
Eighteen participants rated a total of five areas in left monitor and four in the right
monitor that had glare. Figure 5 shows the ergonomists’ rating of this glare indicator
contrasted with the number of participants rating for each area of either monitor. The
shaded areas represent areas that were rated as having glare by the ergonomist. The
numbers in the cells represent the number of participants rating each area as showing
glare.
Overall, the majority of the participants’ ratings for glare matched the
ergonomists’ ratings for the right monitor, however three participants rated areas as
showing glare on the left monitor, whereas the ergonomist had not.
Figure 9. Comparison of ergonomists’ and participant glare ratings
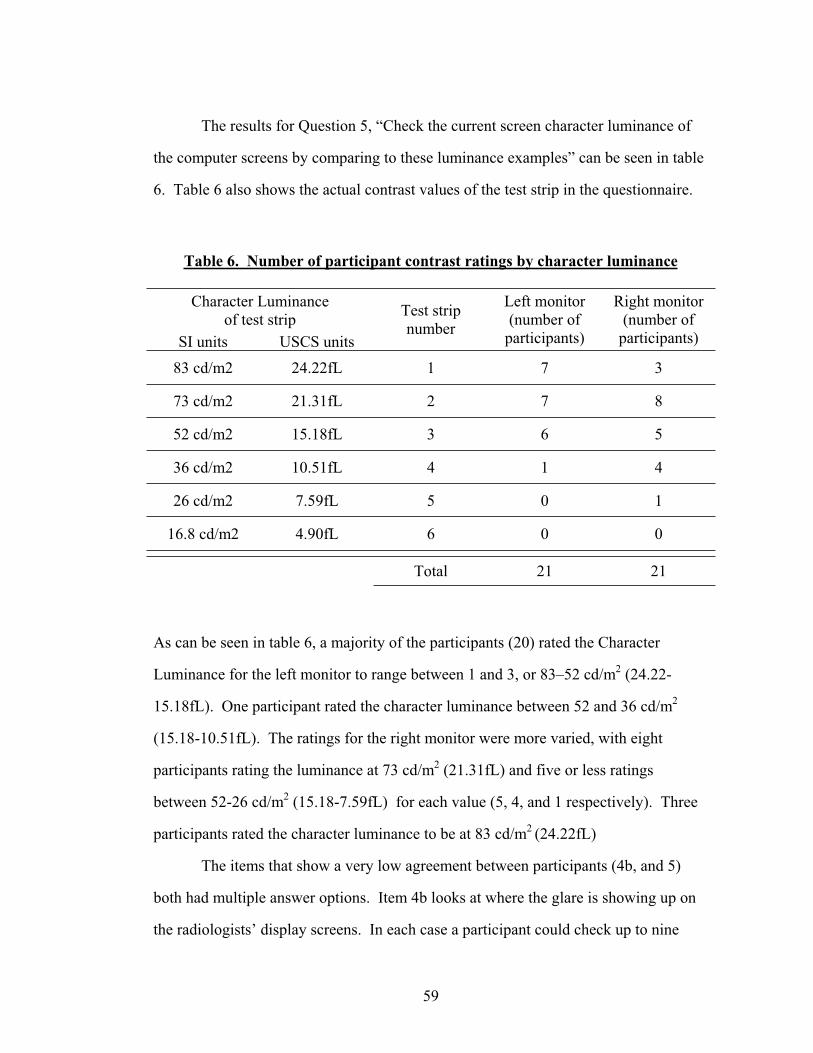
59
The results for Question 5, “Check the current screen character luminance of
the computer screens by comparing to these luminance examples” can be seen in table
6. Table 6 also shows the actual contrast values of the test strip in the questionnaire.
Table 6. Number of participant contrast ratings by character luminance
Character Luminance of test strip
SI units USCS units
Test strip number
Left monitor (number of
participants)
Right monitor (number of
participants)
83 cd/m2 24.22fL 1 7 3
73 cd/m2 21.31fL 2 7 8
52 cd/m2 15.18fL 3 6 5
36 cd/m2 10.51fL 4 1 4
26 cd/m2 7.59fL 5 0 1
16.8 cd/m2 4.90fL 6 0 0
Total 21 21
As can be seen in table 6, a majority of the participants (20) rated the Character
Luminance for the left monitor to range between 1 and 3, or 83–52 cd/m2 (24.22-
15.18fL). One participant rated the character luminance between 52 and 36 cd/m2
(15.18-10.51fL). The ratings for the right monitor were more varied, with eight
participants rating the luminance at 73 cd/m2 (21.31fL) and five or less ratings
between 52-26 cd/m2 (15.18-7.59fL) for each value (5, 4, and 1 respectively). Three
participants rated the character luminance to be at 83 cd/m2 (24.22fL)
The items that show a very low agreement between participants (4b, and 5)
both had multiple answer options. Item 4b looks at where the glare is showing up on
the radiologists’ display screens. In each case a participant could check up to nine
60
answer options, leading to the final number of options checked to be 41 for the left
monitor and 30 for the right monitor. Overall, these answer options were compared
with the ergonomist ratings in terms of whether or not the participants had checked
anywhere within a particular area. This explains why the percent agreement between
participants and ergonomist (92.7% for left monitor, 100% for right monitor, Table 5))
is much higher than between participants (39% for left monitor, 36.7 for right monitor,
Table 5). There is also a problem with the images provided, since they are static and
do not give the participants a realistic view of glare and how it can change depending
on what the viewing angle is.
It is valuable for the ergonomist doing the reading room evaluation to discern
where or what the source of glare is, in order to help with recommendations and
amelioration of the problem, however, judging by the agreement levels of this item
test, the item is questionable at best and needs further validation. It can be argued that
the items will prove to be useful in an actual field test, where the evaluator could
situate themselves in the radiologists’ chair and experience the glare on the display
monitor. An observation of the lighting set up in the reading room was not possible
for the individual item test, but this is necessary when looking at glare sources in the
environment. Again, an actual observation in the field will likely provide a higher
level of agreement between observers than the observation done with the images as
was the case here.
Answering item number 5, “Check the current screen character luminance of
the computer screens by comparing to these luminance examples:” proved to be
difficult for some participants and this was expressed to the researcher during data
collection. The difficulty appeared to be related to the form of the answer options (test
strips with contrast items) and how to arrive at an answer from these, since there were
more than one monitor set-up available for testing in the images provided.
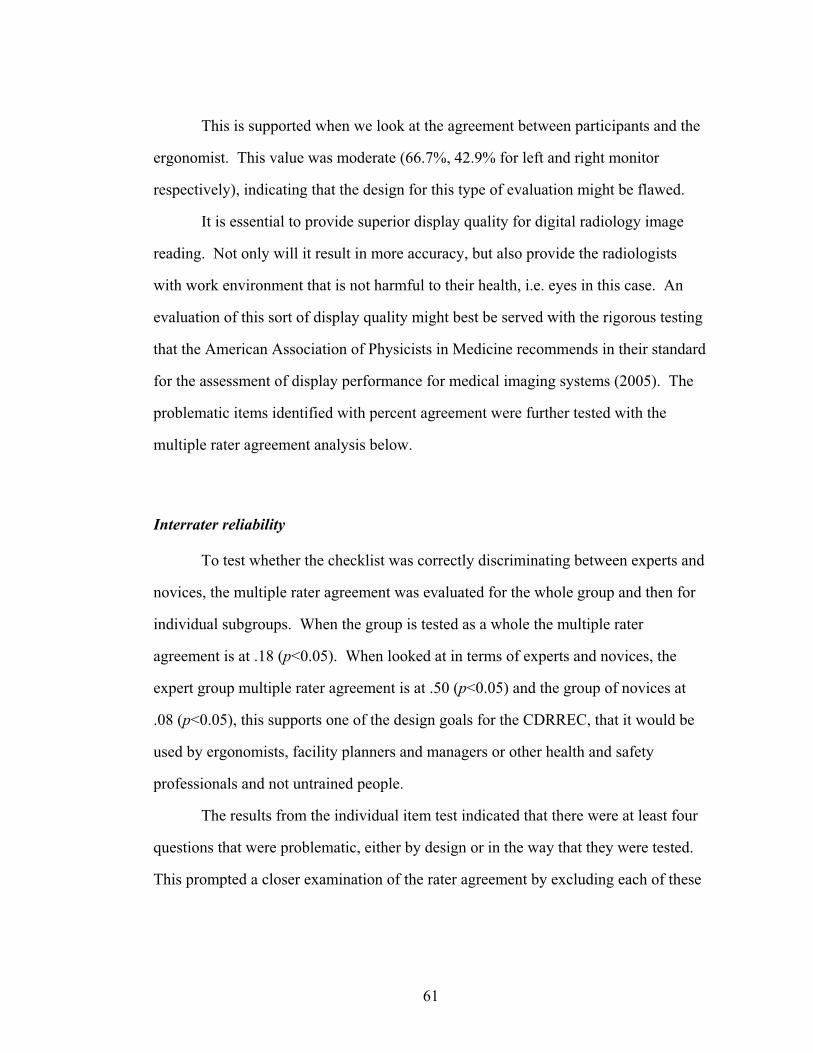
61
This is supported when we look at the agreement between participants and the
ergonomist. This value was moderate (66.7%, 42.9% for left and right monitor
respectively), indicating that the design for this type of evaluation might be flawed.
It is essential to provide superior display quality for digital radiology image
reading. Not only will it result in more accuracy, but also provide the radiologists
with work environment that is not harmful to their health, i.e. eyes in this case. An
evaluation of this sort of display quality might best be served with the rigorous testing
that the American Association of Physicists in Medicine recommends in their standard
for the assessment of display performance for medical imaging systems (2005). The
problematic items identified with percent agreement were further tested with the
multiple rater agreement analysis below.
Interrater reliability
To test whether the checklist was correctly discriminating between experts and
novices, the multiple rater agreement was evaluated for the whole group and then for
individual subgroups. When the group is tested as a whole the multiple rater
agreement is at .18 (p<0.05). When looked at in terms of experts and novices, the
expert group multiple rater agreement is at .50 (p<0.05) and the group of novices at
.08 (p<0.05), this supports one of the design goals for the CDRREC, that it would be
used by ergonomists, facility planners and managers or other health and safety
professionals and not untrained people.
The results from the individual item test indicated that there were at least four
questions that were problematic, either by design or in the way that they were tested.
This prompted a closer examination of the rater agreement by excluding each of these
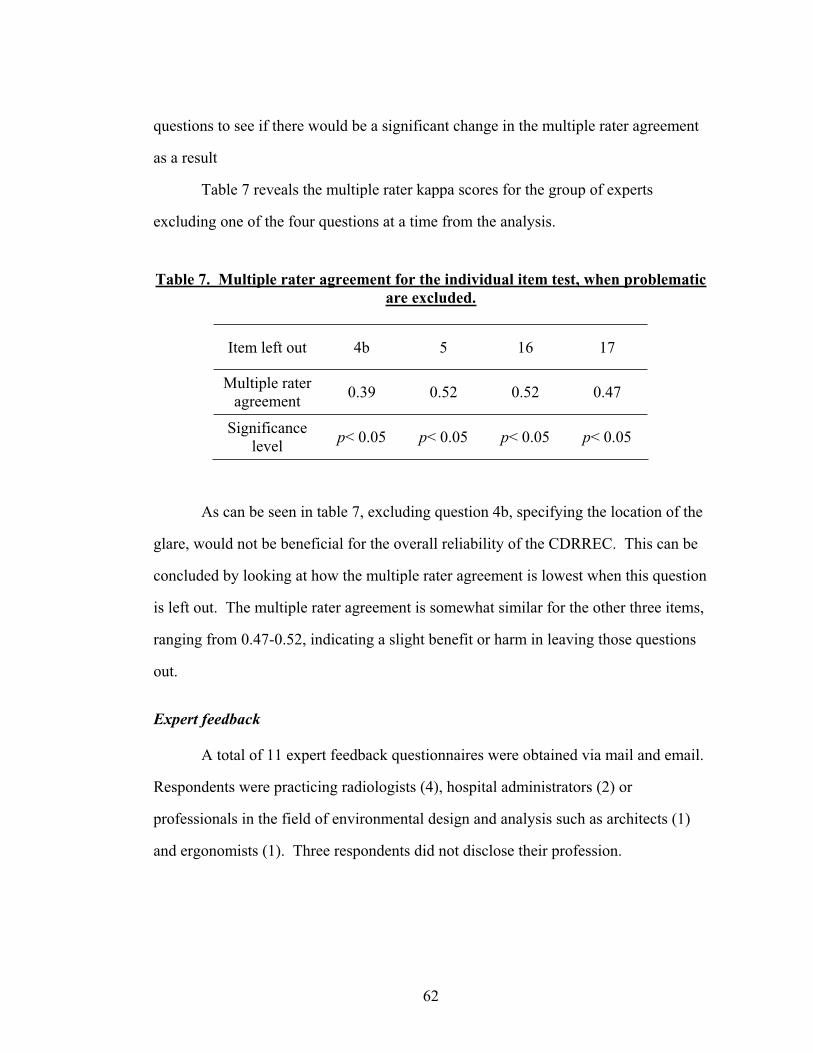
62
questions to see if there would be a significant change in the multiple rater agreement
as a result
Table 7 reveals the multiple rater kappa scores for the group of experts
excluding one of the four questions at a time from the analysis.
Table 7. Multiple rater agreement for the individual item test, when problematicare excluded.
Item left out 4b 5 16 17
Multiple rater agreement 0.39 0.52 0.52 0.47
Significancelevel p< 0.05 p< 0.05 p< 0.05 p< 0.05
As can be seen in table 7, excluding question 4b, specifying the location of the
glare, would not be beneficial for the overall reliability of the CDRREC. This can be
concluded by looking at how the multiple rater agreement is lowest when this question
is left out. The multiple rater agreement is somewhat similar for the other three items,
ranging from 0.47-0.52, indicating a slight benefit or harm in leaving those questions
out.
Expert feedback
A total of 11 expert feedback questionnaires were obtained via mail and email.
Respondents were practicing radiologists (4), hospital administrators (2) or
professionals in the field of environmental design and analysis such as architects (1)
and ergonomists (1). Three respondents did not disclose their profession.
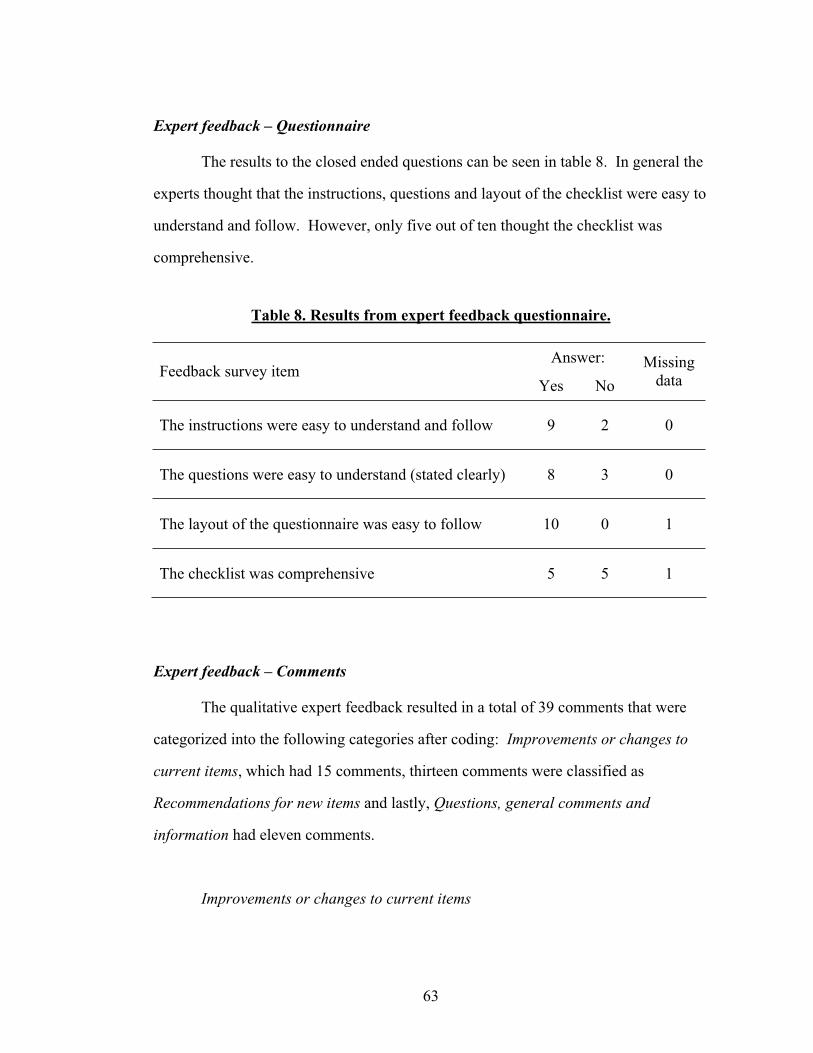
63
Expert feedback – Questionnaire
The results to the closed ended questions can be seen in table 8. In general the
experts thought that the instructions, questions and layout of the checklist were easy to
understand and follow. However, only five out of ten thought the checklist was
comprehensive.
Table 8. Results from expert feedback questionnaire.
Answer:Feedback survey item
Yes No Missing
data
The instructions were easy to understand and follow 9 2 0
The questions were easy to understand (stated clearly) 8 3 0
The layout of the questionnaire was easy to follow 10 0 1
The checklist was comprehensive 5 5 1
Expert feedback – Comments
The qualitative expert feedback resulted in a total of 39 comments that were
categorized into the following categories after coding: Improvements or changes to
current items, which had 15 comments, thirteen comments were classified as
Recommendations for new items and lastly, Questions, general comments and
information had eleven comments.
Improvements or changes to current items
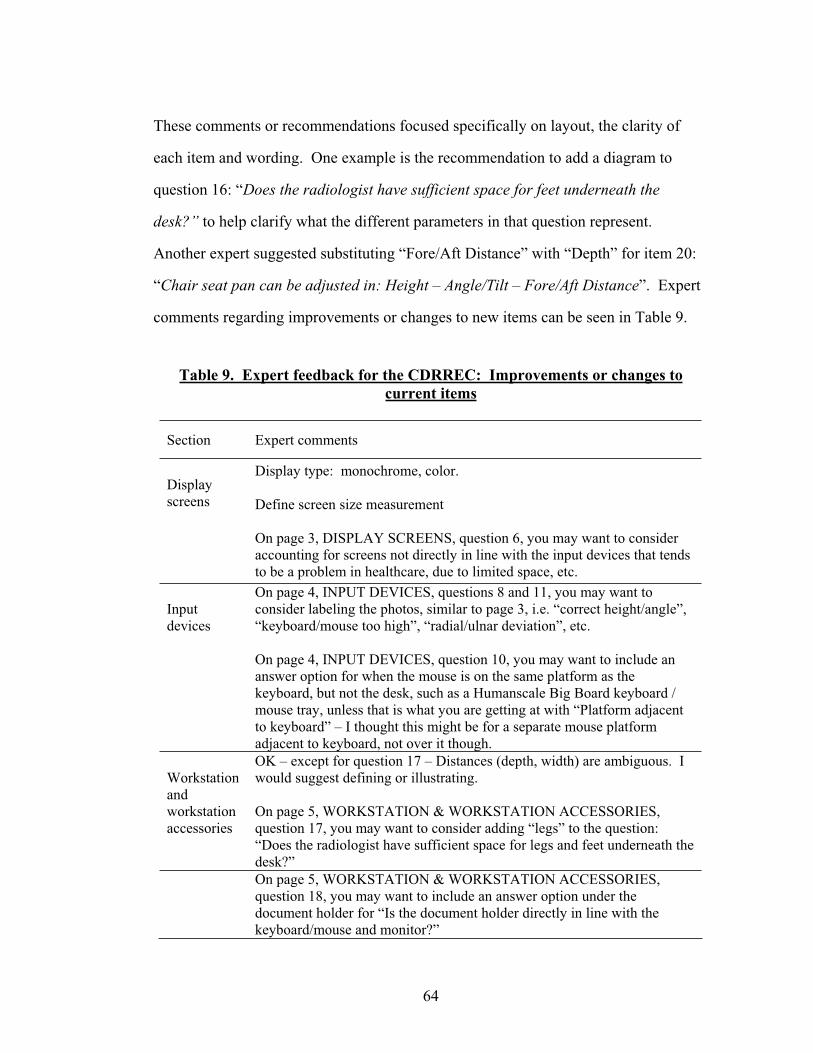
64
These comments or recommendations focused specifically on layout, the clarity of
each item and wording. One example is the recommendation to add a diagram to
question 16: “Does the radiologist have sufficient space for feet underneath the
desk?” to help clarify what the different parameters in that question represent.
Another expert suggested substituting “Fore/Aft Distance” with “Depth” for item 20:
“Chair seat pan can be adjusted in: Height – Angle/Tilt – Fore/Aft Distance”. Expert
comments regarding improvements or changes to new items can be seen in Table 9.
Table 9. Expert feedback for the CDRREC: Improvements or changes to current items
Section Expert comments
Display screens
Display type: monochrome, color.
Define screen size measurement
On page 3, DISPLAY SCREENS, question 6, you may want to consider accounting for screens not directly in line with the input devices that tends to be a problem in healthcare, due to limited space, etc.
Inputdevices
On page 4, INPUT DEVICES, questions 8 and 11, you may want to consider labeling the photos, similar to page 3, i.e. “correct height/angle”, “keyboard/mouse too high”, “radial/ulnar deviation”, etc.
On page 4, INPUT DEVICES, question 10, you may want to include an answer option for when the mouse is on the same platform as the keyboard, but not the desk, such as a Humanscale Big Board keyboard / mouse tray, unless that is what you are getting at with “Platform adjacent to keyboard” – I thought this might be for a separate mouse platform adjacent to keyboard, not over it though.
Workstationandworkstationaccessories
OK – except for question 17 – Distances (depth, width) are ambiguous. I would suggest defining or illustrating.
On page 5, WORKSTATION & WORKSTATION ACCESSORIES, question 17, you may want to consider adding “legs” to the question: “Does the radiologist have sufficient space for legs and feet underneath the desk?”
On page 5, WORKSTATION & WORKSTATION ACCESSORIES, question 18, you may want to include an answer option under the document holder for “Is the document holder directly in line with the keyboard/mouse and monitor?”
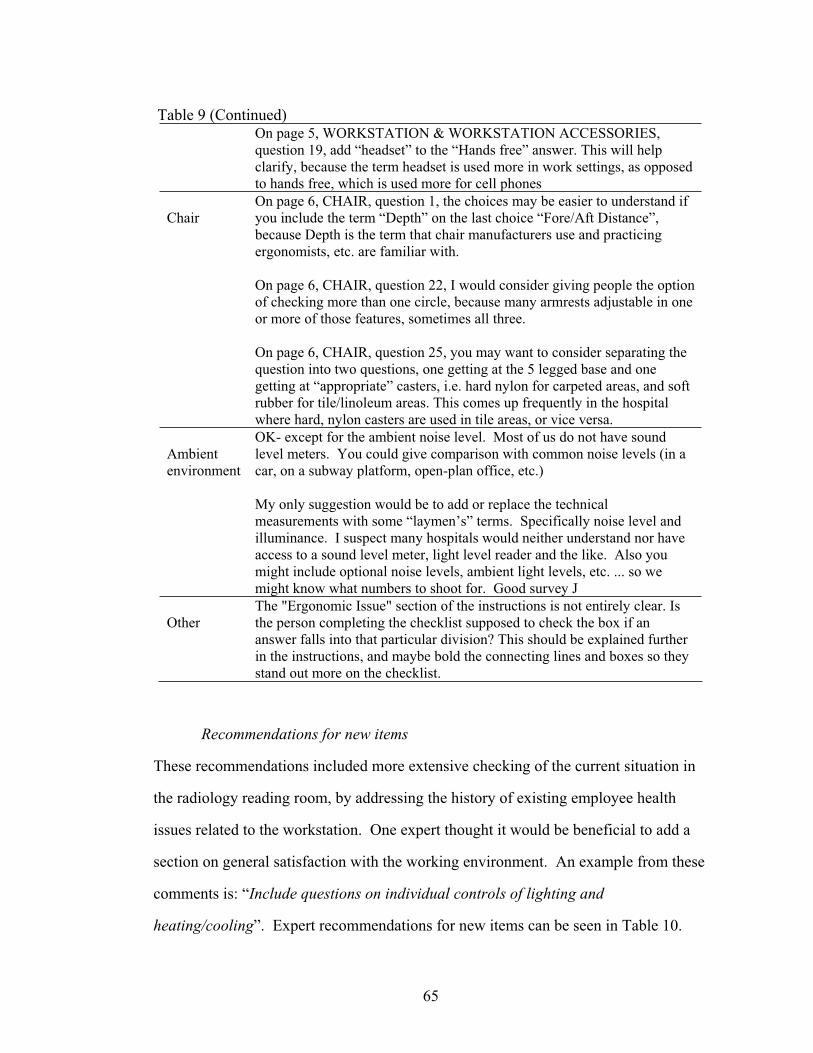
65
Table 9 (Continued) On page 5, WORKSTATION & WORKSTATION ACCESSORIES,
question 19, add “headset” to the “Hands free” answer. This will help clarify, because the term headset is used more in work settings, as opposed to hands free, which is used more for cell phones
ChairOn page 6, CHAIR, question 1, the choices may be easier to understand if you include the term “Depth” on the last choice “Fore/Aft Distance”, because Depth is the term that chair manufacturers use and practicing ergonomists, etc. are familiar with.
On page 6, CHAIR, question 22, I would consider giving people the option of checking more than one circle, because many armrests adjustable in one or more of those features, sometimes all three.
On page 6, CHAIR, question 25, you may want to consider separating the question into two questions, one getting at the 5 legged base and one getting at “appropriate” casters, i.e. hard nylon for carpeted areas, and soft rubber for tile/linoleum areas. This comes up frequently in the hospital where hard, nylon casters are used in tile areas, or vice versa.
Ambient environment
OK- except for the ambient noise level. Most of us do not have sound level meters. You could give comparison with common noise levels (in a car, on a subway platform, open-plan office, etc.)
My only suggestion would be to add or replace the technical measurements with some “laymen’s” terms. Specifically noise level and illuminance. I suspect many hospitals would neither understand nor have access to a sound level meter, light level reader and the like. Also you might include optional noise levels, ambient light levels, etc. ... so we might know what numbers to shoot for. Good survey J
OtherThe "Ergonomic Issue" section of the instructions is not entirely clear. Is the person completing the checklist supposed to check the box if an answer falls into that particular division? This should be explained further in the instructions, and maybe bold the connecting lines and boxes so they stand out more on the checklist.
Recommendations for new items
These recommendations included more extensive checking of the current situation in
the radiology reading room, by addressing the history of existing employee health
issues related to the workstation. One expert thought it would be beneficial to add a
section on general satisfaction with the working environment. An example from these
comments is: “Include questions on individual controls of lighting and
heating/cooling”. Expert recommendations for new items can be seen in Table 10.
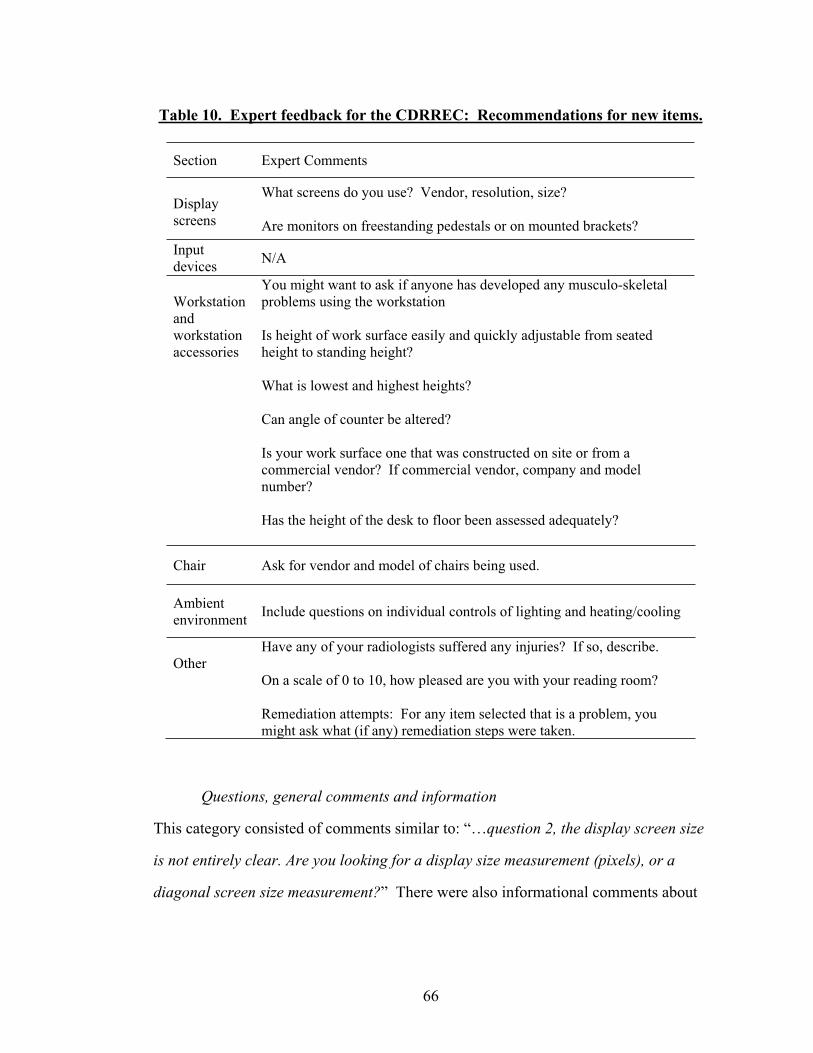
66
Table 10. Expert feedback for the CDRREC: Recommendations for new items.
Section Expert Comments
Display screens
What screens do you use? Vendor, resolution, size?
Are monitors on freestanding pedestals or on mounted brackets? Inputdevices N/A
Workstationandworkstationaccessories
You might want to ask if anyone has developed any musculo-skeletal problems using the workstation
Is height of work surface easily and quickly adjustable from seated height to standing height?
What is lowest and highest heights?
Can angle of counter be altered?
Is your work surface one that was constructed on site or from a commercial vendor? If commercial vendor, company and model number?
Has the height of the desk to floor been assessed adequately?
Chair Ask for vendor and model of chairs being used.
Ambient environment Include questions on individual controls of lighting and heating/cooling
OtherHave any of your radiologists suffered any injuries? If so, describe.
On a scale of 0 to 10, how pleased are you with your reading room?
Remediation attempts: For any item selected that is a problem, you might ask what (if any) remediation steps were taken.
Questions, general comments and information
This category consisted of comments similar to: “…question 2, the display screen size
is not entirely clear. Are you looking for a display size measurement (pixels), or a
diagonal screen size measurement?” There were also informational comments about
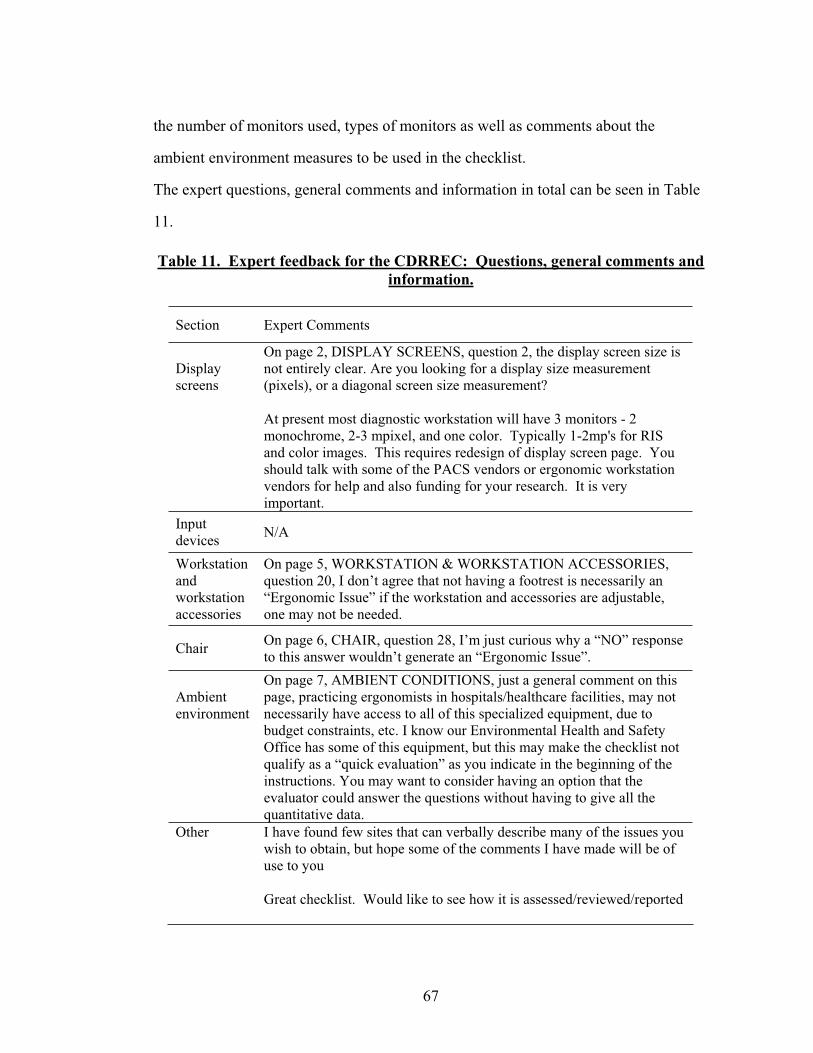
67
the number of monitors used, types of monitors as well as comments about the
ambient environment measures to be used in the checklist.
The expert questions, general comments and information in total can be seen in Table
11.
Table 11. Expert feedback for the CDRREC: Questions, general comments and information.
Section Expert Comments
Display screens
On page 2, DISPLAY SCREENS, question 2, the display screen size is not entirely clear. Are you looking for a display size measurement (pixels), or a diagonal screen size measurement?
At present most diagnostic workstation will have 3 monitors - 2 monochrome, 2-3 mpixel, and one color. Typically 1-2mp's for RIS and color images. This requires redesign of display screen page. You should talk with some of the PACS vendors or ergonomic workstation vendors for help and also funding for your research. It is very important.
Inputdevices N/A
Workstationandworkstationaccessories
On page 5, WORKSTATION & WORKSTATION ACCESSORIES, question 20, I don’t agree that not having a footrest is necessarily an “Ergonomic Issue” if the workstation and accessories are adjustable, one may not be needed.
Chair On page 6, CHAIR, question 28, I’m just curious why a “NO” response to this answer wouldn’t generate an “Ergonomic Issue”.
Ambient environment
On page 7, AMBIENT CONDITIONS, just a general comment on this page, practicing ergonomists in hospitals/healthcare facilities, may not necessarily have access to all of this specialized equipment, due to budget constraints, etc. I know our Environmental Health and Safety Office has some of this equipment, but this may make the checklist not qualify as a “quick evaluation” as you indicate in the beginning of the instructions. You may want to consider having an option that the evaluator could answer the questions without having to give all the quantitative data.
Other I have found few sites that can verbally describe many of the issues you wish to obtain, but hope some of the comments I have made will be of use to you
Great checklist. Would like to see how it is assessed/reviewed/reported
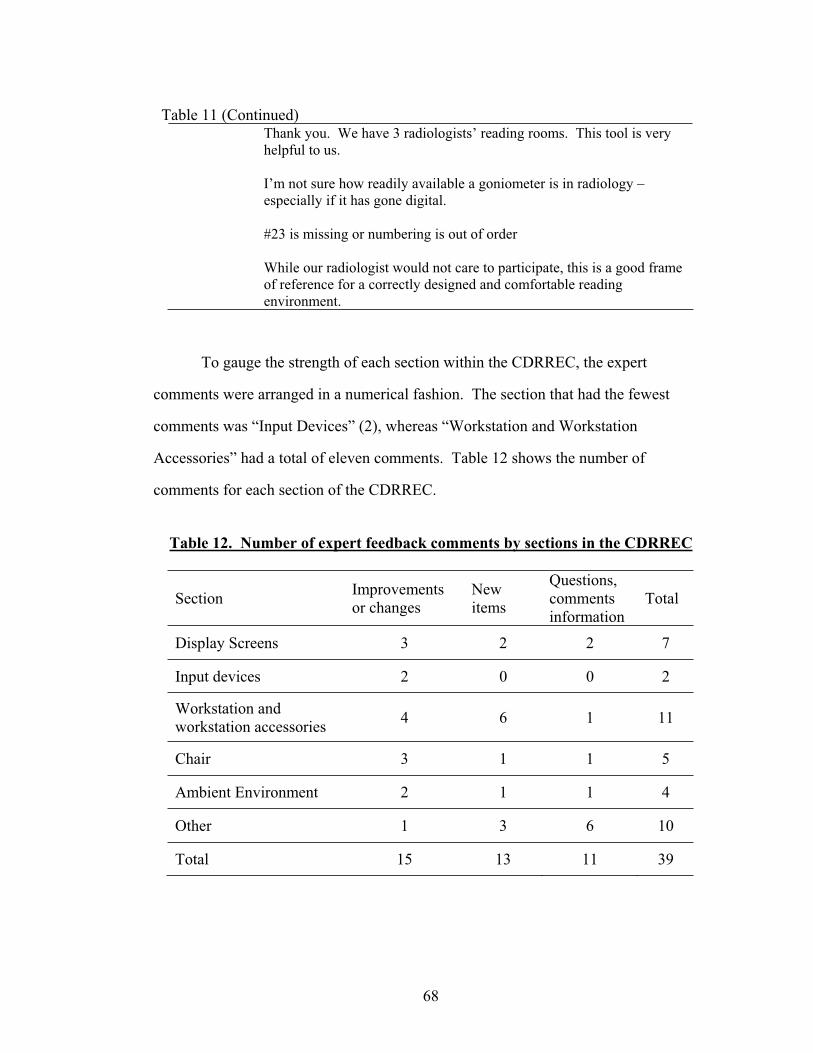
68
Table 11 (Continued) Thank you. We have 3 radiologists’ reading rooms. This tool is very
helpful to us.
I’m not sure how readily available a goniometer is in radiology – especially if it has gone digital.
#23 is missing or numbering is out of order
While our radiologist would not care to participate, this is a good frame of reference for a correctly designed and comfortable reading environment.
To gauge the strength of each section within the CDRREC, the expert
comments were arranged in a numerical fashion. The section that had the fewest
comments was “Input Devices” (2), whereas “Workstation and Workstation
Accessories” had a total of eleven comments. Table 12 shows the number of
comments for each section of the CDRREC.
Table 12. Number of expert feedback comments by sections in the CDRREC
Section Improvements or changes
Newitems
Questions,commentsinformation
Total
Display Screens 3 2 2 7
Input devices 2 0 0 2
Workstation andworkstation accessories 4 6 1 11
Chair 3 1 1 5
Ambient Environment 2 1 1 4
Other 1 3 6 10
Total 15 13 11 39
69
The expert feedback questionnaire revealed that the majority of the participants
felt that the CDRREC was easy to understand and follow and that the layout was easy
to follow (Table 8.). The final version of the CDRREC has the same overall look and
layout as the checklist version submitted to the experts.
Half of the respondents felt that the checklist was not comprehensive. Table
12 reveals that the section most in need of improvements was the section on the
workstation and workstation accessories.
Summary of changes to the CDRREC
Display Screens
Based on the recommendations from the expert feedback, all the questions in
the Display Screens section were changed to reflect a three monitor setup as opposed
to two monitor set up as was done in the first version of the CDRREC. Further,
question number 5 “Check the current screen character luminance of the computer
screens by comparing to these luminance examples:” was eliminated based on the
results from the individual item test and the multiple rater agreement analysis. A new
question addressing the type of screen display (monochrome versus color) was added
(new number 2).
Input Devices
Images in questions 8 and 11 were provided with descriptive labels for
identification of wrist posture and angle based on expert feedback recommendation.
70
Workstation and Workstation Accessories
Two new questions were created for the Workstation and workstation
accessories section. These questions address the angle of the workstation surface (new
number 18) and the adjustability of the workstation height (new number 19). Question
17 (same new number) was changed to represent sufficient clearance under the desk,
ensuring that the issue of clearance for feet and legs would be addressed. Similarly,
question 18 (new number 20) was split into two items; one regarding the distance of
the document holder from the radiologist and one to represent the height of the
document holder. If a document holder is at the same height as the monitor but at a
different distance, it will be logically impossible to answer this question in any other
way than negatively and the question will be rendered useless unless it addresses both
of these dimensions separately. This was considered to be the cause of the
participants’ confusion in their ratings for the individual item test for both items
initially numbered 17 and18.
Out of six suggested new items or questions for the section on workstation and
workstation accessories, only three were added to the final version of the CDRREC.
The remaining three were considered to be outside the scope of the checklist,
pertaining to furniture model types, user satisfaction and health history. While
questions like these would provide valuable information, the scope of the CDRREC is
not to evaluate the workplace on a macroergonomic level, where the whole
organization is scrutinized in relation to work design and management, or to evaluate
different types of workstations available commercially. Rather, the CDRREC is
intended to identify problem areas for the users, and to provide a quick overview of
the work environment.
71
Chair
The wording for question 21 (new number 23) was changed from “fore/aft
distance” to “depth”. For question 25 (new number 26), “…casters that are
appropriate for the flooring material?” was added.
Ambient Conditions
To address the issue of individual control, two new questions were created for
the section on Ambient Conditions. New question number 42 pertains to individual
control for heat in the reading room and new question number 43 addresses individual
control for lighting. See Appendix G for the revised version of the CDRREC.

72
CHAPTER 7 - DISCUSSION
Research has shown that when digital reading rooms are not designed to
support the type of work that takes place there, the risk of work related
musculoskeletal problems and medical misdiagnosis is greater (Dakins & Page, 2004;
Harisinghani et al., 2004; Horii et al., 2003). The evaluation of design factors such
as the workstation set up, ambient room condition and the type of monitor display
settings were addressed in the development of the Cornell Digital Reading Room
Ergonomics Checklist. The results from individual item testing, interrater reliability
and expert feedback indicate that the design goals for the CDRREC were
accomplished. Further research and design opportunities are discussed
Checklist development results and previous research
The first version of the CDRREC that was created was tested and found to
yield an interrater reliability kappa at .50 (p<0.05). This indicated that this version of
the CDRREC was a fairly strong evaluation tool but also there is room for
improvement. In their evaluation of different work demands in a hospital setting and
how the human factors review process could be improved, Janowitz et al. (2006)
combined the REBA and selected items from the UC Computer Use Checklist to use
as their main evaluation tool. This is similar to the approach taken with the
development of the CDRREC, where previously validated measures are taken and
adapted to the specific environment in which the evaluation will be used. With the
combination of REBA and five items from the UC Computer Use Checklist, Janowitz
et al (2006) wanted to capture the entire working experience of hospital staff in an
environment that requires considerable amount of time spent sedentary working with
computers as well as patients. After adapting the scoring algorithm to account for the
new items, Janowitz et al. (2006) divided their tool into two sections, addressing the
73
upper body (UBA-UC) and lower body (LBA-UC) separately. This was done to
prevent an overall score to be affected by extreme ranges and negating severe issues
identified. Janowitz et al. (2006) found that their inter-rater reliability kappa ranged
from 0.54-0.66, depending on what body regions were being evaluated. Janowitz et
al. (2006) also found a strong correlation in ratings between REBA and the combined
measurement tools (UBA-UC and LBA-UC). This indicated that adding the items
from the UC Computer Use Checklist did not negatively affect the performance of
REBA. Janowitz et al. (2006) conclude that this type of assessment methodology is
well suited for large-scale observations of complex environments.
In terms of further validation of the CDRREC, theoretically, it would be
feasible to evaluate the interrater reliability in a similar way as was done by Janowitz
et al. (2006), looking at the different sections of the entire checklist. However, this
was not possible here, due to the uneven number of items within each section that was
tested. Similarly, this type of analysis would need to be done for the CDRREC as a
whole, and not only for select items as was done here. Looking systematically at the
interrater reliability by excluding problematic items based on percent agreement,
showed that the interrater reliability could be improved by excluding questions 5 or 16
(see table 6). This improvement is slight (.02) and does not warrant exclusion of these
questions without further support from either research or theoretical work. Question 5
(“Check the current screen character luminance of the computer screens by comparing
to these luminance examples “) was eliminated from the final version of the CDRREC
due to problems related to sufficient printing quality of the test strips that could result
in a bias towards lower image quality. As was discussed in the introduction, the
optimal working conditions for radiologists working with digital medical images are
not only critical for occupational health and safety reasons, but the weight and
seriousness of the task at hand for these professionals needs to be factored in. Any

74
compromise in terms of image display quality is not an option. Further, the AAPM
(2005) recently published strict guidelines on how display quality should be tested and
evaluated. In terms of indications of low monitor display quality, it is also believed
that question 8 (previously number 7), “Please check the circle if the displayed images
on the screen are: Fuzzy, Hard to read or With visible flicker/jitter” would be
sufficient. It is believed that elimination of question 5 in the final version of the
CDRREC will add to the overall validity of the checklist.
Janowitz et al. (2006) discussed other significant improvements to the work
processes and how this was facilitated with a customized checklist evaluation. Some
of these factors pertain to the design of the checklist and how it was created to give a
quick overview and feedback on the work environment. Again, this is similar to the
design goals and development process for CDRREC. Utilizing this type of approach
is cost efficient in terms of time and manpower. Janowitz et al.’s (2006) results will
support further use and development of the CDRREC, especially because of these
findings. This is also supported by Li and Buckle’s (1999) findings, defining
successful design criteria for checklist design by practitioners to include low cost,
minimal extraneous data collection and graphic representation of answer options or
questions. In the commercial literature related to digital imaging, there is already a
steady influx of articles where the focus is on how the model in hospital
administration has been to focus on the current economic situation and the limitations
therein. Providing an evaluation tool that will be supported by other research in the
field as well as careful design will prove to be successful due to the aforementioned
concerns.
One of the major issues with the first version of the CDRREC were: word
choice, how questions were structured, and how, in some cases, the specificity of the
questions could be improved. These concerns were the result of the expert feedback,
75
obtained with a close ended and open ended questionnaire. This feedback is as
valuable as any other statistical analysis in terms of highlighting issues that might
contribute to poor interrater reliability or other measures of checklist validation. In
their study of checklist usage in a car manufacturing environment and how these lists
predict health outcomes for employees, Brodie and Wells (1997) discovered a great
variability in individual scores. As a result, they concluded that in general the
checklists evaluated (RULA; Occupational Safety and Health Administration (OSHA)
draft risk factor checklist; and the Posture and Upper Extremity checklists) were not
reliable and needed to be greatly improved in order to be a feasible option in health
and safety management. One of the areas they pinpointed as needing further
improvement was the wording of the checklist questions and how using site specific
examples might facilitate understanding of the environment or work processes in
question. Issues similar to Brodie and Wells’ (1997) concerns were addressed in the
creation of the CDRREC, both in terms of making the checklist specific for the work
environment for radiologists working with digital medical images. Further, certain
checklist items were modified upon results analysis. The expert feedback received for
the CDRREC indicates that the site specificity of the checklist was accomplished and
that it will be successfully applied in digital reading rooms.
Limitations of the present study and future directions
As was discussed previously, there was a problem with how the interrater
reliability and individual item test was conducted and designed. The information in
the images used was in some cases not consistent, causing error in participant’s
observations that in turn decreased the value of individual items. However, the
indications gauged from the individual item test do give some insight into how the
76
checklist will perform and this first step in validating the instrument will provide focus
for future work.
In spite of the number of commercially available articles that have been written
about the shortcomings of the ergonomic environment for radiologists, the expert
feedback received was limited. The low feedback rate from experts might indicate a
disinterest within the profession, but the positive nature of each expert’s feedback
indicates otherwise. There is a concern that there is a self-selection bias in the expert
feedback. It is believed, however, that each expert that participated in this study is
interested and invested in making the work environment for radiologists the best it can
be. These people are all either practicing radiologists, or other professionals that will
benefit from this instrument being valid and useful. As such, the self selection bias is
a positive influence on the initial development of the CDRREC. For further
evaluation and optimization of the CDRREC, it would be beneficial to get expert
feedback from health and safety professionals that will be using this instrument. An
interesting idea to further evaluate the CDRREC would be to subject it to usability
testing that would be more rigorous than what was attempted in the expert feedback
currently, evaluating the instructions for the whole checklist and for individual
questions. It is possible that the failure of question 5 could be due to the lack of
specific examples or directions as to how to use the test strips.
The possibilities for future directions with the CDRREC include a complete
evaluation of the checklist in an actual digital reading room. This would include all of
the checklist questions and allow for a full evaluation of each item as well as an
overall analysis of the checklist. Similarly, this full evaluation might provide data for
an individual look at each of the sections within the CDRREC to determine strengths
and weaknesses of each. For instance, the section on the Ambient Environment does
not contain graphic representations of answer options similar to the section on Display
77
Screens. In some cases it is virtually impossible to come up with a graphical
representation of a question, but determining an optimal way to represent checklist
items by way of comparing different types of representations will be valuable both for
further development of the CDRREC.
The information on how best to represent questions in the CDRREC in a
succinct manner will be beneficial for another type of implementation of the
CDRREC. With the rate at which information is being digitized in the hospital
environment, making an interactive computer-based version of the CDRREC will
prove to be a realistic and feasible option. Already, the use of decentralized, portable
workstations or computers-on-wheels (COWs) is a reality in the hospital setting. This
will allow for the use of a computer-based CDRREC without introducing added cost
in terms of new equipment or adjustment to different work processes. Where COWs
are not used or part of the work environment within the hospital, the computer based
version of the CDRREC could be adapted to be used with palm pilots. An interactive
version of the CDRREC could offer immediate results, comparison to previous
evaluations in terms of any improvements that were implemented as well as providing
guidance priorities and quick fixes. Other features such as easy counts of prior
“violations” of the workstation and flagging of areas that have had a considerable
amount of quick fixes, and would perhaps require a closer look, are a possibility as
well. In a way, this version could easily provide a window into a complete facility
management database system on-the-go.
Other validation techniques for the CDRREC that could be done is
triangulation, where one measurement or evaluation tool is compared to other tools
that are supposed to measure same or similar constructs as the tool in question. For
instance, if questions related to posture were extracted from the CDRREC and used in
tandem with another postural evaluation tool such as the RULA or the REBA, we
78
could expect there to be a convergence or a similarity in the issues uncovered in the
testing environment. Similarly, there should be a divergence between the CDRREC
and an evaluation tool that looks specifically at workers’ satisfaction with the
workplace. In short, the CDRREC should be related to evaluation tools that are
measuring environmental properties of a workplace and not to evaluation tools that are
measuring psychological or psychosocial aspects of a workplace.
The development of an accompanying guidebook for the ergonomic issues
identified with the CDRREC is an aspect that will add value to the checklist and its
future use. To do this, considerations about optimal presentation of educational
material need to be addressed as well as research into how best to combine the
approach of an evaluation and follow-up both in the paper based and computer based
versions of the checklist. Due to the time constraints of this project, this was not a
feasible option but as a philosophical stance, the author believes that no environmental
checklist is really complete without a thorough guidance on how to follow through
with the issues uncovered in an evaluation.
As is, the CDRREC will provide guidance on current problems to health and
safety professionals but other uses include a supplement to programming documents
for architects looking to design or remodel digital radiology reading rooms. With
further validation and testing, the checklist will be a valuable addition to the field of
ergonomics as well as facility planning and management, and architecture and design.
It is also interesting to note that due to the graphic representation of some of the items
within the checklist, a translation into another language could be an interesting
undertaking. This would render the CDRREC an addition to the field of ergonomics
not only in English speaking countries, but also in Europe, where the field of digital
radiology is growing rapidly as well.
79
Conclusion
There are many research opportunities related to ergonomics and digital
radiology, one of them is to look at how reading rooms can be evaluated in a quick
and accurate way. The ergonomic literature on evaluation tools and the current study
support the notion of checklists as a prime candidate for this purpose. One way to
make an evaluation of this kind even more successful is to pair it with a follow-up.
This can be achieved with organizational infrastructure or even laws that protect the
employee. However, a simpler way is to provide simple and easy guidelines,
references and suggestions on how to improve on the problems highlighted in the
checklist. It is important to include the education of the users themselves in any kind
of environmental evaluation, in this case it is available in the form of
recommendations for improving the work environment. It becomes the ergonomists’
responsibility to communicate this knowledge both to enforce changes and to make
the changes permanent. Radiologists recognize value of this approach and Horii
(2002) points out that the utility of a well-designed ergonomically correct radiology
reading workstation will be counteracted by tables that set the monitors too low or
high and by chairs that are too uncomfortable to sit in for more than a few minutes.
Completely digital radiology departments are already a reality in some places. It is
interesting to see that with the rapid advancement of digital medical imaging, there are
huge gaps in the information available to really fulfill the potential this technology has
to offer for improvements for professionals and patients. There has not been enough
research done on the conditions needed for optimal reading in digital reading rooms.
We see that there is a movement within the field of radiology to try and rectify this,
for instance Krupinski and her colleagues have been systematically looking at monitor
quality and the effects on performance, and the discussion of ergonomics in the digital
reading room is present in public literature as well as a growing concern of

80
radiologists (see, for example Haramati, & Fast, 2005; Kolb, 2005; Prabhu, et al.,
2005; Reiner, & Siegel, 2002). The relative cost of ill-fitting work environments can
be huge, and in the case of radiologists, we have the potential of this cost affecting not
only the organization, but patients, as well. It is hoped that the Cornell Digital
Reading Room Ergonomics Checklist will be a positive addition to the progress of
digital radiology.
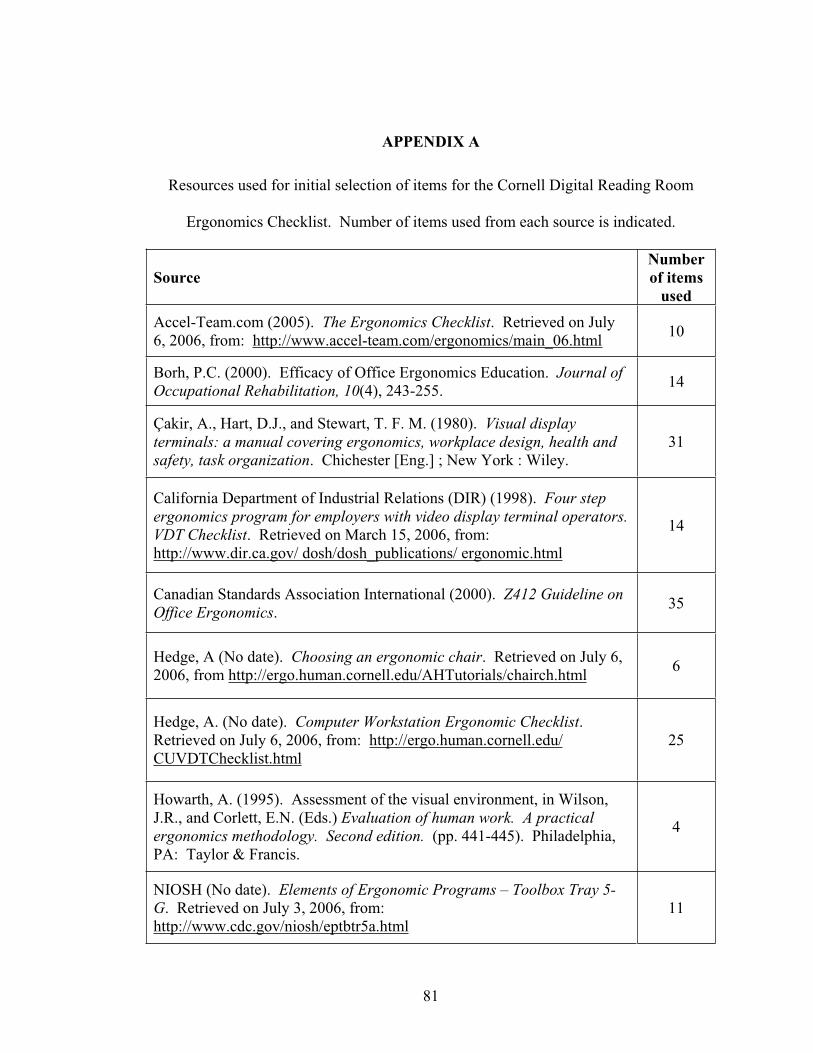
81
APPENDIX A
Resources used for initial selection of items for the Cornell Digital Reading Room
Ergonomics Checklist. Number of items used from each source is indicated.
SourceNumberof items
used
Accel-Team.com (2005). The Ergonomics Checklist. Retrieved on July 6, 2006, from: http://www.accel-team.com/ergonomics/main_06.html 10
Borh, P.C. (2000). Efficacy of Office Ergonomics Education. Journal of Occupational Rehabilitation, 10(4), 243-255. 14
Çakir, A., Hart, D.J., and Stewart, T. F. M. (1980). Visual display terminals: a manual covering ergonomics, workplace design, health and safety, task organization. Chichester [Eng.] ; New York : Wiley.
31
California Department of Industrial Relations (DIR) (1998). Four step ergonomics program for employers with video display terminal operators.VDT Checklist. Retrieved on March 15, 2006, from: http://www.dir.ca.gov/ dosh/dosh_publications/ ergonomic.html
14
Canadian Standards Association International (2000). Z412 Guideline on Office Ergonomics. 35
Hedge, A (No date). Choosing an ergonomic chair. Retrieved on July 6, 2006, from http://ergo.human.cornell.edu/AHTutorials/chairch.html 6
Hedge, A. (No date). Computer Workstation Ergonomic Checklist.Retrieved on July 6, 2006, from: http://ergo.human.cornell.edu/ CUVDTChecklist.html
25
Howarth, A. (1995). Assessment of the visual environment, in Wilson, J.R., and Corlett, E.N. (Eds.) Evaluation of human work. A practical ergonomics methodology. Second edition. (pp. 441-445). Philadelphia, PA: Taylor & Francis.
4
NIOSH (No date). Elements of Ergonomic Programs – Toolbox Tray 5-G. Retrieved on July 3, 2006, from: http://www.cdc.gov/niosh/eptbtr5a.html
11

82
North Carolina State University Environmental health and safety (No date on site). Ergonomic Workstation Guidelines. Retrieved on March 15, 2006, from: http://www.ncsu.edu/ehs/www99/right/handsMan/office/ergonomic.html#vdt
7
Pheasant, S.T. (1995). Anthropometry and the design of the design of workspaces, in Wilson, J.R., and Corlett, E.N. (Eds.) Evaluation of human work. A practical ergonomics methodology. Second edition. (pp. 557-574). Philadelphia, PA: Taylor & Francis.
3
U.S. Department of labor – Occupational Safety and Health Administration (No date on site). Computer workstations checklist.Retrieved on May 28, 2005, from: http://www.osha.gov/SLTC/etools/computerworkstations/ checklist.html
18

83
APPENDIX B
The Cornell Digital Reading Room Ergonomics Checklist – First Version.
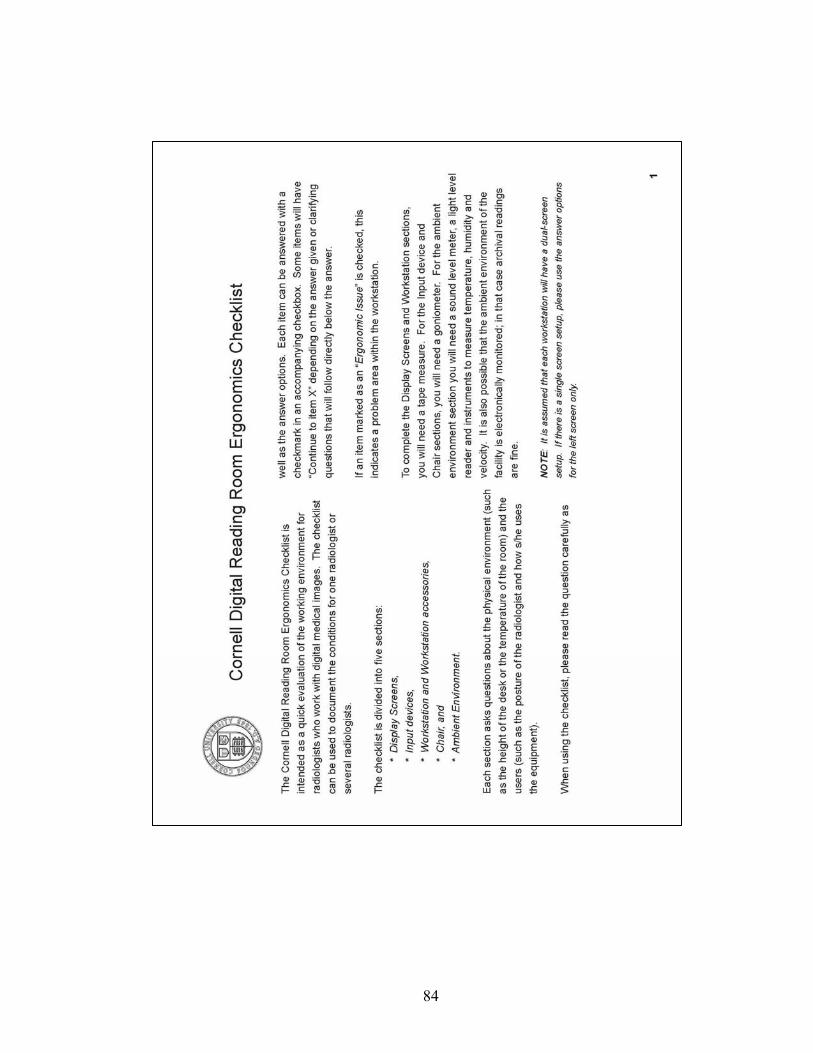
84
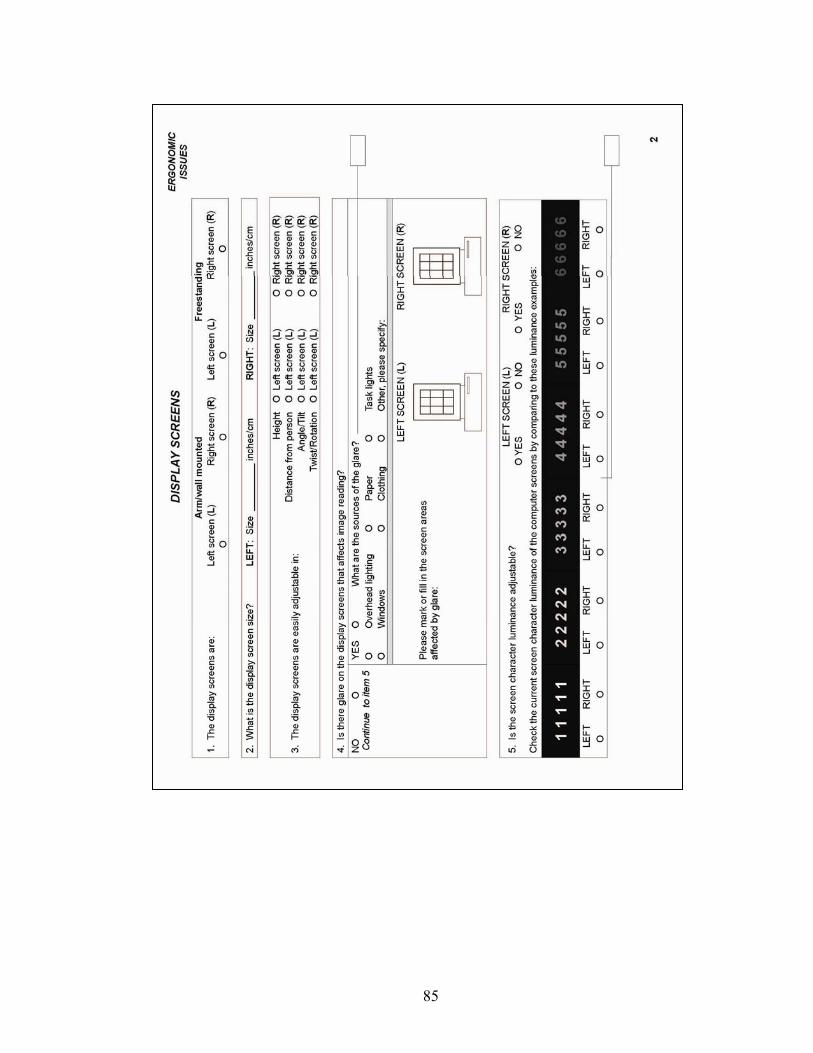
85
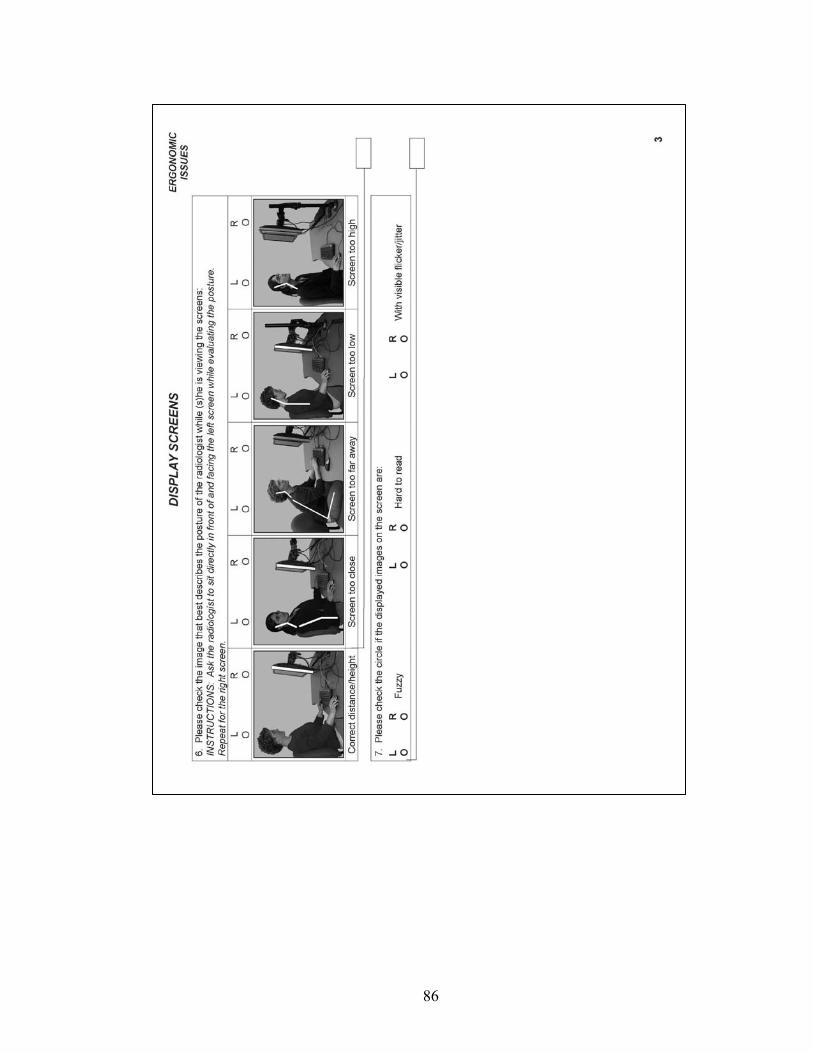
86
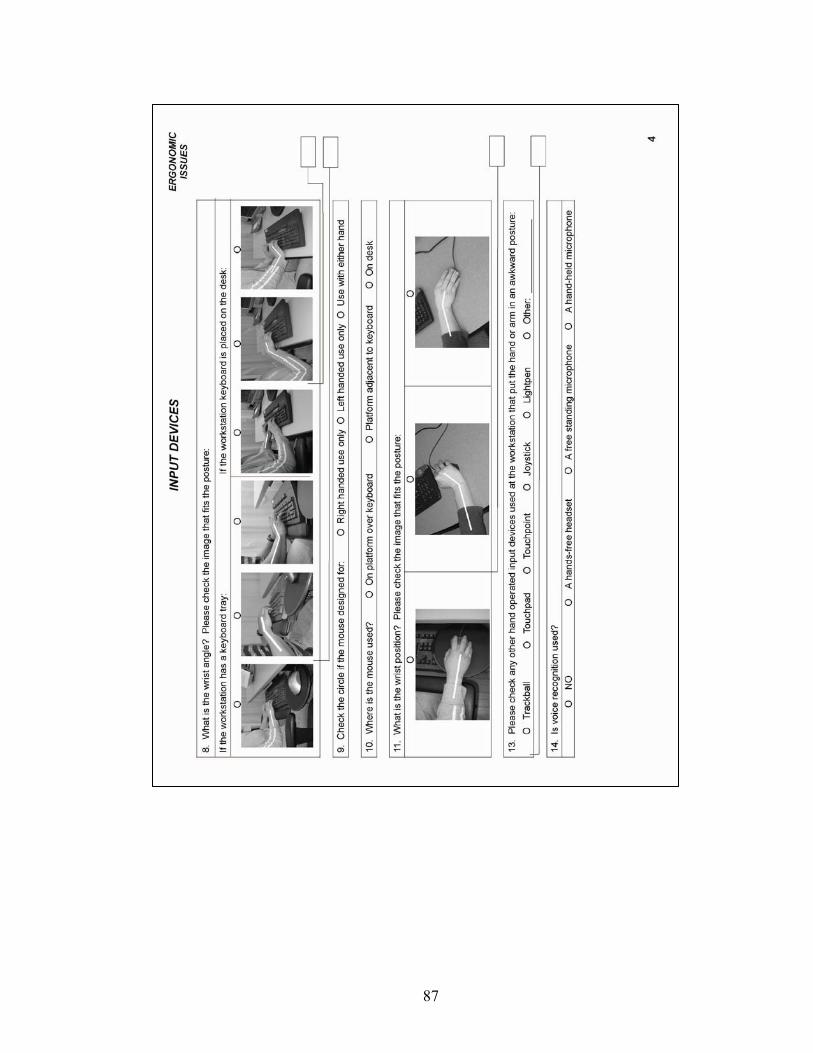
87
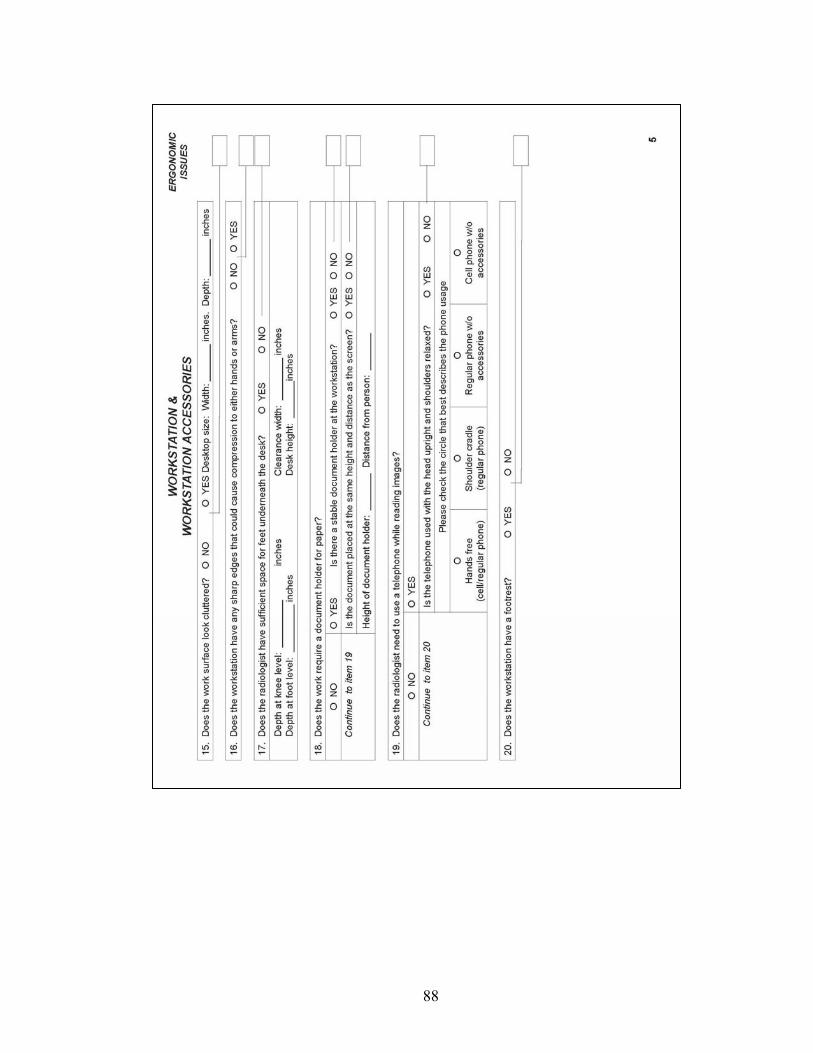
88
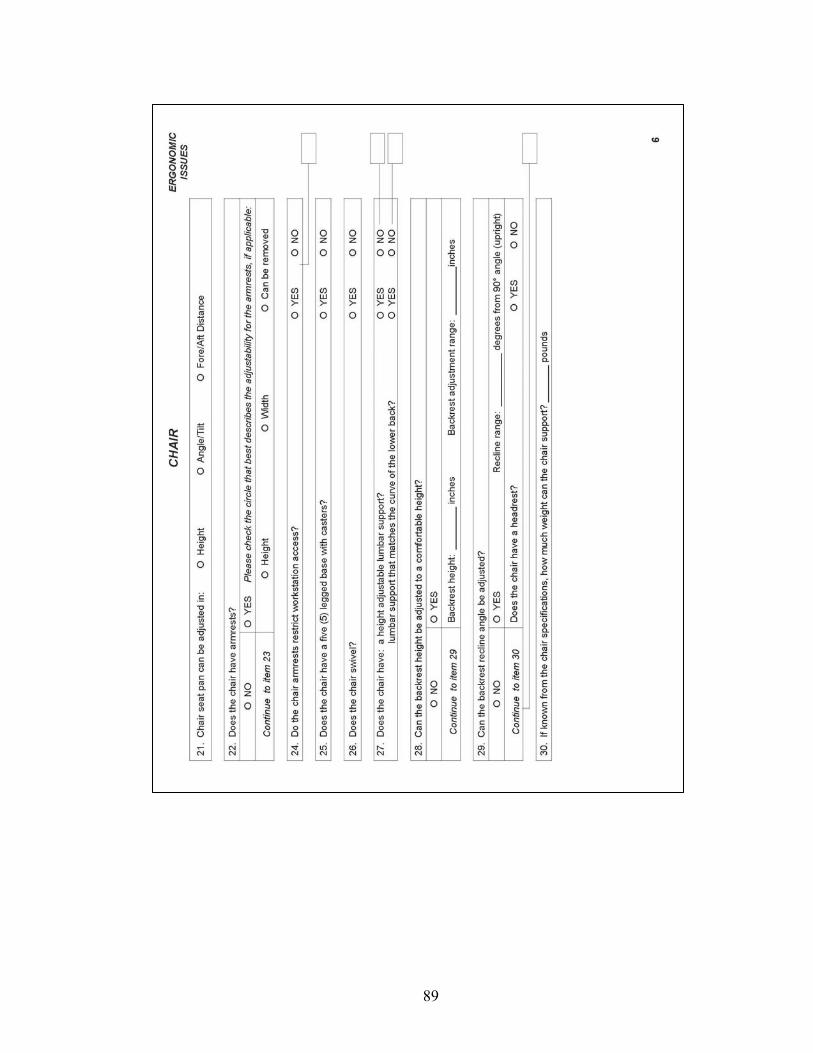
89
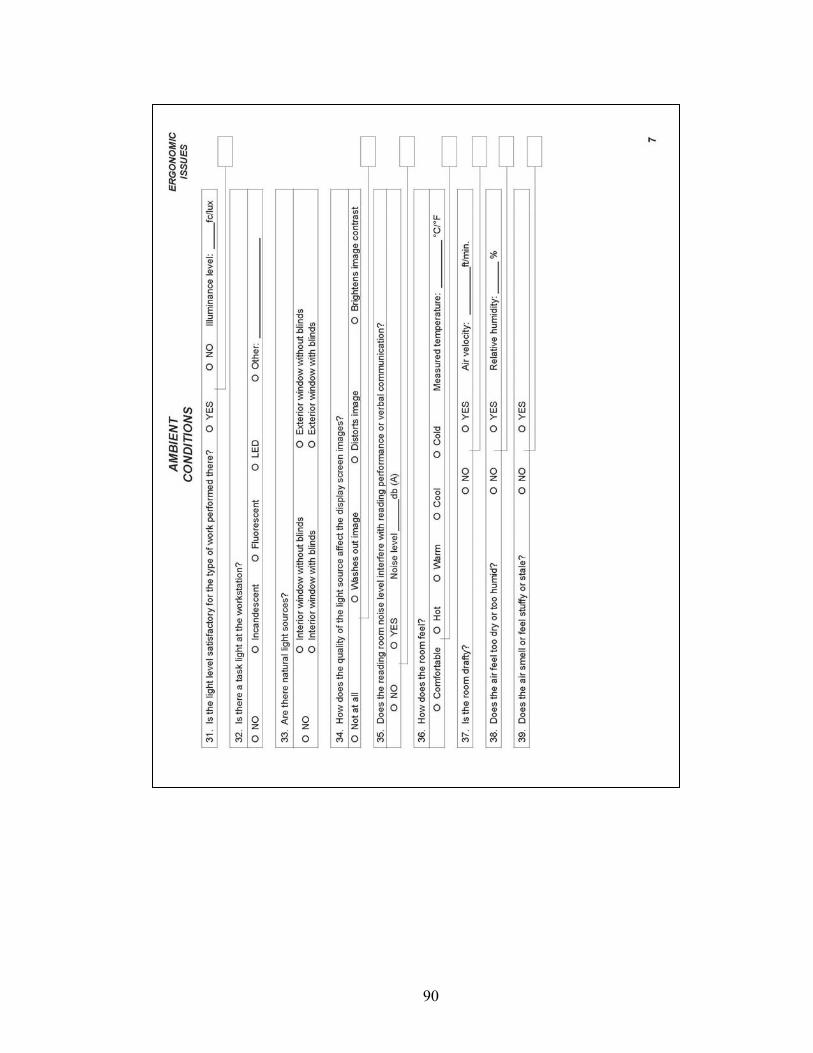
90
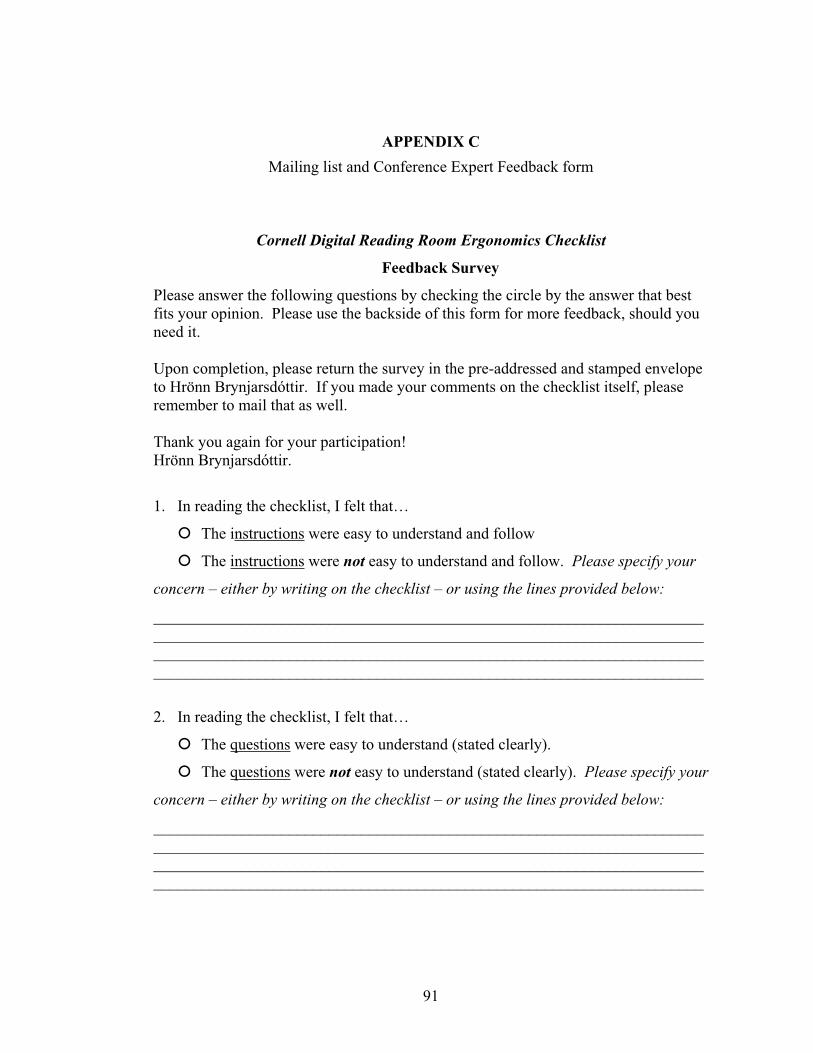
91
APPENDIX C
Mailing list and Conference Expert Feedback form
Cornell Digital Reading Room Ergonomics Checklist
Feedback Survey
Please answer the following questions by checking the circle by the answer that best fits your opinion. Please use the backside of this form for more feedback, should you need it.
Upon completion, please return the survey in the pre-addressed and stamped envelope to Hrönn Brynjarsdóttir. If you made your comments on the checklist itself, please remember to mail that as well.
Thank you again for your participation! Hrönn Brynjarsdóttir.
1. In reading the checklist, I felt that…
The instructions were easy to understand and follow
The instructions were not easy to understand and follow. Please specify your
concern – either by writing on the checklist – or using the lines provided below:
____________________________________________________________________________________________________________________________________________________________________________________________________________________________________________________________________________________
2. In reading the checklist, I felt that…
The questions were easy to understand (stated clearly).
The questions were not easy to understand (stated clearly). Please specify your
concern – either by writing on the checklist – or using the lines provided below:
____________________________________________________________________________________________________________________________________________________________________________________________________________________________________________________________________________________
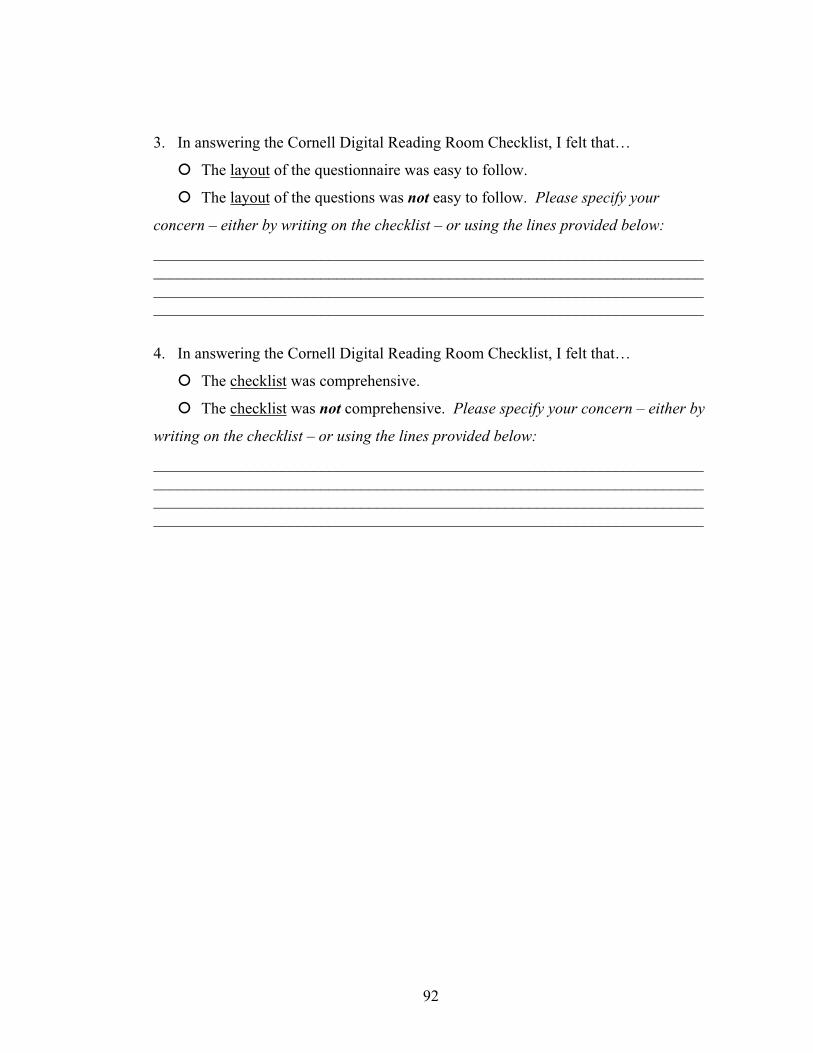
92
3. In answering the Cornell Digital Reading Room Checklist, I felt that…
The layout of the questionnaire was easy to follow.
The layout of the questions was not easy to follow. Please specify your
concern – either by writing on the checklist – or using the lines provided below:
____________________________________________________________________________________________________________________________________________________________________________________________________________________________________________________________________________________
4. In answering the Cornell Digital Reading Room Checklist, I felt that…
The checklist was comprehensive.
The checklist was not comprehensive. Please specify your concern – either by
writing on the checklist – or using the lines provided below:
____________________________________________________________________________________________________________________________________________________________________________________________________________________________________________________________________________________

93
APPENDIX D Letter to radiologists
April 20, 2006
Cornell Digital Reading Room Ergonomics Checklist
Dear Professor Smith, I am a graduate student in Ergonomics at Cornell University in Ithaca, New York, working with Professor Alan Hedge, PhD. I have developed the Cornell Digital Reading Room Ergonomics Checklist as a quick evaluation of the working environment of radiologists utilizing medical imaging techniques, and I am now looking for feedback on this instrument. Please take a look at this checklist, complete the short feedback form and return to me in the self-addressed and stamped envelope. I sincerely appreciate your valuable feedback and thank you for taking the time to participate in the creation of the Cornell Digital Reading Room Ergonomics Checklist. I would be thrilled to hear back from you via email; [email protected], if you have comments you would like to discuss further with me. Thank you again.
Sincerely,
Hrönn Brynjarsdóttir
Department of Design and Environmental Analysis E104 Martha Van Rensselaer Hall Ithaca, 14853-4401 t. 607.255.2144 f. 607.255.0305

94
APPENDIX E
Images used for item testing (resized).
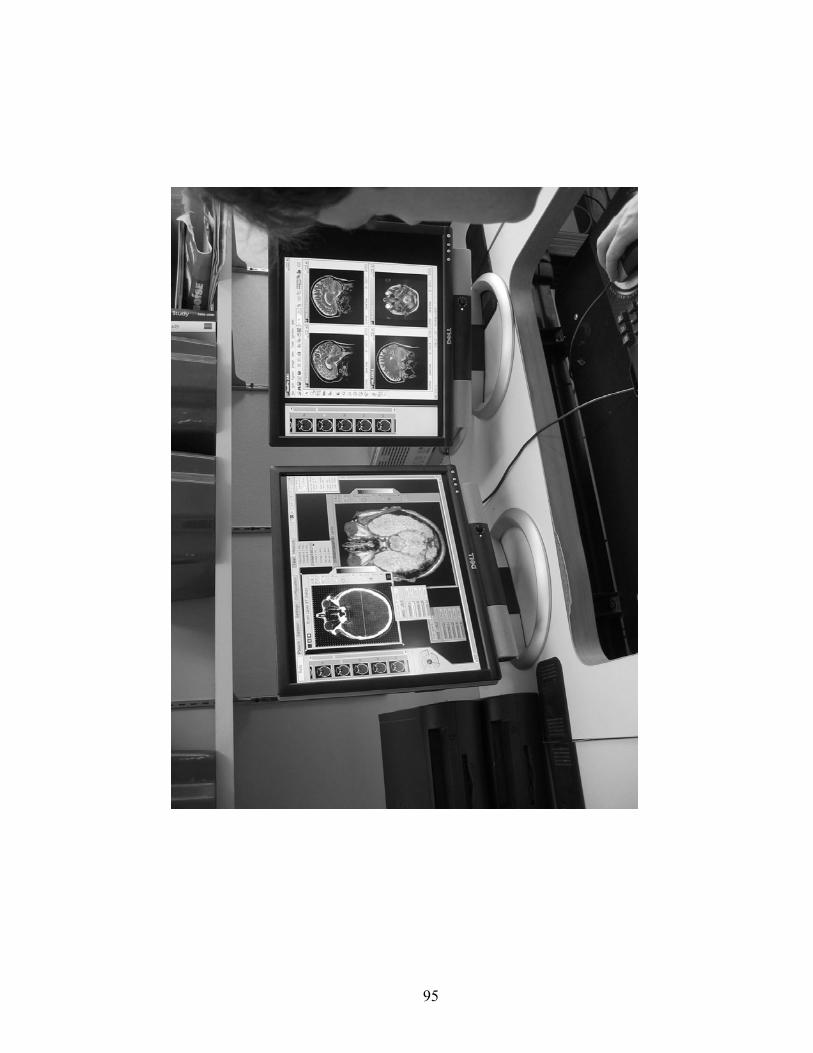
95
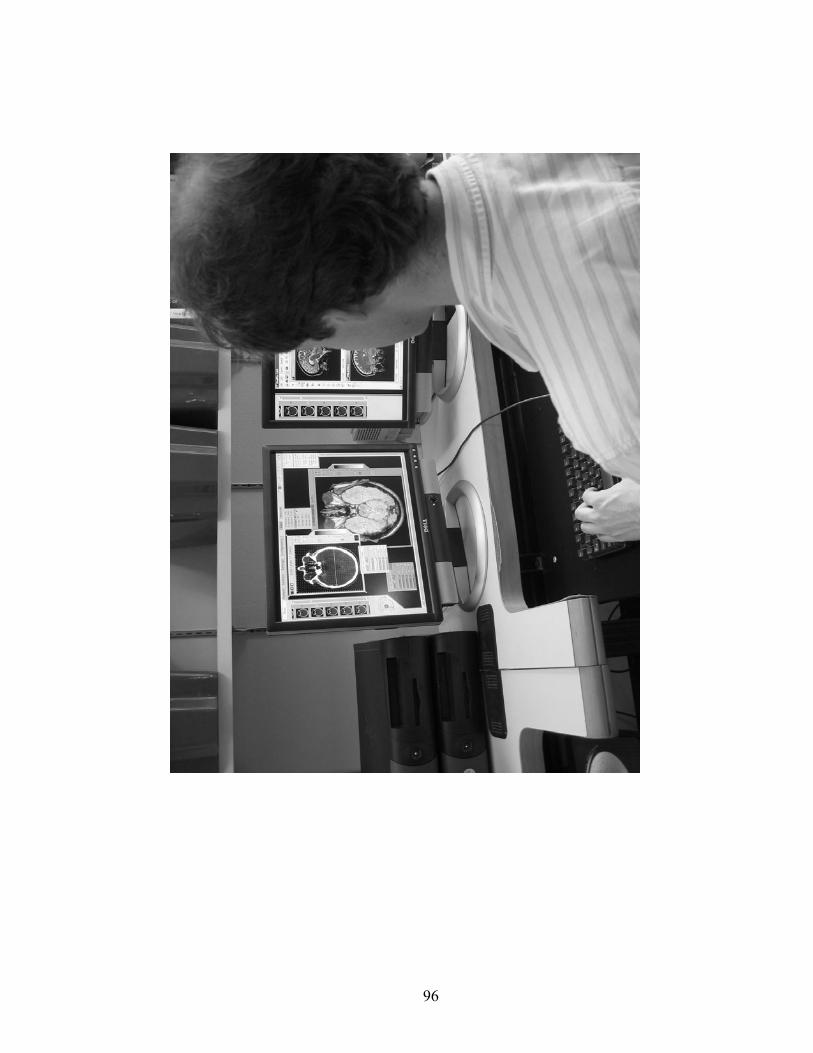
96
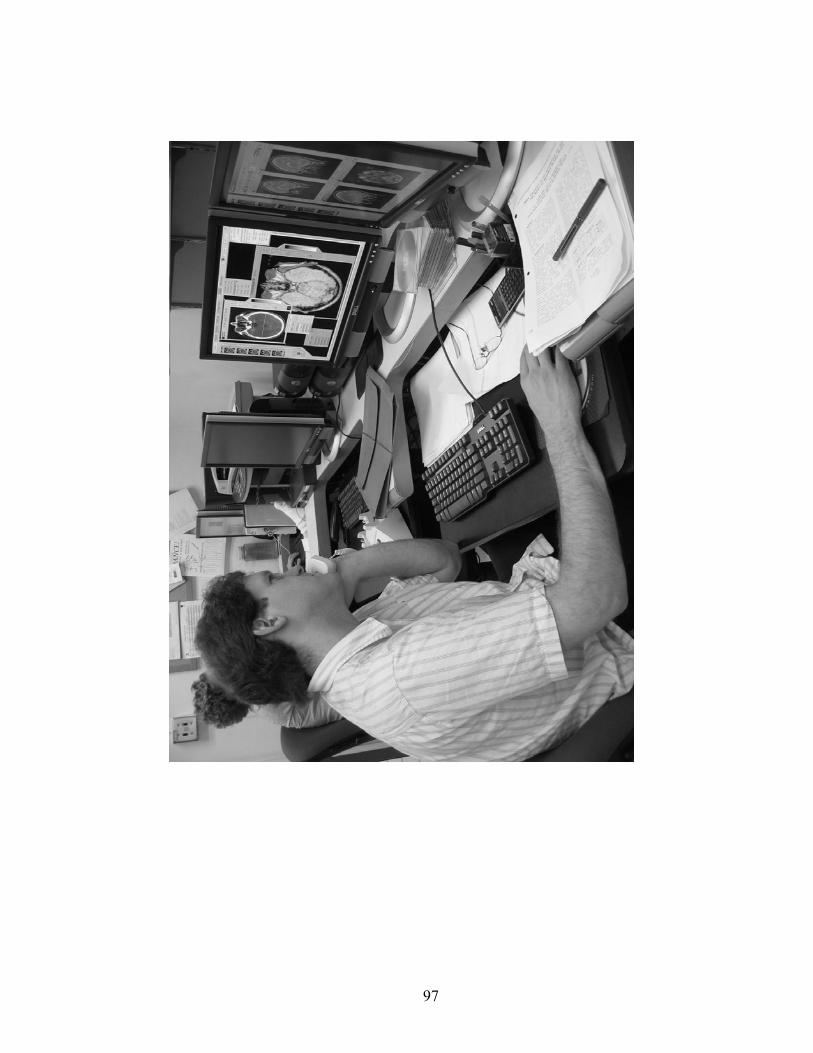
97
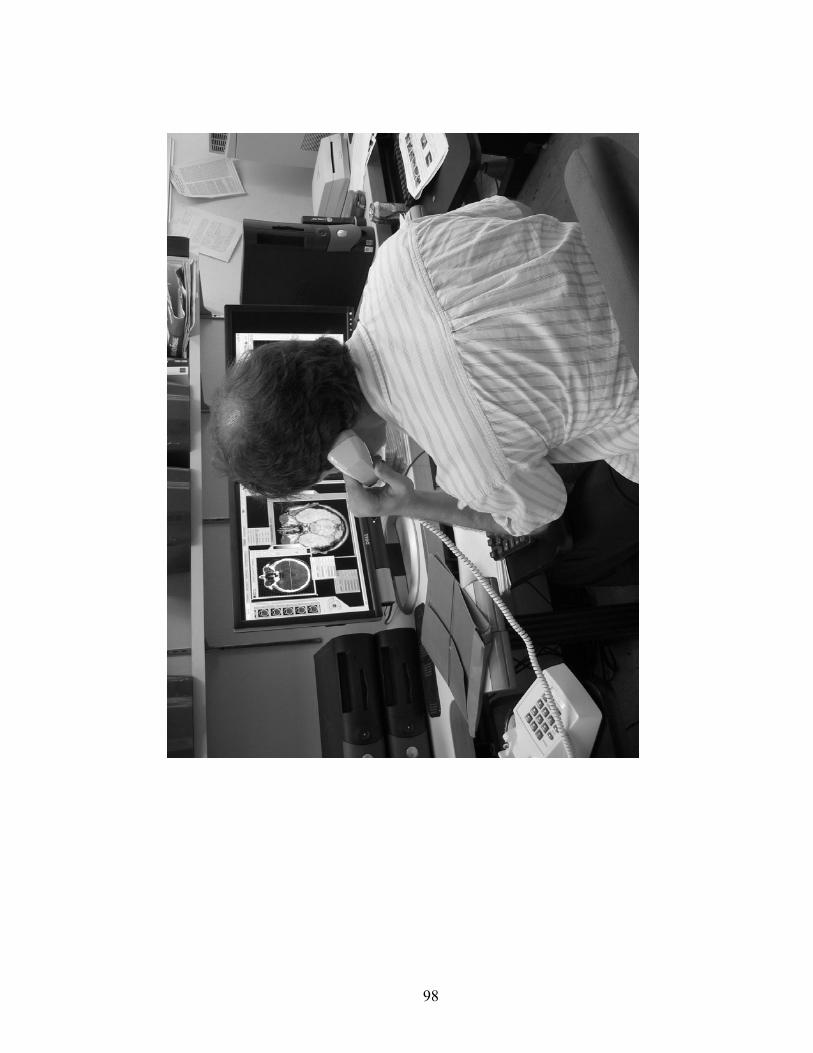
98
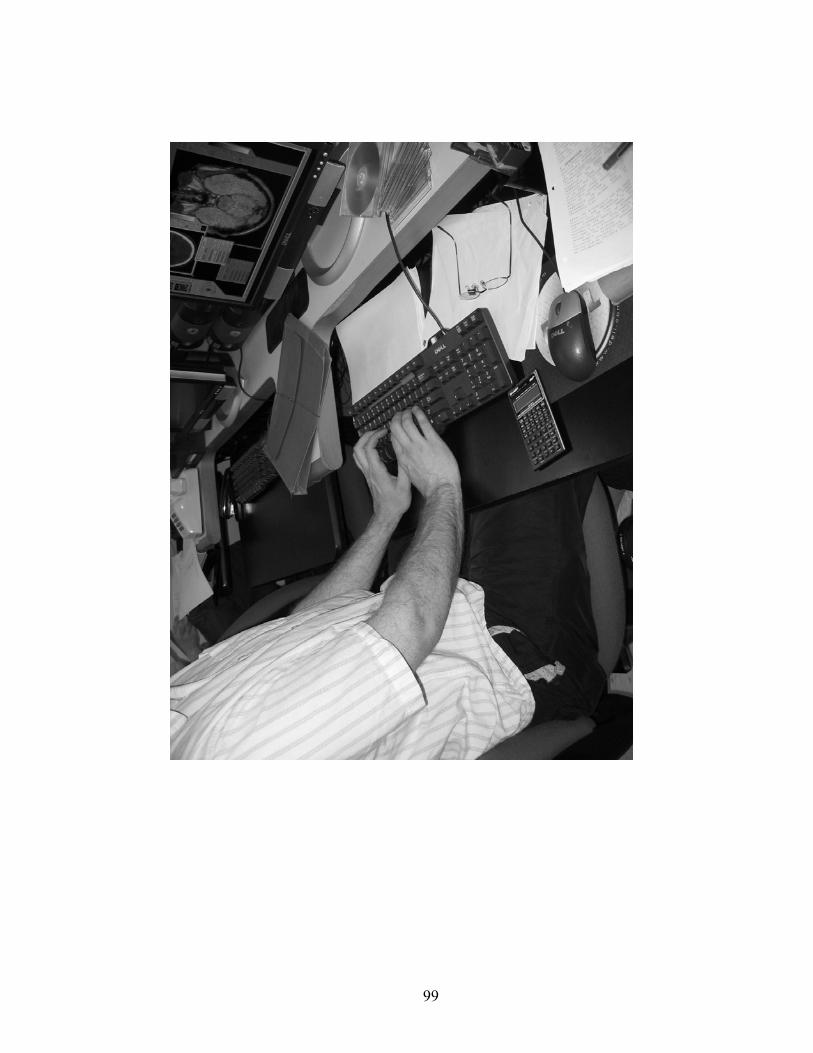
99
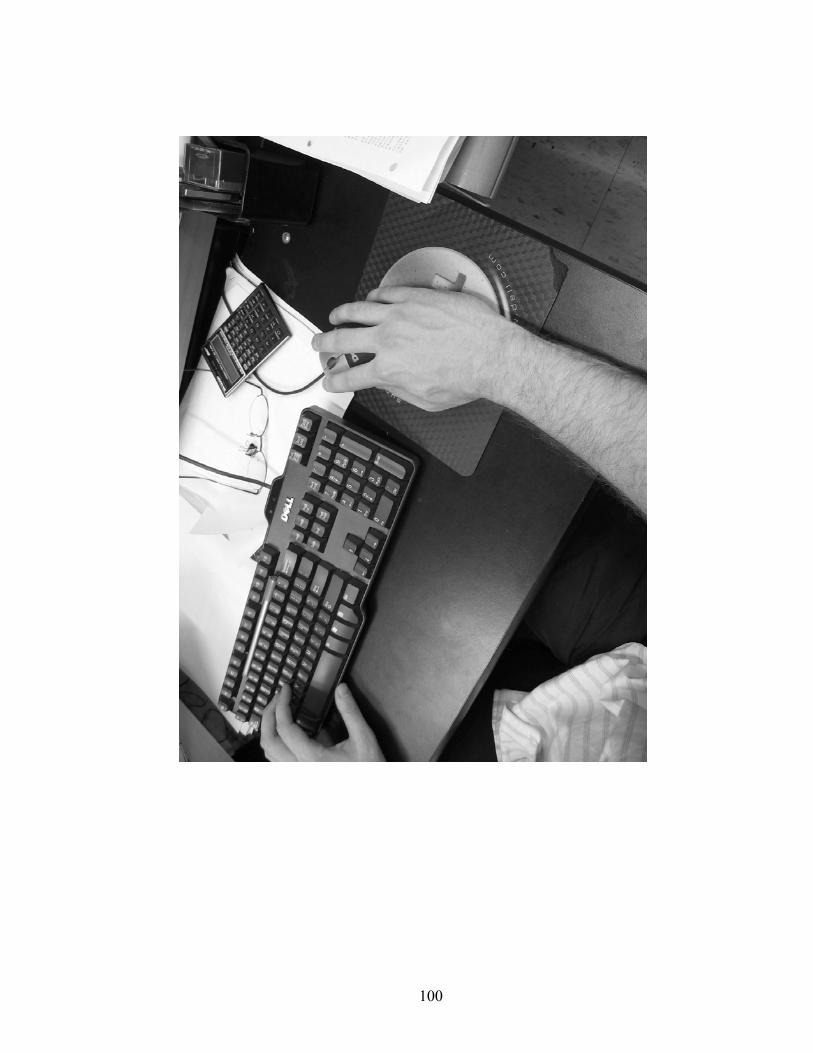
100
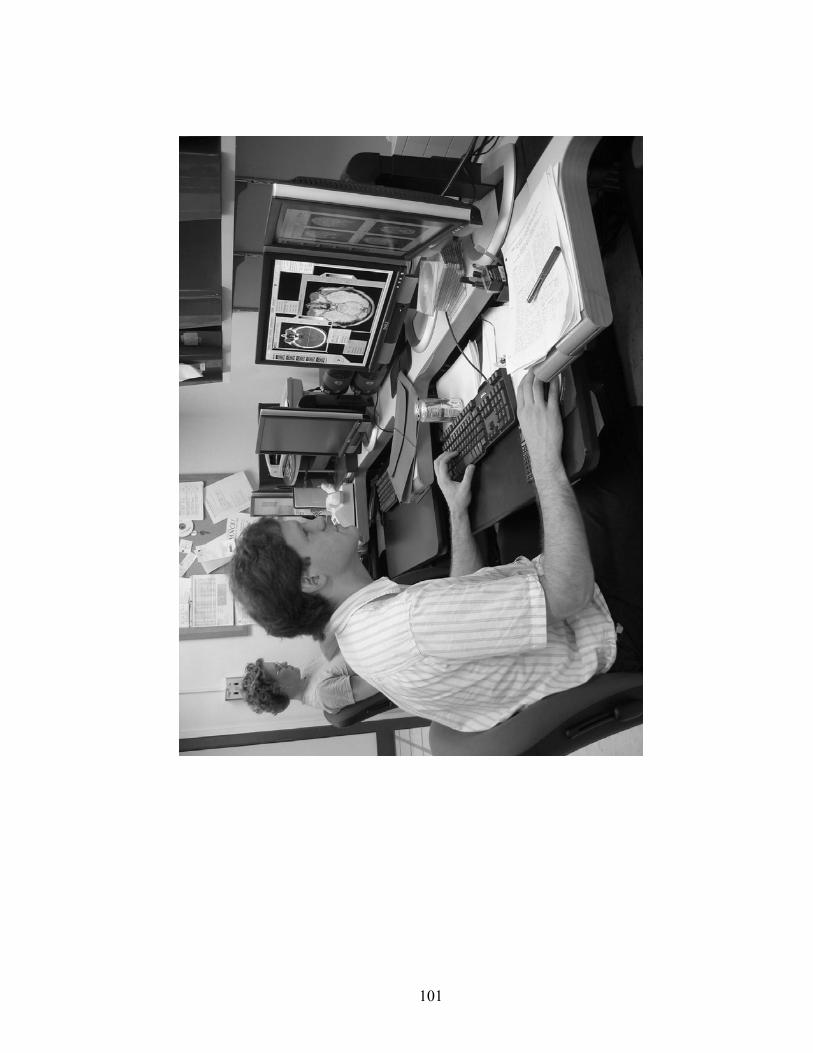
101
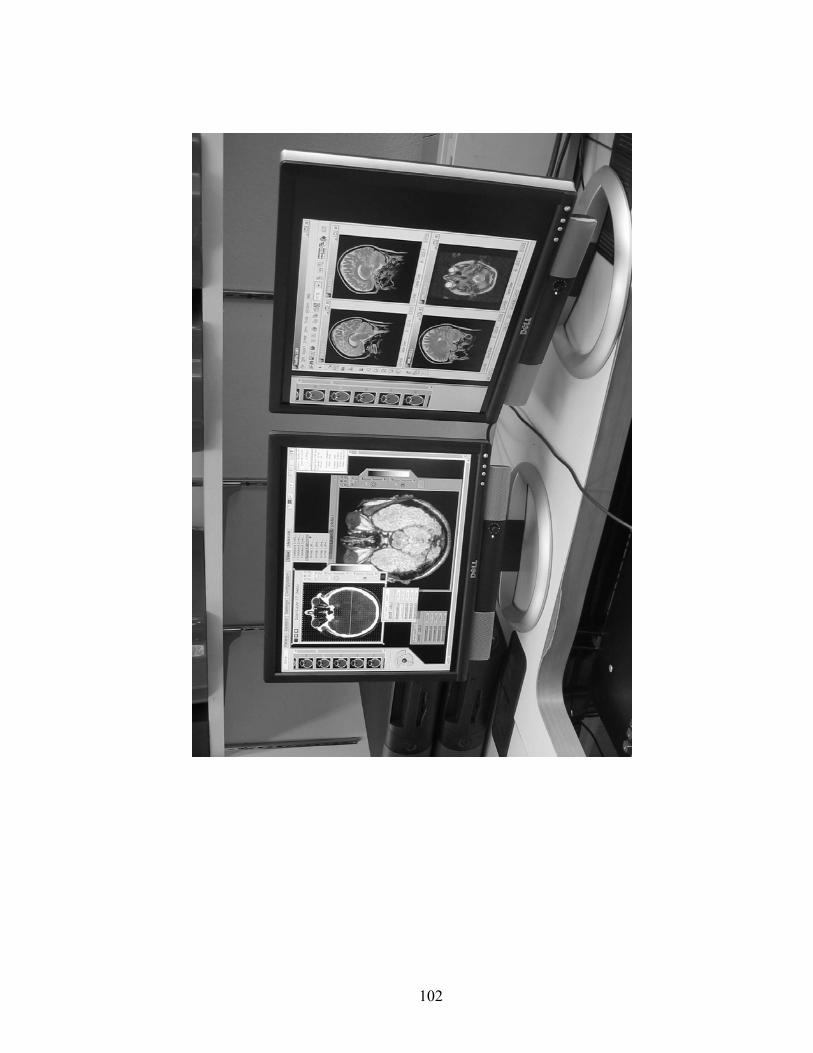
102
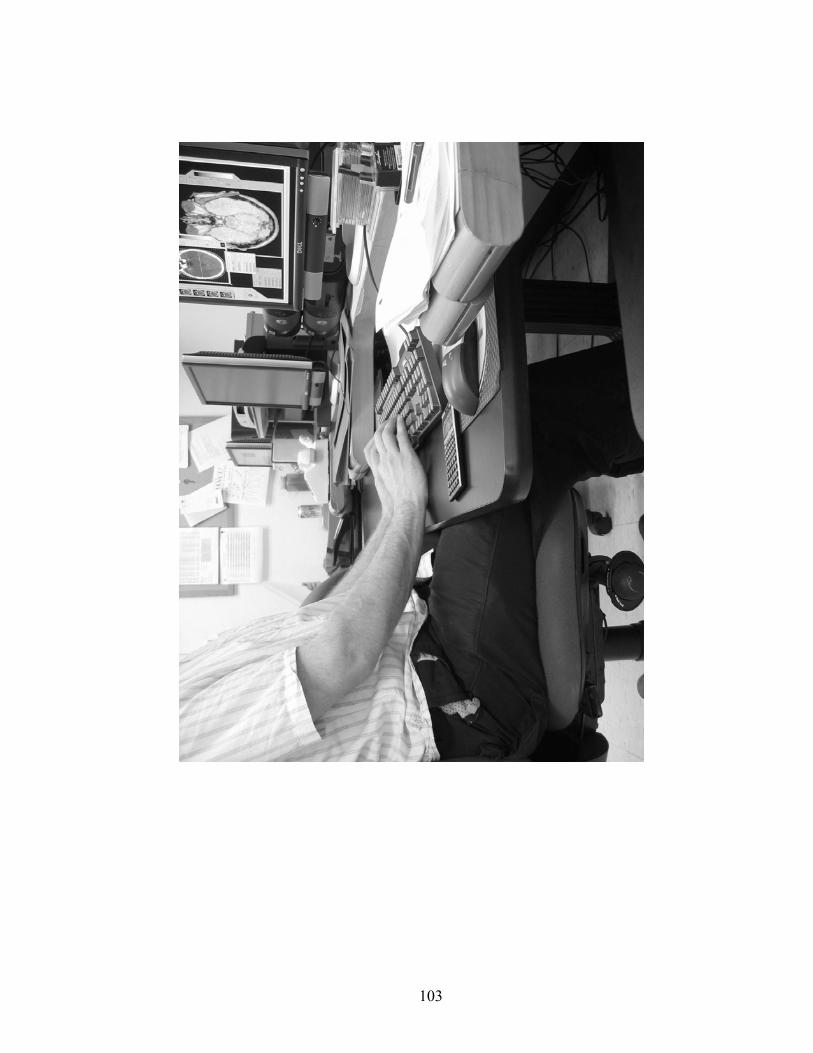
103
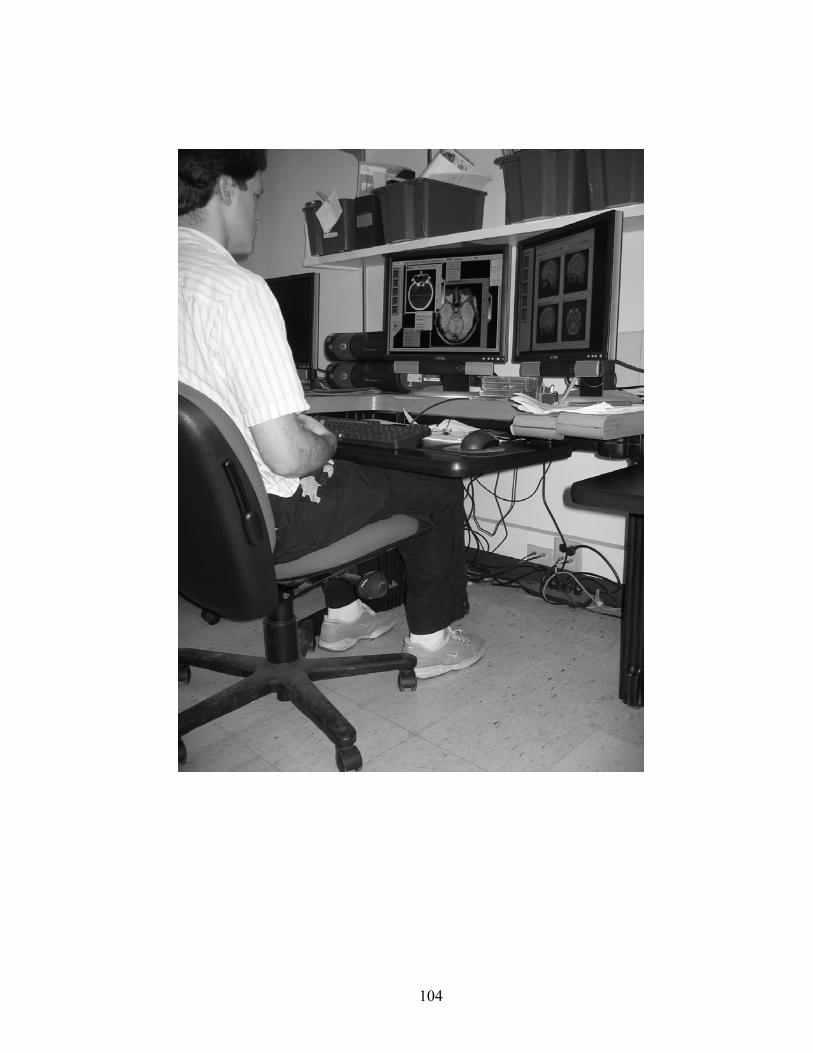
104
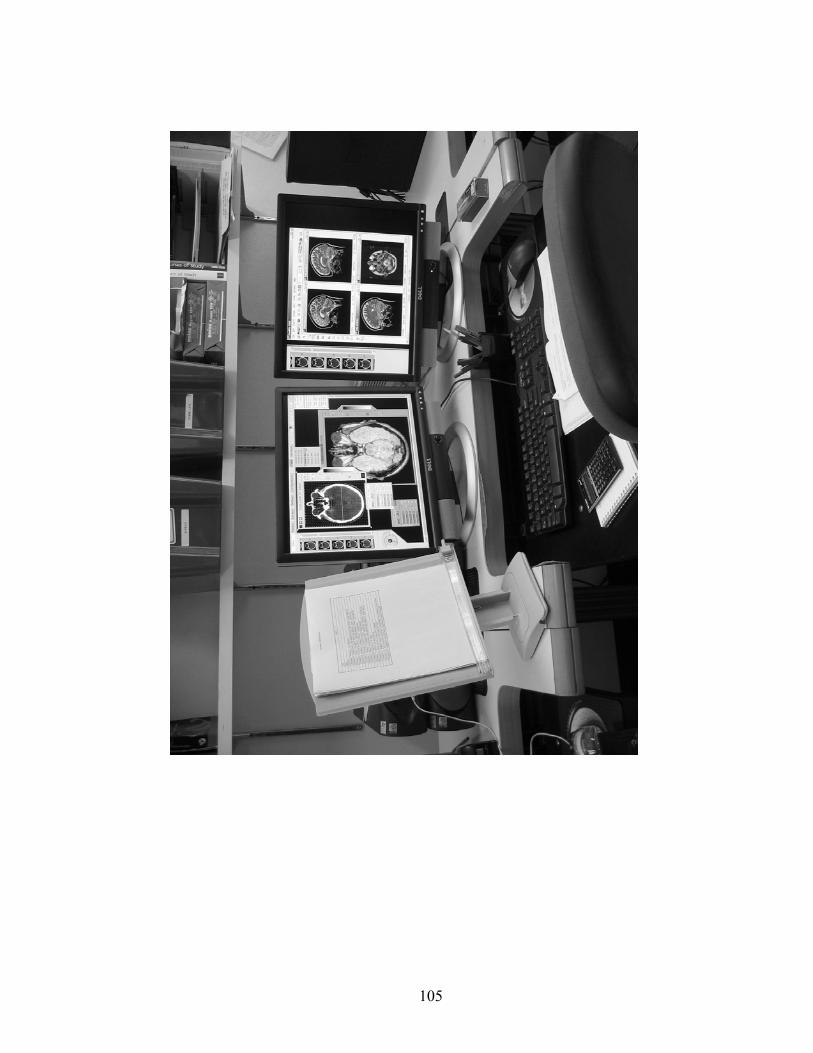
105

106
APPENDIX F
Instructions for the individual item test
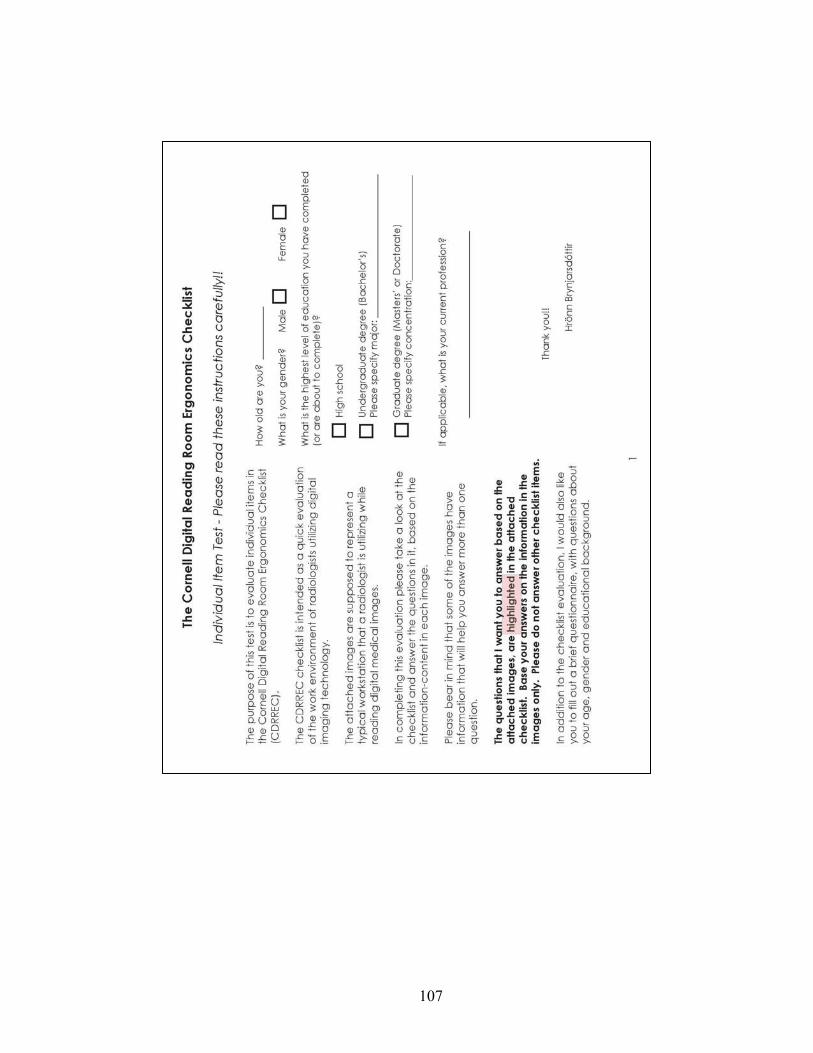
107

108
APPENDIX G
The Cornell Digital Reading Room Ergonomics Checklist Final Version
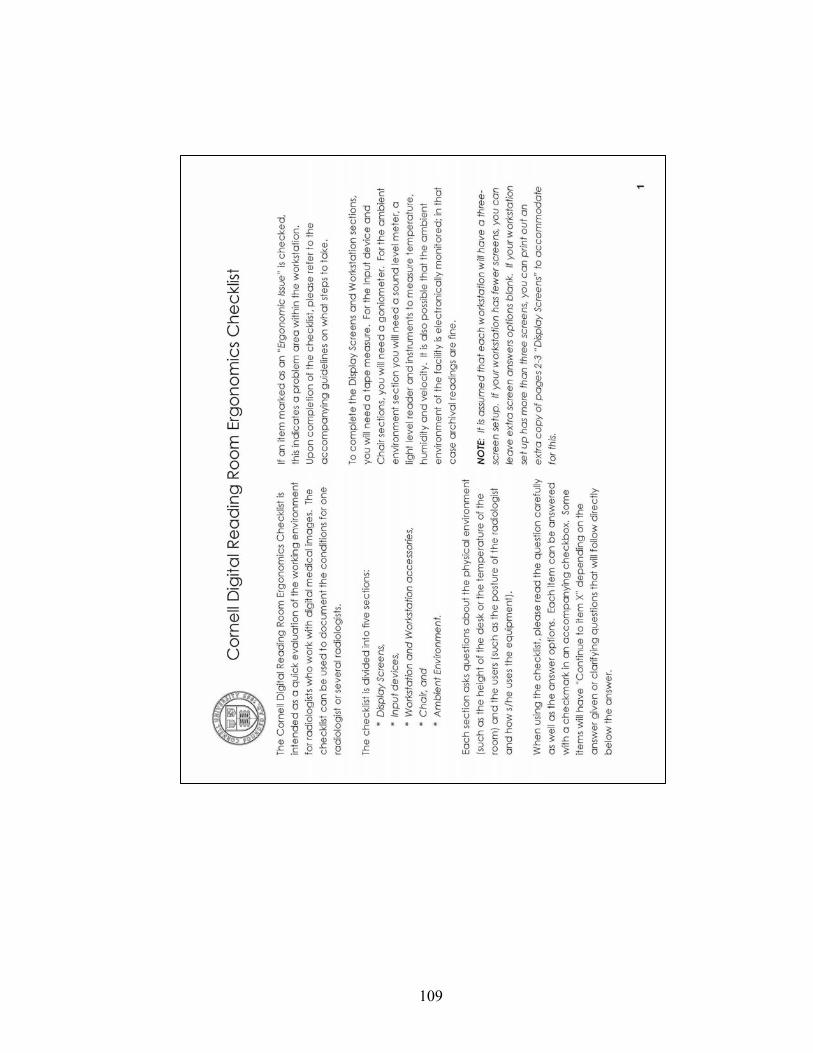
109
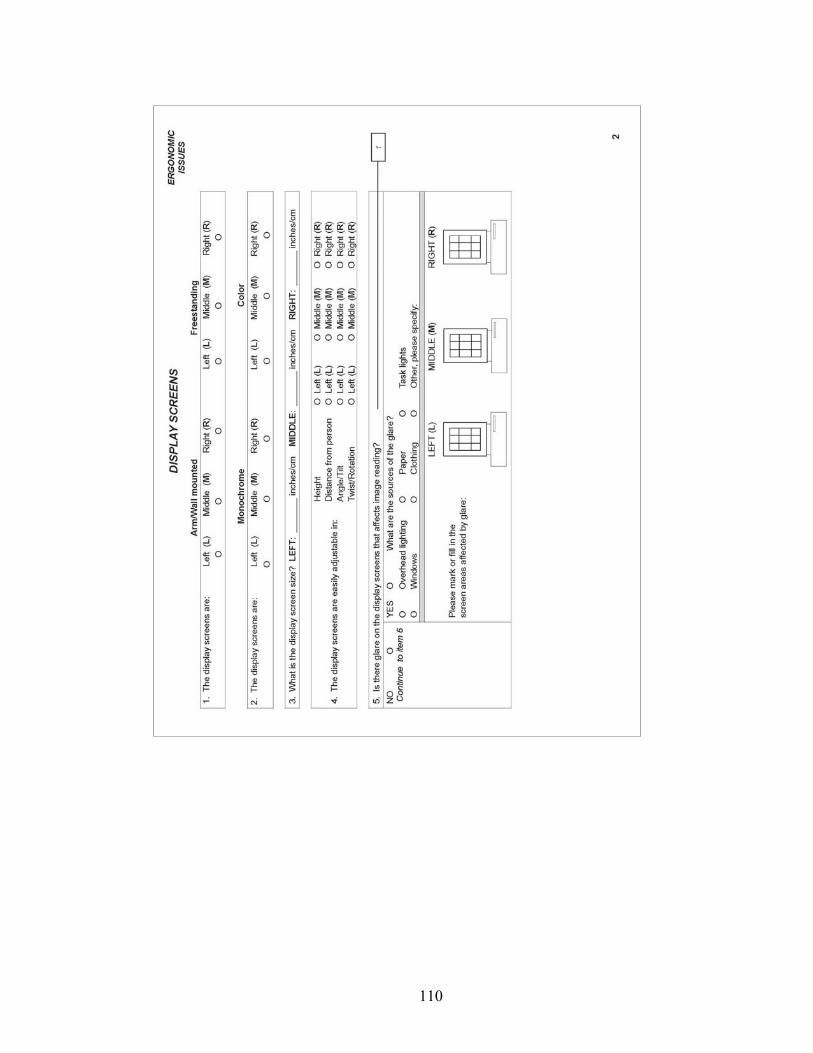
110
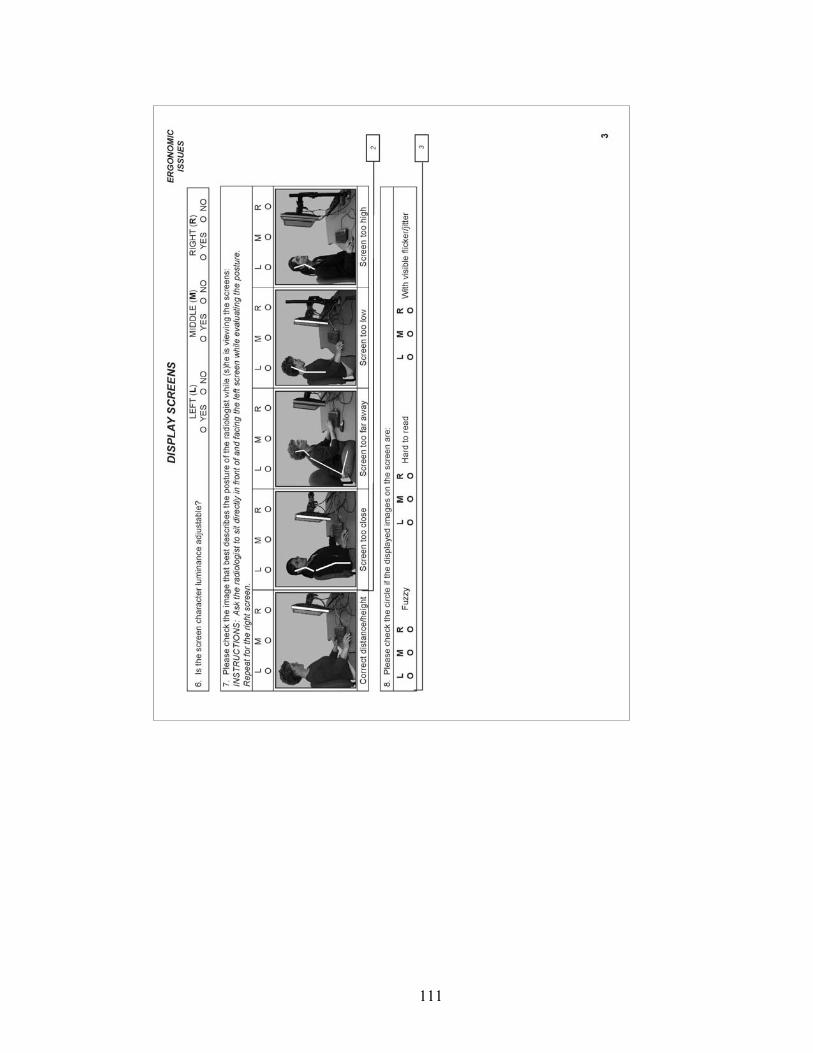
111
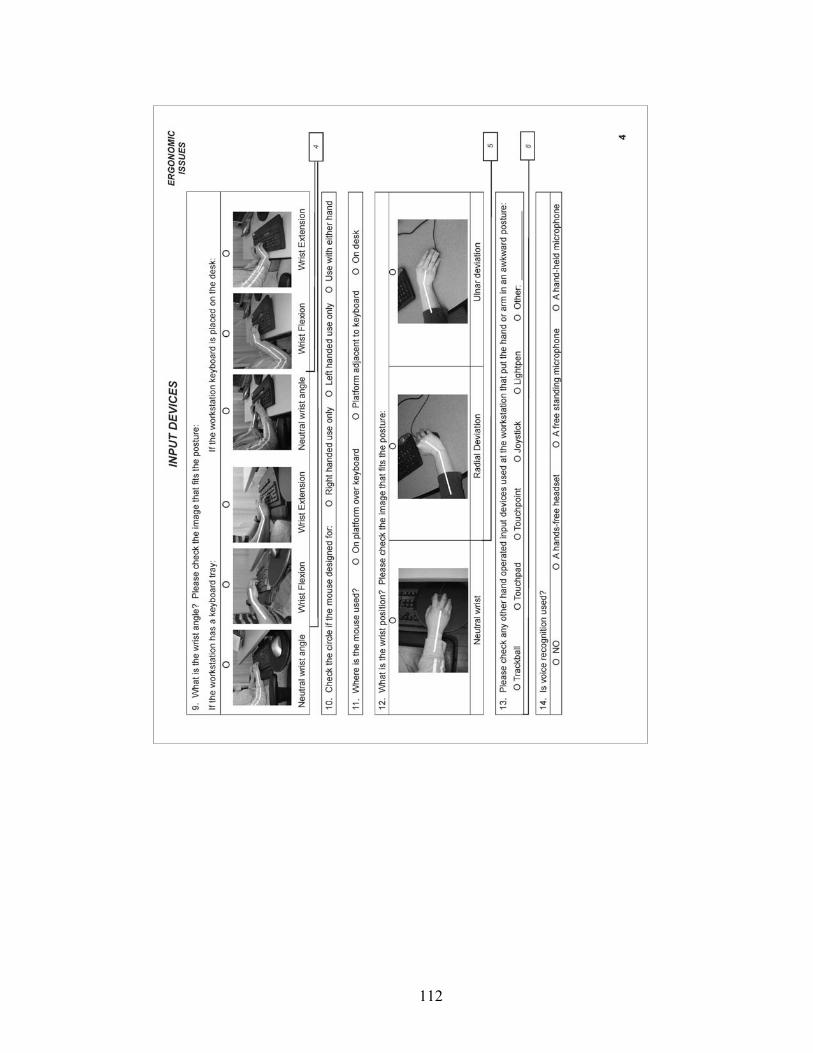
112
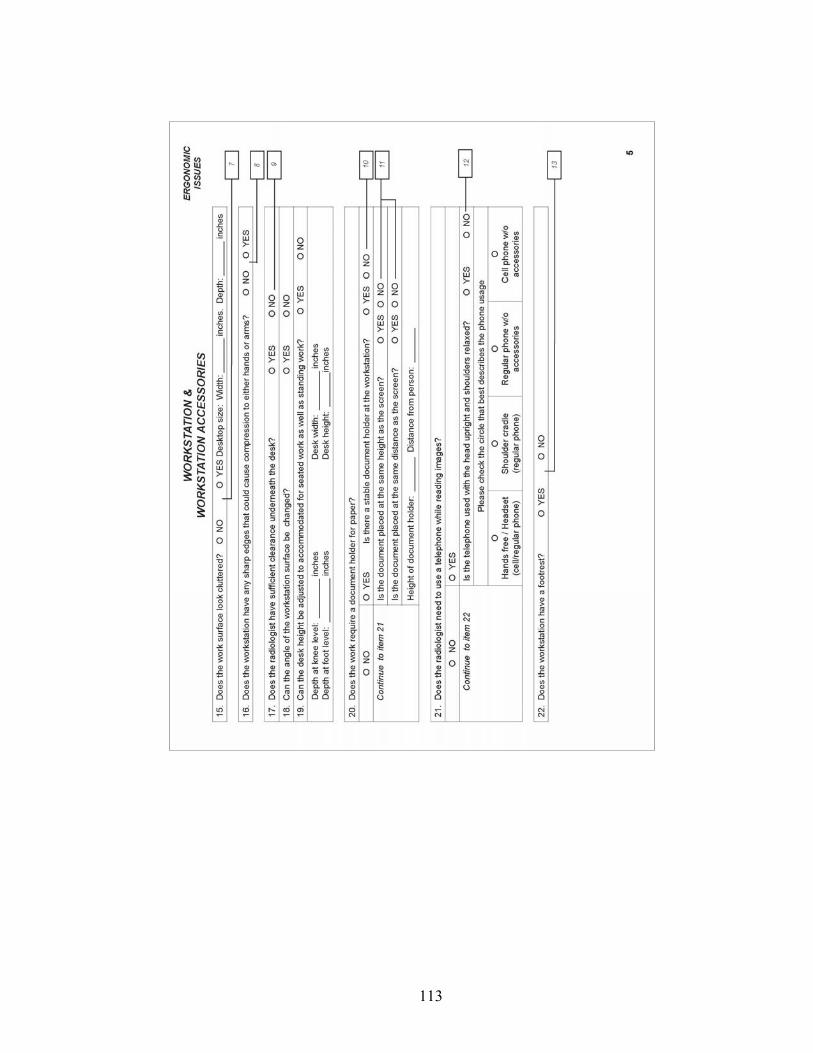
113
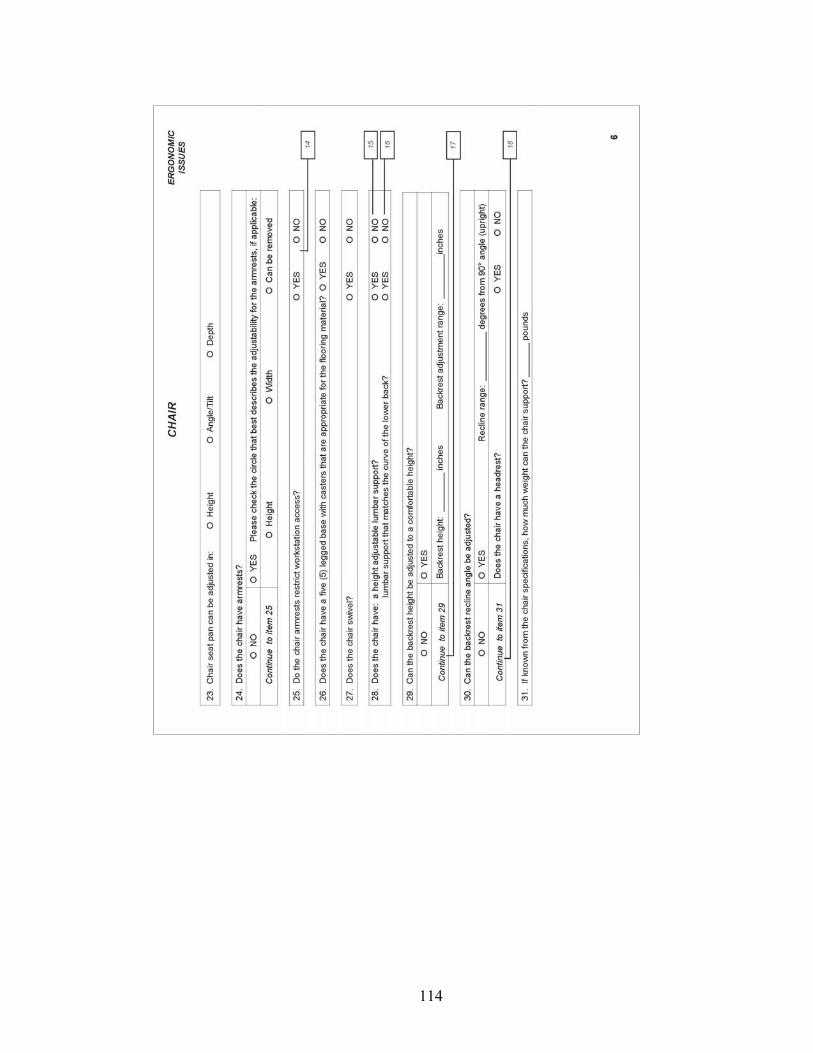
114
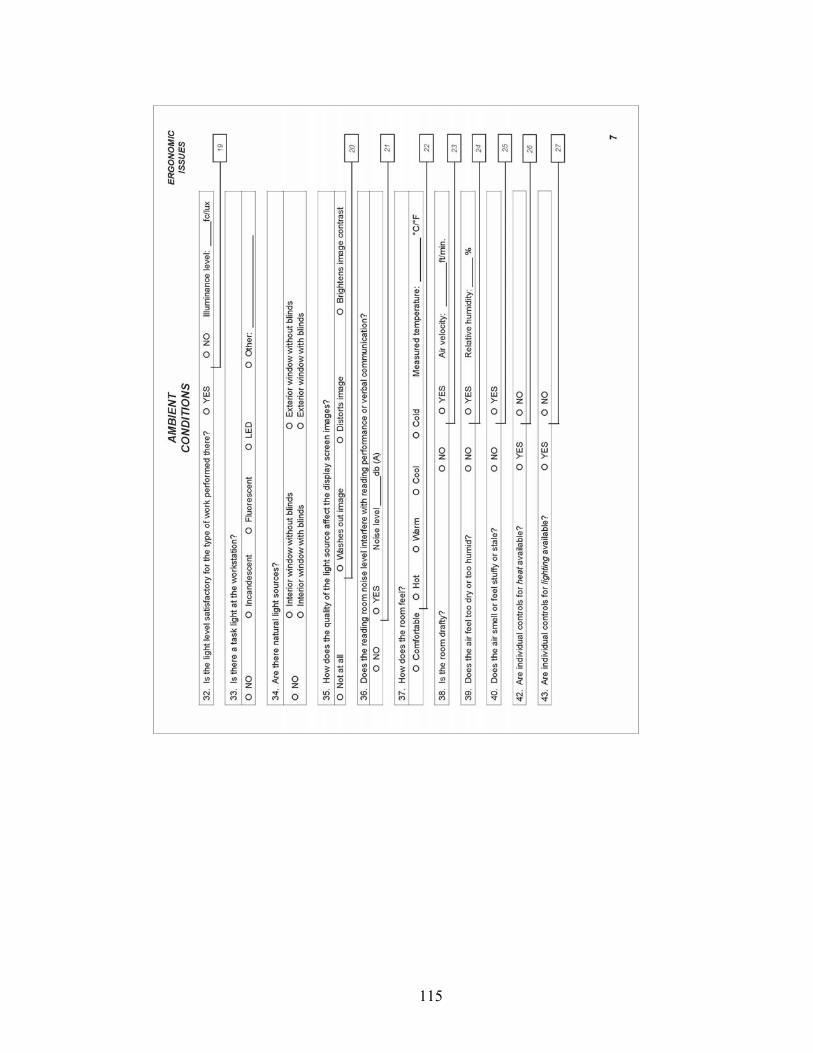
115
116
REFERENCES
Aarås, A., Horgen, G., Bjørset, H., Ro, O., and Thoresen, M. (1998). Musculoskeletal,
visual and psychosocial stress in VDU operators before and after
multidisciplinary ergonomic interventions. Applied Ergonomics, 29(5), 335-
354.
American Association of Physicists in Medicine (AAPM) (2005). Assessment of
display performance for medical imaging systems. College Park, MD:
Author.
Accot, J., and Zhai, S. (1997). Beyond Fitt’s Law: Models for Trajectory-Based HCI
Tasks. In Proceedings of the SIGCHI conference on Human factors in
computing systems, (295-302). New York: ACM Press.
Ahlstrom, V., Longo, K. (2003). HUMAN FACTORS DESIGN STANDARD (HFDS):
For Acquisition of Commercial Off-The-Shelf Subsystems, Non-Developmental Items,
and Developmental Systems. Atlantic City International Airport, NJ: U.S.
Department of Transportation.
Andriole, K.P. (2003). Addressing the Coming Radiology Crisis: The Society for
Computer Applications in Radiology Transforming the Radiological
Interpretation Process (TRIPTM) Initiative. A Position Paper from the SCAR
TRIPTM Subcommittee of the SCAR Research and Development committee.
SCARNET. Retrieved December 12, 2005, from http://www.scarnet.net/trip
html/ Publications.htm
117
Ankrum, D.R., and Nemeth, K.J. (April, 1995). Posture, Comfort and Monitor
Placement. Ergonomics in design, 7-9
Babski-Reeves, K., Stanfield, J., and Hughes, L. (2005). Assessment of video display
workstation set up on risk factor associated with the development of low back
and neck discomfort. International Journal of Industrial Ergonomics, 35(7),
593-604.
Banbury, S.P., and Berry, D.C. (2005). Office noise and employee concentration:
Identifying causes of disruption and potential improvements. Ergonomics,
48(1), 25-37.
Bennett, W.F., Vaswani, K.K., Mendiola, J.A., and Spigos, D.G. (2002). PACS
Monitors: An Evolution of Radiologists’ Viewing Techniques. Journal of
Digital Imaging, 15(1), 171-174.
Bramson, R.T., and Bramson, R.A. (2005). Overcoming Obstacles to Work-Changing
Technology Such as PACS and Voice Recognition. American Journal of
Roentenology, 184, 1727-1730.
Brodie, D., and Wells, R. (1997). An Evaluation of the Utility of Three Ergonomics
Checklists for Predicting Health Outcomes in a Car Manufacturing
Environment. In: Proceedings of the 29th Annual Conference of the Human
Factors Association of Canada – 1997, 45-52.
118
Bryan, R.N. (2003). The Digital rEvolution: The Millennial Change in Medical
Imaging (President's Address). Radiology, 229, 299-304
Çakir, A.E. (2002). Concurrent Use of Input Devices - Relief or Overload? In
Luczak, H., Çakir, A.E., and Çakir, G. (Eds.), Proceedings of the Conference
WWDU 2002 World Wide Work, May 22-25, 2002. (pp. 637-640). Berlin:
Ergonomic Institut für Arbeits- und Sozialforschung Forschungsgesellschaft
mbH.
Canadian Standards Association (CSA) International (2000). CSA-Z412 Guideline on
Office Ergonomics. Toronto: CSA International.
Carter, J.B., and Banister, E.W. (1994). Musculoskeletal problems in VDT work: a
review. Ergonomics, 37(10), 1623-1648.
Charles, K.E., Danforth, A.J., Veitch, J.A., Zwierzchowski, C., Johnson, B., and Pero,
K. (2004) Workstation Design for Organizational Productivity (NRCC-
47343F). Retrieved June 13, 2005, from http://irc.nrc-
cnrc.gc.ca/ie/productivity/ index_e.html
Corlett, E.N. (2002). The evaluation of posture and its effects. In J.R. Wilson, and
E.N. Corlett (Eds), Evaluation of human work (662-713). Philadelphia, PA:
Taylor & Francis.
119
Hendrick (Eds.), Handbook of Human Factors and Ergonomics Methods (pp. 2.1-2.4).
New York: CRC Press
Dakins, D.R., and Page, D. (2004, February). Design avoids injuries, increases
productivity. Diagnostic Imaging. Retrieved April 4, 2005, from:
http://www.dimag.com/db_area /archives/2004/0401. PACS1.di.shtml.
Dempsey, P.G., McGorry, R.W., and Maynard, W.S. (2005). A survey of tools and
methods used by certified professional ergonomists. Applied Ergonomics,
36(5), 489-503.
Engkvist, I., Hagberg, M., Wigaeus-Hjelm, E., Menckel, E., Ekenvall, L., and PROSA
Study Group (1995). Interview protocols and ergonomics checklist for
analyzing overexertion back accidents among nursing personnel. Applied
Ergonomics, 26(3), 213-220.
Fagarasanu, M., and Kumar, S. (2003). Carpal tunnel syndrome due to keyboarding
and mouse tasks: a review. International Journal of Industrial Ergonomics,
31(2), 119-136.
Flegal, K.M., Carroll, M.D., Kuczmarski, and Johnson, C.L. (1998). Overweight and
obesity in the United States: prevalence and trends, 1960-1994. International
Journal of Obesity, 22, 39-47.
120
Fosterwold, K.I. (2003). VDU work with downward gaze: the emperor's new clothes
or scientifically sound? International Journal of Industrial Ergonomics, 31(3),
161-167.
Fratt, L. (2005). Redesigning the Reading Room. Health imaging & IT, April, 20-26.
Retrieved May 6, 2005, from http://healthimaging.mmprove.com/ViewArticle.
aspx?ArticleID=2322
Gerr, F., Marcus, M., Ortiz, D., White, B., Jones, W., Cohen. S., Gentry, E., Edwards,
A., and Bauer, E. (2000). Computer User’s Postures and Associations with
Workstation Characteristics. American Industrial Hygiene Association
Journal, 61(2), 223-230.
Goo, J.M., Choi, J.Y., Im, J.G., Lee, H.J., Chung, M.J., Han, D., Park, S.H., Kim, J.H.,
and Nam, S.H. (2004). Effect of Monitor Luminance and Ambient Light on
Observer Performance in Soft-Copy Reading of Digital Chest Radiographs.
Radiology, Sep 2004; 232: 762 - 766. Retrieved on April 25, 2005, from
http://radiology.rsnajnls.org/cgi/reprint/232/3/762
Grandjean, E. (1983). Ergonomics of VDUs: review of present knowledge. In
Grandjean, E., and Vigliani, E. (Eds.), Ergonomic Aspects of Visual Display
Terminals (pp. 1-12). London: Taylor & Francis Ltd
Haramati, N., and Fast, A. (February, 2005). Ergonomic Soft Copy Reading. Imaging
Economics. Retrieved on August 21, 2006, from: http://www.imaging
economics.com/issues/articles/2005-02_04.asp
121
Harisinghani, M.G., Blake, M.A., Saksena, M., Hahn, P.F., Gervais, D., Zalis, M.,
Fernandes, L.S.D., and Mueller, P.R. (2004). Importance and Effects of
Altered Workplace Ergonomics in Modern Radiology Suites. Radiographics,
Mar-Apr;24(2):615-27. Retrieved on September 10, 2005, from
http://radiographics.rsnajnls.org/cgi/reprint/24/2/615
Hedge, A. (2000). Where are we in understanding the effects of where we are?
Ergonomics, 43(7), 1019-1029.
Hedge, A. (2005). Physical Methods. In N. Stanton, A. Hedge, K. Brookhuis, E.
Salas, & H. Hendrick (Eds.), Handbook of Human Factors and Ergonomics
Methods (pp. 2.1-2.4). New York: CRC Press.
Hendee, W.R, Brown, E.F., Stanley, R.J., Thrall, J.H., and Zylak C.J. (1994).
Colliding Forcers in Radiology: Technologic Imperative, Resource
Limitations, and Accountability Demands. Radiographics, 14, 647-653.
Hignett, S., and McAtamney, L. (2000). Rapid Entire Body Assessment. Applied
Ergonomics, 31(2), 201-205.
Horii, S.C. (1992). Electronic Imaging Workstations: Ergonomic Issues and the User
Interface. Radiographics, 12, 773-787.
Horii, S.C. (1999a). Clinical aspects of workstation design and operation, in Siegel,
E.L., and Kolodner, R.M. (Eds.) Filmless Radiology (pp. 254-273). New
York: Springer Verlag.
122
Horii, S.C. (1999b). Workstation functions and system capabilities, in Siegel, E.L.,
and Kolodner, R.M. (Eds.) Filmless Radiology (pp. 277-295). New York:
Springer Verlag.
Horii, S.C. (2002). Workstations. In Dreyer, K.J., Mehta, A., Thrall, J.H. (Eds.)
PACS: a guide to the digital revolution (pp. 191-235)
Horii, S.C., Horii, H.N., Mun, S.K., Benson, H.R., and Zeman. R.K. (2003).
Environmental Designs for Reading from Imaging Workstations: Ergonomic
and Architectural Features. Journal of Digital Imaging, 16(1), 124-131.
Retrieved September 10, 2005, from http://www.springerlink.com/media/
2g540x5uul7vtjfmhqvl/contributions/g/n/l/u/gnlua0ajj29cyk91.pdf
Horii, S.C., Kundel, H., Redfern, R., Lowe, R., Nodine, C., Abbuhl, S., Phelan, M.,
Arnold, D., Myers, M. Brikman, I., and Mezrich, R. (2000). PACS
worstations in the emergency department: Impact on workflow in radiology
and emergency medicine. In Blaine, G.J., and Siegel, E.L. (Eds.), Medical
Imaging 2000: PACS Design and Evaluation: Engineering and Clinical
Issues (pp. 196-203). San Diego: SPIE.
Human Factors and Ergonomics Society (HFES) (2002). Human Factors Engineering
of Computer Workstations (BSR/HFES 100 Draft Standard for Trial Use).
Santa Monica: CA: Author..
Illuminating Engineering Society of North America (2000). The IESNA Lighting
Handbook (9th ed.). New York: Author.
123
Illuminating Engineering Society of North America (2006). An IESNA Recommended
Practice. Lighting for Hospitals and Health Care Facilities. New York:
Author.
Ishihara, S., Shimamoto, K., Ikeda, M., Kato, K., Mori, Y., Ishiguchi, T., Ishigagi, T.
(2002). CRT diagnosis of pulmonary disease: influence of monitor brightness
and room illuminance on observer performance. Computerized Medical
Imaging and Graphics, 26, 181-185.
Janowitz, I., Gillen, M., Ryan, G., Rempel, D., Trupin, L., Swig, L., Mullen, K.,
Rugulies, R., and Blanc, P.D. (2006). Measuring the physical demands of
work in hospital settings: Design and implementation of an ergonomics
assessment. Applied Ergonomics, 37(5), 641-658
Karlqvist, L. (1998). A process for the development, specification and evaluation of
VDU work tables. Applied Ergonomics, 29(6), 423-432.
Kerlinger, F.N., and Lee, H.B. (2000). Foundations of Behavioral Research (4th ed).
Belmont, CA: Wadsworth Publishing.
Kolb, G.R. (2005). Rethinking the Radiologist Work Space. Imaging Economics,
April. Retrieved May 6, 2005, from http://www.imagingeconomics.com/
library/200504-09.asp
Krupinski, E.A., Roehrig, H. (2002). Pulmonary Nodule Detection and Visual Search:
P45 and P104 Monochrome versus Color Monitor Displays. Academic
124
Radiology, 9(6), 638-645. Retrieved on December 20, 2005, from
http://www.sciencedirect.com
Krupinski, E.A., Roehrig, H., and Furukawa, T. (1999). Influence of Film and
Monitor Display Luminance on Observer Performance and Visual Search.
Academic Radiology, 6(7), 411-418. Retrieved on December 20, 2005, from
http://www.sciencedirect.com
Laville, A. (1983). Postural reactions related to activities on VDU. In Grandjean, E.,
and Vigliani, E. (Eds.), Ergonomic Aspects of Visual Display Terminals (pp.
167-174). London: Taylor & Francis Ltd.
Lee, K.R., Siegel, E.L., Templeton, A.W., Dwyer, S.J., Murphey, M.D., and Wetzel,
L.H. (1991). State-of-the-art Digital Radiography. Radiographics, 11, 1013-
1025
Li, G., and Buckle, P. (1999). Current Techniques for assessing physical exposure to
work-related musculoskeletal risks, with emphasis on posture-based methods.
Ergonomics, 42(5), 647-695
Lu, H., and Aghazadeh, F. (1998). Modeling of risk factors in the VDT workstation
systems. Occupational Ergonomics, 1(3), 189-210.
Lund, P.J., Krupinski, E.A., Pereles, S., and Mockbee, B. (1997). Comparison of
conventional and computed radiography: Assessment of image quality and
125
reader performance in skeletal extremity trauma. Academic Radiology, 4, 570-576.
Lowe, B.D. (2004). Accuracy and validity of observational estimates of wrist and
forearm posture. Ergonomics, 47(5), 527-554.
McAtamney, L., and Corlett, E.N. (1993). RULA: a survey method for the
investigation fo work-related upper limb disorders. Applied Ergonomics,
24(2), 91-99.
McAtamney & Hignett (2005). Rapid Entire Body Assessment. In N. Stanton, A.
Hedge, K. Brookhuis, E. Salas, & H. Hendrick (Eds.), Handbook of Human
Factors and Ergonomics Methods (pp. 8.1-8.11). New York: CRC Press.
Nylén, P. (2002). Comparison of Stationary LCD and CRT Screens - Some Visual
and Musculo-Skeletal Aspects. In Luczak, H., Çakir, A.E., and Çakir, G.
(Eds.), Proceedings of the Conference WWDU 2002 World Wide Work, May
22-25, 2002. (pp. 682-684). Berlin: Ergonomic Institut für Arbeits- und
Sozialforschung Forschungsgesellschaft mbH.
Van Ooijoen, P.M.A., Koesoema, A.P., and Oudkerk, M. (2006). User Questionnnaire
to Evaluate the Radiological Workspace. Journal of Digital Imaging, 19(2)
Prabhu, S.P., Gandhi, S., and Goddard, P.R. (2005). Ergonomics of Digital Imaging.
The British Journal of Radiology, 78(931), 582-586.
126
Pomerantz, S.M., Protopapas, Z., Siegel, E. (1999). PACS and the end user: A study
in two demanding environments. In Siegel, E.L., and Kolodner, R.M. (Eds.),
Filmless Radiology, 227-241. New York: Springer Verlag Inc.
Reiner, B.I., and Siegel, E. L. (2002). The Cutting Edge: Strategies to Enhance
Radiologist Workflow in a Filmless/Paperless Imaging Department. Journal
of Digital Imaging, 15(3), 178-190. Retrieved on December 20, 2005, from
http://www.springerlink.com/media/7pab6qguul4yrhbg9j4k/contributions/a/m/
4/k/am4k56eruvh9xpey.pdf
Reiner, B.I., Siegel, E.L., Hooper, F.J., and Glasser, D. (1998). Effect of film-based
versus filmless operation on the productivity of CT technologists. Radiology,
207, 481-485.
Rumreich, L.L., and Johnson, A.J. (2003). From Traditional Reading Rooms to a Soft
Copy Environment: Radiologist Satisfaction Survey. Journal of Digital
Imaging, 16(3), 262-269. Retrieved on October 10, 2005, from http://www.
springerlink.com/media/fl9xanuvwldun90gxj7w/contributions/b/q/b/7/bqb7qhc
5tmdeglke.pdf
Ruess, L., O'Connor, S.C., Cho, K.H., Hussain, F.H., Howard, W.J., Slaughter, R.C.,
and Hedge, A. (2003). Carpal tunnel syndrome and cubital tunnel syndrome:
Work-related musculoskeletal disorders in four symptomatic radiologists.
American Journal of Roentgenology, 181, 37-42.
127
Trevino, M. (May 22, 2004). Five-button mouse trumps more sophisticated user input
devices. SCAR 2004 News. Retrieved on July 16,2006 from http://www.
dimag.com/scar2004//news/?id=22141
Sanders, M.S., and McCormick, E.J. (1993). Human factors in engineering and
design (7th ed.). New York: McGraw-Hill.
Sheedy, J.E., Smith, R., and Hayes, J. (2005). Visual effects of the luminance
surrounding a computer display. Ergonomics, 48(9), 1114-1128.
Sherbondy, A.J., Holmlund, D., Rubin, G.D., Schaedley, P.K., Winograd, T., and
Napel, S. (2005). Alternative input devices for efficient navigation of large
CT angiography data sets. Radiology, 234, 391-398.
Shuval, K., and Donchin, M. (2005). Prevalence of upper extremity musculoskeletal
symptoms and ergonomic risk factors at a Hi-Tech company in Israel.
International Journal of Industrial Ergonomics, 35(6), 569-581.
Siegel, E.L, and Reiner, B.I. (2002). Radiology reading room design: The next
generation. Applied Radiology Online, April, 31(4). Retrieved on January 15,
2006, from http://www.appliedradiology.com/articles/
Spielholz, P., Silverstein, B., Morgan, M., Checkoway, H., and Kaufman, J. (2001).
Comparison of self-report, video opbservation and direct measurement
methods for upper extremity musculoskeletal disorder physical risk factors.
Ergonomics, 44(6), 588-613.
128
Stanton, N., Baber, C., and Young, M.S. (2004). Observation. In N. Stanton, A.
Hedge, K. Brookhuis, E. Salas, & H. Hendrick (Eds.), Handbook of Human
Factors and Ergonomics Methods (pp. 28.1-28.7). New York: CRC Press.
Thrall, J.H. (2005). Reinventing Radiology in the Digital Age. Part III. Facilities,
Work Processes, and Job Responsibilities (Perspectives). Radiology, 237,
790-793.
Usami, H., Ikeda, M., Ishigaki, T., Fukushima, H., Shimamoto, K. (2006). European
Radiology, 16, 726-732.
Veitch, J.A., and Newsham, G.R. (1996). Determinants of Lighting Quality II:
Research and Recommendations. Presented at the 104th Annual Convention of
the American Psychological Association, August 12th, Toronto, Ontario,
Canada. Retrieved on June 13, 2005 from http://irc.nrc-cnrc.gc.ca/fulltext/
nrcc40343.pdf
Wang, J., Langer, S. (1998). A Brief Review of Human Perception Factors in Digital
Displays for Picture Archiving and Communications Systems. Journal of
Digital Imaging, 10(4), 158-168.
Wells, R., Norman, R., Neumann, P., Andrews, D., Frank, J., Shannon, H., and Kerr,
M. (1997). Assessment of physical work load in epidemiologic studies:
common measurement metrics for exposure assessment. Ergonomics, 40(1),
51-61.