the correlation and hedging effects between … 3_5_19.pdf · the correlation and hedging effects...
TRANSCRIPT

Journal of Applied Finance & Banking, vol. 3, no. 5, 2013, 269-297
ISSN: 1792-6580 (print version), 1792-6599 (online)
Scienpress Ltd, 2013
The Correlation and Hedging Effects between
Commodity and Stock Markets
Yu-Min Wang1, Chia-Fei Lin
2 and Yu-Hsien Li
3
Abstract
This study uses the Rogers International Commodity Index (RICI) for composite
commodities and RICI-Agriculture (RICA), RICI-Energy (RICIE), and RICI-Metals
(RICIM) indices to examine the relationship between various commodity and stock
markets. The empirical results indicated that stable long-term relationships exist between
some commodity and stock markets, and that commodity indices generally lead stock
market indices. Thus, in a number of countries/regions, investors can predict fluctuations
in stock prices using variations in commodity indices. However, the RICI composite
commodities index, RICIA agricultural commodity index, and RICIM metals index are
subject to the influence of the U.S. stock market. Furthermore, when serious crises or high
volatility occurs in stock markets, investors can use the RICIM metals index as a safe
haven asset, incorporating it into investment portfolios to reduce risk. Under normal stock
market circumstances, no hedging effects exist between commodity market indices and
stock markets. Consequently, investors cannot use commodity indices as hedging
instruments.
JEL classification numbers: G10, G11, G14, G15
Keywords: cointegration test, commodity index, hedging effect, safe haven effect
1Professor, Department of Banking and Finance, National Chiayi University. 2Chia-Fei Lin (the corresponding author) is an assistant professor at the Department of Marketing
and Logistics Management, Hsin Sheng College of Medical Care and Management, No.408,
Groping Sec., Jhongfong Rd., Longtan Towship, Taoyuan 32544,Taiwan, R.O.C.
Tel:+886-3-4117578#514. 3Master,Department of Business Administration, National Chiayi University.
Article Info: Received : May 1, 2013. Revised : May 30, 2013.
Published online : September 1, 2013

270 Yu-Min Wang, Chia-Fei Lin and Yu-Hsien Li
1 Introduction
In recent years, a financial crisis has caused worldwide economic turmoil, leading to
crashes and sharp declines in the stock markets of advanced countries in North America
and Europe, and indirectly causing declines in the stock markets of emerging countries.
By contrast, international raw material prices have posted strong gains and exhibited
bullish characteristics, particularly the gold market. In an environment characterized by
global economic uncertainty resulting from systematic risk, investors of market capital
have sought out risk aversion and hedging strategies, causing the prices in the gold market
to skyrocket. In addition, the U.S. government has engaged in repeated monetary easing
policies to create capital flows and stimulate economic activity, leading to constant
devaluation of the U.S. dollar (USD). Consequently, the prices of commodities
denominated or valued in USD have risen consistently.
Commodities are a necessity of human life. Regardless of economic trends, necessities
including food, clothing, shelter, and transport, as well as basic industries such as
construction, transportation, mining, and agriculture, require commodity supply.
Commodities are the basic upstream raw materials of all economic development. Thus,
the supply and demand of commodities and associated price trends affect economic
development throughout the world. The relationship between oil prices and economic
development was first highlighted by Hamilton (1983), who noted that oil prices
influence the macroeconomic performance of the United States and have a significant
negative influence on production growth rates.
Since 2002, commodity prices have risen continually. Global raw material markets have
exhibited bullishness, leading and driving various price indices, such as the Rogers
International Commodity Index (RICI), Reuters/Jefferies Commodity Research Bureau
Index, Goldman Sachs Commodity Index, and Dow Jones AIG Commodity Index.
Specifically, the RICI includes 38 commodities that facilitate economic activity and
operation and, thus, reflects global raw material price trends. This index has risen by
278.83% since its creation, and in July 2008, the index rose to 5,832.91, setting a record
high price in conjunction with Brent crude. Baur and Lucey (2010) also demonstrated that
whether the market is operating normally or experiencing shocks from extreme incidents,
gold can serve as a hedge or safe haven . Hence, investors can incorporate raw material
commodities or financial instruments derived from these commodities into their
investment portfolios as a hedging strategy, thereby reducing investment portfolio risk.
Commodity markets are highly diverse with significantly different economic
characteristics. For example, energy and agriculture are quite dissimilar in their economic
influence. Consequently, this study contends that commodities must be separated into
categories for examination. Previous studies have primarily focused on the correlation
between the overall economy and oil or gold prices, or the correlation between the price
of a single commodity (oil, gold, or copper) and stock markets, currency exchange
markets, bond markets, or the overall economy. Few studies have divided commodities
into categories to examine the relationships between different product characteristics and
the overall economy. Therefore, this study examines the relationship between the
characteristics of different commodities and stock markets, and also further analyzes
whether the characteristics of different categories of commodities have hedging or safe
haven effects for investment portfolio strategies in the stock market. The results can
provide a reference for investors to make appropriate and accurate investment portfolio
decisions.

The Correlation and Hedging Effects between Commodity and Stock Markets 271
2 Literature Review
The primary purpose of this study was to examine the correlation between commodity
markets and stock markets. Based on the RICI, the commodity market indices were
categorized into the four categories of RICI composite commodities, RICI-Agriculture
(RICIA) for agricultural commodities, RICI-Energy (RICIE) for energy, and RICI-Metals
(RICIM) for metals. This study observes the roles played by composite, energy, metal,
and agricultural commodities in stock-market investment portfolio strategies, as well as
whether these commodities exhibit cointegration or spillover effects. This study also
examines whether the four types of commodities exert hedging or safe haven effects for
investment portfolio strategies in stock markets.
Related literature (Gorton & Rouwenhorst, 2006; Hunjra, Azam, Niazi, Butt, Rehman, &
Azam, 2011; Jalil, Ghani, Daud, & Ibrahim, 2009; Park & Ratti, 2008; Summer, Johnson,
& Soenen, 2010; Wang, Wang, & Huan, 2010) indicates that the returns on commodity
futures are inversely related to returns in the stock and bond markets. However, the
relationship between returns in commodity futures markets and stock markets changes
according to economic or business cycles. By contrast, no consensus has been reached on
whether cointegration relationships exist between crude oil prices, gold prices, and stock
market prices. Consequently, long-term stable relationships between crude oil prices, gold
prices, and stock market prices have yet to be verified.
Hamilton (1983) examined the post-WWII relationship between crude oil prices and the
overall economy of the United States. The results showed that after WWII, volatility in
the gross national product (GNP) of the United States was significantly and negatively
correlated with volatility in oil prices, and the U.S. economy entered a recession period
following dramatic increases in crude oil prices. Therefore, it can be inferred that shocks
in oil prices may be one of the primary causes of economic downturns. Consequently,
increases in the international prices of foodstuffs or crude oil are observed to negatively
influence overall national economies. At the microeconomic level, price hikes increase
production costs for enterprises, affecting industry. Thus, raw material prices are
inseparably linked to and influence the performance of national economies.
Edwards and Caglayan (2001) found that commodity funds provide superior downside
protection compared to hedge funds. In bearish stock markets, commodity funds provide
higher returns compared to hedge funds and also exhibit inverse relationships with stock
market returns. By contrast, hedge fund returns and stock market returns show a positive
or direct relationship, and this phenomenon is particularly pronounced in bearish stock
markets.
Summarizing other literature, the results of most studies (Baur & Lucey, 2010; Ciner,
Gurdgiey, & Lucey, 2010; Coudert & Raymond, 2010; Hillier, Draper, & Faff, 2006)
have shown that returns in the metals and stock markets are negatively associated,

272 Yu-Min Wang, Chia-Fei Lin and Yu-Hsien Li
indicating that precious metals exhibit a safe haven effect. Consequently, incorporating
precious metals into stock-market investment portfolios can effectively reduce investment
portfolio risk. Furthermore, among the precious metals, gold has the most obvious safe
haven effect. However, this effect is only short term. Gold also demonstrates a better
hedging effect in bearish markets compared to bullish markets.
3 Research Methodology
The primary purpose of this study was to examine the correlation between the commodity
and stock markets. Based on the categories adopted in the RICI, the commodity market
indices were divided into the four categories of composite commodities, agricultural
commodities, energy, and metals. This study analyzes the role that the characteristics of
these four commodity indices play in stock-market investment portfolio strategies. First,
this study examined whether cointegration or spillover effects existed between the
commodity and stock markets. Second, the researchers assessed whether hedging or safe
haven effects existed for any of the four categories of commodities regarding
stock-market investment portfolio strategies. Then, the researchers proposed the
following two hypotheses, which are explained below :
Hypothesis 1: Commodity markets act as hedging assets in stock-market investment
portfolio strategies; in other words, commodity index prices and stock market prices are
not linked under normal stock market conditions.
Hypothesis 2: Commodity markets act as safe haven assets in stock-market investment
portfolio strategies; in other words, during periods of poor returns for stock prices (low
returns) or abnormal volatility (high volatility) in stock markets, or during severe
financial crises, commodity index prices and stock market prices are not linked.
3.1 Market Testing Model 1
To verify Hypotheses 1 and 2, and assess whether the four category indices, that is,
composite commodities, agricultural commodities, energy, and metals, exhibited hedging
and safe haven effects in stock-market investment portfolio strategies, this study
established Equations (1) and (2) below. First, data from the research period, which
ranged from January 31, 2005, to February 17, 2012, were divided into two portions: (a)
data from before the 2008 financial crisis, and (b) data from after the 2008 financial crisis.
The declaration of bankruptcy by Lehman Brothers Holdings Inc. in the United States on
September 15, 2008, was set as the dividing point for segmentation.
Based on the market model developed by Hillier, Draper, and Faff (2006), if stock market
volatility values exceeded two standard deviations for one period, the period was
considered a high volatility period. Similarly, a period in which stock market return
performance was lower than two standard deviations was considered a low returns period.
Both of these conditions are represented by dummy variables acting as proxy variables;
the conditional variance of the model fit THE autoregressive conditional
heteroskedasticity (ARCH) with a lag of one period. The market testing model for the
composite commodities, agricultural commodities, energy, and metals commodity indices
are shown below.
t,jt,StockStock,jt,Stock,jt,Stock,j,jt,j uRRDRVolDRR 22 3210 (1)
The Correlation and Hedging Effects between Commodity and Stock Markets 273
2
110 t,j,j,jt,j uh (2)
Metals-RICIEnergy-RICIe,Agricultur-RICI,RICIj ,
In Equations (1) and (2), t,jR represents the daily returns for the four commodity
indices of composite commodities t,RICIR , energy t,nergyER , metals t,MetalsR , and
agricultural commodities t,eAgriculturR in period t. t,StockR is the daily returns of the stock
market index in period t. 2VolD is a dummy variable that indicates that stock
market returns are in a period of high volatility, and is set to 1 when the stock market
return volatility exceeds two standard deviations of the mean market volatility value;
otherwise, it is set to 0. 2StockRD is a dummy variable that indicates that the stock
market returns are in a period of low returns, and is set to 1 when the stock market returns
are at least two standard deviations lower than the mean market returns value; otherwise,
it is set to 0.
This model can be used to test Hypothesis 1, that is, whether commodity indices act as
hedging assets in stock-market investment portfolio strategies. If coefficient ,1j is
positive and approaches 1, then a high and positive correlation and, therefore, linkage
exists between commodity indices and stock markets. Conversely, if ,1j is negative and
approaches 1 , then commodity indices and stock markets exhibit a high and negative
correlation, which indicates that commodity indices have a hedging effect in stock
markets. This model can also be used to test Hypothesis 2, that is, whether commodity
indices are safe haven assets in stock-market investment portfolio strategies. If coefficient
,2j in Equation (1) is significant and 0, then the composite commodities, agricultural
commodities, energy, and metals indices have a weak safe haven effect during periods of
high volatility in the stock market. If coefficient ,2j is significantly negative, then the
four categories of commodity indices exhibit strong safe haven effects. In addition, if
coefficient ,3j is significant and 0, then the four commodity indices have a weak
hedging effect during periods of extremely low returns in stock markets; if ,3j is
significantly negative, then the four categories of commodity indices exhibit strong
hedging effects.
3.2 3.2 Market Testing Model 2
To enhance the tests described above, this study adopted the model established by Baur
and Lucey (2010) to test for correlations between the gold, stock, and bond markets to
determine whether composite commodity, energy, metals, and agricultural commodity
indices have hedging or safe haven effects in stock-market investment portfolio strategies.
The above model was divided into three short-term shocks to examine whether the four
commodity indices exhibited safe haven effects (for stock-market investment portfolio
strategies) during the three stock market stages.

274 Yu-Min Wang, Chia-Fei Lin and Yu-Hsien Li
3.2.1 Low returns period
When stock markets experience extremely low returns, investors pursue other investment
instruments as safe havens. Thus, the following model uses the distribution of stock
market returns to establish threshold values of 10%, 5%, and 1% and examine changes in
the returns of the stock and commodity markets. The model is shown below.
t,jt,Stockt,j,jt,j uRR 0 (3)
14531021 qRDqRDqRD Stock,jStock,jStock,j,jt,j (4)
2
110 t,j,j,jt,j uh (5)
Metals-RICIEnergy-RICIe,Agricultur-RICI,RICIj , =
In Equation (3), t,jR separately represents the daily returns of the four commodity
indices of composite commodities t,RICIR , energy t,nergyER , metals t,MetalsR , and agricultural
commodities t,eAgriculturR in period t. t,StockR represents the daily returns of the stock
market index during period t. In Equation (4), 10qRD Stock , 5qRD Stock , and
1qRD Stock serve as the dummy variables for extremely poor stock market returns and
were designed to capture the condition of stock market returns. When the returns
distribution in stock markets is lower than the set thresholds of 10%, 5%, or 1%, the
dummy variables are set to 1; otherwise, they are set to 0. The conditional
heteroskedasticity of each model fits the ARCH with a one-period lag, and the
simultaneous equations among the models were solved using the maximum likelihood
estimation (MLE) method.
Under circumstances of extremely low returns in stock markets, if coefficient 1,j in
Equation (4) was significant and 0, the four types of commodity indices exhibited weak
hedging effects. If coefficient 1,j was significantly negative and 1432 ,j,j,j,j ,
then the four commodity indices exhibited strong hedging effects. In addition, if the
coefficients 3,2, , jj , or 4,j were significantly 0, the four commodity indices showed t
weak safe haven effects. Finally, if the coefficients 3,2, , jj , or 4,j were significantly
negative, the four commodity indices demonstrated strong safe haven effects.
3.2.2 3.2.2 Periods of high market volatility
Under conditions of abnormal volatility (high volatility) in stock markets, investors
pursue other investment instruments as safe havens to avoid uncertainty in the market.
This study uses a conditional volatility ARCH (1) model with a delay of one period as a
proxy variable for abnormal market volatility to examine changes in the returns of the
stock and commodity markets. The model was as follows:

The Correlation and Hedging Effects between Commodity and Stock Markets 275
t,jt,Stockt,j,jt,j uRR 0 (6)
1994195319021 ,tStock,j,tStock,j,tStock,j,jt,j qhqhqhD
(7)
2
110 t,j,j,jt,j uh (8)
Metals-RICIEnergy-RICIe,Agricultur-RICI,RICIj ,
The dummy variables 1t,90Stock qhD , 1t,95Stock qhD , and 1t,99Stock qhD were set to
capture different levels of return volatility in stock markets. When the stock market return
volatility exceeded the predefined thresholds of 90%, 95%, and 99%, the dummy
variables were set to 1; otherwise, they were set to 0. The conditional heteroskedasticity
of each model fit the ARCH with a one-period lag, and the simultaneous equations among
the models were solved using the MLE method.
Under conditions of abnormal volatility (high volatility) in stock markets, if coefficient
1,j of Equation (7) was significant and 0, the composite commodities, agricultural
commodities, energy, and metals commodity indices were regarded as having weak
hedging effects; if coefficient 1,j was significantly negative and
1432 ,j,j,j,j , the four commodity indices had strong hedging effects. Similarly,
if the coefficients 3,2, , jj , or 4,j were significant and 0, the composite commodities,
agricultural commodities, energy, and metals commodity indices had weak safe haven
effects; if coefficients 3,2, , jj , or 4,j were significantly negative, the four
commodity indices showed strong safe haven effects.
3.2.3 3.2.3 Market crisis period
During severe financial crises in stock markets, investors pursue other or alternate
investment instruments as safe havens to avoid the crisis. This study set September 15,
2008, the day Lehman Brothers Holdings Inc. (in the United States) declared bankruptcy,
as the date when the financial crisis began and observed the changes in returns between
the stock and commodity markets within the six months after the beginning of the 2008
subprime mortgage crisis. The dummy variable 2008,subprimeD denoted the
subprime mortgage event that occurred in 2008 and lasted for a period of six months. The
conditional heteroskedasticity of each model fit the ARCH with a one-period lag, and the
simultaneous equations among the models were solved using the MLE method. The
model was as follows:
t,jt,Stockt,j,jt,j uRR 0 (9)
200821 ,subprimeD,j,jt,j
(10)
2
110 t,j,j,jt,j uh
(11)
Metals-RICIEnergy-RICIe,Agricultur-RICI,RICIj ,

276 Yu-Min Wang, Chia-Fei Lin and Yu-Hsien Li
If coefficient 2,j was 0 or negative in Equation (10), the composite commodities,
agricultural commodities, energy, and metals commodity indices exhibited safe haven
effects during the crisis period. If coefficient 2,j was positive, the four commodity
indices exhibited a connection during crisis periods and, thus, did not demonstrate a safe
haven effect.
4 Empirical Results and Analysis
This study adopted four commodity indices and stock market indices from 12 countries or
regions to examine the correlation and hedging effects between commodity and stock
market prices. The data employed were extracted from daily data collected between
January 31, 2005, and February 17, 2012, comprising a total of 1,767 pieces of data. The
commodity indices used were the RICI composite commodities index, RICIA agricultural
commodities index, RICIE energy index, and RICIM metals index. The stock market
indices employed were the Morgan Stanley Capital International (MSCI) indices for
Europe, the United States, Japan, Canada, Australia, China, India, Russia, Brazil, South
Korea, Taiwan, and Africa. These 12 countries or regions comprised developed markets,
emerging markets, and undeveloped countries/regions, and included exporters and
importers of agricultural commodities, energy, and metals. Therefore, the stock market
indices of the 12 countries or regions were used to represent stock markets to clearly
observe the correlation between commodity indices and the stock markets of
countries/regions that demanded or supplied raw material commodities. The indices
employed in this study were all valued in USD, eliminating the need to consider foreign
exchange rate issues.
We compiled the time series data for the various variables and found that all variable
distributions were not consistent with a normal distribution. This study subsequently
conducted model testing of the hedging and safe haven effects, and considering the
market structure, divided the data into pre- and post-2008 financial crisis sections to
analyze the differences in results for the two periods.
During the research period, the metals index yielded the highest daily average returns
among the RICI indices. However, the energy index exhibited the highest standard
deviation, which indicated that it possessed the greatest risk. Generally, the standard
deviations of the RICI indices were less than those of the MSCI indices for most countries
or regions, with the notable exception of the energy index. Regarding the MSCI indices,
the average daily returns were higher for the emerging markets, such as China, India,
Russia, Brazil, and South Korea, compared to other markets. Nevertheless, these markets
also exhibited higher standard deviations, indicating that higher returns were
accompanied by higher risk.

The Correlation and Hedging Effects between Commodity and Stock Markets 277
A. Europe B. United States
Figure 1: Trend chart of MSCI indices for various countries or regions and RICI
commodity indices
Further analysis of the direction and strength of the linear relationships between variables
showed that among the RICI indices, only the RICI composite commodities index was
negatively correlated with the metals and energy indices; the other indices were positively
related to each another. Finally, to identify the relationship between the MSCI indices for
various countries and regions and the commodity indices, this study produced trend charts
for the MSCI indices and the RICI commodity indices after deriving the logarithms for
original variable data, as shown in Fig. 1. The results indicate that the trend lines for the
MSCI indices and the RICI commodity indices are extremely similar, preliminarily
suggesting a high correlation.
Typical economic and financial data exhibit random walk characteristics. This study
conducted first-order difference equations for the data. The results showed that the null
hypotheses for all variables were rejected under the 1% significance level, which indicates
that the data were consistent with steady state characteristics. The integrated order was of
the first order, as expressed by the term .
This study adopted the Johansen cointegration test model to observe whether
cointegration existed between the variables. We found that in the short term, the MSCI
index for India led the RICI composite commodities index, and that when the two
deviated from long-term equilibrium, the MSCI index for India exhibited adjustment
functions. By contrast, the RICI composite commodities index led the MSCI index for
Russia. When the two deviated from long-term equilibrium, the adjustment function was
represented by the MSCI index for Russia.
Regarding the vector error correction model for the RICI commodity indices and the
MSCI indices for Europe, the United States, Canada, Australia, South Korea, and Taiwan,
only a single adjustment coefficient was significant. In the short term, the RICI composite
commodities index led the MSCI indices for Europe, Australia, China, South Korea, and
Taiwan. By contrast, the MSCI indices for the United States and Canada led the RICI
composite commodities index.
This study further tested for causal relationships to determine unidirectional or
bidirectional and leading or lagging relationships in the commodity and stock markets. As
shown in Tables 1 to 4, bidirectional causal relationships existed between the RICI
composite commodities index and the MSCI indices for Europe, Canada, China, and
6.0
6.5
7.0
7.5
8.0
8.5
9.0
2005 2006 2007 2008 2009 2010 2011
LN_EUROPE LN_RICI LN_RICIALN_RICIE LN_RICIM
6.0
6.5
7.0
7.5
8.0
8.5
9.0
2005 2006 2007 2008 2009 2010 2011
LN_USA LN_RICI LN_RICIALN_RICIE LN_RICIM

278 Yu-Min Wang, Chia-Fei Lin and Yu-Hsien Li
Brazil, highlighting the mutual influence between the MSCI indices and RICI composite
commodities index of these countries or regions. Furthermore, the RICI composite
commodities index maintained a leading relationship with the stock markets in most
countries/regions. Therefore, changes in the RICI composite commodities index can be
used to predict stock market price changes in these countries/regions. Only the U.S. stock
market led the RICI composite commodities index. In other words, the RICI composite
commodities index is influenced by the U.S. stock market, which indicates that a
unidirectional causal relationship exists. However, the Indian stock market and the RICI
composite commodities index were mutually independent, indicating that the price
changes in one index could not be used to predict price changes in the other.
Of the causal relationships between the MSCI indices for various countries or regions and
the RICIA agricultural commodities index, bidirectional causal relationships existed for
Europe, Canada, Australia, and Russia, indicating that mutual influences existed between
the MSCI indices and the RICIA agricultural commodities index for these countries and
regions. The RICIA agricultural commodities index led the stock markets of most
countries/regions.
Furthermore, of the causal relationships between the MSCI indices for various countries
or regions and the RICIE energy index, bidirectional causal relationships were observed
for Europe, the United States, China, India, and South Korea, indicating that a mutual
influence existed between the MSCI indices and the RICIE energy index of these
countries/regions. The RICIE energy index led the MSCI indices of most
countries/regions, which suggests that changes in the RICIE energy index can be used to
predict stock market price changes in these areas. Only the stock markets of Canada and
Brazil led the RICIE energy index, which implies that for these two countries, the RICIE
energy index is influenced by the stock market, exhibiting a unidirectional causal
relationship.
Table 1: Granger causal relationship testing – MSCI indices for various countries/regions
and RICI (composite commodities) index
Country/Region Excluded
variable
Dependent
variable Chi-sq df Prob.
Granger
causal relationship
Europe
RICIlnΔ EUROPElnΔ
12.954
9 7
0.07* EUROPERICI
EUROPElnΔ
RICIlnΔ
14.307
3 0.05**
United States
RICIlnΔ USAlnΔ 3.8351
3
0.28
RICIUSA
USAlnΔ RICIlnΔ 49.529
0 0.00**
*
Note: *, **, and *** respectively represent that the null hypothesis was rejected under a
10%, 5%, and 1% significance level.

The Correlation and Hedging Effects between Commodity and Stock Markets 279
Table 2: Granger causal relationship testing—MSCI indices for various countries/regions
and RICIA (agricultural commodities) index
Country/Region Excluded
variable
Dependent
variable Chi-sq df Prob.
Granger
causal relationship
Europe
RICIAln EUROPEln
12.291
1 6
0.06* EUROPERICIA
EUROPEln
RICIAln
26.765
4 0.00**
*
United States
RICIAln USAln 1.2310
3
0.75
RICIAUSA
USAln RICIAln 33.564
5 0.00**
*
Note: *, **, and *** respectively represent that the null hypothesis was rejected under a
10%, 5%, and 1% significance level.
Finally, an examination of the causal relationships between the RICIM metals index and
the MSCI indices for various countries/regions indicated that bidirectional causal
relationships existed for Japan, Canada, Australia, and Brazil. Furthermore, the RICIM
metals index led the stock markets of most countries/regions. Consequently, changes in
the RICIM metals index can be used to predict changes in stock market prices for these
areas. Only the U.S. stock market led the RICIM metals index in a unidirectional causal
relationship. However, the European stock market and the RICIM metals index were
mutually independent; indicating that price changes for one index could not be used to
predict price changes in the other.
Table 3: Granger causal relationship testing—MSCI indices for various countries/regions
and RICIE (energy) index
Country/Region Excluded
variable
Dependent
variable Chi-sq df Prob.
Granger
causal relationship
Europe
RICIEln EUROPEln
13.922
7 6
0.03** EUROPERICIE
EUROPEln
RICIEln
17.703
1 0.01**
*
United States
RICIEln USAln 6.2759
3
0.10*
USARICIE
USAln RICIEln 37.865
4 0.00**
*
Note: *, **, and *** respectively represent that the null hypothesis was rejected under a
10%, 5%, and 1% significance level.

280 Yu-Min Wang, Chia-Fei Lin and Yu-Hsien Li
Table 4: Granger causal relationship testing—MSCI indices for various countries/regions
and RICIM (metals) index
Country/Region Excluded variable Dependent
variable Chi-sq df Prob.
Granger
causal relationship
Europe
RICIMlnΔ EUROPElnΔ 0.4609
1
0.50 Mutually
independent EUROPElnΔ RICIMlnΔ 0.8332 0.36
United States
RICIMln USAln 2.8553
3
0.41
RICIMUSA
USAln RICIMln 67.6787 0.00***
Note: *, **, and *** respectively represent that the null hypothesis was rejected under a
10%, 5%, and 1% significance level.
The above tests were conducted to determine whether cointegration and leading/lagging
relationships existed between commodity and stock markets. This study then further
examined whether hedging or safe haven effects existed for the four commodity indices in
stock-market investment portfolio strategies.
4.1 Market Testing Model 1
When examining the model for safe haven effects, if stock market volatility values
exceeded the mean market volatility value by two standard deviations in one period, that
period was defined as a high volatility period. In addition, if the returns performance of a
stock market was lower than the mean market returns value by two standard deviations in
one period, that period was defined as a low returns period. Dummy variables are used as
proxy variables in the model to represent these conditions, and the conditional
heteroskedasticity of the model fits the ARCH with a one-period lag.
Table 5 shows that when testing the returns coefficient ( 1,j ) for Hypothesis 1 regarding
hedging effects over the entire research period, the coefficient for the RICI composite
commodities index was negative in relation to the MSCI indices of Japan, Australia, and
India. In addition, the coefficients of the RICI composite commodities index, RICIA
agricultural commodities index, RICIE energy index, and RICIM metals index were all
negative for the MSCI index for Africa; however, the results were not statistically
significant. Conversely, the returns coefficients for the hedging effect were significant and
positive for the RICI composite index, RICIA agricultural products index, RICIE energy
index, and RICIM metals index in relation to the MSCI indices for the United States and
Canada. The coefficients for the RICIA agricultural commodities index, RICIE energy
index, and RICIM metals index were positive and significant in relation to the MSCI
indices for Europe, Australia, China, India, Russia, Brazil, and South Korea. These results
show that during the research period, none of the commodity indices exhibited a
significant hedging effect for the MSCI stock indices of the 12 countries/regions; instead,
the four commodity indices exhibited a significant link with the MSCI stock indices for
most of the countries/regions.
During periods of high volatility in stock markets, the results for the returns coefficients

The Correlation and Hedging Effects between Commodity and Stock Markets 281
( 2,j ) for Hypothesis 2 regarding safe haven effects showed that the RICI composite
commodities index was significantly negative for Russia’s MSCI index, and that the
coefficient for the RICIE energy index was significantly negative for Canada’s MSCI
index. In addition, the coefficient for the RICIM metals index was significantly negative
in relation to the MSCI indices for Europe, the United States, Canada, China, India,
Russia, and South Korea. The results indicated that the RICI composite commodities
index had a safe haven effect for Russia’s stock market index, and that the RICIM metals
index also had a safe haven effect for Europe, the United States, Canada, China, India,
Russia, and South Korea.
Finally, during periods of low returns in stock markets, an examination of the returns
coefficient ( 3,j ) for Hypothesis 2 regarding safe haven effects showed that the
coefficient of the RICI composite commodities index was significantly negative for the
MSCI indices of China and South Korea, and that the coefficient of the RICIM metals
index was also significantly negative in relation to the MSCI index for Canada.
Conversely, the safe-haven-effect returns coefficients for the RICIA agricultural
commodities index were significantly positive for the MSCI indices of most
countries/regions, excluding Canada and Africa. These results show that the RICI
composite commodities index had a safe haven effect for the stock indices of China and
South Korea; the RICIM metals index also had a safe haven effect for the stock market
index of Canada. However, the RICIA agricultural commodities index was linked to the
MSCI indices of most countries/regions.
Summarizing the above results, we determined that the four commodity indices were
linked to the MSCI indices for most countries/regions during the research period.
Therefore, the hedging effects were poor. Regarding safe haven effects, the safe haven
effects of the commodity indices were stronger during periods of high volatility compared
to periods of low returns. Specifically, the RICIM metals index had safe haven effects for
the stock indices of most countries/regions, whereas the RICIA agricultural commodities
index did not have safe haven effects.
Table 6 shows that before the 2008 financial crisis, the test results of the returns
coefficient ( 1,j ) for Hypothesis 1 regarding hedging effects indicate that no commodity
indices had significant hedging effects for MSCI stock indices before 2008. Instead, these
four commodity indices were significantly linked to the MSCI stock indices of most
countries/regions. This trend was identical to results for the entire research period.
During periods of high volatility in stock markets, the results for the returns coefficient
( 2,j ) for Hypothesis 2 regarding the safe haven effect showed that the RICI composite
commodities index had safe haven effects for the stock index of South Korea, and that the
RICIM metals index had a safe haven effect for the stock index of India. However, the
RICIA agricultural commodities index was significantly linked with the MSCI stock
indices for Europe and Canada. The same was true of the RICIM metals index in relation
to the MSCI stock indices of Canada, Russia, and Brazil.
During periods of low returns in stock markets, the results of the returns coefficient for
safe haven effects ( 3,j ) indicated that the coefficient of the RICI composite commodities
index was significantly negative for the MSCI index of China. Conversely, the returns
coefficient for the safe haven effect of the RICIA agricultural commodities index was
significantly positive for the MSCI indices of five countries/regions: Europe, Australia,

282 Yu-Min Wang, Chia-Fei Lin and Yu-Hsien Li
China, India, and South Korea. However, the RICIE energy index was only significantly
positive for Taiwan’s MSCI index. The RICIM metals index was significantly positive for
the MSCI indices of Europe, China, India, Brazil, and Taiwan. The results showed that the
RICI composite commodities index exhibited a safe haven effect for the stock market
index of China. Nevertheless, the RICIA agricultural commodities index and RICIM
metals index were linked to the MSCI stock indices of most countries/regions.
In summation, these results indicate that the four commodity indices were linked to the
MSCI indices of most countries/regions before the 2008 financial crisis and, therefore,
had poor hedging effects. These results were identical for the entire research period.
Regarding safe haven effects, only a few safe haven effects existed among the commodity
indices. Additionally, the RICIA agricultural commodities index did not exhibit a safe
haven effect.
Table 7 shows that after the 2008 financial crisis, the test results of the returns coefficients
( 1,j ) for Hypothesis 1 regarding hedging effects indicated that the coefficients of the
RICI composite commodities index for the MSCI indices of Europe, Japan, Australia, and
South Korea were all negative. Furthermore, the RICI composite commodities index,
RICIA agricultural commodities index, RICIE energy index, and RICIM metals index all
had negative coefficients in relation to the MSCI index for Africa; however, these
relationships were not statistically significantly. By contrast, regarding the returns
coefficients for hedging effects, the RICIA agricultural commodities index, RICIE energy
index, and RICIM metals index had significantly positive coefficients in relation to the
MSCI indices for Europe, the United States, Canada, Australia, China, India, Russia, and
South Korea. These four commodity indices also exhibited a significant link with the
MSCI index of Brazil. The results indicate that after the 2008 financial crisis, no
commodities index showed significant hedging effects in relation to the MSCI stock
indices. Instead, the RICIA agricultural commodities index, RICIE energy index, and
RICIM metals index were all significantly linked to the MSCI indices for most
countries/regions. These results are similar to those published in extant studies.

The Correlation and Hedging Effects between Commodity and Stock Markets 283
Table 5: Market Testing Model 1 – Entire period
Country/Region RICI (Composite commodities) RICIA (Agricultural commodities) RICIE (Energy) RICIM (Metals)
Variable Coefficient Prob. Variable Coefficient Prob. Variable Coefficient Prob. Variable Coefficient Prob.
Europe
0,riciβ 0.0007 (0.02)** 0,riciaβ 0.0002 (0.32)
0,ricieβ 0.0007 (0.08)* 0,ricimβ 0.0007 (0.01)***
1,riciβ 0.0028 (0.93) 1,riciaβ 0.2596 (0.00)***
1,ricieβ 0.4727 (0.00)*** 1,ricimβ 0.6191 (0.00)***
2,riciβ -0.0070 (0.87) 2,riciaβ 0.0067 (0.82)
2,ricieβ 0.0253 (0.63) 2,ricimβ -0.1478 (0.00)***
3,riciβ -0.0066 (0.91) 3,riciaβ 0.1065 (0.00)***
3,ricieβ 0.1619 (0.00)*** 3,ricimβ 0.0484 (0.19)
(1) 0.0064 (1)2 0.8322 (1) 0.1933 (1)2 0.3579 (1) 2.3661 (1)2 1.3046 (1) 0.0248 (1)2 0.1958
(2) 0.3249 (2)2 2.2462 (2) 3.5288 (2)2 0.6123 (2) 2.5499 (2)2 3.8362 (2) 0.2177 (2)2 0.7090
LM test 0.8299(0.36) LM test 0.3568(0.55) LM test 1.3011(0.25)
0.1105 LM test 0.1952(0.66)
United States
0,riciβ 0.0006 (0.03)** 0,riciaβ 0.0003 (0.30)
0,ricieβ 0.0006 (0.12) 0,ricimβ 0.0009 (0.00)***
1,riciβ 0.1298 (0.00)*** 1,riciaβ 0.2161 (0.00)***
1,ricieβ 0.4613 (0.00)*** 1,ricimβ 0.4213 (0.00)***
2,riciβ -0.0150 (0.77) 2,riciaβ -0.0051 (0.89)
2,ricieβ 0.0285 (0.66) 2,ricimβ -0.1670 (0.00)***
3,riciβ 0.0417 (0.50) 3,riciaβ 0.1396 (0.00)***
3,ricieβ 0.1995 (0.00)*** 3,ricimβ 0.0791 (0.18)
(1) 3.3154 (1)2 0.7409 (1) 0.1490 (1)2 0.1959 (1) 3.4533 (1)2 2.8953 (1) 5.4824 (1)2 0.2419
(2) 3.9100 (2)2 3.7813 (2) 0.8181 (2)2 0.5549 (2) 3.5183 (2)2 3.5698 (2) 5.6336 (2)2 1.8287
LM test 0.7389(0.39)
LM test
0.1953(0.66)
LM test 2.8907(0.09)
LM test
0.2411(0.62)
Note: *, **, and *** respectively indicate that the null hypothesis was rejected under a 10%, 5%, and 1% significance level.
(1) and (2) respectively indicate the Ljung-Box Q statistic for the standardized residuals with a one- and two-period lag.
(1)2 and (2)2 respectively indicate the Ljung-Box Q statistic for the squared standardized residuals quadratic with a one- and two-period lag.
tjtStockStockjtStockjtStockjjtj uRRDRVolDRR ,,3,,2,,1,0,, 22
2
110 t,j,j,jt,j uh
Metals-RICIEnergy-RICIe,Agricultur-RICIRICIj , ,
2D Vol is the dummy variable indicating high volatility in stock market returns. When the volatility of stock market returns exceeds two standard deviations from the mean volatility
value, the variable is set to 1; otherwise, it is set to 0. 2RStockD is the dummy variable indicating a low stock market return period. When the stock market returns are less than two
standard deviations from the mean returns value, the variable is set to 1; otherwise, it is set to 0.
284 Yu-Min Wang, Chia-Fei Lin and Yu-Hsien Li
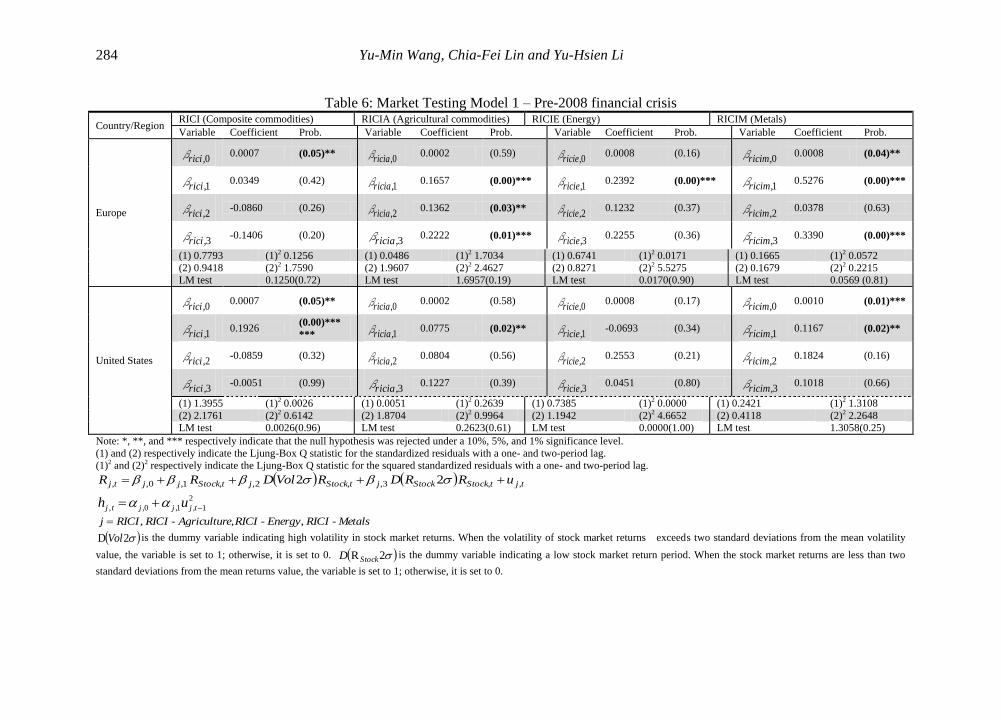
Table 6: Market Testing Model 1 – Pre-2008 financial crisis
Country/Region RICI (Composite commodities) RICIA (Agricultural commodities) RICIE (Energy) RICIM (Metals)
Variable Coefficient Prob. Variable Coefficient Prob. Variable Coefficient Prob. Variable Coefficient Prob.
Europe
0,riciβ 0.0007 (0.05)** 0,riciaβ 0.0002 (0.59)
0,ricieβ 0.0008 (0.16) 0,ricimβ 0.0008 (0.04)**
1,riciβ 0.0349 (0.42) 1,riciaβ 0.1657 (0.00)***
1,ricieβ 0.2392 (0.00)*** 1,ricimβ 0.5276 (0.00)***
2,riciβ -0.0860 (0.26) 2,riciaβ 0.1362 (0.03)**
2,ricieβ 0.1232 (0.37) 2,ricimβ 0.0378 (0.63)
3,riciβ -0.1406 (0.20) 3,riciaβ 0.2222 (0.01)***
3,ricieβ 0.2255 (0.36) 3,ricimβ 0.3390 (0.00)***
(1) 0.7793 (1)2 0.1256 (1) 0.0486 (1)2 1.7034 (1) 0.6741 (1)2 0.0171 (1) 0.1665 (1)2 0.0572
(2) 0.9418 (2)2 1.7590 (2) 1.9607 (2)2 2.4627 (2) 0.8271 (2)2 5.5275 (2) 0.1679 (2)2 0.2215
LM test 0.1250(0.72) LM test 1.6957(0.19) LM test 0.0170(0.90) LM test 0.0569 (0.81)
United States
0,riciβ 0.0007 (0.05)** 0,riciaβ 0.0002 (0.58)
0,ricieβ 0.0008 (0.17) 0,ricimβ 0.0010 (0.01)***
1,riciβ 0.1926 (0.00)***
*** 1,riciaβ 0.0775 (0.02)** 1,ricieβ -0.0693 (0.34)
1,ricimβ 0.1167 (0.02)**
2,riciβ -0.0859 (0.32) 2,riciaβ 0.0804 (0.56)
2,ricieβ 0.2553 (0.21) 2,ricimβ 0.1824 (0.16)
3,riciβ -0.0051 (0.99) 3,riciaβ 0.1227 (0.39)
3,ricieβ 0.0451 (0.80) 3,ricimβ 0.1018 (0.66)
(1) 1.3955 (1)2 0.0026 (1) 0.0051 (1)2 0.2639 (1) 0.7385 (1)2 0.0000 (1) 0.2421 (1)2 1.3108
(2) 2.1761 (2)2 0.6142 (2) 1.8704 (2)2 0.9964 (2) 1.1942 (2)2 4.6652 (2) 0.4118 (2)2 2.2648
LM test 0.0026(0.96) LM test 0.2623(0.61) LM test 0.0000(1.00) LM test 1.3058(0.25)
Note: *, **, and *** respectively indicate that the null hypothesis was rejected under a 10%, 5%, and 1% significance level.
(1) and (2) respectively indicate the Ljung-Box Q statistic for the standardized residuals with a one- and two-period lag.
(1)2 and (2)2 respectively indicate the Ljung-Box Q statistic for the squared standardized residuals with a one- and two-period lag.
tjtStockStockjtStockjtStockjjtj uRRDRVolDRR ,,3,,2,,1,0,, 22
2
110 t,j,j,jt,j uh
Metals-RICIEnergy-RICIe,Agricultur-RICIRICIj , ,
2D Vol is the dummy variable indicating high volatility in stock market returns. When the volatility of stock market returns exceeds two standard deviations from the mean volatility
value, the variable is set to 1; otherwise, it is set to 0. 2RStockD is the dummy variable indicating a low stock market return period. When the stock market returns are less than two
standard deviations from the mean returns value, the variable is set to 1; otherwise, it is set to 0.
The Correlation and Hedging Effects between Commodity and Stock Markets 285
During periods of high volatility in stock markets, the test results of the returns
coefficients ( 2,j ) for Hypothesis 2 regarding safe haven effects indicated that the
coefficients of the RICI composite commodities index were significantly negative in
relation to the MSCI indices for Russia and Brazil. In addition, the coefficients of the
RICIA agricultural commodities index were significantly negative for the MSCI indices
of Europe, the United States, Canada, Australia, and Russia; the coefficients of the RICIE
energy index were significantly negative for the MSCI indices of Europe, the United
States, Canada, Russia, and South Korea; and the RICIM metals index exhibited
significantly negative coefficients in relation to the MSCI indices of Europe, the United
States, Canada, China, India, Russia, Brazil, and South Korea. These results suggest that
the RICI composite commodities index had a safe haven effect in relation to the stock
indices of Russia and Brazil. Moreover, the RICIA agricultural commodities index, the
RICIE energy index, and the RICIM metals index had safe haven effects in relation to the
MSCI stock indices of most countries/regions, including Europe, the United States,
Canada, and Russia.
During periods of low returns in stock markets, the test results of the returns coefficients
( 3,j ) for Hypothesis 2 regarding safe haven effects show that the RICIM metals index
had a significantly negative coefficient in relation to the MSCI index of Canada. By
contrast, the RICIA agricultural commodities index had significantly positive coefficients
for the MSCI indices of most countries/regions, including Europe, the United States,
Canada, China, India, and Taiwan. The coefficients of the RICIE energy index were also
significantly positive in relation to the MSCI indices of Europe, the United States, and
South Korea. In addition, the RICIM metals index had significantly positive coefficients
in relation to the MSCI indices of Canada, China, India, and South Korea. These results
show that only the RICIM metals index exhibited a safe haven effect in relation to the
stock market index for Canada. By contrast, the RICIA agricultural commodities index,
RICIE energy index, and RICIM metals index were linked to the MSCI indices of most
countries/regions; this trend was particularly pronounced for the RICIA agricultural
commodities index.

286 Yu-Min Wang, Chia-Fei Lin and Yu-Hsien Li
Table 7: Market Testing Model 1 – After the 2008 financial crisis
Country/Region RICI (Composite commodities) RICIA (Agricultural commodities) RICIE (Energy) RICIM (Metals)
Variable Coefficient Prob. Variable Coefficient Prob. Variable Coefficient Prob. Variable Coefficient Prob.
Europe
0,riciβ 0.0005 (0.33) 0,riciaβ 0.0002 (0.54)
0,ricieβ 0.0004 (0.42) 0,ricimβ 0.0007 (0.07)*
1,riciβ -0.0179 (0.72) 1,riciaβ 0.3730 (0.00)***
1,ricieβ 0.6200 (0.00)*** 1,ricimβ 0.6791 (0.00)***
2,riciβ -0.0039 (0.95) 2,riciaβ -0.1057 (0.01)***
2,ricieβ -0.0989 (0.10)* 2,ricimβ -0.2100 (0.00)***
3,riciβ 0.0102 (0.87) 3,riciaβ 0.0845 (0.07)*
3,ricieβ 0.1127 (0.04)** 3,ricimβ -0.0102 (0.80)
(1) 0.7638 (1)2 0.9126 (1) 0.4485 (1)2 0.4439 (1) 1.6407 (1)2 2.4829 (1) 0.6618 (1)2 0.4676
(2) 0.8038 (2)2 15.1840 (2) 2.5273 (2)2 4.1064 (2) 3.7549 (2)2 23.8250 (2) 0.8915 (2)2 0.5582
LM test 0.9076(0.34) LM test 0.4413(0.51) LM test 2.4730(0.12 ) LM test 0.4647 (0.50)
United States
0,riciβ 0.0004 (0.36) 0,riciaβ 0.0002 (0.64)
0,ricieβ 0.0001 (0.83) 0,ricimβ 0.0007 (0.13)
1,riciβ 0.0662 (0.25) 1,riciaβ 0.4433 (0.00)***
1,ricieβ 0.8676 (0.00)*** 1,ricimβ 0.7247 (0.00)***
2,riciβ 0.0080 (0.91) 2,riciaβ -0.2167 (0.00)***
2,ricieβ -0.3371 (0.00)*** 2,ricimβ -0.4432 (0.00)***
3,riciβ 0.0296 (0.68) 3,riciaβ 0.1122 (0.10)*
3,ricieβ 0.1890 (0.02)** 3,ricimβ 0.0401 (0.55)
(1) 0.7314 (1)2 1.1624 (1) 0.0546 (1)2 0.4668 (1) 3.8348 (1)2 10.055 (1) 6.0410 (1)2 2.3528
(2) 0.8198 (2)2 16.3480 (2) 0.0553 (2)2 6.0782 (2) 4.1515 (2)2 10.534 (2) 6.0472 (2)2 2.8914
LM test 1.1564(0.28) LM test 0.4641(0.50) LM test 10.1071(0.00) LM test 2.3473 (0.13)
Note: *, **, and *** respectively indicate that the null hypothesis was rejected under a 10%, 5%, and 1% significance level.
(1) and (2) respectively indicate the Ljung-Box Q statistic for the standardized residuals with a one- and two-period lag.
(1)2 and (2)2 respectively indicate the Ljung-Box Q statistic for the squared standardized residuals with a one- and two-period lag.
tjtStockStockjtStockjtStockjjtj uRRDRVolDRR ,,3,,2,,1,0,, 22 , 2
110 t,j,j,jt,j uh
Metals-RICIEnergy-RICIe,Agricultur-RICIRICIj , ,
2D Vol is the dummy variable indicating high volatility in stock market returns. When the volatility of stock market returns exceeds two standard deviations from the mean volatility
value, the variable is set to 1; otherwise, it is set to 0. 2RStockD is the dummy variable indicating a low stock market return period. When the stock market returns are less than two
standard deviations from the mean returns value, the variable is set to 1; otherwise, it is set to 0. it is set to 0.

The Correlation and Hedging Effects between Commodity and Stock Markets 287
Overall, the results indicate that after the 2008 financial crisis, the four commodity
indices were linked to the MSCI indices of most countries/regions and, thus, exhibited
poor hedging performances. These results were identical for the entire research period.
Regarding safe haven effects, the commodity indices performed better during periods of
high volatility compared to periods of low returns. This trend was particularly true for the
RICIA agricultural products index, the RICIE energy index, and the RICIM metals index,
which exhibited safe haven effects for the stock indices of most countries/regions.
However, the safe haven effect for the RICI composite commodities index existed for
only a few countries/regions.
4.2 4.2 Market Testing Model 2
To enhance the hypothesis testing described above, this study further examined three
short-term shocks. First, we assessed whether the four commodity indices provided
hedging or safe haven effects in stock-market investment portfolio strategies during
periods of low returns in the stock market. Second, we examined periods of high stock
market volatility before finally investigating periods of crisis in financial markets.
Table 8 shows that concerning the returns coefficient for Hypothesis 1 regarding hedging
effects ( 1,j ) during periods of low stock market returns, only the coefficient for the RICI
composite commodities index was significantly negative in relation to the MSCI indices
for Australia and China. By contrast, regarding the returns coefficients for hedging effects,
the RICI composite commodities index, RICIA agricultural commodities index, RICIE
energy index, and RICIM metals index were all significantly positive in relation to the
MSCI indices for the United States and Brazil. In addition, the RICIA agricultural
commodities index, RICIE energy index, and RICIM metals index exhibited significantly
positive coefficients in relation to the MSCI indices for Europe, Japan, Canada, Australia,
China, India, Russia, South Korea, and Taiwan. These results indicate that, during periods
of low stock market returns, only the RICI composite commodities index had significant
hedging effects for the MSCI indices of Australia and China. By contrast, the RICIA
agricultural commodities index, RICIE energy index, and RICIM metals index were
significantly linked with the stock markets of most countries/regions. These results show
that the commodity indices generally have poor hedging effects, and are identical to those
produced using Testing Model 1.
When the returns distribution for stock markets was lower than the predefined 10%
threshold, the results of the returns coefficient ( 2,j ) for Hypothesis 2 regarding safe
haven effects showed that the RICI composite commodities index, RICIE energy index,
and RICIM metals index all had safe haven effects in relation to the stock index for Brazil,
and that the RICIM metals index had safe haven effects for Europe, the United States, and
Canada.
When the returns distribution for stock markets was lower than the predefined 5%
threshold, the results of the returns coefficient ( 3,j ) for Hypothesis 2 regarding safe
haven effects showed that the RICI composite commodities index had safe haven effects
in relation to the stock indices of Australia and South Korea; the RICIE energy index had
safe haven effects for the stock indices of the United States and Russia; and the RICIM
metals index had a safe haven effect for the stock indices of Canada and Russia.
Finally, when the returns distribution for stock markets was lower than the predefined 1%
288 Yu-Min Wang, Chia-Fei Lin and Yu-Hsien Li
threshold, the results of the returns coefficient ( 4,j ) for Hypothesis 2 regarding safe
haven effects showed that only the RICIE energy index had a safe haven effect for the
stock indices of the United States; however, the RICI composite commodities index,
RICIA agricultural commodities index, and RICIM metals index were linked with the
MSCI stock indices of a number of countries/regions.
The results indicate that the four indices were linked to the MSCI indices of most
countries/regions during periods of low market returns; only the RICI composite
commodities index had a hedging effect in relation to the stock index of Australia.
Overall, the commodity indices performed poorly regarding hedging effects; these results
are identical to those provided using Testing Model 1. The safe haven effects of the
commodity indices were more pronounced and optimal when the stock market returns
distribution was lower than the thresholds of 10% and 5%, particularly for the RICIM
metals index. However, the RICIA agricultural commodities index did not exhibit safe
haven effects. When the stock market returns distribution was lower than the 1%
threshold, only the RICIE energy index exhibited a safe haven effect for the United States
stock index.
Table 9 shows that during periods of high stock market volatility, the test results of the
returns coefficients for Hypothesis 1 regarding hedging effects ( 1,j ) showed that only
the RICI composite commodities index had a significantly negative coefficient in relation
to the MSCI index of Africa. By contrast, the RICI composite commodities index, RICIA
agricultural commodities index, RICIE energy index, and RICIM metals index had
significantly positive coefficients in relation to the MSCI indices of the United States,
Canada, and Brazil. Furthermore, the RICIA agricultural commodities index, RICIE
energy index, and RICIM metals index also had significantly positive coefficients in
relation to the MSCI indices of Europe, Japan, Australia, China, India, Russia, South
Korea, and Taiwan. These results suggest that during periods of high market volatility,
only the RICI composite commodities index exhibited a significant hedging effect for the
MSCI index of Africa. By contrast, the RICIA agricultural commodities index, RICIE
energy index, and RICIM metals index were significantly linked to the stock markets of
most countries/regions. These results indicate that these commodity indices had poor
hedging effects, which is consistent with the results provided using Testing Model 1.

The Correlation and Hedging Effects between Commodity and Stock Markets 289
Table 8: Market Testing Model 2 – Periods of low market returns
Country/Region RICI (Composite commodities) RICIA (Agricultural commodities) RICIE (Energy) RICIM (Metals)
Variable Coefficient Prob. Variable Coefficient Prob. Variable Coefficient Prob. Variable Coefficient Prob.
Europe
0,riciβ 0.0007 (0.03)** 0,riciaβ 0.0004 (0.17)
0,ricieβ 0.0012 (0.01)*** 0,ricimβ 0.0010 (0.00)***
1,rici 0.0061 (0.83) 1,ricia 0.2456 (0.00)***
1,ricie 0.4262 (0.00)*** 1,ricim 0.5194 (0.00)***
2,rici -0.0081 (0.94) 2,ricia 0.1037 (0.05)**
2,ricie 0.0494 (0.53) 2,ricim -0.1516 (0.01)***
3,rici -0.0006 (0.99) 3,ricia -0.0087 (0.89)
3,ricie -0.0396 (0.62) 3,ricim -0.0324 (0.58)
4,rici -0.0193 (0.79) 4,ricia 0.0824 (0.14)
4,ricie 0.2555 (0.00)*** 4,ricim 0.1591 (0.01)***
(1) 0.0005 (1)2 0.7959 (1) 0.2017 (1)2 0.3656 (1) 1.9329 (1)2 1.7445 (1) 0.1113 (1)2 0.3015
(2) 0.3909 (2)2 2.1884 (2) 4.0218 (2)2 0.5159 (2) 2.2086 (2)2 6.1995 (2) 0.4059 (2)2 0.8437
LM test 0.7937 (0.37) LM test 0.3646 (0.55) LM test 1.7409 (0.19) LM test 0.3006 (0.58)
United States
0,riciβ 0.0006 (0.03)** 0,riciaβ 0.0003 (0.34)
0,ricieβ 0.0004 (0.40) 0,ricimβ 0.0011 (0.00)***
1,rici 0.1234 (0.00)**** 1,ricia 0.2086 (0.00)***
1,ricie 0.5010 (0.00)*** 1,ricim 0.3242 (0.00)***
2,rici 0.0968 (0.30) 2,ricia 0.0292 (0.73)
2,ricie 0.1454 (0.16) 2,ricim -0.1644 (0.09)*
3,rici -0.0272 (0.74) 3,ricia 0.2283 (0.00)***
3,ricie 0.3042 (0.00)*** 3,ricim 0.1222 (0.17)
4,rici 0.0184 (0.81) 4,ricia -0.0935 (0.15)
4,ricie -0.2109 (0.03)** 4,ricim 0.0455 (0.59)
(1) 3.2711 (1)2 0.5185 (1) 0.0405 (1)2 0.3633 (1) 3.5967 (1)2 3.3579 (1) 4.3510 (1)2 0.0841
(2) 3.7875 (2)2 3.7553 (2) 0.7264 (2)2 0.8180 (2) 3.7117 (2)2 3.8766 (2) 4.3917 (2)2 1.9510
LM test 0.5170 (0.47) LM test 0.3622 (0.55) LM test 3.3538 (0.07) LM test 0.0838 (0.77)
Note: *, **, and *** respectively indicate that the null hypothesis was rejected under a 10%, 5%, and 1% significance level.
(1) and (2) respectively indicate the Ljung-Box Q statistic for the standardized residuals with a one- and two-period lag.
(1)2 and (2)2 respectively indicate the Ljung-Box Q statistic for the squared standardized residuals with a one- and two-period lag.

290 Yu-Min Wang, Chia-Fei Lin and Yu-Hsien Li
When the volatility of stock market returns exceeded the predefined 90% threshold, the
test results of the returns coefficient ( 2,j ) for Hypothesis 2 regarding safe haven effects
showed that the RICI composite commodities index had a significantly negative
coefficient in relation to the MSCI index of South Korea, and that the RICIA agricultural
commodities index had a significantly negative coefficient in relation to the MSCI index
of Japan. Furthermore, the RICIM metals index also had significantly negative
coefficients for the MSCI indices of the United States, Japan, Canada, and Australia.
These results indicate that the RICI composite commodities index exhibited a safe haven
effect for the stock index of South Korea, and that the RICIA agricultural commodities
index had a safe haven effect for the stock index of Japan. Finally, the RICIM metals
index also exhibited safe haven effects in relation to the stock indices of the United States,
Japan, Canada, and Australia.
When the volatility of stock market returns exceeded the predefined 95% threshold, the
results of the returns coefficient ( 3,j ) for Hypothesis 2 regarding safe haven effects
showed that the RICIE energy index had a significantly negative coefficient in relation to
the MSCI index of Canada, and that the RICIM metals index had a significantly negative
coefficient in relation to the MSCI index of Russia. These results demonstrate that the
RICIE energy index exhibited a safe haven effect for the stock index of Canada and the
RICIM metals index exhibited a safe haven effect for the stock index of Russia.
Finally, when the volatility of stock market returns exceeded the predefined 99%
threshold, the results of the returns coefficient ( 4,j ) for safe haven effects showed that
the RICI composite commodities index, RICIA agricultural commodities index, RICIE
energy index, and RICIM metals index had significantly negative coefficients in relation
to the MSCI index of Russia, and that the RICIA agricultural commodities index, RICIE
energy index, and RICIM metals index also had significantly negative coefficients in
relation to the MSCI index for South Korea. In addition, the RICIE energy index
exhibited a significantly negative coefficient in relation to the MSCI index of the United
States, and the coefficient of the RICIA agricultural commodity index regarding the
MSCI index for Brazil was also significantly negative. These results suggest that the four
commodity indices all had safe haven effects for the stock indices of Russia, whereas the
RICIA agricultural commodities index, RICIE energy index, and RICIM metals index
also had safe haven effects for the stock index of South Korea.
In summary, we found that the four commodity indices were linked to the MSCI indices
of most countries/regions during periods of high market volatility. Only the RICI
composite commodities index exhibited a hedging effect in relation to the stock market
index for Africa. Overall, the commodity indices performed poorly regarding hedging
effects. These results are identical to those produced using Testing Model 1. The
commodity indices generally showed superior performance regarding safe haven effects
compared to hedging effects when the volatility of stock market returns exceeded the 90%
and 99% thresholds; the RICIM metals index performed particularly well. However, the
RICI composite commodities index performed relatively poorly regarding safe haven
effects. When the volatility of stock market returns exceeded the 95% threshold, only the
RICIE energy index and RICIM metals index exhibited safe haven effects for the stock
market indices of Canada and Russia, respectively.
Table 10 shows that during crisis periods in stock markets, the test results of the returns

The Correlation and Hedging Effects between Commodity and Stock Markets 291
coefficient ( 1,j ) for Hypothesis 1 regarding hedging effects indicate that only the RICI
composite commodities index had a significant hedging effect for the MSCI index of
Africa. By contrast, the RICIA agricultural commodities index, RICIE energy index, and
RICIM metals index were significantly linked to the stock markets of most
countries/regions. These results indicate poor hedging effects, which is consistent with the
findings of Testing Model 1.
During crisis periods in stock markets, the results of the returns coefficient ( 2,j ) for
Hypothesis 2 regarding safe haven effects showed that the RICIM metals index had
significantly negative coefficients for the MSCI indices of Europe, the United States,
Canada, Australia, Russia, Brazil, and South Korea; the RICIE energy index also showed
significantly negative coefficients in relation to Canada and Russia. In addition, the RICI
composite commodities index exhibited a significantly negative coefficient in relation to
the MSCI index of Russia, which indicates that the RICI composite commodities index
provides a safe haven effect for the stock index of Russia. The RICIE energy index also
exhibited a safe haven effect for the stock indices of Canada and Russia. Finally, the
RICIM metals index showed safe haven effects for the stock indices of Europe, the
United States, Canada, Australia, Russia, Brazil, and South Korea.

292 Yu-Min Wang, Chia-Fei Lin and Yu-Hsien Li
Table 9: Market Testing Model 2 – Periods of high market volatility Country
/Region
RICI (Composite commodities) RICIA (Agricultural commodities) RICIE (Energy) RICIM (Metals)
Variable Coefficient Prob. Variable Coefficient Prob. Variable Coefficient Prob. Variable Coefficient Prob.
Europe
0,riciβ 0.0007 (0.02)** 0,riciaβ 0.0001 (0.56)
0,ricieβ 0.0005 (0.18) 0,ricimβ 0.0007 (0.01)***
1,rici 0.0038 (0.88) 1,ricia 0.2683 (0.00)***
1,ricie 0.4833 (0.00)*** 1,ricim 0.5794 (0.00)***
2,rici -0.0292 (0.66) 2,ricia 0.0263 (0.53)
2,ricie 0.1515 (0.07)* 2,ricim -0.0796 (0.11)
3,rici -0.0477 (0.62) 3,ricia 0.0937 (0.16)
3,ricie 0.0592 (0.62) 3,ricim -0.0430 (0.60)
4,rici 0.2359 (0.20) 4,ricia -0.0831 (0.44)
4,ricie -0.0848 (0.67) 4,ricim -0.0394 (0.69)
(1) 0.0007 (1)2 0.8625 (1) 0.4216 (1)2 0.2573 (1) 1.5439 (1)2 0.8575 (1) 0.0235 (1)2 0.2180
(2) 0.2761 (2)2 2.2344 (2) 3.4515 (2)2 0.3627 (2) 1.7101 (2)2 4.4741 (2) 0.2305 (2)2 0.7350
LM test 0.8601 (0.35) LM test 0.2565 (0.61) LM test 0.8552 (0.36) LM test 0.2174 (0.64)
United
States
0,riciβ 0.0006 (0.03)** 0,riciaβ 0.0002 (0.53)
0,ricieβ 0.0005 (0.24) 0,ricimβ 0.0009 (0.00)***
1,rici 0.1250 (0.00)*** 1,ricia 0.2423 (0.00)***
1,ricie 0.5155 (0.00)*** 1,ricim 0.4371 (0.00)***
2,rici 0.0239 (0.77) 2,ricia -0.0007 (0.99)
2,ricie -0.1086 (0.22) 2,ricim -0.2625 (0.00)***
3,rici -0.0490 (0.61) 3,ricia 0.0371 (0.65)
3,ricie 0.2894 (0.02)** 3,ricim 0.0572 (0.59)
4,rici 0.2085 (0.16) 4,ricia -0.0729 (0.42)
4,ricie -0.3219 (0.03)** 4,ricim -0.0728 (0.52)
(1) 3.0601 (1)2 0.7686 (1) 0.0419 0.4328 (1) 1.9721 (1)2 1.6763 (1) 4.9267 (1)2 0.3838
(2) 3.6951 (2)2 3.9082 (2) 0.8660 (2)2 0.7578 (2) 2.0021 (2)2 2.0110 (2) 4.9955 (2)2 1.4222
LM test 0.7665 (0.38) LM test 0.4315 (0.51) LM test 1.6725 (0.20) LM test 0.3826 (0.54)
Note: *, **, and *** respectively indicate that the null hypothesis was rejected under a 10%, 5%, and 1% significance level. (1) and (2) respectively indicate the Ljung-Box Q statistic
for the standardized residuals with a one- and two-period lag. (1)2 and (2)2 respectively indicate the Ljung-Box Q statistic for the squared standardized residuals with a one- and
two-period lag. Dummy variables 1,90hD tStock q , 1,95hD tStock q , and 1,99hD tStock q were designed to capture different levels of returns volatility in the stock market; these
variables were set to 1 if the volatility of stock market returns exceeded the predefined thresholds of 90%, 95%, and 99%; otherwise, they were set to 0.
t,jt,Stockt,j,jt,j uRR 0 1994,1953,1902,1,, ,tStockj,tStockj,tStockjjtj qhqhqhD
2
110 t,j,j,jt,j uh
Metals-RICIEnergy-RICIe,Agricultur-RICIRICIj , ,

The Correlation and Hedging Effects between Commodity and Stock Markets 293
Table 10: Market Testing Model 2 – Market crisis periods
Country/Region RICI (Composite commodities) RICIA (Agricultural commodities) RICIE (Energy) RICIM (Metals)
Variable Coefficient Prob. Variable Coefficient Prob. Variable Coefficient Prob. Variable Coefficient Prob.
Europe
0,riciβ 0.0007 (0.01)*** 0,riciaβ 0.0001 (0.55)
0,ricieβ 0.0005 (0.21) 0,ricimβ 0.0007 (0.01)***
1,rici 0.0065 (0.78) 1,ricia 0.2609 (0.00)***
1,ricie 0.5018 (0.00)*** 1,ricim 0.5889 (0.00)***
2,rici -0.0780 (0.19) 2,ricia 0.1179 (0.00)***
2,ricie 0.1663 (0.02)** 2,ricim -0.1818 (0.00)***
(1) 0.0009 (1)2 0.9676 (1) 0.3492 (1)2 0.1666 (1) 1.6625 (1)2 1.1208 (1) 0.0555 (1)2 0.0611
(2) 0.3259 (2)2 2.3189 (2) 3.6031 (2)2 0.3234 (2) 1.8288 (2)2 5.3190 (2) 0.1967 (2)2 0.4723
LM test 0.9650 (0.33) LM test 0.1661 (0.68) LM test 1.1181 (0.29) LM test 0.0609 (0.81)
United States
0,riciβ 0.0006 (0.02)** 0,riciaβ 0.0002 (0.53)
0,ricieβ 0.0004 (0.29) 0,ricimβ 0.0009 (0.01)***
1,rici 0.1191 (0.00)*** 1,ricia 0.2347 (0.00)***
1,ricie 0.5166 (0.00)*** 1,ricim 0.4053 (0.00)***
2,rici 0.0745 (0.17) 2,ricia 0.0463 (0.28)
2,ricie 0.0286 (0.68) 2,ricim -0.1855 (0.00)***
(1) 3.0911 (1)2 0.4635 (1) 0.0714 (1)2 0.3358 (1) 2.5517 (1)2 2.4902 (1) 4.3846 (1)2 0.3177
(2) 3.7444 (2)2 3.8225 (2) 0.7835 (2)2 0.6851 (2) 2.5810 (2)2 2.772 (2) 4.4268 (2)2 2.2842
LM test 0.4622 (0.50) LM test 0.3348 (0.56) LM test 2.4860 (0.12) LM test 0.3167 (0.57)
Note: *, **, and *** respectively indicate that the null hypothesis was rejected under a 10%, 5%, and 1% significance level.
(1) and (2) respectively indicate the Ljung-Box Q statistic for the standardized residuals with a one- and two-period lag.
(1)2 and (2)2 respectively indicate the Ljung-Box Q statistic for the squared standardized residuals with a one- and two-period lag.
tjtStocktjjtj uRR ,,,0,,
2008,2,1,, subprimeDjjtj
2
110 t,j,j,jt,j uh
Metals-RICIEnergy-RICIe,Agricultur-RICIRICIj , ,
The dummy variable 2008,D subprime represents the subprime mortgage event that occurred in 2008

294 Yu-Min Wang, Chia-Fei Lin and Yu-Hsien Li
In summary, this study determined that during periods of market crisis, the four
commodity indices were linked to the MSCI indices of most countries/regions. Only the
RICI composite commodities index had hedging effects for the stock index of Africa.
Therefore, the commodity indices generally exhibited poor hedging effects. These results
are identical to those obtained using Testing Model 1. Regarding safe haven effects,
during market crises, the RICIM metals index exhibited a safe haven effect for the stock
indices of most countries/regions. However, the RICIA agricultural commodities index
did not exhibit safe haven effects. Consequently, during serious stock market crises,
investors should include the RICIM metals index in their investment portfolios to reduce
investment portfolio risk.
5 Conclusion
This study examined the relationship between commodity and stock markets. Numerous
types of commodity markets that have economic characteristics exhibiting substantial
differences exist. For example, the metals and agricultural commodity markets have
differing influences on economic activity. Consequently, a holistic commodities index
cannot be used to identify the correlation between stock markets and different types of
commodity characteristics, thereby preventing the development of clear hedging
strategies for investors. Therefore, this study examined commodities divided into
individual categories, using the RICI composite commodities, agricultural commodities,
energy, and metals commodity indices to examine the relationships between commodity
and stock markets. We first performed cointegration testing to observe the long-term
relationships between the two markets, and then conducted causal relationship testing to
examine whether spillover effects existed between the returns in the markets. Based on
the models developed by Hillier, Draper, and Faff (2006) and Baur and Lucey (2010), this
study also further tested whether hedging and safe haven effects existed in stock-market
investment portfolio strategies for the four commodity categories, or whether only safe
haven effects existed.
The empirical results of cointegration testing showed that the RICI composite
commodities index exhibited cointegration relationships with the MSCI indices of the
following nine countries/regions: Europe, the United States, Canada, Australia, China,
India, Russia, South Korea, and Taiwan. The RICA agricultural commodities index
exhibited cointegration relationships with the MSCI indices of four countries, namely,
Australia, India, South Korea, and Taiwan. The RICIE energy index exhibited
cointegration relationships with the MSCI indices of the six countries of Canada,
Australia, China, Brazil, South Korea, and Taiwan. Finally, the RICIM metals index
exhibited cointegration relationships with the MSCI indices of the following nine
countries/regions: Europe, Japan, Canada, India, Russia, Brazil, South Korea, Taiwan,
and Africa. These results indicate that long-term stable relationships exist between the
stock markets and commodity indices of these countries/regions.
Moreover, the empirical results of the causal relationship tests indicated that the
commodity markets generally led stock markets. For example, the RICI composite
commodities index led the stock market indices of Japan, Australia, Russia, South Korea,
Taiwan, and Africa; the RICIA agricultural commodities index led the stock market
indices of Japan, China, India, Brazil, South Korea, Taiwan, and Africa; the RICIE
energy index led the stock market indices of Japan, Australia, Russia, Taiwan, and Africa;

The Correlation and Hedging Effects between Commodity and Stock Markets 295
and finally, the RICIM metals index led the stock market indices of China, India, Russia,
South Korea, Taiwan, and Africa. Therefore, investors can predict stock market price
fluctuations in these countries/regions using changes in the four commodity indices. By
contrast, the stock market index for the United States led the RICI composite
commodities index, RICIA agricultural commodities index, and the RICIM metals index,
indicating that these three indices are influenced by the stock market of the United States.
Finally, the empirical results for the testing models concerning hedging and safe haven
effects demonstrate that for Hypothesis 1 regarding hedging effects for the commodity
market, the RICI composite commodities, RICIA agricultural commodities, RICIE energy,
and RICIM metals indices were linked to the MSCI indices of most countries/regions
regardless of whether the period examined was the entire research period or the period
before/after the 2008 financial crisis. These results indicate that the four commodity
indices exhibited poor hedging performances.
Concerning Hypothesis 2 regarding safe haven effects in the commodity market, the
RICIA agricultural commodities, RICIE energy, and RICIM metals indices exhibited safe
haven effects for the stock indices of most countries/regions following the 2008 financial
crisis. However, the commodity indices only showed safe haven effects in a few
countries/regions prior to the 2008 crisis.
Furthermore, the safe haven relationship results differed between the two periods, which
suggested that commodity markets exhibit safe haven effects when stock markets
experience crises. Of these indices, the RICIM metals index exhibited the best hedging
performance. In addition, the safe haven effects of the commodity indices were superior
during periods of high stock market volatility compared to periods of low returns. This
trend was particularly true for the RICIM metals index, which showed safe haven effects
in relation to the stock indices of most countries/regions. By comparison, the RICIA
agricultural commodities index exhibited significantly poorer hedging effects. The
findings discussed above suggest that the hedging effects exhibited by the RICI composite
commodities index were comparatively less apparent; this was possibly because the RICI
composite commodities index is a general or holistic commodities index with many
categories of commodities, hindering its display of specific commodity characteristics.
Moreover, the RICIA agricultural commodities, RICIE energy, and RICIM metals indices
exhibited differing safe haven effects. Among these indices, the RICIM metals index
exhibited the strongest hedging effects, unlike the hedging effects of the RICIA
agricultural commodities index, which were relatively less evident. As a result, this study
contends that commodities should be divided into categories to facilitate individual
examination of their relationships with stock markets.
In summation, long-term relationships were observed between several commodity and
stock markets, and the commodity indices generally led the stock market indices. Thus,
investors can predict price changes in the stock markets of various countries/regions using
variations in commodity indices. However, the U.S. stock market influences the RICI
composite commodities, RICIA agricultural commodities, and RICIM metals commodity
indices. In addition, when severe crises or high volatility occurs in stock markets,
investors can include the RICIM metals index in investment portfolios as a safe haven
asset, thereby reducing risk. Nevertheless, the results of this study showed that hedging
effects do not exist between commodity market indices and stock markets under normal
circumstances, which means that commodity indices typically cannot be employed in
hedging strategies.
This study adopted the RICI composite commodities, agricultural commodities, energy,

296 Yu-Min Wang, Chia-Fei Lin and Yu-Hsien Li
and metals commodity indices and the MSCI stock indices for 12 countries/regions to
examine the correlation and hedging effects that exist between commodity markets and
stock markets. The results showed that commodity markets exhibit a poor hedging
performance in relation to stock markets. Therefore, this study suggests that bond markets
be included in future research to examine the correlation and hedging effects between
commodity markets, bond markets, and stock markets, and thereby provide investors with
a reference for hedging strategies.
References
[1] Baur, D. G. and Lucey, B. M., Is Gold a Hedge or a Safe Haven? An Analysis of
Stocks, Bonds and Gold, The Financial Review, 45, (2010), 217-229.
[2] Ciner, C. , Gurdgiev, C. and Lucey, B. M., Hedges and Safe Havens – An
Examination of Stocks, Bonds, Oil, Gold and the Dollar, IIIS Discussion Paper, 337,
(2010), University of North Carolina, University of Dublin and University of
Dublin.
[3] Coudert, V. and Raymond, H., ―Gold and Financial Assets: Are There any Safe
Havens in Bear Markets?‖ CEPII research center, Working Papers, No. 2010-2013,
(2010), Paris University and Paris University.
[4] Edwards, F. R. and Caglayan, M. O., Hedge Fund and Commodity Fund
Investments in Bull and Bear Markets, Journal of Portfolio Management, 27(4),
(2001), 97-108.
[5] Gorton, G. B. and Rouwenhorst, K. G., Facts and Fantasies about Commodity
Futures, Financial Analysts Journal, 62(2), (2006), 47-68.
[6] Granger, C. W. J. and Newbold, P., Spurious Regressions in Econometrics, Journal
of Econometrics, 2, (1974), 111-120.
[7] Granger, C. W. J., Investigating Causal Relation by Econometric and
Cross-Sectional Method, Econometrica, 37, (1969), 424-438.
[8] Hamilton, J. D., Oil and the Macroeconomy since World War II, Journal of Political
Economy, 91, (1983), 228-248.
[9] Hillier, D., Draper, P. and Faff, R., Do Precious Metals Shine? An Investment
Perspective, Financial Analysts Journal, 62(2), (2006), 98-106.
[10] Hunjra, A. I., Azam M., Niazi G. S. K., Butt, B. Z., Rehman, K. U. and Azam, R.I.,
Risk and Return Relationship in Stock Market and Commodity Prices: A
Comprehensive Study of Pakistani Markets, World Applied Sciences Journal, 13(3),
2011, 470-481.
[11] Jalil, N. A., Ghani G. M., Daud J., and Ibrahim M., Stock Price Movements : Does
Change in Energy Price Matter?, Instituto Brasileiro de Estudos Empresariais e
Jurídicos(IBEJ), 2(1), (2009).
[12] Park, J. W. and Ratti, R.A., Oil Price Shocks and Stock Markets in the medals and
13 European Countries, Energy Economics, 30(5), 2008, 2587-2608.
[13] Phillips, P. B. C. and Perron, P., Testing for a Unit Root in Time Series Regression,
Biometrika, 75, (1988), 335-346.
[14] Said E. and David A. D., Testing for Unit Roots in Autoregressive Moving Average
Models of Unknown Order, Biometrika, 71, (1984), 599-607.
[15] Sims H. P. J., Further Thoughts on Punishment in Organizations, Academy of
Management Review, 5, (1980), 133-138.

The Correlation and Hedging Effects between Commodity and Stock Markets 297
[16] Sumner, S. , Johnson, R. , Soenen, L., Spillover Effects between Gold, Stocks, and
Bonds, Journal of CENTRUM Cathedra, 3(2), (2010), 106-120.
[17] Wang, M. L. , Wang, C. P. and Huang, T. Y., Relationships among Oil Price, Gold
Price, Exchange Rate and International Stock Markets, International Research
Journal of Finance and Economics, 47, 2010, 82-91.
[18] World Gold Council; http://www.gold.org/
[19] Bureau of Energy, Ministry of Economic Affairs; http://www.moeaboe.gov.tw/
[20] Barchart, http://www.barchart.com/
[21] Rogers International Commodity Index; http://www.rogersrawmaterials.com/
[22] Morgan Stanley Capital International; http://www.mscibarra.com/