the correlation between driver personas and crash …
TRANSCRIPT

THE CORRELATIONBETWEEN DRIVERPERSONAS ANDCRASH RISK
REAL-WORLD DRIVER RISK
PROFILING WITH TELEMATICS
DATA

2 THE CORRELATION BETWEEN DRIVER PERSONAS AND CRASH RISK
AGERO SAFE. SMART. DRIVEN.
WHY READ THIS PAPER?
Agero’s research covering billions of driven miles and thousands of
crashes is delivering new insights into driver behavior and accident
risk. Understanding this correlation will allow insurers, automotive
manufacturers and others to better create the products and strategies
needed to decrease risk, drive down costs and ultimately save lives.
This paper dissects the data to create seven driver personas, identify
their level of risk, and propose examples of the strategies that might
impact likelihood of an accident.

AS AUTOMOTIVE FATALITIES AND CLAIM COSTS CONTINUE TO CLIMB, UNDERSTANDING AND MEASURING THE CORRELATION BETWEEN DRIVER BEHAVIOR AND CRASH RISK HAS NEVER BEEN MORE IMPORTANT.
3THE CORRELATION BETWEEN DRIVER PERSONAS AND CRASH RISK
AGERO SAFE. SMART. DRIVEN.
BEHAVIOR DRIVES RISKAs automotive fatalities and claim costs continue to climb,
understanding and measuring the correlation between
driver behavior and crash risk has never been more
important. If one can assess and quantify the impact of
behavior on risk, it becomes possible to initiate steps to
reduce that risk, and perhaps even eliminate some types
of accidents before they occur. Fortunately, new mobile
telematics research – data that is unprecedented in scope,
volume and includes, most importantly, real-world crash
validation – provides unique insights into the connection
between the pattern of driver behavior (a driver’s
“persona”) and the likelihood that behavior will result in
certain types of crashes.
NEW DATA, NEW INSIGHTS
Measuring driver behavior and quantifying risk is central
to Agero’s mission of making roads safer. In December
2016 the company launched an innovative mobile app,
MileUp®, to crowd-source the collection of smartphone-
based driving data in order to validate lab crash test results
against real-world behavior. In a little over a year, 350,000
users drove more than 3 billion miles over 270 million trips.
Per our MileUp white paper Saving Lives with Mobile Crash
Detection, this data set has enabled Agero’s data scientists
to learn a considerable amount about how people drive
including the patterns of behavior that most closely
correlate with crash risk.
This vast MileUp data set contains information covering
every trip that each of the users took while they were
enrolled in the program. Perhaps more importantly, in
addition to billions of miles of driver insight, the data
includes several hundred reported crash events, complete
with police reports, photographs, and testimonials. The
dataset also covers thousands of additional crashes that
were identified using the company’s proprietary mobile
crash detection technology.
This unique combination of real-world behavioral data and
crash events provides an exciting opportunity to answer
key questions about risk and how best to combat it.

Manipulation
Call
3500
2500
1500
1000
500
0
3000
2000
0.00 0.05 0.10 0.15 0.20 0.25 0.30 0.35 0.40
Fraction of trip time
# of
use
rs
4 THE CORRELATION BETWEEN DRIVER PERSONAS AND CRASH RISK
AGERO SAFE. SMART. DRIVEN.
A TIMELY – AND CRITICAL – TOPIC
The skyrocketing incidence of distracted driving puts
smartphone use among the hottest topics in policy,
transportation and insurance circles – and rightly so, as
we will see. Importantly for the topic at hand – and unlike
weather, road conditions, traffic, etc. – smartphone use
while driving is something that the driver directly controls.
As such, our data scientists put considerable emphasis on
understanding how people are using their phones while
driving, and the corresponding implications for crash risk.
The data confirms what is already suspected: phone use
while driving is all too common (Fig. 1). Although most
users rarely if ever make calls (counting time using either
the handset or a hands-free device), there are some that
spend a considerable amount of their overall drive time
talking – up to 50% of drive time in the most extreme cases.
Meanwhile, almost everyone manipulates their phones
to some degree while on the road. That manipulation
includes texting, reading email, browsing social media
feeds, skipping to the next song on their media app, etc.
On average the data shows that about 10% of drive time is
spent manipulating the phone in some capacity.
Figure 1 – Distributions of phone call and manipulation rates for MileUp users
Source: Agero analysis of MileUp data

0.12 Manipulation
Call
0.10
Age
Frac
tion
of t
rip t
ime 0.08
0.06
0.04
0.02
17–2
2
22–2
7
27–3
2
32–3
7
42–4
7
42–4
7
47–5
2
52–5
7
57–6
2
62–6
767
–72
72–7
7
5THE CORRELATION BETWEEN DRIVER PERSONAS AND CRASH RISK
AGERO SAFE. SMART. DRIVEN.
Figure 2 – Phone call and manipulation rates by age for MileUp users
Source: Agero analysis of MileUp data
DIFFERENCES IN BEHAVIOR
Digging deeper reveals different usage patterns among
different populations of users. For instance, Fig. 2 shows
that phone use is generational. Younger drivers rarely talk
on the phone, but are heavy users of other features that
equate to manipulation. Middle-aged drivers actually talk
about the same amount as they text – and tend to do both
regularly. Meanwhile, older drivers tend to use the phone
less in all capacities, although significant phone use is
observed even among the oldest drivers in our population.

0.02
Fraction of “Phone Surfers”
0.05 0.08 0.11 0.13 0.16 0.19
6 THE CORRELATION BETWEEN DRIVER PERSONAS AND CRASH RISK
AGERO SAFE. SMART. DRIVEN.
Phone use also varies by state. The Gulf states, for instance,
all have among the highest rates of heavy phone users per
capita (those in the top 10% by phone manipulation, i.e.
those with nearly double the average manipulation rates
or higher). Meanwhile, states on the West Coast have a
relatively low proportion of heavy phone manipulators.
Interestingly, there is only a marginal impact from state
laws prohibiting phone use. Phone manipulation is roughly
10 percentage points lower in states with an outright ban
on all handheld phone use. While this is a step in the right
direction, perhaps there are more effective ways to reduce
phone use on the roads beyond hard-to-enforce laws.
Figure 3 – Fraction of MileUp users with the highest rates of phone manipulation by state.
Source: Agero analysis of MileUp data

Manipulation
Call
5
6
7
8
Decile events per minute
Rela
tive
cra
sh r
ate
4
3
2
1
0–10
10–2
0
20–3
0
30–4
0
40–5
0
50–6
0
60–7
0
70–8
0
80–9
0
90–1
00
7THE CORRELATION BETWEEN DRIVER PERSONAS AND CRASH RISK
AGERO SAFE. SMART. DRIVEN.
CORRELATING BEHAVIOR WITH RISK
Clearly, different user groups tend to display different
behavioral characteristics, which isn’t a notable insight. But
by correlating driving behavior with crash data, it’s possible
to begin understanding the impacts of these different
behaviors on safety.
Studies have shown that phone use while driving does
impact crash risk [Dingus et al, 2016], although current
naturalistic driving data is lacking. Yet given the rapid
pace of change in smartphone capability and the dramatic
growth in ownership rates, it is very likely that user
behavior and risk factors have changed even in the last five
years. The MileUp data set provides a unique opportunity
to directly measure the current impact of phone use on
crash risk at large scale.
In aggregate, the data shows that phone manipulation (and
less so, call frequency) is highly correlated with crash risk.
The plot below shows the observed crash rate for deciles
of MileUp users, grouped by phone use-rates relative to
the crash rate in the lowest decile. Drivers in the top 10% of
measured phone manipulation had approximately 8 times
the crash rate per mile driven, compared to the bottom
10% of phone manipulators. Meanwhile, users that spend a
lot of time talking on the phone were 2 times more likely to
crash compared to users least likely to talk while driving.
Overall, phone manipulation is the single riskiest behavior
observed in the MileUp study, and poses a clear threat to
public safety.
Figure 4 – Relative crash rate for MileUp users in deciles of phone call and manipulation rates.
Note: Manipulation is any texting, reading email, browsing social media, skipping to the next song, etc. Call is the frequency of phone calls, whether using the handset or hands-free devices. Source: Agero analysis of MileUp data
THE MILEUP DATA SET PROVIDES A UNIQUE OPPORTUNITY TO DIRECTLY MEASURE THE CURRENT IMPACT OF PHONE USE ON CRASH RISK AT LARGE SCALE.

Model Citizens Phone Surfers Talkers Red-light Readers Traffic Texters City Dwellers Highway Cruisers
% of Population 12% 15% 21% 8% 5% 11% 12%
Average Age OLDER YOUNGER OLDER Slightly Older Slightly Younger Slightly Younger OLDER
Crash Rate -47% +76% -30% -12% +16% +17% -19%
Cruise Control HIGH LOW Average Average Average LOW HIGH
Bluetooth Slightly Low Slightly Low HIGH Average LOW Slightly Low Average
Rural vs Urban Average Average Average Slight Urban Slight Rural URBAN RURAL
Figure 5 – MileUp user personas.
Source: Agero analysis of MileUp data
12%
15%
21%
8 THE CORRELATION BETWEEN DRIVER PERSONAS AND CRASH RISK
AGERO SAFE. SMART. DRIVEN.
PATTERNS IN USER BEHAVIOR: THE SEVEN DRIVER PERSONAS
With these findings in mind, Agero has identified seven
different driver personas based on patterns in phone
usage behaviors and factors related to speed. Looking
at the demographics in each segment reveals interesting
trends that help better understand drivers and what
contributes to crash risk.
Each of the groups below represent a distinct non-
overlapping segment of the overall driver population;
inclusion in one group precludes inclusion in another.
“Model Citizens” represent around
12% of the population. These are
the users with the lowest phone use
overall, including both manipulation
and calls. Thanks to their tendency to
avoid using the phone on the road,
their crash rate is half that of the
average user.
Figure 5 – MileUp user personas.
“Talkers” spend the most time
talking on the phone while driving
and represent 21% of the population.
Despite the large proportion of time
spent talking on the phone, their
crash rate is 30% lower than average,
perhaps because they tend to use
hands-free Bluetooth devices at a
high rate.
“Phone Surfers” represent 15% of
the population. These users are the
heaviest phone manipulators. As a
result, their crash rate is 76% higher
than the average.

Source: Agero MileUp Challenge example
5%
11%
12%
8%
9THE CORRELATION BETWEEN DRIVER PERSONAS AND CRASH RISK
AGERO SAFE. SMART. DRIVEN.
INFLUENCING BEHAVIOR TO IMPACT RISK
As these seven groups are very different both behaviorally
and demographically, it’s likely safe to assume their
motivations are quite different, too. This unfortunately
means a “one size fits all” approach to influencing behavior
– such that it reduces risk – will be ineffective.
However, by better understanding the differences between
the groups it will be possible to best tailor strategies and
incentives for each specific user segment. For example, an
insurer that wants to reduce the 76% higher than average
risk for drivers in the “Phone Surfer” segment might design
a game that rewards avoidance of texting while the vehicle
is in motion, thus helping push those drivers into the Red-
Light Reader group, with its 12% below average risk. While
not eliminating phone use, it has the potential to show
a dramatic impact on overall risk. Knowing that “Phone
Surfers” skew younger, and show a preference for luxury
vehicles, would further influence the marketing, game
design and incentives.
“Red-Light Readers” are roughly 8%
of the population. These are drivers
that may manipulate their phones,
but usually only do so while stopped
in traffic. Although the manipulation
rates for this group are moderate,
their crash rate overall is still 12%
below average.
“Traffic Texters” comprise 5% of the
population. They record moderate
amounts of phone use at a wide
range of speeds. As a result, these
users have a 16% higher crash rate
than the average driver.
“City Dwellers” are users with relatively
low average speeds and represent 11%
of the population. These are urban
drivers with typical phone use behaviors,
but with much of their driving done in
the city where crash risk is higher due
to increased traffic and more complex
roadways. As a result, their crash rate is
17% higher than the average.
“Highway Cruisers” are users with
relatively high average speed and
they represent 12% of the population.
Although their phone manipulation
behavior is similar to the City
Dwellers group, their crash rate is
19% lower than average since they
spend a lot of time on the highway
where overall crash risk is lower.
10 THE CORRELATION BETWEEN DRIVER PERSONAS AND CRASH RISK
AGERO SAFE. SMART. DRIVEN.
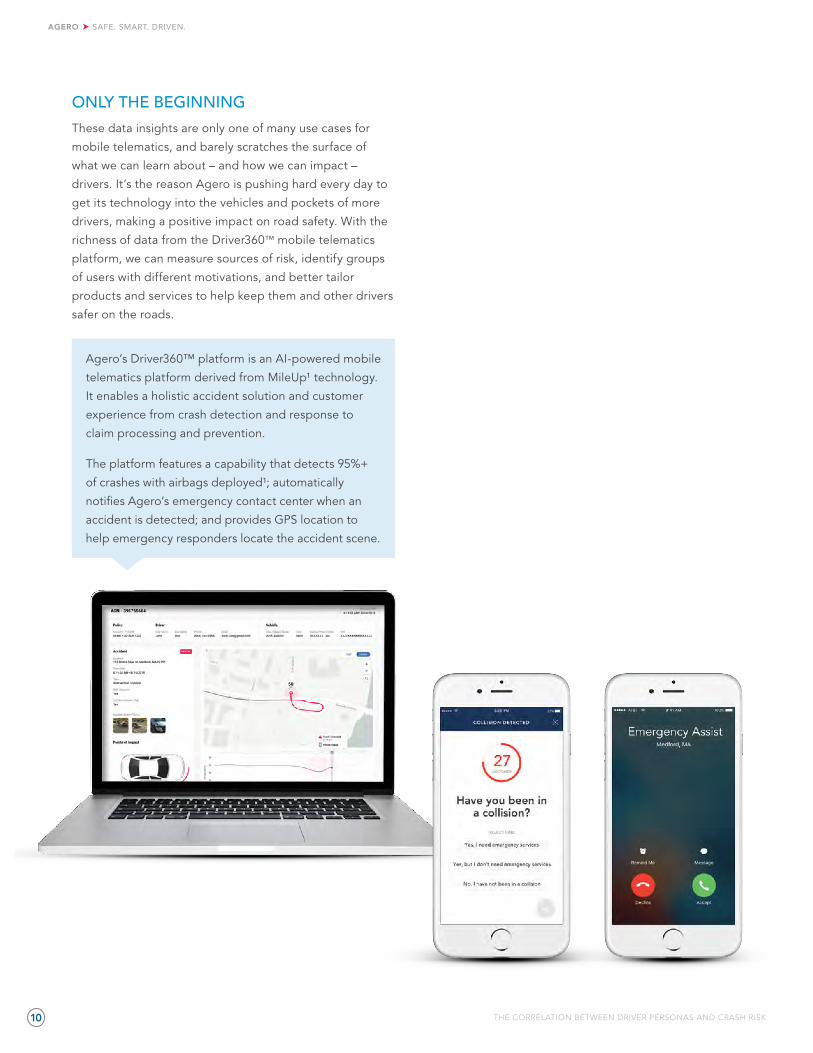
ONLY THE BEGINNING
These data insights are only one of many use cases for
mobile telematics, and barely scratches the surface of
what we can learn about – and how we can impact –
drivers. It’s the reason Agero is pushing hard every day to
get its technology into the vehicles and pockets of more
drivers, making a positive impact on road safety. With the
richness of data from the Driver360™ mobile telematics
platform, we can measure sources of risk, identify groups
of users with different motivations, and better tailor
products and services to help keep them and other drivers
safer on the roads.
Agero’s Driver360™ platform is an AI-powered mobile
telematics platform derived from MileUp¹ technology.
It enables a holistic accident solution and customer
experience from crash detection and response to
claim processing and prevention.
The platform features a capability that detects 95%+
of crashes with airbags deployed¹; automatically
notifies Agero’s emergency contact center when an
accident is detected; and provides GPS location to
help emergency responders locate the accident scene.

11THE CORRELATION BETWEEN DRIVER PERSONAS AND CRASH RISK
AGERO SAFE. SMART. DRIVEN.
ABOUT THE AUTHORS
Michael Bell, PhD, Director of Data Science and Analytics
As a Data Scientist at Agero, Mike spends most of his time
thinking about how to help drivers in need, whether their
car has broken down or they’ve been in a crash. He and his
team have developed algorithms for detecting crashes and
risky driving behaviors using a smartphone, studied crash
risk factors using billions of miles of driving data collected
with the MileUp app, modeled demand for tow trucks and
when they might arrive late, and much more.
ABOUT AGERO
Agero’s mission is to safeguard consumers on the road
through a unique combination of platform intelligence
and human powered solutions, strengthening our clients’
relationships with their drivers. We are a leading provider
of driving solutions, including roadside assistance,
accident management, consumer affairs and telematics.
The company protects 115 million drivers in partnership
with leading automobile manufacturers, insurance carriers
and other diversified clients. Managing one of the largest
national networks of service providers, Agero responds
to more than 12 million requests annually for assistance.
Agero, a member company of The Cross Country Group,
is headquartered in Medford, MA, with operations
throughout North America. To learn more, visit
www.agero.com and follow on Twitter @AgeroNews.
References
1 Performance based on MileUp user study from December 2016 to August 2017.
Dingus, T. A., Guo, F., Lee, S., Antin, J. F., Perez, M., Buchanan-King, M., & Hankey, J. (2016). Driver crash risk factors and prevalence evaluation using naturalistic driving data. Proceedings of the National Academy of Sciences, 113(10), 2636-2641.

12
AGERO SAFE. SMART. DRIVEN.
CORPORATE HEADQUARTERS One Cabot Road | Medford, MA 02155P: 781.393.9300 | www.agero.com
Clarksville, TN | San Francisco, CA | Sault Ste. Marie, CANADA | Sebring, FL | Tri-Cities, TN | Phoenix, AZ | Tucson, AZ
2019 © Agero, Inc. All Rights Reserved. Driver360, MileUp and the MileUp logo are registered trademarks of Agero, Inc.