the correlation of gold, exchange rate, and stock market
TRANSCRIPT

| 350 |
Keywords:Composite Stock Price Index;Dynamic ConditionalCorrelation-GeneralizedAutoregressive ConditionalHeteroscedasticity (DCC-GARCH);Gold; Indonesia Stock Exchange;Stock volatility
Corresponding Author:Robiyanto Robiyanto:Tel +62 298 311881E-mail: [email protected]
Jurnal Keuangan dan Perbankan, 24(3): 350–362, 2020http://jurnal.unmer.ac.id/index.php/jkdp
Article history:Received: 2020-05-21Revised: 2020-06-10Accepted: 2020-06-30
ISSN: 2443-2687 (Online)ISSN: 1410-8089 (Print)
This work is licensedThis is an open accessarticle under the CC–BY-SA license
JEL Classification: G10, G11, G12
Kata Kunci:Indeks Harga Saham Gabungan;Dynamic ConditionalCorrelation-GeneralizedAutoregressive ConditionalHeteroscedasticity (DCC-GARCH);Emas; Bursa Efek Indonesia;Volatilitas saham
The correlation of gold, exchange rate,and stock market on Covid-19 pandemic period
Alfi Syahri, Robiyanto RobiyantoDepartment of Management, Faculty of Economics and Business, Satya Wacana ChristianUniversity, Jl. Diponegoro No. 52-60, Salatiga, 50711, Indonesia
Abstract
This study aims to analyze the correlation of gold, exchange rate, and CSPI on COVID-19 pandemic periods by testing the effect of gold exchange prices and exchange rateon CSPI and stock volatility. Also, by considering the dynamic correlation of dy-namic correlations between CSPI with gold and CSPI with exchange rates. The datawas collected from secondary data in the form of JCI daily data, gold prices, andexchange rate during the COVID-19 pandemic period from January 2020 to June2020. Further, the data was analyzed by using a GARCH method to examine theeffect of changes in gold and USD prices for CSPI and stock volatility. Hence, DCC-GARCH method was used to see the dynamic correlation between CSPI with goldand IHSG with exchange rate. The result showed that changes of gold prices hassignificant effect of on stock price volatility, the presence of a positive dynamiccorrelation between CSPI and gold, and a negative dynamic correlation betweenCSPI and exchange rates. This research can be used as a reference for investors fortheir investments by looking at the relationship between the CSPI, gold, and theexchange rate.
Abstrak
Penelitian ini bertujuan untuk menganalisis mengenai keterkaitan emas, nilai tukar dan IHSGpada periode pandemi Covid-19 dengan menguji pengaruh perubahan harga emas dan nilaitukar terhadap IHSG dan volatilitas saham, serta melihat korelasi dinamis antara IHSG denganemas dan IHSG dengan nilai tukar. Data penelitian ini menggunakan data sekunder yangberupa data harian IHSG, harga emas dan nilai tukar selama pandemi Covid-19 periode Januarihingga Juni 2020. Analisis data dilakukan dengan menggunakan metode GARCH untuk mengujipengaruh perubahan harga emas dan usd terhadap IHSG dan volatilitas saham, sertamenggunakan metode DCC-GARCH untuk melihat korelasi dinamis antara IHSG denganemas dan IHSG dengan nilai tukar. Hasil penelitian menunjukan adanya pengaruh yangsignifikan perubahan harga emas terhadap volatilitas harga saham, dan adanya korelasi dinamispositif antara IHSG dengan Emas dan korelasi dinamis negatif antara IHSG dengan nilaitukar. Hasil penelitian ini akan membeikan referensi bagi para investor mengenai keputusaninvestasinya dengan melihat keterkaitan antara IHSG, emas dan nilai tukar.
How to Cite: Syahri, A., & Robiyanto, R. (2020). The correlation of gold, exchange rate, andstock market on covid-19 pandemic period. Jurnal Keuangan dan Perbankan,24(3), 350-362. https://doi.org/10.26905/jkdp.v24i3.4621

The correlation of gold, exchange rate, and stock market on Covid-19 pandemic periodAlfi Syahri, Robiyanto Robiyanto
| 351 |
1. Introduction
Capital market has two main functions namelya source of funding for a business entity and an in-vestment medium for investors in various instru-ments, for instance, stock, bonds, mutual funds, etc.Among those instruments, stocks are the most fre-quently traded instrument because they are consid-ered as the easiest trading instrument and high re-turns. The development of the stocks listed on theIndonesia Stock Exchange can be seen through theComposite Stock Price Index (CSPI) (Sari, 2019).
Before investing the stock, the investors willconduct a stock selection by utilizing the stock ratevolatility statistics to calculate the profit and losspotentials. The stock rate volatility can affect theuncertainty risk which brings a positive or negativeimpact on the investors’ interest in their investment(Handayani, Muharam, & Mawardi, 2018). How-ever, many investors are still interested in high vola-tility stocks. Although the investors have to dealwith the high risks, they still get an opportunity forgetting high profits.
Many factors influence the stock rate vola-tility so that stock investment also has several risks.However, the gold price and the USD exchange rateare macroeconomic factors that affect stock pricevolatility. Gold is one of the most important com-modities traded internationally (Singh & Sharma,2018). According to Husnul, Hidayat, & Sulasmiyati,(2017), gold is used as an alternative investmentbecause it tends to be risk-free and not affected byinflationary pressure. Gold is one of the preciousmetals that considered as a safe asset to be storedin the long-run period because it has good durabil-ity (Robiyanto, Wahyudi, & Pangestuti, 2017). It alsocan be an effective diversification tool within theportfolio to reduce the risks (Tuna, 2019).
Research about the relation of gold price andthe stock price had been conducted by Hlupo (2017)using the Granger causality test. The results are theprice of gold and the performance of the ZSE In-dustrial Index stock have an insignificant relation-
ship. Furthermore, Billah & Hartomo (2018) statedthat the dynamic correlation of gold prices and thesharia stocks in Indonesia shows that there is a nega-tive correlation between gold prices and shariastocks. Hence, Tuna (2019) also investigated thecorrelation between precious metals and the shariastocks market using the Pedroni Panel CointegrationAnalysis method which found a relationship be-tween the gold precious metals and the sharia stocksmarket. Moreover, by using the Panel VectorAutoregression method, Padungsaksawasdi (2019)discovered the relationship of gold and stock priceswhich was demonstrated through the relationshipbetween gold market investor sentiment and stockprice investor sentiment.
Besides gold, another variable that has a re-lationship with stock prices is the exchange rate ofUSD/IDR. The dynamic relationship between ex-change rate and stock prices is a topic that attractsmany researchers in the economy field, especiallycapital markets. It is because the exchange rate andstock prices play a role in influencing the economyof a country and this relationship is often used toconduct a fundamental analysis for looking at themovement of stock prices and exchange rates in thefuture (Syakhroza & Endri, 2012). Research con-ducted in India by Jayashankar & Rath (2017), re-search in several eastern European countries byŽivkov, Njegiæ, & Pavloviæ (2016), and the researchconducted in Indonesia by Pamungkas & Darmawan(2018) showed a relationship between exchange ratesand stock prices.
Several studies that discuss the correlationbetween stock prices with exchange rates and thecorrelation between stock prices with gold prices,mostly use a static approach as in research that hadbeen conducted by Gumilang, Hidayat, & Goretti(2014); Husnul et al. (2017); Pamungkas &Darmawan (2018); Putri (2015). Their research ex-amined the composite stock price index using themultiple linear regression method. In addition,Hlupo (2017) and Mukhuti (2018) also examine thedynamic correlation between the stock market and

Jurnal Keuangan dan PerbankanVolume 24, Issue 3, July 2020: 350–362
| 352 |
gold prices using multiple linear regression meth-ods. But in reality, the stock market has dynamicmovements. Therefore, this study will use a differ-ent method, namely Dynamic Conditional Correla-tion-Generalized Autoregressive ConditionalHeteroscedasticity (DCC-GARCH) to be able to seethe dynamic correlations between the variables inthis study. The DCC-GARCH method is used be-cause it has been proven to be predicted in a se-quence for various covariant matrix (Robiyanto etal., 2017). Besides the DCC-GARCH method, thisstudy also uses the GARCH method to determinethe effect of changes in gold prices and changes inthe exchange rate of the Dollar against the Rupiahon stock returns and stock volatility.
Research on the dynamic correlation of stockprices in ASEAN countries and the exchange ratewas also carried out when Donald Trump waselected as a President of the United States by Stefan& Robiyanto (2019). Robiyanto (2018a) also con-ducted research on the dynamic correlation ofASEAN countries’ stock prices with world oil prices.In contrast, this study will use daily data on thestock prices in Indonesia during the COVID-19 pan-demic period due to the impact of the economic cri-sis caused by the pandemic in the world, especiallyIndonesia. Further, aside from the dynamic corre-lation of the CSPI with the USD/IDR exchange rate,this study will also look at the dynamic correlationbetween the CSPI with the gold price in the middleof the COVID-19 pandemic. It will also examine theeffect of changes in gold prices and changes in ex-change rates on the CSPI and volatility in stockprices.
This study aims to find out how the dynamiccorrelation of stock prices (CSPI) with gold pricesand the dynamic correlation of stock prices (CSPI)with the exchange rate of Dollar to Rupiah (USD/IDR), and also investigate the effect of gold pricesand exchange rates on IHSG and stock price volatil-ity. Eventually, this research can be used as a bench-mark and reference for investors and financial ana-lysts in making decisions by looking at the dynamic
correlation of CSPI with the price of gold, CSPI cor-relation with the exchange rate of the Dollar againstthe Rupiah (USD/IDR), also by looking at the effectof changes in gold prices and changes the exchangerate against the CSPI and the volatility of stock pricesin dynamic market conditions such as the COVID-19 pandemic period.
2. Hypotheses Development
The performance of a capital market can beillustrated through the supply and demand mecha-nism of stock trading activities. By using a compos-ite stock price index, the movement of stocks listedon the Indonesia Stock Exchange can be observed(Putri, 2015), whether the market is in a bullish orbearish condition. The calculation of the compositestock price index was carried out using closing stockprices in each sector in the Indonesia Stock Exchange.Therefore, CSPI illustrates the activity and trendsof the capital market because it covers the move-ment of stock prices as a whole (Aditya, Sinaga, &Maulana, 2018) so that the CSPI can be used as abenchmark for investors to invest.
The ups and downs of stock prices is a move-ment in stock price called volatility. Volatility is astatistical measure for changes in the price of a se-curity or commodity over a certain period(Robiyanto et al., 2017). The risk of a stock can alsobe reflected from the volatility of the stock price. Ifthe volatility is high, there is an opportunity for lossand large profits in the short term because the stockprice is difficult to be predicted. In contrast, if thevolatility of the stock price is low, the stock pricetends not to change frequently. Thus, investors canuse the stock rate volatility to find out the opportu-nities for profit and loss from the stock before pur-chasing.
Gold is one of the precious metals which isthe most important commodity in the world thatcan attract investors’ interest and trade internation-ally (Singh & Sharma, 2018). According to Natalie& Artigas (2010) gold has two roles as a hedging

The correlation of gold, exchange rate, and stock market on Covid-19 pandemic periodAlfi Syahri, Robiyanto Robiyanto
| 353 |
tactic against inflation and as a long-term strategicasset. Therefore, gold price fluctuations become aconcern for policymakers, investors, financial insti-tutions, central banks, and the wider community(Kumar, 2014).
The price of gold which increases from yearto year and tends to be minimal risk can affect themovement of the CSPI. It caused by the market in-vestor that will consider for moving their invest-ment into gold commodities (Gumilang et al., 2014),the risk is relatively lower and gives better results(Gulo, Subiyantoro, & Tubing, 2017). Previous re-search conducted by Gumilang et al. (2014);Robiyanto et al. (2017); Gulo et al. (2017); Robiyanto(2018b); Shabbir, Kousar, & Batool, (2020) stated thatgold price has positive effects on CSPI returns. There-fore, it can be concluded as the following hypoth-esis.H1: gold price changes have positive effects on the
CSPI returns.
Choosing gold for investment is believed tobe profitable because the price tends to increase.Gold is also included as a very liquid investmentform because it can be accepted in many countries(Surbakti, Achsani, & Maulana, 2016). Baur & Lucey(2010) stated that gold can be used as a hedge fundon stock and a safe haven from the extreme stockmarket condition because of the negative correla-tion with stock movement.
Previous studies by Kumar (2014); Choudhry,Hassan, & Shabi, (2015); Surbakti et al. (2016); Chkili(2016); Robiyanto et al. (2017) stated that there is anegative correlation between gold price changeswith stock volatility. Based on the explanationabove, the hypothesis can be formulated as follows.H2: gold price changes have negative effects on
stock volatility prices.
The exchange rate is the price of a particularforeign currency in the domestic currency unit
(Yuswandy, 2013). Exchange rates can change fre-quently due to changes in supply and demand onthe foreign exchange market. According to Faraga,Chabachib, & Muharam, (2012), the exchange ratechanges of the domestic currency against foreigncurrency (USD/IDR) will harm the capital market.The reason is if the foreign currency exchange ratesincreased or appreciated, the exchange value of thedomestic currency will depreciate. Hence, the priceof imported raw materials and all imported prod-ucts will increase and the company’s productioncosts will also increase. Therefore, changes in ex-change rates will affect the competitiveness of com-panies that will have an impact on the stock priceand the product produced by the company (Yunita& Robiyanto, 2018).
The exchange rate is one of the macroeco-nomic factors that can affect stock returns. The rea-son is that the depreciation of the domestic currencyon foreign currencies will increase the amount ofRupiah which is used to pay the foreign debt and itwill also increase the price of imported raw materi-als (Robiyanto et al., 2019). Further, it will affectthe reduction of the company’s stock price and stockreturns.
Changes in exchange rates are predicted toinfluence the stock returns. Previously, some re-search that had been conducted by Yogaswari,Nugroho, & Astuti, (2012); Patel (2012); Husnul etal. (2017); Wahyudi, Asdar, & Nohong, (2017);Aditya et al. (2018); Yunita & Robiyanto (2018) statedthat exchange rate changes have negative impactson CSPI returns. Therefore, it can be concluded asthe following hypothesis.H3: exchange rate changes have negative impacts
on CSPI returns.
The exchange rate can also affect the stockvolatility. Changes in exchange rates will have animpact on price stability, corporate profitability, andstability of a country (Olweny & Omondi, 2011).Asih & Akbar (2016) asserted that the attractive-

Jurnal Keuangan dan PerbankanVolume 24, Issue 3, July 2020: 350–362
| 354 |
ness of the stock market will decrease due to thenegative effects of the depreciation of Rupiah toDollar. It is caused by the movement of the inves-tors to the money market. Finally, it will providegreater profits and ultimately will reduce the stockprice index.
Previous studies by Katti (2014); Asih & Akbar(2016); Arfaoui & Ben Rejeb (2017); Fadhyla &Rikumahu (2018) found that there is a negative cor-relation between exchange rates with stock volatil-ity. According to the explanation above, the hypoth-esis can be formulated as follows.H4: the changes in the exchange rate have nega-
tive impacts on stock volatility.
3. Method, Data, and Analysis
This research conducted using secondary datacollected from www.finance.yahoo.com. The dataconsisted of IHSG daily data from Indonesia StockExchange, the price of the gold, and exchange ratefrom dollar to rupiah (USD/IDR) during COVID-19 between January 1st and June 30th, 2020. The de-pendent variable in this research is CSPI stock re-turns and stock volatility, while the independentvariable is the changes of gold price and exchangerate from dollar to rupiah.
The calculation of CSPI Returns can be calcu-lated using Eq. (1).
Where, GOLDUSDt = the changes of goldprice within dollar currency on the day t;GOLDUSDt = gold price on the day t; GOLDUSDt-1
= gold price on the day t-1The changes of exchange rate from dollar to
rupiah (USD/IDR) can be calculated using Eq. (3).
∆퐼퐻푆퐺푡 =퐼퐻푆퐺푡 − 퐼퐻푆퐺푡−1
퐼퐻푆퐺푡−1
Where, ∆IHSG = CSPI returns
(1)
Where, IHSGt = CSPI returns on the day t;IHSGt = CSPI on the day t; IHSGt-1 = CSPI on theday t-1
The changes in gold price within thedollar currency can be calculated using Eq. (2).
∆퐺푂퐿퐷푈푆퐷푡 =
퐺푂퐿퐷푈푆퐷푡 − 퐺푂퐿퐷푈푆퐷푡−1
퐺푂퐿퐷푈푆퐷푡−1
Where, ∆GOLDUSD = the changes of gold price within dollar currency on the day t
(2)
∆푈푆퐷퐼퐷푅푡 =
푈푆퐷퐼퐷푅푡−푈푆퐷퐼퐷푅푡−1
푈푆퐷퐼퐷푅푡−1
Where, ∆USDIDR = the changes of USD/IDR exchange rate on the day t
(3)
Where, USDIDRt = the changes of USD/IDRexchange rate on the day t; USDIDRt = USD/IDRexchange rate on the day t; USDIDRt-1 = USD/IDRexchange rate on the day t-1
Stock volatility means the ups and downs ofstock rate. Stock volatility in this study was proxiedusing Conditional Variance which can be calculatedusing Generalized Autoregressive ConditionalHeteroskedasticity (GARCH). In order to analyzethe dynamic relationship, this study used DynamicConditional Correlation-Generalized AutoregressiveConditional Heteroscedasticity (DCC-GARCH) ap-proach. Moreover, this research also used GARCHmodel approach to find out the effect of gold pricechanges and (USD/IDR) exchange rate toward stockand stock volatility returns. GARCH model can bewritten as Eq. (4) and (5).
Where, Rt = stock returns/stock volatility;GOLDt = the changes of gold price; USDt = thechange of (USD/IDR) exchange rate; 휀푡 = error stan-dard; 휎푡2
= conditional variance;
−1 + ⋯+
훼1휀푡−12
+ = previous
period of volatility (ARCH model component);휆1휎푡−1
2 = previous period of volatility (GARCHmodel component)
푅푡 = 훼 + 훽1퐺푂퐿퐷푡 + 훽2푈푆퐷푡 + 휎푡2 + 휀푡 휀푡 = 휙푡휀푡−1 +⋯+휙푡휀푡−푞 + 휂푡 휂푡 = 휎푡휀푡 휎푡2 = 훼0 + 훼1휀푡−1
2 +⋯+ 훼푝휀푡−푝2 + 휆1휎푡−12
+⋯+ 휆푞휎푡−푞2
Where, R = stock returns/stoc
(4)(5)

The correlation of gold, exchange rate, and stock market on Covid-19 pandemic periodAlfi Syahri, Robiyanto Robiyanto
| 355 |
4. Results Descriptive statistics
Descriptive statistics is used to find out themean, maximum, minimum, and deviation standardof a data. Descriptive statistics in this study can beseen on the Table 1 and Table 2.
Table 1 shows that the mean of CSPI is -0.0019and the deviation standard of CSPI is 0.0213. Mean-while, the mean of gold variable is 0.0009 and its
deviation standard is 0.0164. Then, the mean of USDvariable is 0.0011 and its deviation standard is 0.0147.
Table 2 illustrates the mean of stock volatilityis 1.0001 and the deviation standard of stock vola-tility is 0.2079. While, the mean of gold variable is0.0009 and its deviation standard is 0.0164. The meanof USD variable is 0.0011 and the deviation stan-dard of gold variable is 0.0147. The deviation stan-dard on the Table 1 and 2 reports that stock has thehighest risk among gold and USD.
Variable N Minimum Maximum Mean Dev. Std. CSPI Return 116 -0.0657 0.1019 -0.0019 0.0213 Gold 116 -0.0462 0.0764 0.0009 0.0164 USD 116 -0.0379 0.0468 0.0011 0.0147
Variable N Minimum Maximum Mean Dev. Std. Stock Volatility 116 0.5638 1.9432 1.0001 0.2079 Gold 116 -0.0462 0.0764 0.0009 0.0164 USD 116 -0.0379 0.0468 0.0011 0.0147
Variable Augmented Dickey-Fuller Probability Result
CSPI Returns -9.6620 0.0000 Stationary Gold -9.7960 0.0000 Stationary USD -14.2116 0.0000 Stationary
Table 1. Descriptive statistics of CSPI, gold, and USD
Table 2. Descriptive statistics of stock volatility, gold, and USD
Table 3. The result of the Augmented Dickey-Fuller test
Independent Variable Coefficient Error Standard Z-Statistics Probability C -0.0009 0.0013 -0.9185 0.4724 Gold 0.0745 0.1041 0.7158 0.4741 USD/IDR -0.0741 0.1094 -0.6770 0.4984 Variance Equation RESID (-1)^2 0.2986 0.1088 2.7438 0.0061 GARCH (-1) 0.7131 0.0967 7.3736 0.0000
Table 4. The result of GARCH Analysis (1,1) the impact of gold and USD toward CSPI

Jurnal Keuangan dan PerbankanVolume 24, Issue 3, July 2020: 350–362
| 356 |
The result of Stationary Data Test
Stationary test in this research used the Aug-mented Dickey-Fuller test with 0.01 significancevalue. The result of the test can be seen on Table 3.
Table 3 reveals that CSPI variable, Gold, andUSD are stationary. Then, those variables are testedusing GARCH Analysis.
The result of GARCH (1,1) Analysis
The result of GARCH analysis (1,1) can be seenon Table 4 and Table 5.
According to the result in the Table 4, it canbe concluded that the first hypothesis about thechanges in gold price takes positive effect on CSPIis rejected. Similarly, the third hypothesis about thechanges in the USD/IDR exchange rate brings nega-tive impact to CSPI is also rejected. Table 4 showswhen the significance level is 10%, the changes inthe gold price and USD/IDR exchange rate do notbring any effect to CSPI returns. Based on the vari-ance equation can be seen that GARCH probabilityshows significance value which means that the re-search model can follow the GARCH pattern.
Based on the Table 5. the second and fourthhypotheses about the changes of gold price andUSD/IDR exchange rate brings negative impact tostock volatility is rejected. When the significancelevel is 10%, the changes of gold prices do not af-fect the stock volatility. Meanwhile, the changes in
the USD/IDR exchange rate bring positive effect tostock volatility. GARCH probability has significancevalue, so that the research model can follow theGARCH pattern.
Dynamic correlation between CSPI and theprice of the gold to the various time
Independent Variable Coefficient Error Standard Z-Statistics Probability C 0.9963 0.0001 5876.664 0.0000 Gold -0.6684 0.9089 -0.7353 0.4621 USD/IDR 1.3754 0.6414 2.1442 0.0320 Variance Equation RESID (-1)^2 -0.0697 0.0088 -7.8928 0.0000 GARCH (-1) 1.0930 0.0157 69.4994 0.0000
Table 5. The result of GARCH Analysis (1,1) The Impact of gold and USD toward stock volatility
Figure 1 shows the result of dynamic correla-tion analysis between CSPI and gold using DCCGARCH. The result indicates the value of DCC CSPIand gold during the research period is -0.1960 until0.9532. The highest DCC value is 0.9532 in the earlyMarch 2020. Meanwhile, the lowest DCC value is -0.1960 in the early June 2020. It can be seen in theTable 7 that the mean value of DCC is 0.0764 whichmeans that the dynamic correlation between CSPIand Gold is positive and week.
Figure 1. Dynamic correlation CSPI-GOLD

The correlation of gold, exchange rate, and stock market on Covid-19 pandemic periodAlfi Syahri, Robiyanto Robiyanto
| 357 |
Dynamic correlation between CSPI and USD/IDR exchange rate to the various time
that the changes of gold price and USD/IDR ex-change rate do not affect to the CSPI and stock vola-tility. However, there is a significant positive effectof the changes of the gold price toward stock vola-tility. It is the effect of the crisis period duringCOVID-19 pandemic which makes people worryabout their investment. It is supported by the find-ings of the stock volatility model in this study. Thegold commodity proves that the higher gold returnsthe more volatility increase on the CSPI. There is anindicator that stock investors in the Indonesia StockExchange are skeptical responding to the changesin the gold price which makes them hesitate to in-vest gold. Electronic and printed media which men-tion that gold is the safest asset during the pandemicplay an important role in the people’s confusion. Theresult of this study was supported by olehChoudhry et al. (2015); Ingalhalli & Reddy (2016);Raza et al. (2016) studies which explain that thechanges in gold price takes positive effect to stockvolatility.
Dynamic correlation happens between CSPIand gold, and CSPI and USD/IDR exchange rate isweak with different correlation condition. Consid-ering the mean value of dynamic correlation on Table7, correlation between CSPI and gold is positive yetweak. Therefore, gold cannot be categorized as asafe investment asset during the COVID-19 eco-nomic crisis. By contrast, Kumar (2014) pointed outthat there are variative, positive, even negative dy-namic correlations between stock and gold in thecrisis period in India so that gold becomes a goodportfolio diversification in India. Chkili (2016) andTuna (2019) asserted that there is a low negativecorrelation between the stock market and gold sothat gold can become a safe haven and effectiveportfolio diversification when there is an extremestock movement on a crisis period. The result is inline with Choudhry et al. (2015) the disappearanceof gold as a safe haven during the global economiccrisis makes gold is not worth it to minimize therisk of the portfolio during the crisis period.
The dynamic correlation of CSPI and USD/IDR exchange rate is negative and weak correlation,
Figure 2 illustrates the result of dynamic cor-relation analysis between CSPI and USD/IDR ex-change rate using DCC GARCH. The result revealsthat DCC value between CSPI and USD/IDR ex-change rate is -0.8206 until 0.3047. The highest DCCis 0.3047 in early March 2020 while the lowest DCCvalue is at the end of March 2020. Based on Table 7,the mean value of DCC is -0.100, thus the dynamiccorrelation between CSPI and USD/IDR is negativeand weak.
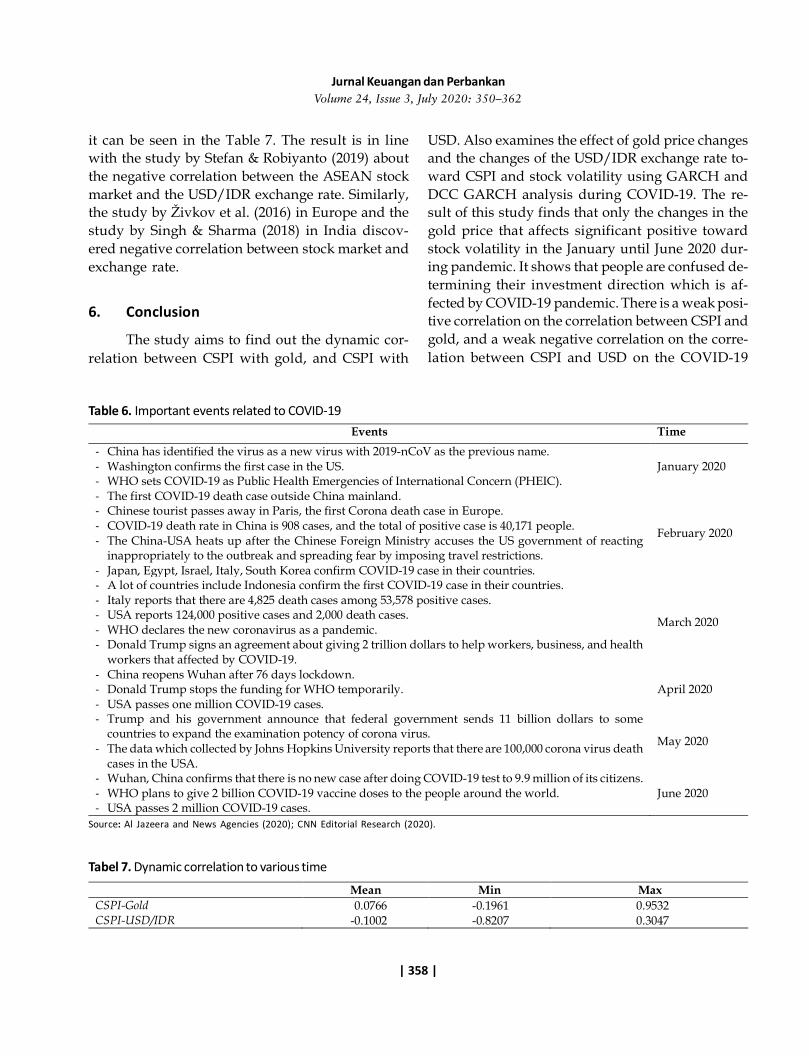
The chronology of important events relatedto COVID-19 can be read on Table 6. It affects thecorrelation between CSPI and gold, CSPI and USD/IDR. COVID-19 is a global pandemic which makesthe virus becomes global attention. In contrast, Stefan& Robiyanto (2019) stated that monumental eventsdo not affect dynamic correlation. The study fromPutri (2015); Billah & Hartomo (2018) did not linkthe monumental events to the dynamic correlation.This is in line with Robiyanto (2018a) and Chen etal. (2018) that dynamic correlation can be affectedby the important event which is happening.
5. Discussion
According to the developed hypothesis, all ofthe hypotheses are rejected. The analysis indicates
Figure 2. Dynamic correlation CSPI-USD/IDR
Jurnal Keuangan dan PerbankanVolume 24, Issue 3, July 2020: 350–362
| 358 |
Events Time - China has identified the virus as a new virus with 2019-nCoV as the previous name. - Washington confirms the first case in the US. - WHO sets COVID-19 as Public Health Emergencies of International Concern (PHEIC).
January 2020
- The first COVID-19 death case outside China mainland. - Chinese tourist passes away in Paris, the first Corona death case in Europe. - COVID-19 death rate in China is 908 cases, and the total of positive case is 40,171 people. - The China-USA heats up after the Chinese Foreign Ministry accuses the US government of reacting
inappropriately to the outbreak and spreading fear by imposing travel restrictions. - Japan, Egypt, Israel, Italy, South Korea confirm COVID-19 case in their countries.
February 2020
- A lot of countries include Indonesia confirm the first COVID-19 case in their countries. - Italy reports that there are 4,825 death cases among 53,578 positive cases. - USA reports 124,000 positive cases and 2,000 death cases. - WHO declares the new coronavirus as a pandemic. - Donald Trump signs an agreement about giving 2 trillion dollars to help workers, business, and health
workers that affected by COVID-19.
March 2020
- China reopens Wuhan after 76 days lockdown. - Donald Trump stops the funding for WHO temporarily. - USA passes one million COVID-19 cases.
April 2020
- Trump and his government announce that federal government sends 11 billion dollars to some countries to expand the examination potency of corona virus.
- The data which collected by Johns Hopkins University reports that there are 100,000 corona virus death cases in the USA.
May 2020
- Wuhan, China confirms that there is no new case after doing COVID-19 test to 9.9 million of its citizens. - WHO plans to give 2 billion COVID-19 vaccine doses to the people around the world. - USA passes 2 million COVID-19 cases.
June 2020
Mean Min Max CSPI-Gold 0.0766 -0.1961 0.9532 CSPI-USD/IDR -0.1002 -0.8207 0.3047
Table 6. Important events related to COVID-19
Source: Al Jazeera and News Agencies (2020); CNN Editorial Research (2020).
Tabel 7. Dynamic correlation to various time
it can be seen in the Table 7. The result is in linewith the study by Stefan & Robiyanto (2019) aboutthe negative correlation between the ASEAN stockmarket and the USD/IDR exchange rate. Similarly,the study by Živkov et al. (2016) in Europe and thestudy by Singh & Sharma (2018) in India discov-ered negative correlation between stock market andexchange rate.
6. Conclusion
The study aims to find out the dynamic cor-relation between CSPI with gold, and CSPI with
USD. Also examines the effect of gold price changesand the changes of the USD/IDR exchange rate to-ward CSPI and stock volatility using GARCH andDCC GARCH analysis during COVID-19. The re-sult of this study finds that only the changes in thegold price that affects significant positive towardstock volatility in the January until June 2020 dur-ing pandemic. It shows that people are confused de-termining their investment direction which is af-fected by COVID-19 pandemic. There is a weak posi-tive correlation on the correlation between CSPI andgold, and a weak negative correlation on the corre-lation between CSPI and USD on the COVID-19

The correlation of gold, exchange rate, and stock market on Covid-19 pandemic periodAlfi Syahri, Robiyanto Robiyanto
| 359 |
period based on DCC GARCH analysis in examin-ing the dynamic correlation. The existing correla-tion is affected by the important events related toCOVID-19.
This research is a multivariate study on therelationship of CSPI, gold, and exchange rate thatused the daily data during the period of COVID-19pandemic from January 2020 to June 2020. Furtherresearch is recommended to use the beginning pe-riod of COVID-19 pandemic to the end of the
COVID-19 pandemic, so that it can obtain more find-ings in details about the correlation of CSPI, gold,and exchange rate on the period of COVID-19 pan-demic. This research may be beneficial as a refer-ence for the investors to observe the gold variableand exchange rate in investing in the stock marketduring COVID-19. It should be considered since thegold variable and exchange rate have a correlationtoward CSPI, also the changes in gold price bringsignificant effect to the stock volatility.
References
Aditya, A., Sinaga, B. M., & Maulana, T. A. (2018). Pengaruh indeks bursa luar negeri, indikator makroekonomidan krisis ekonomi global terhadap indeks harga saham gabungan di Indonesia. Jurnal Aplikasi Bisnisdan Manajemen, 4(2), 284–295. https://doi.org/10.17358/jabm.4.2.284
Al Jazeera & News Agencies. (2020). Timeline: How the new coronavirus spread. Retrieved from: Al Jazeerawebsite: https://www.aljazeera.com/news/2020/01/timeline-china-coronavirus-spread-200126061554884.html
Arfaoui, M., & Ben Rejeb, A. (2017). Oil, gold, US dollar and stock market interdependencies: A globalanalytical insight. European Journal of Management and Business Economics, 26(3), 278–293.https://doi.org/10.1108/ejmbe-10-2017-016
Asih, N. W. S., & Akbar, M. (2016). Analisis pengaruh inflasi, suku bunga, nilai tukar (kurs) dan pertumbuhanproduk domestik bruto (Pdb) terhadap indeks harga saham gabungan (IHSG) studi kasus pada perusahaanproperti yang terdaftar di Bursa Efek Indonesia. Jurnal Manajemen dan Akuntansi, 17(1), 43–52. Re-trieved from: http://journal.stiei-kayutangi-bjm.ac.id/index.php/jma/article/view/269
Baur, D. G., & Lucey, B. M. (2010). Is gold a hedge or a safe haven? An analysis of stocks, bonds and gold.Financial Review, 45(2), 217–229. https://doi.org/10.1111/j.1540-6288.2010.00244.x
Billah, N. A., & Hartomo, D. D. (2018). Korelasi dinamis emas dan saham syariah sebagai lindung nilai dansafe haven pada investasi di Indonesia. Jurnal Bisnis dan Manajemen, 18(2), 67–86.https://doi.org/10.20961/jbm.v18i2.26808
Chen, Y., Mantegna, R. N., Pantelous, A. A., & Zuev, K. M. (2018). A dynamic analysis of S&P 500, FTSE100 and EURO STOXX 50 indices under different exchange rates. PLoS ONE, 13(3): e0194067.https://doi.org/10.1371/journal.pone.0194067
Chkili, W. (2016). Dynamic correlations and hedging effectiveness between gold and stock markets: Evidencefor BRICS countries. Research in International Business and Finance, 38,2 22–34.https://doi.org/10.1016/j.ribaf.2016.03.005
Choudhry, T., Hassan, S. S., & Shabi, S. (2015). Relationship between gold and stock markets during theglobal financial crisis: Evidence from nonlinear causality tests. International Review of Financial Analy-sis, 41, 247–256. https://doi.org/10.1016/j.irfa.2015.03.011
CNN Editorial Research. (2020). Coronavirus outbreak timeline fast facts. Retrieved from: CNN Healthwebsite: https://edition.cnn.com/2020/02/06/health/wuhan-coronavirus-timeline-fast-facts/index.html

Jurnal Keuangan dan PerbankanVolume 24, Issue 3, July 2020: 350–362
| 360 |
Fadhyla, N. R., & Rikumahu, B. (2018). Studi mengkaji pengaruh pergerakan nilai tukar Rupiah per USDollar terhadap volatilitas indeks saham kompas 100 tahun 2012-2016 dengan menggunakan modelGARCH. Jurnal Ilmiah Ilmu Ekonomi, 7(7), 60–69. Retrieved from: http://eprints.ummi.ac.id/566/
Faraga, F., Chabachib, M., & Muharam, H. (2012). Analisis pengaruh harga minyak dan harga emas terhadaphubungan timbal-balik kurs dan indeks harga saham gabungan (IHSG) di Bursa Efek Indonesia (BEI)2000-2013. Jurnal Bisnis Strategi, 21(1), 72–94. https://doi.org/10.14710/jbs.21.1.72-94
Gulo, V. I. S., Subiyantoro, H., & Tobing, W. R. L. (2017). Analisis pengaruh variabel makroekonomi danvolume pedagangan saham terhadap indeks harga saham gabungan di Bursa Efek Indonesia: Pendekatandua model penelitian pengaruh gaya. Jurnal Eksekutif, 14(1), 25–50. Retrieved from:https://jurnal.ibmt.ac.id/index.php/jeksekutif/article/view/126
Gumilang, R. C., Hidayat, R. R., & Goretti, M. (2014). Pengaruh variabel makro ekonomi, harga emas danharga minyak dunia terhadap indeks harga saham gabungan (studi pada Bursa Efek Indonesia periode2009-2013). Jurnal Administrasi Bisnis S1 Universitas Brawijaya, 14(2), 1–9. Retrieved from:http://administrasibisnis.studentjournal.ub.ac.id/index.php/jab/article/view/586
Handayani, H., Muharam, H., Mawardi, W., & Robiyanto, R. (2018). Determinants of the stock pricevolatility in the Indonesian manufacturing sector. International Research Journal of Business Studies,11(3), 179–193. https://doi.org/10.21632/irjbs.11.3.179-193
Hlupo, P. (2017). The relationship between gold prices and equity market performance: Evidence from theZimbabwe Stock Exchange. IRES, 1, 1–6. Retrieved from: https://pdfs.semanticscholar.org
Husnul, H. M., Hidayat, R. R., & Sulasmiyati, S. (2017). Analisis pengaruh inflasi, kurs (IDR/USD), produkdomestik bruto dan harga emas dunia terhadap indeks harga saham gabungan (studi pada Indonesiaperiode 2008-2016). Jurnal Administrasi Bisnis, 53(1), 66–74. Retrieved from:http://administrasibisnis.studentjournal.ub.ac.id/index.php/jab/article/view/2183
Ingalhalli, V., G., P. B., & Reddy, Y. V. (2016). A study on dynamic relationship between oil, gold, forex andstock markets in Indian context. Paradigm, 20(1), 83–91. https://doi.org/10.1177/0971890716637706
Jayashankar, M., & Rath, B. N. (2017). The dynamic linkage between exchange rate, stock price and interest ratein India. Studies in Economics and Finance, 34(3), 383–406. https://doi.org/10.1108/sef-02-2016-0043
Katti, S. W. B. (2014). Analisis faktor makro ekonomi, indeks bursa global, dan kepemilikan saham asingterhadap pergerakan harga saham di Bursa Efek Indonesia. Jurnal Ekomaks, 3(1), 92–106. Retrievedfrom: http://www.unmermadiun.ac.id/ejurnal/index.php/ekomaks/article/view/116
Kumar, D. (2014a). Return and volatility transmission between gold and stock sectors: Application of portfo-lio management and hedging effectiveness. IIMB Management Review, 26(1), 5–16.https://doi.org/10.1016/j.iimb.2013.12.002
Mukhuti, S. (2018). Impact of gold price on stock market return – An econometric analysis of BSE and NSE.International Journal of Management Studies, 5(4), 1–16. https://doi.org/10.18843/ijms/v5i4(7)/01
Natalie, D., & Artigas, J. C. (2010). Gold: Inflation hedge and long-term strategic asset. The Journal of WealthManagement, 13(2), 69–75. https://doi.org/https://doi.org/10.3905/jwm.2010.13.2.069
Olweny, T., & Omondi, K. (2011). The effect of macro-economic factors on stock return volatility in theNairobi Stock Exchange, Kenya. Economics and Finance Review, 1(10), 34–48. Retrieved from:http://www.businessjournalz.org/efr
Padungsaksawasdi, C. (2019). On the dynamic relationship between gold investor sentiment index and stockmarket: A sectoral analysis. International Journal of Managerial Finance, 16(3), 372-392.https://doi.org/10.1108/ijmf-11-2018-0334

The correlation of gold, exchange rate, and stock market on Covid-19 pandemic periodAlfi Syahri, Robiyanto Robiyanto
| 361 |
Pamungkas, B. C., & Darmawan, A. (2018). Pengaruh nilai tukar USD dan bursa ASEAN terhadap indeksharga saham gabungan (IHSG) (studi pada Bursa Efek Indonesia periode 2014–2016). Jurnal AdministrasiBisnis, 60(1), 73–81. Retrieved from:http://administrasibisnis.studentjournal.ub.ac.id/index.php/jab/article/view/2483/2874
Patel, S. (2012). The effect of macroeconomic determinants on the performance of the Indian stock market.NMIMS Management Review, 22, 117–127.
Putri, V. R. (2015). Hubungan dinamis antara nilai tukar rupiah dan inflasi dengan indeks harga saham di BEI.Journal of Economics, Management and Banking, 1(3), 110–119. http://dx.doi.org/10.35384/jemp.v1i3.41
Raza, N., Jawad Hussain Shahzad, S., Tiwari, A. K., & Shahbaz, M. (2016). Asymmetric impact of gold, oilprices and their volatilities on stock prices of emerging markets. Resources Policy, 49, 290–301.https://doi.org/10.1016/j.resourpol.2016.06.011
Robiyanto, R. (2018a). The dynamic correlation between ASEAN-5 stock markets and world oil prices. JurnalKeuangan dan Perbankan, 22(2), 198–210. https://doi.org/10.26905/jkdp.v22i2.1688
Robiyanto, R. (2018b). The effect of gold price changes, USD/IDR exchange rate changes and Bank Indonesia(BI) rate on Jakarta Composite Index (JCI)’S return and Jakarta Islamic Index (JII)’S return. JurnalManajemen dan Kewirausahaan, 20(1), 45–52. https://doi.org/10.9744/jmk.20.1.45-52
Robiyanto, R., Santoso, M. A., Atahau, A. D. R., & Harijono, H. (2019). The Indonesia stock exchange andits dynamics: An analysis of the effect of macroeconomic variables. Montenegrin Journal of Economics,15(4), 59–73. https://doi.org/10.14254/1800-5845/2019.15-4.5
Robiyanto, R., Wahyudi, S., & Pangestuti, I. R. D. (2017). The volatility – variability hypotheses testing andhedging effectiveness of precious metals for the Indonesian and Malaysian capital markets. GadjahMada International Journal of Business, 19(2), 167–192. https://doi.org/10.22146/gamaijb.26260
Sari, W. I. (2019). Analisis pengaruh inflasi, suku bunga SBI, nilai tukar terhadap return LQ 45 dan dampaknyaterhadap indeks harga saham gabungan (IHSG) di Bursa Efek Indonesia (BEI). Jurnal SEKURITAS (Saham,Ekonomi, Keuangan dan Investasi), 3(1), 65. https://doi.org/10.32493/skt.v3i1.3263
Shabbir, A., Kousar, S., & Batool, S. A. (2020). Impact of gold and oil prices on the stock market in Pakistan.Journal of Economics, Finance and Administrative Science. https://doi.org/10.1108/jefas-04-2019-0053
Singh, N. P., & Sharma, S. (2018). Phase-wise analysis of dynamic relationship among gold, crude oil, USdollar and stock market. Journal of Advances in Management Research, 15(4), 480–499.https://doi.org/10.1108/jamr-12-2017-0124
Stefan, Y. A., & Robiyanto, R. (2019). Korelasi dinamis pasar saham Asean dengan nilai tukar Dollar AmerikaSerikat (USD) di Era Donald Trump. Jurnal Ilmu Sosial Dan Humaniora, 8(2), 131–143.http://dx.doi.org/10.23887/jish-undiksha.v8i2.21380
Surbakti, E. H., Achsani, N. A., & Maulana, T. N. A. (2016). The impact of macroeconomic variables onJCI’s stock return volatility in pre and post global economic crisis. International Journal of Scientificand Research Publications, 6(3), 213–220. Retrieved from: www.ijsrp.org
Syakhroza, A., & Endri. (2012). Hubungan kausalitas harga saham dan nilai tukar di negara-negara Asean-5.Jurnal Keuangan dan Perbankan, 14(2), 17–31. Retrieved from:http://journal.perbanas.id/index.php/jkp/article/view/173/46
Tuna, G. (2019). Interaction between precious metals price and Islamic stock markets. International Journal ofIslamic and Middle Eastern Finance and Management, 12(1), 96–114.https://doi.org/10.1108/imefm-06-2017-0143

Jurnal Keuangan dan PerbankanVolume 24, Issue 3, July 2020: 350–362
| 362 |
Wahyudi, R. N., Asdar, M., & Nohong, M. (2017). The influence of macroeconomic variables toward JakartaComposite Index on Indonesia Stock Exchange. Jurnal Bisnis, Manajemen dan Informatika, 14(2),131–148. http://dx.doi.org/10.26487/jbmi.v14i2.2164
Yogaswari, D. D., Nugroho, A. B., & Astuti, N. C. (2012). The effect of macroeconomic variables on stockprice volatility: Evidence from Jakarta Composite Index, agriculture, and basic industry sector. Interna-tional Proceedings of Economics Development and Research, 46(18), 96–100.https://doi.org/10.7763/IPEDR
Yunita, Y., & Robiyanto, R. (2018). The influence of inflation, BI rate, and exchange rate changes to thefinancial sector stock price index. Jurnal Manajemen dan Kewirausahaan, 20(2), 80–86.https://doi.org/10.9744/jmk.20.2.80-86
Yuswandy, Y. (2013). Analisis pengaruh harga minyak dunia, harga emas dunia, nilai tukar Rp terhadap USD,Indeks IHSG terhadap return saham (Studi kasus saham-saham Sinarmas Group). Working Paper, 1,39–61. Retrieved from:http://www.adlermanurungpress.com/journal/datajournal/Vol 1 No 1/Analisis Pengaruh Harga Minyak Dunia.pdf
Živkov, D., Njegiæ, J., & Pavloviæ, J. (2016). Dynamic correlation between stock returns and exchange rateand its dependence on the conditional volatilities – the case of several eastern European countries.Bulletin of Economic Research, 68(S1), 28–41. https://doi.org/10.1111/boer.12059