the cost implications of leed a presentation by hanscomb faithful & gould september 29 th –...
TRANSCRIPT

The Cost Implications of LEED
A Presentation By
Hanscomb Faithful & GouldSeptember 29th – 2005
Ms. Carin Rautenbach – Vice President, LEED APMs. Minna Gerard – Senior Estimator, LEED AP
John Merkler AIA

Our presentation today Understanding Cost Constraints
Where the data comes from Life Cycle vs First Cost
LEED Point Analysis
Sharing our Lessons Learned
Questions and Answers
Sharing Best Practices from Audience Members

What is the Cost of Green Building?
1. Initial Cost, i.e. Construction Cost
2. Life Cycle Cost, which covers not
only construction cost but also
operation and maintenance cost
during the building’s usable life.

LEED Project Locations
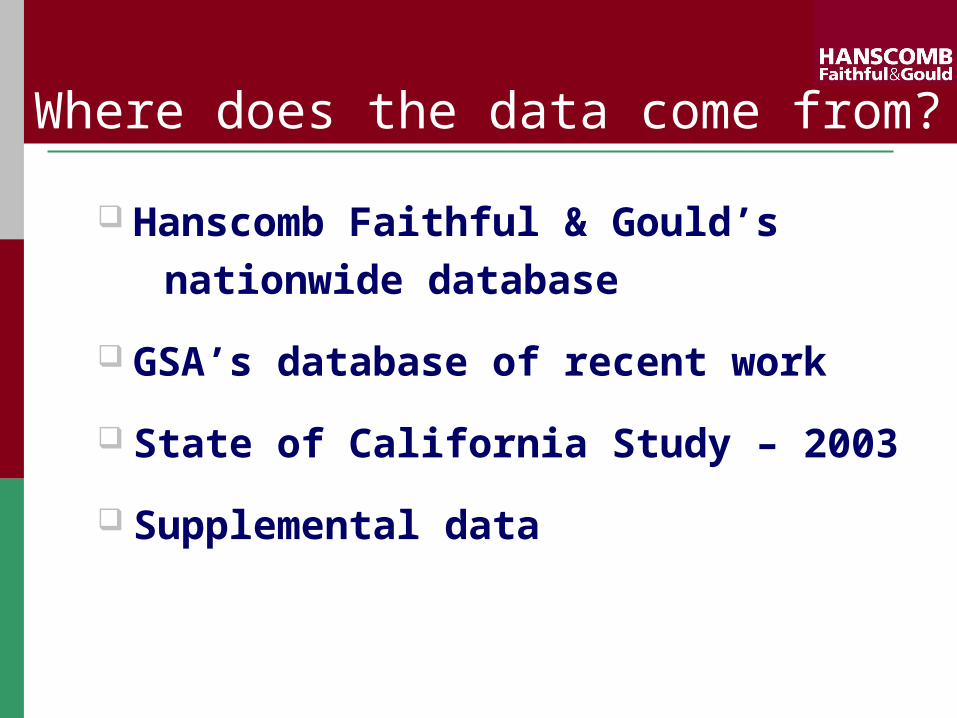
Where does the data come from?
Hanscomb Faithful & Gould’s
nationwide database
GSA’s database of recent work
State of California Study – 2003
Supplemental data

LEED Rating System Four (4) levels of Certification
LEED Certified 26 - 32 points
Silver Level 33 - 38 points
Gold Level 39 - 51 points
Platinum Level 52+ points (69
possible)
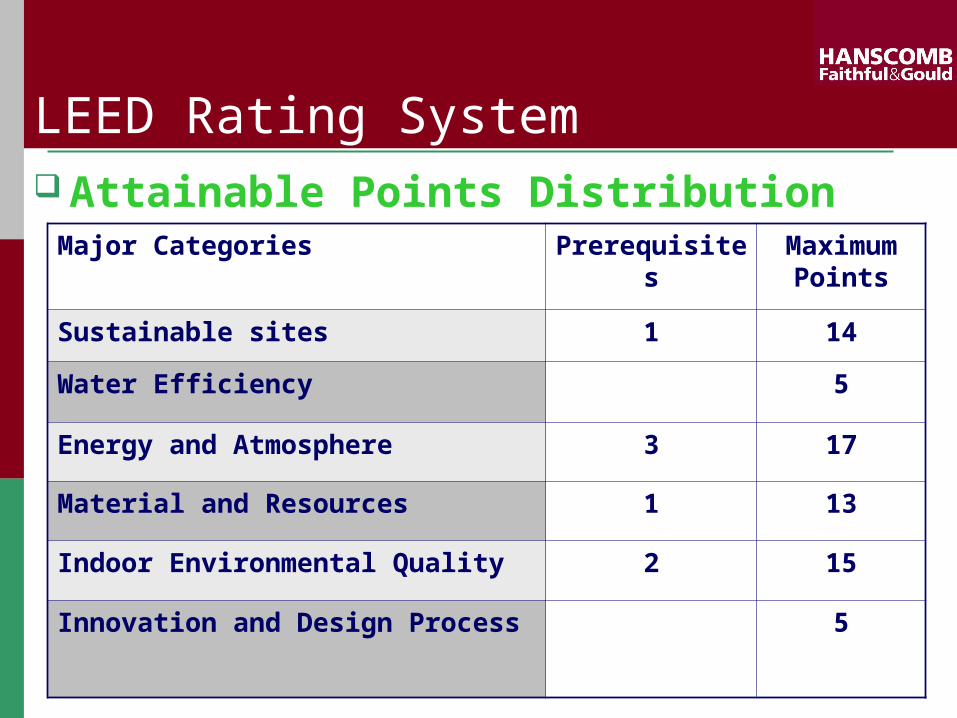
LEED Rating System
Major Categories Prerequisites
Maximum Points
Sustainable sites 1 14
Water Efficiency 5
Energy and Atmosphere 3 17
Material and Resources 1 13
Indoor Environmental Quality 2 15
Innovation and Design Process 5
Attainable Points Distribution

Life Cycle Cost Saving for LEED Projects
Energy & Lighting Efficiency
Water Efficiency
Materials Efficiency
Employee Productivity
Employee Health
Construction & Debris Recycling

Sensitivity to Life Cycle Cost
Energy
(2%)
Educational Staffing (31%)
Support Staffing (11%)
Furnishings / Fitout (4%)Fees (1%)
Construction Contingency
1%Other Project Costs
School Allotment (1%)
Textbooks
(1%)
Benefits Overhead (14%)
Other Support Costs (2%)
Major CapitalReplacements
Maintenance (3%)
Transportation (5%)Construction (18%)
(1%)
(1%)
(5 %)
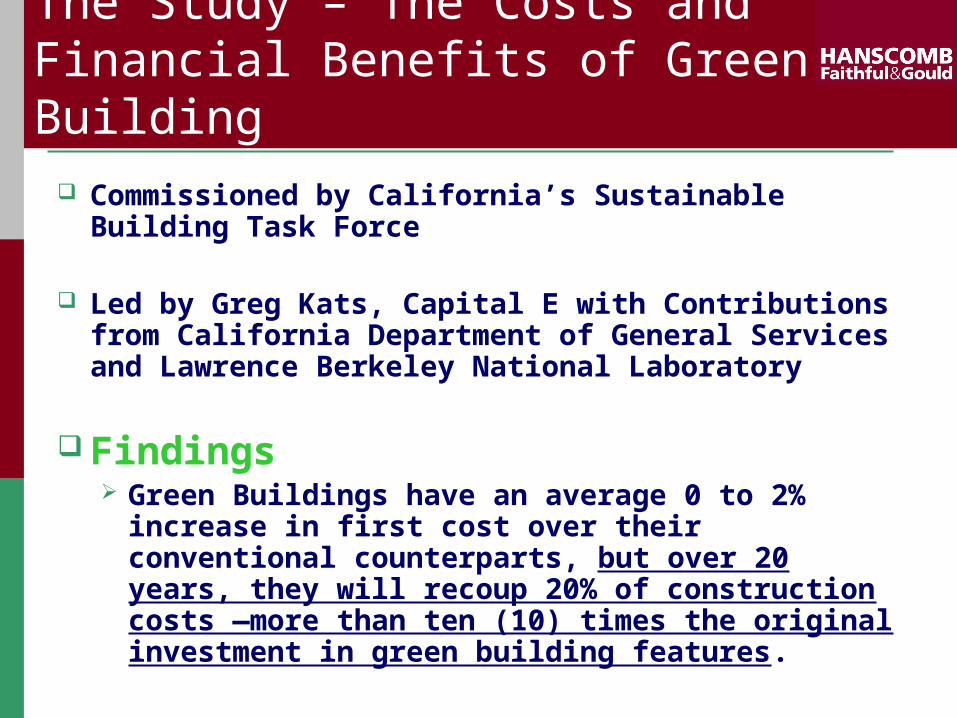
The Study – The Costs and Financial Benefits of Green Building
Commissioned by California’s Sustainable Building Task Force
Led by Greg Kats, Capital E with Contributions from California Department of General Services and Lawrence Berkeley National Laboratory
Findings Green Buildings have an average 0 to 2%
increase in first cost over their conventional counterparts, but over 20 years, they will recoup 20% of construction costs —more than ten (10) times the original investment in green building features.
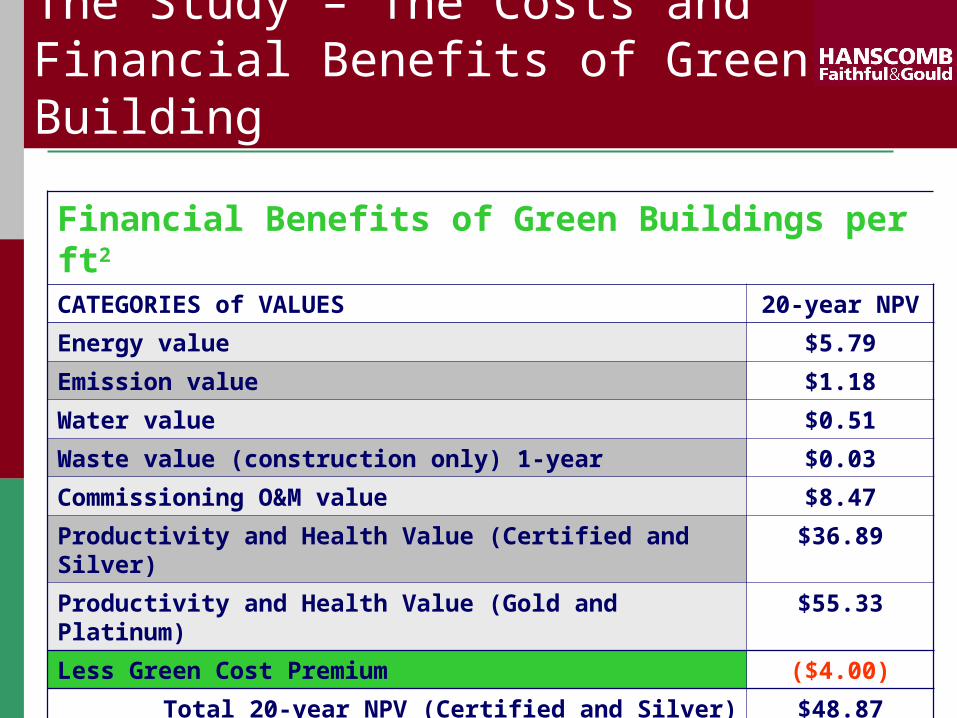
The Study – The Costs and Financial Benefits of Green Building
Financial Benefits of Green Buildings per ft2
CATEGORIES of VALUES 20-year NPV
Energy value $5.79
Emission value $1.18
Water value $0.51
Waste value (construction only) 1-year $0.03
Commissioning O&M value $8.47
Productivity and Health Value (Certified and Silver)
$36.89
Productivity and Health Value (Gold and Platinum)
$55.33
Less Green Cost Premium ($4.00)
Total 20-year NPV (Certified and Silver) $48.87
Total 20-year NPV (Gold and Platinum) $67.31

The Study – The Costs and Financial Benefits of Green Building
Contributors to increased value Percentage Breakdown of Green Building - Financial
Benefits LEED Certified & Silver Buildings
Productivity &
Health
70%
Reduced O&M
16%
Waste
0%
Energy
11%Water
1%
Emissions
2%
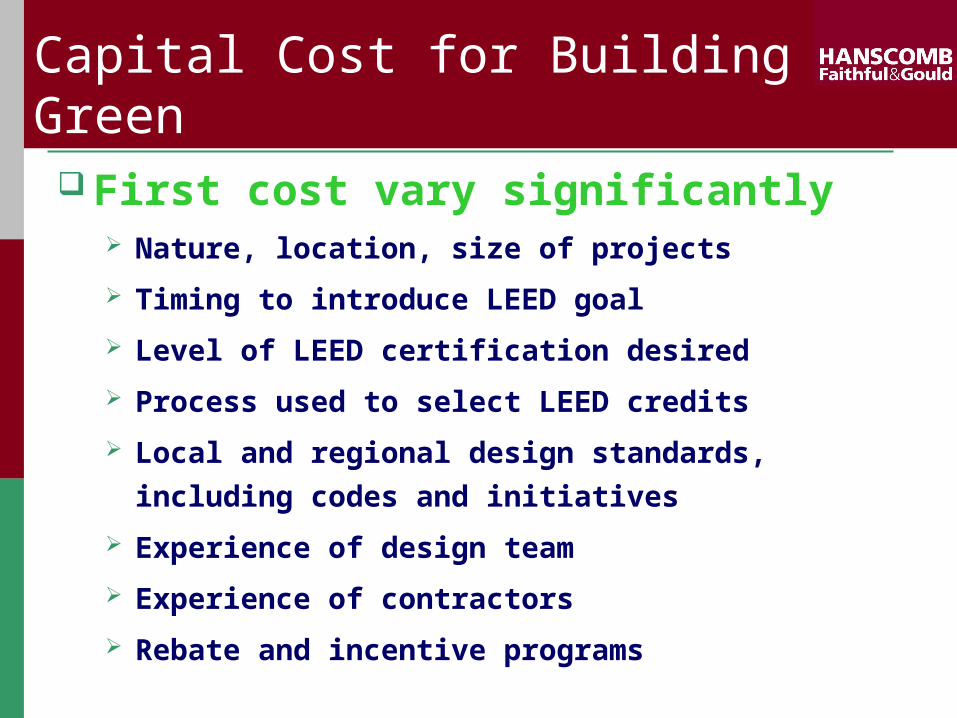
Capital Cost for Building Green First cost vary significantly
Nature, location, size of projects
Timing to introduce LEED goal
Level of LEED certification desired
Process used to select LEED credits
Local and regional design standards, including
codes and initiatives
Experience of design team
Experience of contractors
Rebate and incentive programs
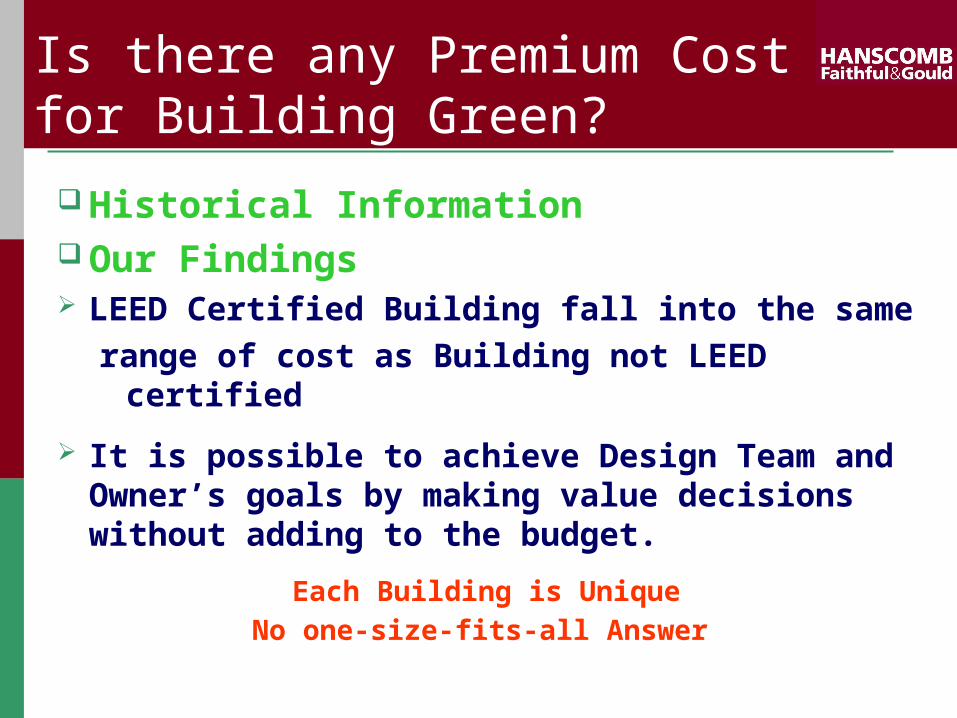
Is there any Premium Cost for Building Green?
Historical Information Our Findings LEED Certified Building fall into the same
range of cost as Building not LEED certified
It is possible to achieve Design Team and Owner’s goals by making value decisions without adding to the budget.
Each Building is UniqueNo one-size-fits-all Answer

Trends Cost ($) for building green
decreases as
Consultants and contractors gain more experience
Newer, cheaper and better availability of green materials
More local policy incentives

Ref. Points Description Cost Implication ($)
SSp1 Erosion & Sedimentation Control
No or minimum additional cost, typical to project requirements
SSc1* Site Selection High credit attainment %
SSc2 Urban Development Density
SSc3 Brownfield Development
Cost can be significant
SSc4.1*
Alternative Transport Public Transportation Access
SSc4.2*
Alternative Transport 5% Bicycle Storage & Change/Shower Room
Relatively inexpensive
Points Analysis Sustainable Sites (SS) *(yellow categories) / most
achieved points

Ref. Points Description Cost Implication ($)
SSc4.3 Alternative Transport Alternative Fuel Refueling
Cost depends on types of fuel etc., may become obsolete.
SSc4.4*
Alternative Transport Parking Capacity Reduction, Vanpools
Minimum cost
SSc5.1 Reduced Disturbance Protect / Restore Open Space
Minimum cost; Expensive if underground parking is used
SSc5.2*
Reduced Site Disturbance Development footprint
Minimum cost or not achievable at all
Points Analysis Sustainable Sites (SS) *(yellow categories) / most
achieved points

Ref. Points Description Cost Implication ($)
SSc6.1 Stormwater Management no net increase in Rate & Quantity of Stormwater run off
Cost depends on method smaller footprint, pervious paving, relatively inexpensive or even save money green roof, more expensive( up to $100 / square foot)
SSc6.2 Stormwater Management Treatment - remove TSS and TP contaminants
Swales – minimum cost impact;Retention / Detention Ponds - more expensive; Stormwater Collection Tank - costly
SSc7.1*
Landscaping actions to reduce heat island effect Non-roof
Relatively low cost for adding shade trees etc.
Points Analysis Sustainable Sites (SS) *(yellow categories) / most
achieved points

Ref. Points Description Cost Implication ($)
SSc7.2*
Landscaping actions to reduce heat island effect, Roof
Energy Star compliant roofing – relatively inexpensiveGreen roof – can be costly
SSc8* Light Pollution Reduction by eliminating light trespass from site
Some premium cost – external lighting, added cost for sensor or light shades
Points Analysis Sustainable Sites (SS) *(yellow categories) / most
achieved points
Ref. Points Description Cost Implication ($)
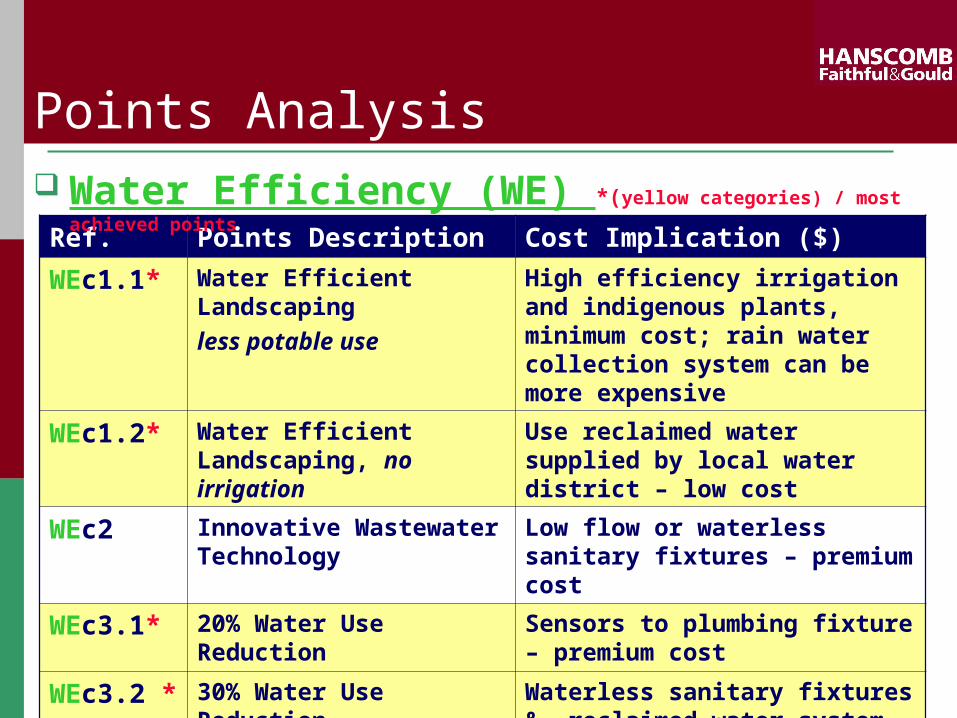
WEc1.1* Water Efficient Landscaping less potable use
High efficiency irrigation and indigenous plants, minimum cost; rain water collection system can be more expensive
WEc1.2* Water Efficient Landscaping, no irrigation
Use reclaimed water supplied by local water district – low cost
WEc2 Innovative Wastewater Technology
Low flow or waterless sanitary fixtures – premium cost
WEc3.1* 20% Water Use Reduction
Sensors to plumbing fixture – premium cost
WEc3.2 *
30% Water Use Reduction
Waterless sanitary fixtures & reclaimed water system, either on site or through local water district
Points Analysis Water Efficiency (WE) *(yellow categories) / most
achieved points

Ref. Points Description Cost Implication ($)
EAp1 System Commissioning 0.1-1.0% of total construction cost
EAp2 Minimum Energy Performance per ASHRAE/IESNA 90.1-1999
EAp3 CFC Reduction in HVAC&R
No additional cost, standard practice
EAc1.1-5*
Optimize Energy Performance 20 - 60% new 10 - 50% Existing Building
Cost varies – energy efficient lighting fixtures & HVAC equipment; efficient control system; low - E glazing; shading devices; soft cost for energy modeling
Points Analysis Energy & Atmosphere (EA)*(yellow categories) / most
achieved points
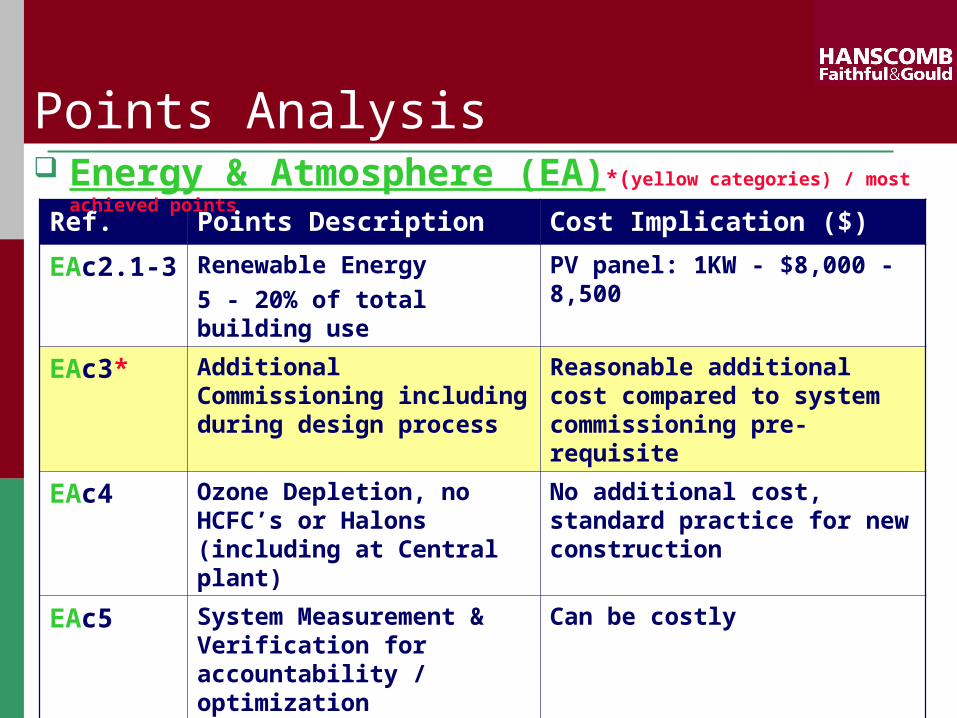
Ref. Points Description Cost Implication ($)
EAc2.1-3
Renewable Energy 5 - 20% of total building use
PV panel: 1KW - $8,000 - 8,500
EAc3* Additional Commissioning including during design process
Reasonable additional cost compared to system commissioning pre-requisite
EAc4 Ozone Depletion, no HCFC’s or Halons (including at Central plant)
No additional cost, standard practice for new construction
EAc5 System Measurement & Verification for accountability / optimization
Can be costly
EAc6 Green Power, 2-year utility contract to buy energy from renewable sources
Reasonable cost based on annual energy usage; operation cost rather than first cost
Points Analysis Energy & Atmosphere (EA)*(yellow categories) / most
achieved points

Ref. Points Description Cost Implication ($)
MRp1 Recyclable Collection / Storage
Reasonable cost
MRc1.1-2 Maintain 75 - 100% of Existing Structure
For renovation projects only, might affect achieving energy use reduction
MRc1.3 Reuse, maintain 100% shell, 50% non-shell
MRc2.1-2 *
Construction Waste Management, Divert 50-75%, measured by weight
Cost varies depending on project location and waste recycling program
MRc3.1-2 Resource Re-use, Specify 5 -10% salvaged / refurbished, by cost.
May not achieve due to the high percentage, cost impact normally minimum
Points Analysis Materials & Resources (MR)*(yellow categories) / most
achieved points

Ref. Points Description Cost Implication ($)
MRc4.1-2 *
25-50% total materials have Recycled Content post consumer/post industrial - by cost
High level of attainment on certified projects.
Possible initial material cost premium.
MRc5.1 * 20% total materials are Manufactured Regionally measured by cost
High level of attainment on certified projects.
Possible material cost premium due to limited resources.
MRc5.2 * 50% of above Regional Materials were locally sourced / harvested
High level of attainment on certified projects.
Possible material cost premium due to limited resources.
Points Analysis Materials & Resources (MR)*(yellow categories) / most
achieved points
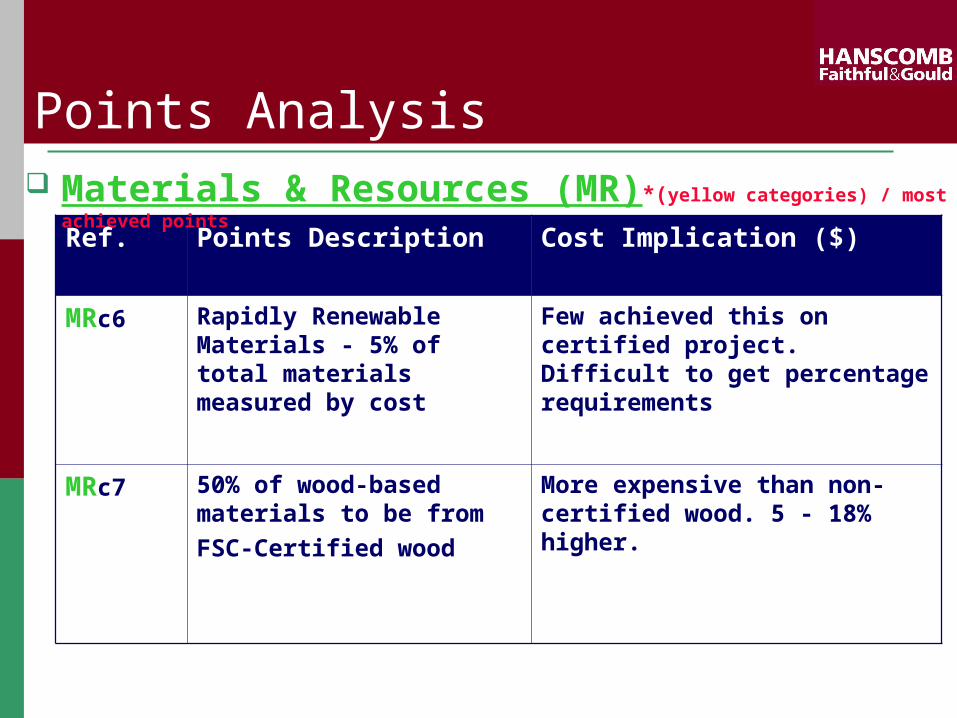
Ref. Points Description Cost Implication ($)
MRc6 Rapidly Renewable Materials - 5% of total materials measured by cost
Few achieved this on certified project. Difficult to get percentage requirements
MRc7 50% of wood-based materials to be from FSC-Certified wood
More expensive than non-certified wood. 5 - 18% higher.
Points Analysis Materials & Resources (MR)*(yellow categories) / most
achieved points
Ref. Points Description Cost Implication ($)
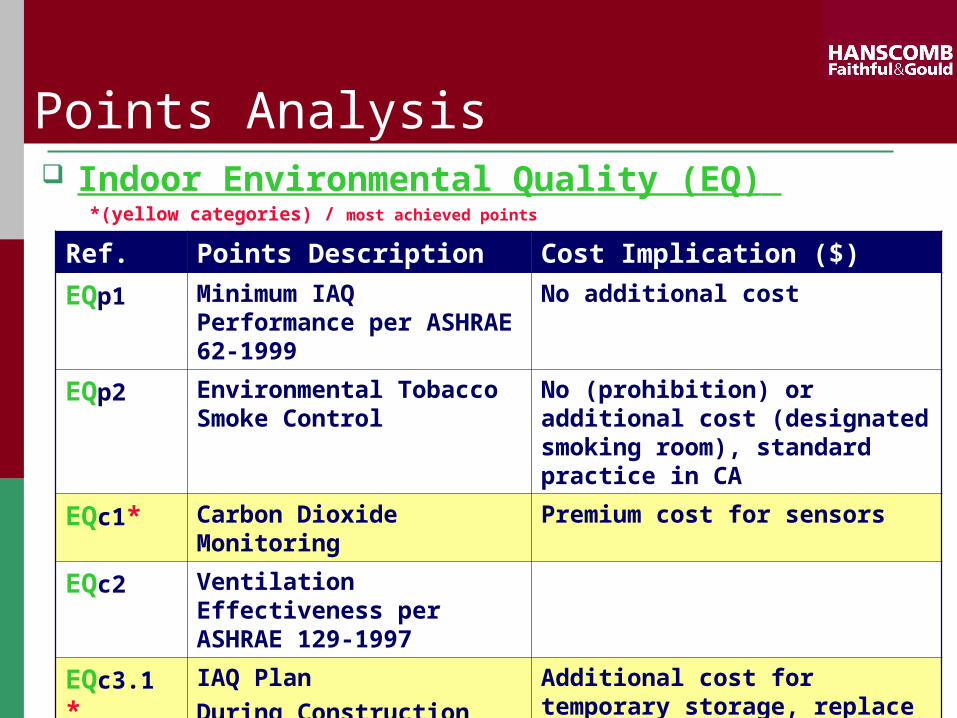
EQp1 Minimum IAQ Performance per ASHRAE 62-1999
No additional cost
EQp2 Environmental Tobacco Smoke Control
No (prohibition) or additional cost (designated smoking room), standard practice in CA
EQc1* Carbon Dioxide Monitoring
Premium cost for sensors
EQc2 Ventilation Effectiveness per ASHRAE 129-1997
EQc3.1 *
IAQ Plan During Construction
Additional cost for temporary storage, replace filter, dehumidification equipment
Points Analysis Indoor Environmental Quality (EQ)
*(yellow categories) / most achieved points

Ref. Points Description Cost Implication ($)
EQc3.2 *
IAQ Plan Before Occupancy
2 - week flush out needs to be integrated into the construction schedule, additional cost
EQc4.1 *
Low-Emitting Adhesive Sealant
No or minimum cost High level of attainment
EQc4.2 *
Low-Emitting Materials Paints
No or minimum cost High level of attainment
EQc4.3 *
Low-Emitting Materials, Carpets
No or minimum costHigh level of attainment
EQc4.4 Low-E Composite Wood Minimum cost
EQc5 * Indoor Chemical /Pollutant Control
Minimum cost
Points Analysis Indoor Environmental Quality (EQ)
*(yellow categories) / most achieved points
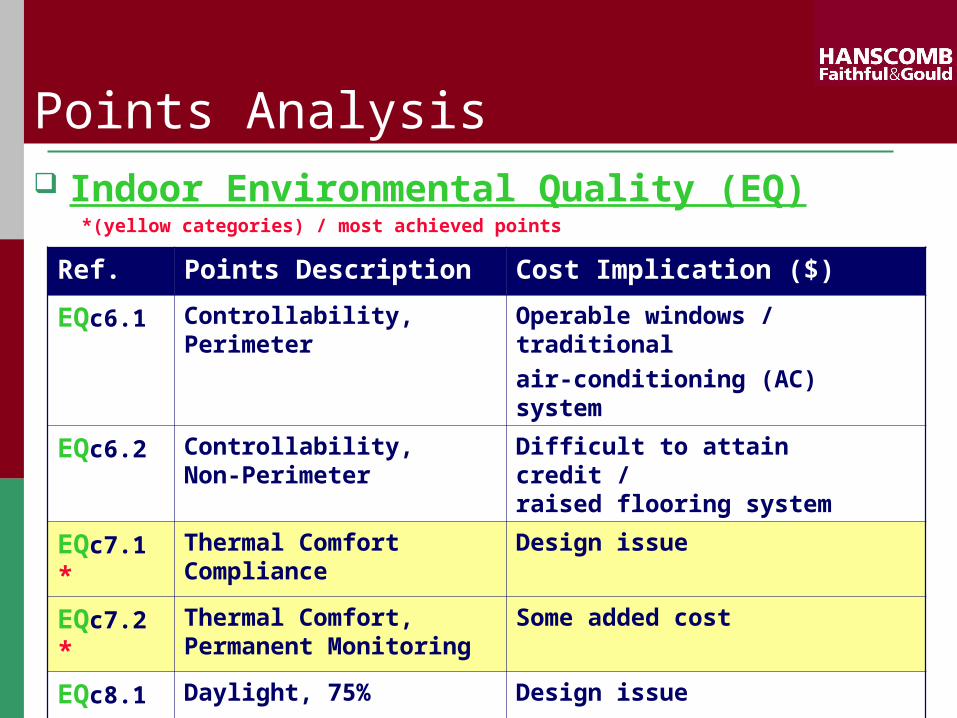
Ref. Points Description Cost Implication ($)
EQc6.1 Controllability, Perimeter
Operable windows / traditional air-conditioning (AC) system
EQc6.2 Controllability, Non-Perimeter
Difficult to attain credit /raised flooring system
EQc7.1 *
Thermal Comfort Compliance
Design issue
EQc7.2 *
Thermal Comfort, Permanent Monitoring
Some added cost
EQc8.1 Daylight, 75% Design issue
EQc8.2 *
Daylight and Views, 90%
Design issue
Points Analysis Indoor Environmental Quality (EQ)
*(yellow categories) / most achieved points
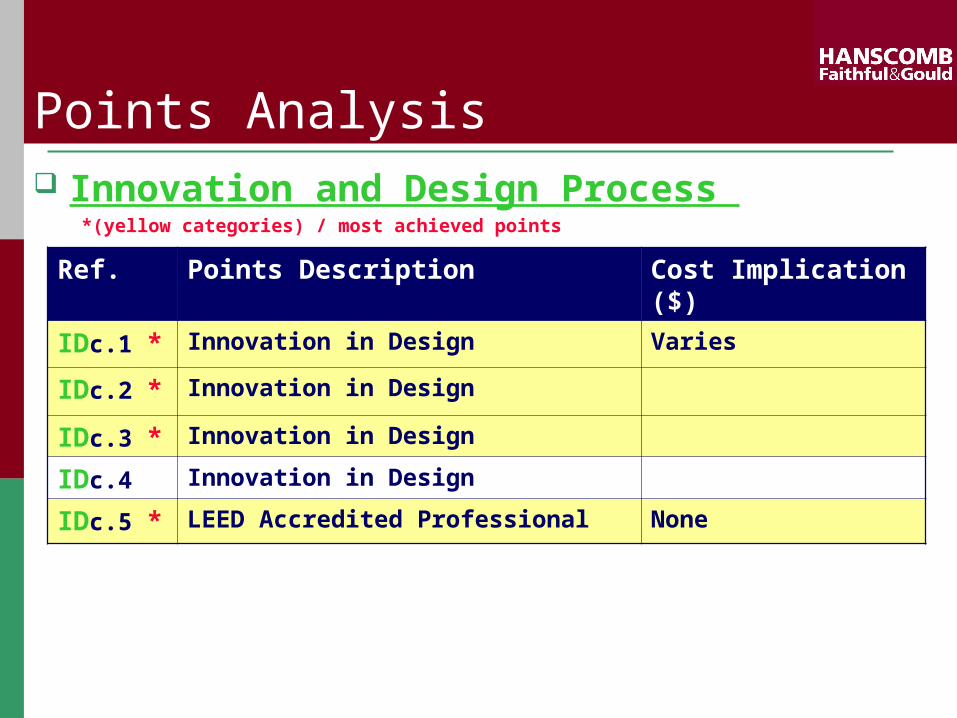
Ref. Points Description Cost Implication ($)
IDc.1 * Innovation in Design Varies
IDc.2 * Innovation in Design
IDc.3 * Innovation in Design
IDc.4 Innovation in Design
IDc.5 * LEED Accredited Professional None
Points Analysis Innovation and Design Process
*(yellow categories) / most achieved points

Other Cost Factors to Consider Documentation cost ($) during Design
and Construction Extra Design Fees Rebate Programs
Solar incentive program by LADWP Local Green Building Incentives
such as expedited permitting, low inspection
fees, tax credit, and Savings by Design Program
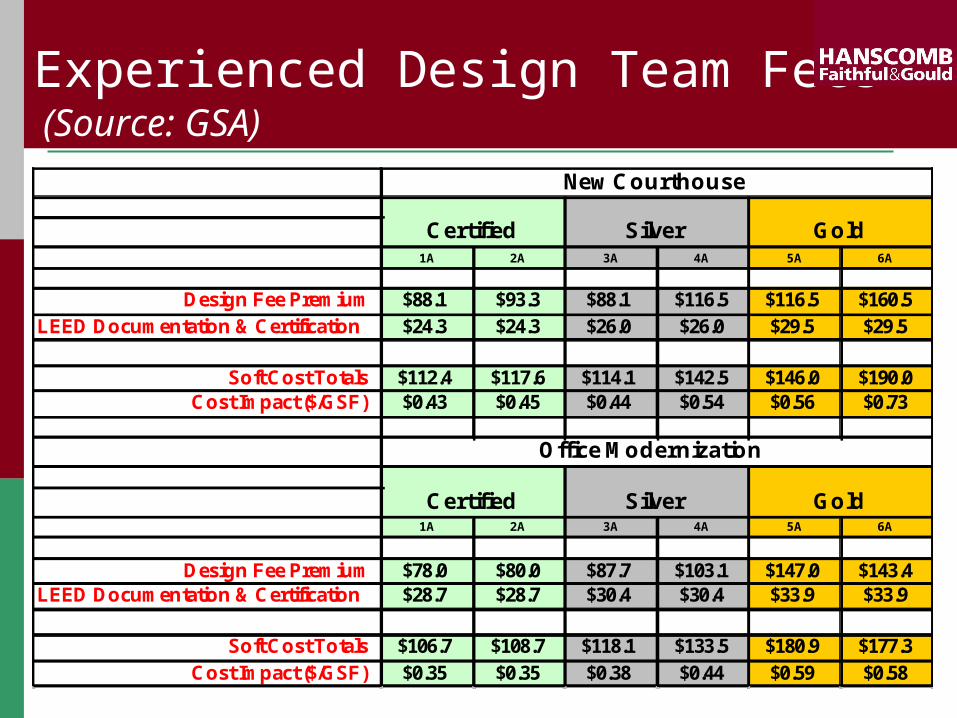
Experienced Design Team Fees (Source: GSA)
New Courthouse
Certified Silver Gold1A 2A 3A 4A 5A 6A
Design Fee Premium $88.1 $93.3 $88.1 $116.5 $116.5 $160.5LEED Documentation & Certification $24.3 $24.3 $26.0 $26.0 $29.5 $29.5
Soft Cost Totals $112.4 $117.6 $114.1 $142.5 $146.0 $190.0Cost Impact ($/GSF) $0.43 $0.45 $0.44 $0.54 $0.56 $0.73
Office Modernization
Certified Silver Gold1A 2A 3A 4A 5A 6A
Design Fee Premium $78.0 $80.0 $87.7 $103.1 $147.0 $143.4LEED Documentation & Certification $28.7 $28.7 $30.4 $30.4 $33.9 $33.9
Soft Cost Totals $106.7 $108.7 $118.1 $133.5 $180.9 $177.3Cost Impact ($/GSF) $0.35 $0.35 $0.38 $0.44 $0.59 $0.58

Savings by Design Program is
Founded by California Utility Customers Administered by Pacific Gas and Electric (P G&E),
San Diego Gas and Electric, Southern California Edison Company and Southern California Gas Company.
Whole Building approach Systems approach
Daylight saving Interior lighting system Heating, ventilation, and air conditioning (HVAC)
system Service Hot Water Other Systems
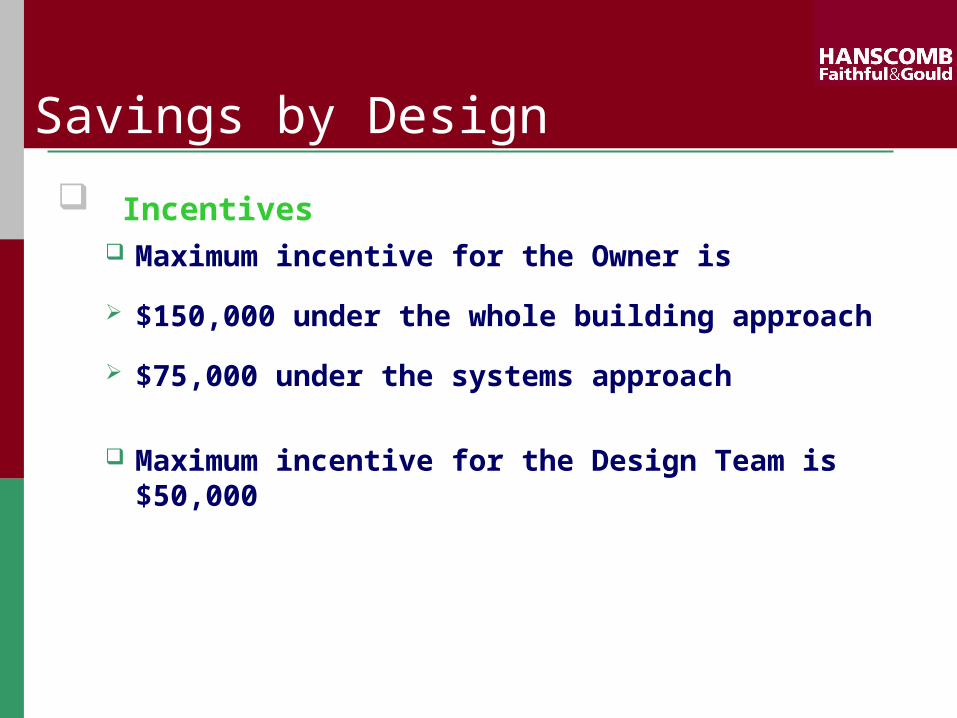
Savings by Design
Incentives Maximum incentive for the Owner is
$150,000 under the whole building approach
$75,000 under the systems approach
Maximum incentive for the Design Team is $50,000
Cost Implications of LEED
Understanding Cost Constraints
LEED Point Analysis
Sharing our Lessons Learned
Questions and Answers
Sharing Best Practices from Audience Members
Thank you for attending