the cost of a comprehensive national wildlife habitat ...€¦ · conservation managers and policy...
TRANSCRIPT

The Cost of a Comprehensive National Wildlife Habitat Conservation System
PROJECT COMPLETION REPORT FOR THE NATIONAL COUNCIL FOR SCIENCE AND THE ENVIRONMENT
Wildlife Habitat Policy Research Program
WHPRP Project 1F
Principle Investigator: Frank Casey, PhD
Co-Investigators: Anna McMurray, Timm Kroeger, PhD, Julia Michalak, and Paula Manalo
Defenders of Wildlife
October 2008
2
Acknowledgements
The authors would like to express our great appreciation to the dozens of individuals in the public and private sectors whose assistance in providing cost and land area data was indispensable to completing this report. These individuals are listed in Appendix I. We want to communicate a great deal of gratitude to our Project Steward, Dr. Alan Randall of the Ohio State University, for his invaluable guidance in our analysis and interpretation of our findings. A special thank you also goes to Mr. Dennis Figg of the Missouri Department of Conservation who was very helpful in determining how our initial cost estimates could be revised. Finally, we are very appreciative to Andrew duMoulin and Mary Bruce Alford of the Trust for Public Land in giving us access to a comprehensive data base of conservation expenditures which provided a more realistic basis for our cost estimates.
Citation: Casey, F., A. McMurray, T. Kroeger, J. Michalack, and Paula Manalo. 2008. The Cost of a Comprehensive National Wildlife Conservation System: A Project Completion Report for the Wildlife Habitat Policy Research Program. Defenders of Wildlife. Conservation Economics Program. Washington DC Defenders of Wildlife is a national nonprofit membership organization dedicated to the protection of all native wild animals and plants in their natural communities. National Headquarters Defenders of Wildlife 1130 17th St. NW Washington, DC 20036 USA Tel.: (202) 682-9400; website www.defenders.org © Defenders of Wildlife October 2008

TABLE OF CONTENTS
I. ABSTRACT 4
II. INTRODUCTION AND PURPOSE 6
III. SUMMARY OF RESULTS 8
A. NATIONAL LEVEL ANALYSIS ...........................................................................................8
B. STATE LEVEL ANALYSIS .................................................................................................. 11
IV. METHODOLOGICAL APPROACH 13
A. ESTIMATING FOCAL OPPORTUNITY AREAS ......................................................... 13 1. Identification of Conservation Opportunity Areas .............................................................13 2. Measuring Protected and Unprotected Focal Areas ............................................................15 3. Identification of Land Type/Cover........................................................................................15 4. Overall Spatial Analysis ............................................................................................................15
B. ESTIMATION OF NATIONAL PROTECTION, TRANSACTIONS
AND MANAGEMENT COSTS ............................................................................................................ 19 1. Fee-Simple Acquisition and Stewardship/Management Costs ..........................................19
a. Fee-Simple Acquisition Costs............................................................................................19 b. Management Costs for Fee-Simple Purchases................................................................21
2. Conservation Easements..........................................................................................................22 a. Conservation Easement Purchase Costs.........................................................................22 b. Easement Transactions Costs ...........................................................................................23
3. Land Rentals/Leases.................................................................................................................23
SUMMARY OF METHODOLOGICAL APPROACHES .......................................................................24
V. DELIVERABLES 25
VI. REFERENCES 26
VII. APPENDICES 27
APPENDIX I. LIST OF RESEARCH CONTACTS ...............................................................................28
APPENDIX II. LIST OF FORTHCOMING PUBLICATIONS AND PRESENTATIONS................. 31

4
I. Abstract Reliable estimates of investment costs are crucial for developing and implementing public policies to establish a comprehensive national habitat conservation system. In order for conservation managers and policy makers to make the case for increased habitat conservation expenditures, information on cost levels and how these costs vary across land protection strategies will be required. Using a representative sample of State Wildlife Action Plans (State Plans), national habitat conservation costs are estimated for three land protection strategies: fee-simple purchase, rental/lease, and permanent easements. We generate cost estimates that extend over a thirty-year projection period for two land protection scenarios: 22% (410.8 million acres) and 12% (217.9 million acres) of the continental United States. Our results show that over a 30-year period the undiscounted least cost option for protecting 12% of the continental United States is through land rentals/leases, at an estimated $219 billion. Fee-simple purchases with management costs would be nearly $927 billion. Easements, including initial one-time transactions costs, would amount to about $350 billion. However, if current landowners were paid to manage these same lands for biodiversity values, the cumulative undiscounted costs after 30 years would be about $135 billion. There are two conditions, relative to fee-simple purchase and easements, which make rentals less financially attractive over the long term. First, rental payments would continue indefinitely beyond the 30-year period. Second, per-acre rental rates will probably continue to increase over time. At the 40-year mark, easements become more efficient than land rental/leases. Cumulative land rental/lease costs increase to about $435 billion in year 40 compared to the 30-year cumulative cost of about $350 billion for easements. We assume no public management costs because landowners selling development rights would be responsible for habitat management. Thus, over the longer term, conservation easements become relatively more attractive than rentals over time. For fee-simple purchases, habitat management costs would constitute an on-going expenditure beyond year-30. On-going management costs between years 30 and 40 increases the cumulative fee-simple cost to about $1.1 trillion at the 40-year mark. The relative effectiveness and efficiency of various protection strategies will depend on biological and economic conditions at the local level. It is likely that a mixture of protection strategies, including paying landowners to manage for wildlife habitat, will be employed to implement the State Plans. Despite the long-term drawbacks of land rental, renting may be a viable short-term option if the goal is to protect specific species that are moving quickly to adapt to climate change. Alternatively, those areas that are seen as crucial migration corridors over the long term may warrant permanent protection through easements or fee-simple purchases. Contracting landowners to manage for biodiversity values may be the most flexible instrument to achieve this.

5
Cost estimates for individual states vary significantly depending on current land use, price structures, and the amount of land needing protection. Over a 30-year time frame, estimated fee-simple acquisition costs vary from a high of about $17 billion in Wyoming to a low of nearly $942 million in Illinois. Estimated easement costs over 30 years vary from about $25 billion in Nebraska to almost $515 million in Illinois. In some cases, cumulative easement costs in some states are higher than fee-simple costs, a counter-intuitive result. The data show that there are non-comparabilities between states and between protection strategies for two basic reasons. First, some state-level samples for the various strategies are quite small and, second, there is likely to be some endogeneity in the choice of strategies (characteristics of specific parcels, spatial relationships to nearby lands, ownership characteristics, and perhaps the value of a land parcel in other present or future alternative uses1). Overall, the cost of a national habitat conservation system is comparable with other large-scale infrastructure investments. Whereas the cost of such a system through fee simple purchases would be about $31.6 billion in year one, and $74.4 billion in year 30, it is estimated that urban building construction costs will reach about $1 trillion per year over the next 30 years. Annual Federal expenditures on transportation infrastructure are about $47.8 billion. In the future, costs may have to be adjusted upwards for two reasons. First, large investments in conservation lands identified by State Plans may initiate unintended dynamic market feedbacks by causing land prices to increase. Land prices could be driven up as a result of an expected decrease in the available area for development and/or through speculative purchases. The second factor may be the impact of increased demand for biofuel and food, both of which are currently driving up rural land prices.
1 The authors are grateful to our Project Steward, Dr. Alan Randall, for raising this important observation.
6
II. Introduction and Purpose
The mission of the Wildlife Habitat Policy Research Program (WHPRP) is to “develop and disseminate new information and tools to accelerate the conservation of wildlife habitat in the U.S.” Developing a reliable cost estimate for expanding a national habitat conservation system is critical for policy makers and funding authorities. To make the case for increased conservation funding not only requires overall cost estimates, but also information about how these costs vary among selected land protection strategies. The purpose of this report is to provide an estimate of the national cost of conserving unprotected priority habitat areas that have been identified in the U.S. State Wildlife Action Plans (State Plans). These cost estimates are for habitats that are classified as endangered or at-risk. A national cost estimate is crucial for determining a realistic magnitude of investment in habitat conservation vis-à-vis other types of public and private expenditures. Because costs vary according to the type of protection strategy employed, we provide cost estimates for three primary alternatives: fee-simple purchase; lease/rental agreements; and permanent easements. In addition, we provide cost estimates for paying landowners to manage for wildlife habitat values on their holdings. These estimates are meant to provide guidance with respect to selecting the most cost-effective financial instrument to fund land protection goals over time. A five-stage research procedure was employed to meet the purposes of this study: (1) estimate the national U.S. land requirements for additional habitat protection, based on a representative sample of State Plans for which unprotected focal conservation opportunity areas were mapped; (2) provide national cost estimates for three alternative land protection tools (fee-simple purchase, lease, and easements), including easement transactions costs and management costs associated with land ownership; (3) identify potential impacts on local land prices from large-scale acquisitions; (4) develop outreach materials (including a prototype cost-estimator) that project managers, conservation practitioners and policy makers can use for future habitat conservation cost projections at the local level; and (5) conduct a policy analysis with respect to the magnitude of expenditures required and the trade-offs between potential financial instruments. This Project Completion Report summarizes a Final Technical Report (forthcoming in November 2008) that will provide more detail regarding our research methods, cost estimates, and policy analyses. Other deliverables will include PowerPoint presentations to various conservation groups, project summaries and fact sheets, and suggestions for a habitat cost estimator that local policy makers may employ in the future. Presentations will be made to an array of public and private habitat conservation agencies. All presentations and reports are being placed on Defenders’ and WHPRP websites and will serve as a basis for submitting articles to peer-reviewed journals. The next section of this report provides a summary of the major results and findings of our cost analyses. Section IV describes the methodological approaches and assumptions upon which our major findings are based. Section V outlines future project deliverables. A list of key references is provided in Section VI. Section VII contains Appendices of supporting

7
information and documents related to contacts, project websites, publications, and other project outputs.

8
III. Summary of Results
A. National Level Analysis Based on the research approach and methods described in Section IV, we calculated the expected cost of a national habitat conservation system based on two primary groupings. The first grouping comprises two geographical protection Scenarios. The first is a “Baseline Scenario” that defines what a sample of State Plans initially identified as the area requiring protection. Using these State Plans, the Baseline land protection Scenario was estimated at about 22% of the continental United States, or about 410.8 million acres. The second “Adjusted Scenario” employs revised land protection area estimates provided by some states and results in an estimate of 12% of the continental United States, or about 217.9 million acres. The second grouping distinguishes between various strategies (fee-simple purchase, rentals/leases, or permanent easements) that could be used to protect lands identified in the State Plans. For each of the protection strategies and geographical scenarios, cumulative cost estimates for a 30-year period were derived. We assumed that the total acreage to be protected would be divided into 30 equal annual increments. With the exception of the base year, we assume a 3% annual increase in real land costs and that all protection strategies are equally viable in all parts of the U.S. Table 1 shows the cost estimates we derived for the Baseline and Adjusted Scenarios.
Table 1. Cumulative Cost Comparisons by Land Protection Strategy ($2006 billions)
Protection Strategy Baseline Scenario (22%) Adjusted Scenario (12%) 1. Fee-Simple Purchase (30 Years)
$1,500 $792.2
2a. Management Costs (30 Years)
$254 $134.9
2b.Purchase+Management Costs (30 Years)
$1,754 $927.1
2c. Management Costs (40 Years)
$507 $268.7
2d.Purchase+Management Costs (40 Years)
$2,007 $1,061
3. Conservation Easements w/ Transactions Costs (30 Years)
$660.3 $350.2
4a. Land Rental (30 Years) $412 $218.5 4b. Land Rental (40 Years) $820 $435.4 4c. Land Rental (50 Years) $1,370 $726.9 Note: Cumulative cost figures are rounded to the nearest billionth. Baseline Scenario is 410.8 million acres; Adjusted Scenario is about 217.9 million acres.
In this summary, we concentrate on the Adjusted Scenario because it is the most likely candidate for implementation. For the three particular protection strategies, our estimates indicate that the least-cost alterative for protecting 12% of the continental US over the next 30 years is through land rental. For the Adjusted Scenario, land rental over a 30-year period would cost about $218.5 billion (at today’s prices) compared to the 332.2 billion for
9
permanent easements (including up-front transactions costs). Fee-simple purchases, including annual management costs, would cost about $927.1 billion over thirty years. However, if private landowners were paid to manage for wildlife habitat values, the 30-year cost would be about $135 billion. Of the three protection strategies, the land rental protection option would appear to be more efficient. However, over longer time periods (40 and 50 years), the cost of continually renting land would exceed the costs of easements. For example, the total cost of permanent easements in year 30, with one-time transactions costs, is about $350 billion, or $103 billion less than land rental costs over 40 years ($435.4 billion) (Table 1). Although the gap between the costs of a fee-simple (including management costs) versus rental protection strategy diminishes at the 40-year mark, it is still significant (about $1.06 trillion for land purchase and management versus $435 billion for rentals). At some point in time, the attractiveness of land rental over the fee-simple purchase protection strategy will disappear. This is essentially due to the difference between annual rental rate increases and expected increases in management costs over time. The average projected land rental rate for the Adjusted Scenario is about $113/acre in year 40 and $152/acre in year 50. In comparison, annual management costs for fee-simple purchases are about $70/acre in year 40, and $94/acre in year 50. Because management costs increase less in absolute terms than rental rates (assuming the same rate of price increase of 3% applies in both markets), at some time beyond year 50 it will be cheaper to own and manage habitats identified by the State Plans rather than to continually rent them. The same relative cost comparisons described above for the Adjusted Scenario also hold true for the Baseline Scenario, except that Baseline Scenario costs are nearly double. For the 30-year time frame, for example, fee-simple purchases with management costs amount to about $1.75 trillion, compared with $660 billion for conservation easements, and $412 billion for land rentals (Table 1). Management costs alone over 30 years would be about $254 billion. There are a few principal factors that determine the cost levels presented in Table 1. First, the longer the time frame for completing the necessary levels of land protection, the more expensive it gets. Recall that we use an annual real (i.e., net of inflation) rate-of-increase in land prices of 3%. In addition, annual rates for habitat management will also increase. There is a possibility that in the future, land prices in areas identified by State Plans could be bid up significantly either because of large decreases in the supply of developable land, land speculation prior to public acquisition, or higher-value competing uses. Second, it is likely that the real level of the costs of protecting either the Baseline or Adjusted land acreages will reflect a combination of protection strategies. Some lands may need to be purchased, others leased or rented, and some will require easements. In fact, some lands within a national habitat conservation system may only require the payment of management costs to landowners who agree to maintain quality habitat on their property. Third, to maintain conservation effectiveness and flexibility in the face of a dynamic environment (e.g. climate change), it may be more biologically and economically efficient to engage in flexible short-to-medium term land lease agreements, even though these types of agreements might be more costly over the long term. Fourth, even though public purchase
10
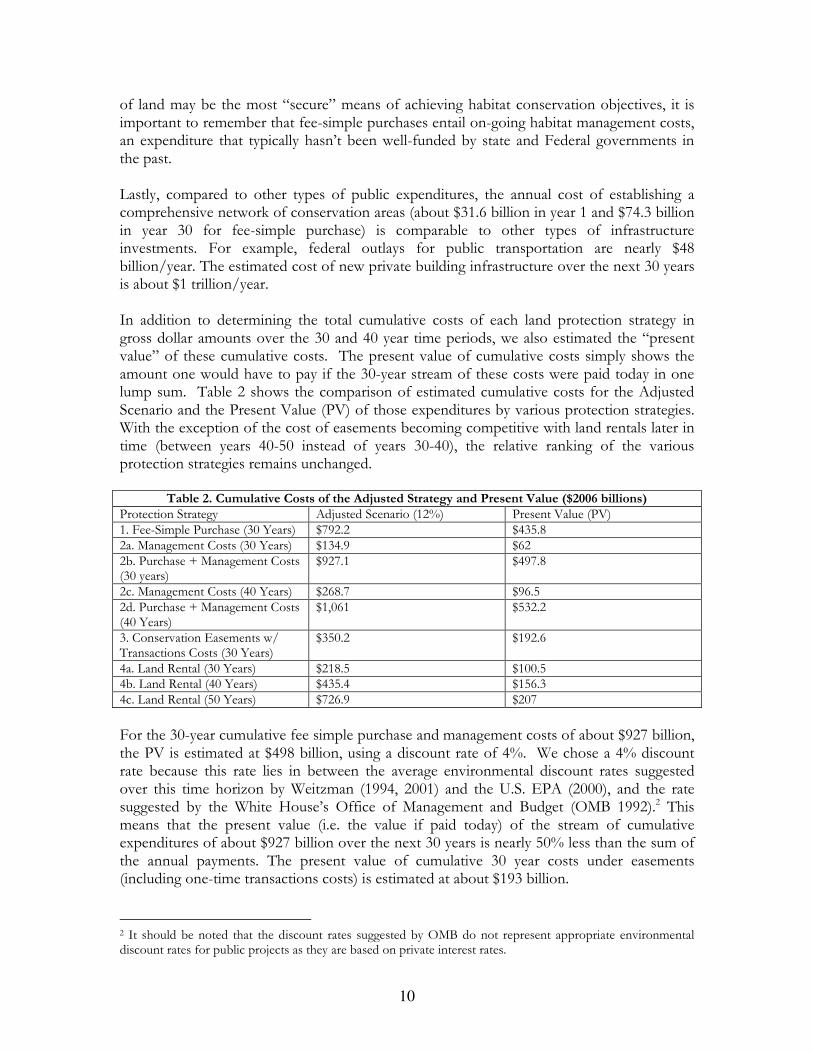
of land may be the most “secure” means of achieving habitat conservation objectives, it is important to remember that fee-simple purchases entail on-going habitat management costs, an expenditure that typically hasn’t been well-funded by state and Federal governments in the past. Lastly, compared to other types of public expenditures, the annual cost of establishing a comprehensive network of conservation areas (about $31.6 billion in year 1 and $74.3 billion in year 30 for fee-simple purchase) is comparable to other types of infrastructure investments. For example, federal outlays for public transportation are nearly $48 billion/year. The estimated cost of new private building infrastructure over the next 30 years is about $1 trillion/year. In addition to determining the total cumulative costs of each land protection strategy in gross dollar amounts over the 30 and 40 year time periods, we also estimated the “present value” of these cumulative costs. The present value of cumulative costs simply shows the amount one would have to pay if the 30-year stream of these costs were paid today in one lump sum. Table 2 shows the comparison of estimated cumulative costs for the Adjusted Scenario and the Present Value (PV) of those expenditures by various protection strategies. With the exception of the cost of easements becoming competitive with land rentals later in time (between years 40-50 instead of years 30-40), the relative ranking of the various protection strategies remains unchanged.
Table 2. Cumulative Costs of the Adjusted Strategy and Present Value ($2006 billions) Protection Strategy Adjusted Scenario (12%) Present Value (PV) 1. Fee-Simple Purchase (30 Years) $792.2 $435.8 2a. Management Costs (30 Years) $134.9 $62 2b. Purchase + Management Costs (30 years)
$927.1 $497.8
2c. Management Costs (40 Years) $268.7 $96.5 2d. Purchase + Management Costs (40 Years)
$1,061 $532.2
3. Conservation Easements w/ Transactions Costs (30 Years)
$350.2 $192.6
4a. Land Rental (30 Years) $218.5 $100.5 4b. Land Rental (40 Years) $435.4 $156.3 4c. Land Rental (50 Years) $726.9 $207
For the 30-year cumulative fee simple purchase and management costs of about $927 billion, the PV is estimated at $498 billion, using a discount rate of 4%. We chose a 4% discount rate because this rate lies in between the average environmental discount rates suggested over this time horizon by Weitzman (1994, 2001) and the U.S. EPA (2000), and the rate suggested by the White House’s Office of Management and Budget (OMB 1992).2 This means that the present value (i.e. the value if paid today) of the stream of cumulative expenditures of about $927 billion over the next 30 years is nearly 50% less than the sum of the annual payments. The present value of cumulative 30 year costs under easements (including one-time transactions costs) is estimated at about $193 billion.
2 It should be noted that the discount rates suggested by OMB do not represent appropriate environmental discount rates for public projects as they are based on private interest rates.

11
B. State Level Analysis
There is tremendous variation in our estimates of what it would cost individual states to conserve identified unprotected focal opportunity areas. This state-by-state variation, which is masked by the national averages presented in Table 1, is a function of the amount of land requiring protection, differences in land use patterns (rural versus urban), the supply and demand for land, specific parcel characteristics and price dynamics. For seventeen states for which land cover data were available, Table 3 summarizes the cumulative cost estimates for fee-simple purchases, conservation easements, and rentals (management and transactions costs are not included) over a 30-to- 50-year period. For the 30-year period, cumulative fee-simple costs range from a high of nearly $17 billion in Wyoming to a low of about $942 million for Illinois. Total cumulative costs for the 30-year period over all states are estimated at about $170 billion for fee simple purchases, nearly $138 billion for easements, and almost $71 billion for land rentals.
Table 3. 30, 40 and 50-year Land Protection Costs by Strategy and State ($2006 billions)
Fee-Simple Purchases
Conservation Easements Rental Agreements
State 30 year 30 year 30 year 40 year 50 year
Florida $29,225,005,613 $4,780,559,913 $2,723,413,725 $5,425,335,853 $9,056,493,256
Georgia $5,605,190,451 $8,144,051,007 $3,081,835,296 $6,139,350,541 $10,248,395,357
Illinois $941,974,804 $515,267,845 $318,380,466 $634,248,459 $1,058,748,628
Iowa $2,629,646,763 $2,037,005,446 $1,271,588,843 $2,533,143,047 $4,228,566,405
Kentucky $11,443,086,220 $6,164,760,685 $4,725,481,516 $9,413,672,280 $15,714,208,637
Maryland $7,657,290,734 $5,749,981,582 $1,588,276,729 $3,741,770,487 $6,635,886,022
Massachusetts $12,708,939,750 $11,441,695,121 $2,713,351,682 $5,405,291,170 $9,023,032,740
Missouri $12,564,117,518 $11,801,104,106 $6,556,409,459 $13,061,079,546 $21,802,812,219
Montana $7,938,689,803 $5,830,331,628 $2,077,069,571 $4,137,748,117 $6,907,127,767
Nebraska $16,422,445,925 $25,467,471,723 $21,687,796,266 $43,204,445,054 $72,121,021,789
New Hampshire $1,277,822,123 $657,082,529 $462,596,630 $921,542,716 $1,538,327,879
New Jersey $6,512,069,818 $3,915,381,752 $748,121,450 $1,490,339,160 $2,487,817,697
North Dakota $2,330,562,083 $3,664,165,386 $2,143,631,224 $4,270,346,156 $7,128,473,188
Oregon $14,496,723,106 $11,497,705,366 $7,448,172,591 $14,837,568,534 $24,768,298,776
Tennessee $10,174,414,852 $10,914,225,993 $6,160,562,791 $12,272,510,003 $20,486,455,971
Virginia $10,604,511,934 $2,558,077,336 $1,748,065,229 $3,482,335,744 $5,813,050,295
Wyoming $17,328,408,799 $22,960,041,203 $5,293,093,920 $10,544,417,820 $17,601,758,023
Total $169,860,900,296 $138,098,908,621 $70,747,847,387 $141,515,144,686 $236,620,474,648
Average $9,991,817,664 $8,123,465,213 $4,161,638,082 $8,324,420,276 $13,918,851,450
In general, for the entire sample of states, the total cumulative costs of rentals exceed cumulative easement costs in year 40, and exceed fee-simple purchase costs in year 50. However, there are exceptions. For some highly urbanized states such as Florida, Maryland, Massachusetts, New Jersey, and Virginia, fee-simple purchases in year 30 are still higher than cumulative rental costs in year 50 (Table 3). This is due to the fact that fee-simple purchase prices in these states far exceed the per-acre agricultural land rental rates. Over time,

12
easements are a more efficient protection strategy compared to fee-simple purchases and land rentals. Table 3 also shows that for five states (Georgia, Nebraska, North Dakota, Oregon and Wyoming) the cumulative costs of easements are estimated to be higher than those of fee-simple purchases. In terms of total and average costs over the entire 17-state sample, however, easements are less expensive than fee simple purchases. In general, cumulative easement costs exceed fee simple costs in the five states due to the amount and types of available cost information (which is due to anomalies in the data) for these states for the various protection scenarios and land uses.3 By averaging the costs over existing programs and land use types for each protection scenario, fewer and/or higher cost observations for easements tended to push up these costs compared to the relatively lower costs of fee simple purchases. For example, the average state-wide cost of an easement might be determined on the basis of 3-4 high-cost observations for valuable land cover types in high value locations, whereas an average state-wide fee-simple cost might be biased downward by including many observations for relatively low-cost agricultural lands. However, the major reasons for the non-comparability between easements and fee-simple purchase for these five states are not only due to the characteristics of the sample observations, but also the possibility of some endogeneity in the choice of the protection instrument. Endogeneity would be caused by the characteristics of a particular parcel, its spatial relationships to adjoining and nearby lands and the values of those lands, the type of ownership, and the value of potential alternative uses in the present or future.4 The fact that non-comparabilities exist for individual states makes it important to determine the cost effectiveness of various protection strategies at the local level.
3 A detailed description of the data anomalies for the five states in question are provided in the Final Technical Report (forthcoming in November 2008). 4 Alan Randall. Personal communication. July, 2008.
13
IV. Methodological Approach
This section describes the methods employed for estimating the cost of a national habitat conservation system, based on the size of the currently unprotected focal opportunity areas identified in a sample of State Plans. The methodology consists of five discrete steps: (1) estimate the size of the total focal opportunity area to be protected, as identified in the sample State Plans; (2) determine which portions of the opportunity areas are currently unprotected; (3) define land cover/use types in unprotected opportunity areas; (4) based on steps 1-3, above, conduct an overall spatial analysis of total unprotected area national-level by land use category; and (5) provide cost estimates for two geographical covers and three land protection strategies. Each of these steps is described below. In order to identify unprotected focal areas and quantify their size and land cover composition, we analyzed Geographic Information Systems (GIS) files or data sets for focal conservation areas, land ownership, and land cover using ArcGIS 9.1. Focal area and land cover data were provided by the state wildlife agencies, the Gap Analysis Project (GAP), and the US Geological Survey or were located on state GIS data clearinghouse websites. In all cases, the most recent land cover data was employed. The details of each stage are described in the forthcoming Final Technical Report. A. Estimating Focal Opportunity Area to be Protected To derive a national-level estimate of the amount of habitat requiring protection, we implemented a four-stage spatial analysis process. The first stage estimates the total national conservation acreage based on a sample of states that identified geographically specific “focal conservation opportunity areas” within their respective State Plans. For these opportunity areas, the second step was to identify the percentage of the land area that is already protected through some form of public ownership or conservation status, and to thereby derive an estimate of the size of the focal area that is currently unprotected. For unprotected focal areas, the third step consisted of identifying the respective major land cover types (agricultural, pasture/grassland, forest, etc.) and estimating the acreages for each land cover. The fourth phase aggregated steps one to three into an overall spatial analysis. The sample size for this analysis consisted of seventeen states for which sufficient spatial information was available to implement the first three stages.
1. Identification of Conservation Opportunity Focal Areas
Figure 1 shows the states (indicated by a “star”) for which (1) maps of focal conservation opportunity areas are available; (2) protected versus unprotected areas could be differentiated; and (3) land use/cover could be determined. The states that met these criteria included Delaware, Florida, Georgia, Illinois, Iowa, Kentucky, Massachusetts, Maryland, Missouri, Montana, North Dakota, Nebraska, New Hampshire, New Jersey, Oregon, Tennessee, Virginia and Wyoming. The spatial analysis presented here is restricted to terrestrial opportunity areas in these states.
14
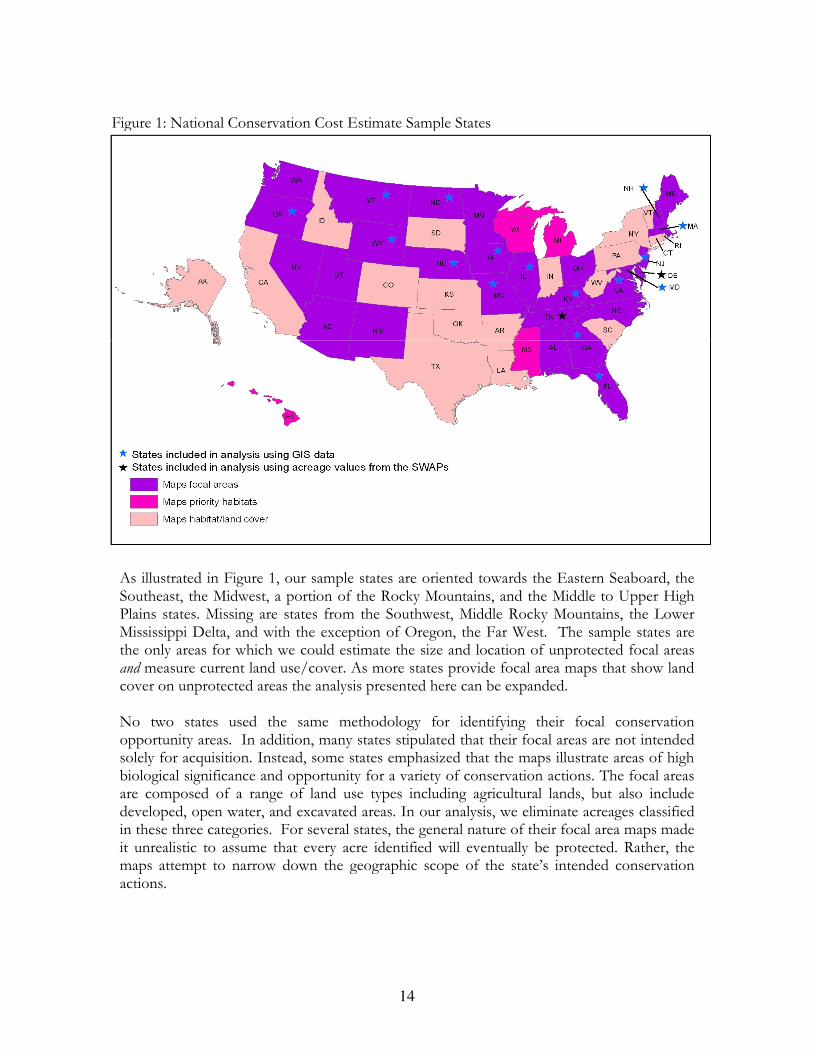
Figure 1: National Conservation Cost Estimate Sample States
As illustrated in Figure 1, our sample states are oriented towards the Eastern Seaboard, the Southeast, the Midwest, a portion of the Rocky Mountains, and the Middle to Upper High Plains states. Missing are states from the Southwest, Middle Rocky Mountains, the Lower Mississippi Delta, and with the exception of Oregon, the Far West. The sample states are the only areas for which we could estimate the size and location of unprotected focal areas and measure current land use/cover. As more states provide focal area maps that show land cover on unprotected areas the analysis presented here can be expanded. No two states used the same methodology for identifying their focal conservation opportunity areas. In addition, many states stipulated that their focal areas are not intended solely for acquisition. Instead, some states emphasized that the maps illustrate areas of high biological significance and opportunity for a variety of conservation actions. The focal areas are composed of a range of land use types including agricultural lands, but also include developed, open water, and excavated areas. In our analysis, we eliminate acreages classified in these three categories. For several states, the general nature of their focal area maps made it unrealistic to assume that every acre identified will eventually be protected. Rather, the maps attempt to narrow down the geographic scope of the state’s intended conservation actions.
15
2. Measuring Protected and Unprotected Focal Areas
As part of our measurement of protected and unprotected focal areas, we included a wide range of landownership types in the “protected” category. We were very inclusive of what we consider “protected” due to the fact that there was limited information to differentiate beyond basic land ownership types. Public lands, including Federal (but excluding Indian trust lands), state and locally owned lands were all considered protected. Land parcels in private conservation (owned or managed by a land trust) and conservation easement lands were considered protected. In states where we used GAP stewardship data, we considered any land parcel with a management status of 1-3 as protected. For many states, multiple data sets existed for public lands and conservation status. In these cases, we used the most recent information available, but also combined datasets to gain a more complete understanding of what lands were already being protected. For example, many states have both conservation stewardship data created under GAP and separate datasets for individual landownership types. Much of the GAP data was created circa 1998 and therefore may not accurately depict current landownership or conservation status. Some landownership layers may not include private conservation or easements. In such cases, we combined the appropriate datasets to get the broadest possible estimate of existing “protected” focal areas.
Public ownership does not necessarily imply conservation-oriented management. In cases where there was some question regarding a given landownership category, we calculated separate acreage values on the basis of including and excluding the land in question in the protected category. In all cases the difference was less 5% of the total focal area identified in the State Plans. We are therefore confident that our measures of protected versus unprotected areas are fairly accurate. However, performing an analysis using data that incorporates more detailed land management practices may produce results that exceed the 5% limit.
3. Identification of Land Type/Cover Land protection costs will vary according to the land cover type. In order to derive accurate cost estimates, we used the most recent land cover data available for each state. For many states this information came from United States Geographical Survey (USGS) land cover maps. Although the land cover categories in the USGS data represent general vegetation types, it was sufficient for our analyses. Some states have more detailed and updated land cover information. Where individual states produced their own more recent land cover maps, we used this information.
4. Overall Spatial Analysis The overall spatial analysis entailed overlaying datasets for the total and protected focal opportunity conservation areas using the Union function in ArcGIS 9.1. Using this overlay, polygon areas were estimated to derive protected and unprotected focal area acreages. These acreages were then exported to an Excel spreadsheet that summed all the acreage values for each category. Alternatively, some states created their focal conservation area layers in raster format. For these we extracted cells from the total focal areas layer using the protected areas
16
as a mask to create a new layer of only protected focal conservation areas. We then exported attribute tables from the original focal area layer and the new protected focal area layer to an Excel spreadsheet. Next, we estimated acreage based on multiplying the number of cells by the cell size (in either feet or meters) and converted the totals to acres. We then subtracted the acreage of protected focal areas from the total focal area acreage to estimate total unprotected focal acreage. Using the focal conservation and protected areas layers, we created a new layer of unprotected areas. We then extracted cells from the appropriate land cover layer using the unprotected focal conservation area layer as a mask. This allowed us to estimate the land cover characteristics of the remaining unprotected focal conservation areas. Once again, we exported the resulting attribute tables to Excel and estimated acreage based on multiplying the number of cells by the cell size (in either feet or meters depending on the layer) and converting the totals to acres.
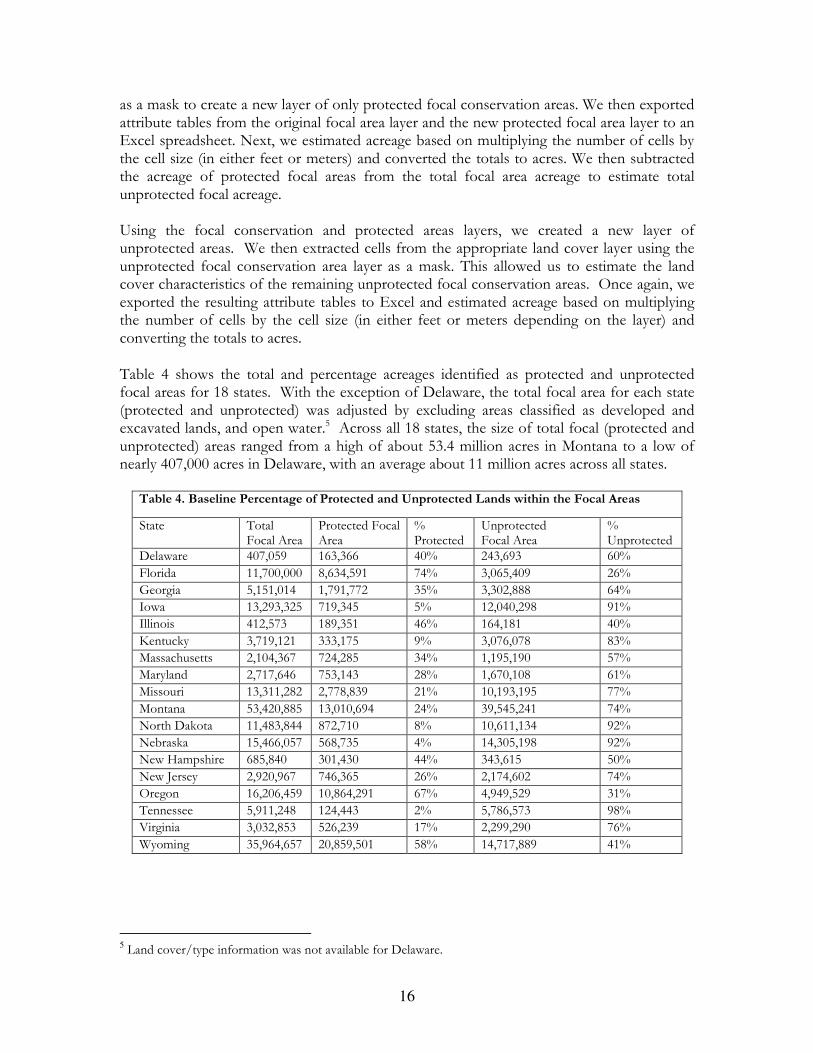
Table 4 shows the total and percentage acreages identified as protected and unprotected focal areas for 18 states. With the exception of Delaware, the total focal area for each state (protected and unprotected) was adjusted by excluding areas classified as developed and excavated lands, and open water.5 Across all 18 states, the size of total focal (protected and unprotected) areas ranged from a high of about 53.4 million acres in Montana to a low of nearly 407,000 acres in Delaware, with an average about 11 million acres across all states.
Table 4. Baseline Percentage of Protected and Unprotected Lands within the Focal Areas
State Total Focal Area
Protected Focal Area
% Protected
Unprotected Focal Area
% Unprotected
Delaware 407,059 163,366 40% 243,693 60%
Florida 11,700,000 8,634,591 74% 3,065,409 26%
Georgia 5,151,014 1,791,772 35% 3,302,888 64%
Iowa 13,293,325 719,345 5% 12,040,298 91%
Illinois 412,573 189,351 46% 164,181 40%
Kentucky 3,719,121 333,175 9% 3,076,078 83%
Massachusetts 2,104,367 724,285 34% 1,195,190 57%
Maryland 2,717,646 753,143 28% 1,670,108 61%
Missouri 13,311,282 2,778,839 21% 10,193,195 77%
Montana 53,420,885 13,010,694 24% 39,545,241 74%
North Dakota 11,483,844 872,710 8% 10,611,134 92%
Nebraska 15,466,057 568,735 4% 14,305,198 92%
New Hampshire 685,840 301,430 44% 343,615 50%
New Jersey 2,920,967 746,365 26% 2,174,602 74%
Oregon 16,206,459 10,864,291 67% 4,949,529 31%
Tennessee 5,911,248 124,443 2% 5,786,573 98%
Virginia 3,032,853 526,239 17% 2,299,290 76%
Wyoming 35,964,657 20,859,501 58% 14,717,889 41%
5 Land cover/type information was not available for Delaware.

17
The share of protected acreage to total focal area ranged from a high of about 74% in Florida to a low of 2% in Tennessee, and therefore these states also represent the extremes of unprotected focal area at 26% and 98%, respectively. With the exception of Florida, Illinois, Oregon and Wyoming, the ratio of unprotected to total focal area for the 18 states is well over 50%. Iowa, Tennessee, Nebraska and North Dakota have unprotected areas that exceed 90% of their total focal acreage. Across the 18 states, the estimated total focal area is nearly 197.9 million acres. About 129.7 million acres (or 66%) are currently categorized as unprotected. Table 4 serves as the basis for our Baseline Scenario to estimate the percentage of total US private land that would require protection. We calculated a Baseline national acreage using a two-step process. First, we calculated the share of unprotected focal area land for each state as a percentage of the total acreage of that state (Table 5). Across the 18 states, the Baseline Scenario estimate for the average unprotected focal area is 22% of total state acreage (Table 5). This is higher than the 12.5% estimate made by Shaffer et al. (2002), who used a much smaller sample and simpler approach to derive their estimate. The second step multiplied the total area of the continental US (about 1.9 billion acres) by the 22% Baseline Scenario, resulting in a national unprotected area of about 410.8 million acres. In the Baseline Scenario, the share of state land identified as unprotected ranged broadly from a low of less than 1% in Illinois to a high of 46% in New Jersey (Table 5). The total area identified as being in need of protection across the 18 states is estimated to be about 130 million acres.
Table 5. Baseline Unprotected Focal Areas in Sample States
State Unprotected acreage within Conservation Focal Areas
Total State Acreage
Unprotected area as % of the state
Delaware 243,693 1,251,200 19%
Florida 3,065,409 34,558,080 9%
Georgia 3,302,888 37,068,160 9%
Illinois 164,181 35,579,520 0.46%
Iowa 12,040,298 35,760,000 34%
Kentucky 3,076,078 25,428,480 12%
Massachusetts 1,195,190 5,016,320 24%
Maryland 1,670,108 6,256,000 27%
Missouri 10,193,195 44,094,720 23%
Montana 39,545,241 93,155,840 42%
Nebraska 14,305,198 49,201,920 29%
New Hampshire 343,615 5,740,160 6%
New Jersey 2,174,602 4,748,160 46%
North Dakota 10,611,134 44,156,160 24%
Oregon 4,949,529 61,441,920 8%
Tennessee 5,786,573 26,380,800 22%
Virginia 2,299,290 25,342,720 9%
Wyoming 14,717,889 62,147,200 24%
Total 129,684,110 597,372,360
Average 22%
18
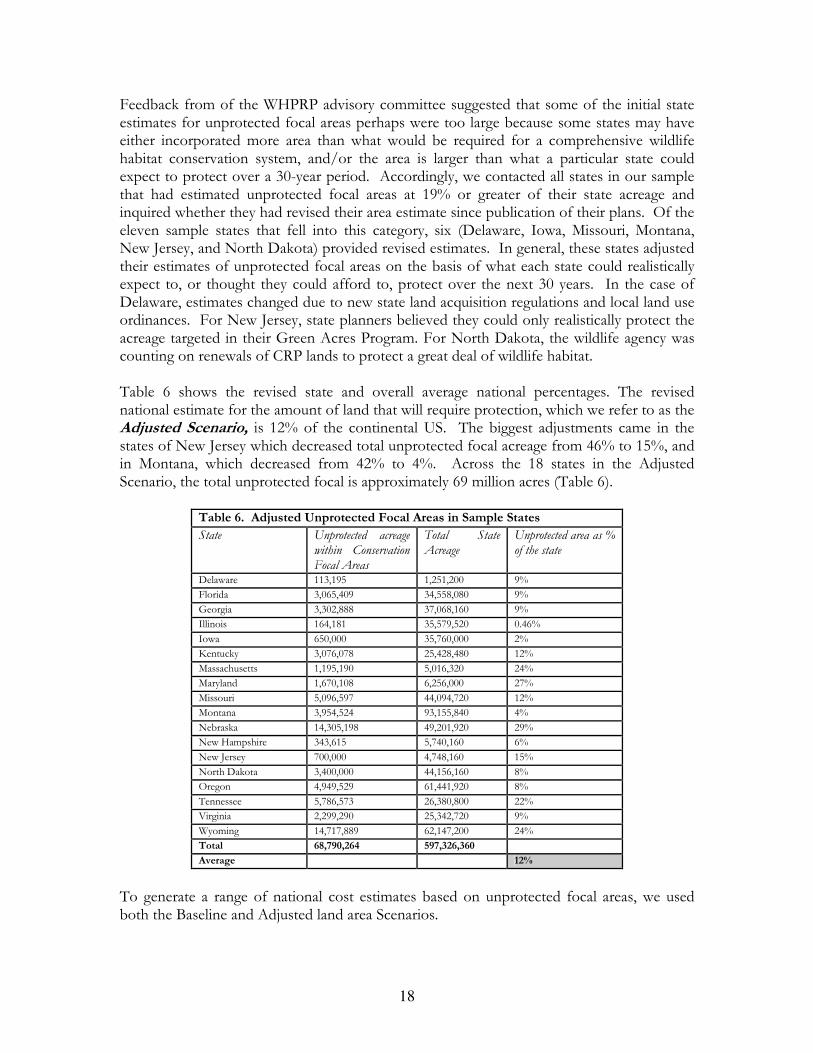
Feedback from of the WHPRP advisory committee suggested that some of the initial state estimates for unprotected focal areas perhaps were too large because some states may have either incorporated more area than what would be required for a comprehensive wildlife habitat conservation system, and/or the area is larger than what a particular state could expect to protect over a 30-year period. Accordingly, we contacted all states in our sample that had estimated unprotected focal areas at 19% or greater of their state acreage and inquired whether they had revised their area estimate since publication of their plans. Of the eleven sample states that fell into this category, six (Delaware, Iowa, Missouri, Montana, New Jersey, and North Dakota) provided revised estimates. In general, these states adjusted their estimates of unprotected focal areas on the basis of what each state could realistically expect to, or thought they could afford to, protect over the next 30 years. In the case of Delaware, estimates changed due to new state land acquisition regulations and local land use ordinances. For New Jersey, state planners believed they could only realistically protect the acreage targeted in their Green Acres Program. For North Dakota, the wildlife agency was counting on renewals of CRP lands to protect a great deal of wildlife habitat. Table 6 shows the revised state and overall average national percentages. The revised national estimate for the amount of land that will require protection, which we refer to as the Adjusted Scenario, is 12% of the continental US. The biggest adjustments came in the states of New Jersey which decreased total unprotected focal acreage from 46% to 15%, and in Montana, which decreased from 42% to 4%. Across the 18 states in the Adjusted Scenario, the total unprotected focal is approximately 69 million acres (Table 6).
Table 6. Adjusted Unprotected Focal Areas in Sample States
State Unprotected acreage within Conservation Focal Areas
Total State Acreage
Unprotected area as % of the state
Delaware 113,195 1,251,200 9%
Florida 3,065,409 34,558,080 9%
Georgia 3,302,888 37,068,160 9%
Illinois 164,181 35,579,520 0.46%
Iowa 650,000 35,760,000 2%
Kentucky 3,076,078 25,428,480 12%
Massachusetts 1,195,190 5,016,320 24%
Maryland 1,670,108 6,256,000 27%
Missouri 5,096,597 44,094,720 12%
Montana 3,954,524 93,155,840 4%
Nebraska 14,305,198 49,201,920 29%
New Hampshire 343,615 5,740,160 6%
New Jersey 700,000 4,748,160 15%
North Dakota 3,400,000 44,156,160 8%
Oregon 4,949,529 61,441,920 8%
Tennessee 5,786,573 26,380,800 22%
Virginia 2,299,290 25,342,720 9%
Wyoming 14,717,889 62,147,200 24%
Total 68,790,264 597,326,360
Average 12%
To generate a range of national cost estimates based on unprotected focal areas, we used both the Baseline and Adjusted land area Scenarios.
19
B. Estimation of National Protection, Transactions and Management Costs
In this section we describe the data and methods employed to estimate the national habitat protection, transactions and management costs reported in Table 1. National average costs were derived from annual state-level data for three primary protection strategies: fee-simple purchase, easements and rentals. When necessary, cost data were adjusted to reflect 2006 price levels. Cost estimates, with the exception of land rentals, are weighted by land use/cover category. A more detailed description of our cost estimation methods is found in the Final Technical Report. In addition to per-acre total cost estimates we provide estimates for stewardship/management costs associated with fee simple purchases and for transactions costs incurred in processing easements. For management cost data we employ estimates from the National Wildlife Refuge System which provides a comprehensive baseline for 2006 wildlife-related conservation activities and budgets. In contrast, limited information is available on the type and level of easement transactions costs either in absolute terms or as a percentage of the cost of purchasing development rights. We therefore rely mostly on cost information gathered from the land trust community, land managers and other key sources. The estimated costs presented here and in Table 1 represent national averages that were aggregated from state-level data for various land protection strategies. Thus, they reflect an array of ecological and economic conditions. These estimated costs aggregate various purchase, easement and rental programs (private, state, Federal) across several land types (grasslands, wetlands, productive agricultural and ranchland, forest land, etc). Therefore, for any particular geographical area (local or state), national averages could either be over- or underestimates. For decision makers at the local and state level a more precise analysis is recommended. The eventual allocation of public funds to protect lands identified in the State Plans should be based on actual cost at the local/state level. The results presented in this report are useful for informing policy makers about how much funding will be required for establishing a national habitat conservation system. 1. Fee-Simple Acquisition and Stewardship/Management Costs
a. Fee-Simple Acquisition Costs Fee simple acquisition cost estimates are based upon average private sector purchase costs of crop and pasture lands and public purchases of forestry, grassland and rangeland. Per-acre costs for cropland and pasture land reflect commercial transactions between private parties for continued production purposes. For forest land and grazing land, public fee simple purchases represent conservation acquisitions. For private commercial transactions involving crop land and pasture land we utilized state sales data compiled by the National Agricultural Statistics Service of the United States Department of Agriculture (NASS 2006). For fee-simple public purchases of forest land we utilized sales statistics from the 2006 Federal Forest Legacy Program (FLP). We also utilized multi-agency transactions compiled by the Trust for Public Land (TPL). The TPL fee-simple purchase data is organized into two categories, Federal and state acquisitions. Federal acquisition data include cost information from the National Park Service, the US Fish and

20
Wildlife Service and the Coastal and Estuarine Land Conservation Program. The TPL cost data for state-level acquisitions represents an average cost across several state agencies.6 Both the Federal and state TPL data includes acquisitions across a variety of land cover types. The 2005 TPL data were adjusted to reflect 2006 prices.7 Table 7 summarizes the overall average per acre costs and provides an estimate of an overall national un-weighted fee-simple purchase cost. Across all public and private buyers and land types, the national un-weighted average cost for fee-simple purchases is estimated at $1,713/acre (Table 7).
Table 7. Per Acre Average and Aggregate Un-Weighted Costs For Fee Simple Purchase Land Cover Type/ Data Source Average Cost ($2006/acre)
Private Crop Land $2,390
Private Pasture Land $1,000
Forest Legacy Program $1,352
Federal Purchases-TPL Data $ 914
State Purchases-TPL Data $2,909
Un-Weighted National Average $1,713
To obtain a more accurate national-level total cost estimate for fee-simple purchases we derived a weighted average cost for the Baseline and Adjusted Scenarios by taking into consideration the relative proportion of different land cover types. We calculated a weighted estimate by employing information from 17 states for which we had detailed land cover data within unprotected conservation focal opportunity areas, and applying the proportion of land use types from the sample to the lower forty-eight states. The first step in the weighting process was to identify the percentage of each land cover type in the 17 states’ unprotected focal areas. Across the 17 states in the Baseline Scenario, cropland accounted for 23.38% of total unprotected acreage and pastureland accounted for 5.58%. We employed a figure of 71.04% to represent all ‘Other” land types acquired by the FLP and by state and federal programs, as represented in the TPL data base.8 For the Baseline Scenario, we applied the percentage land cover values to estimate the total acreage of unprotected focal areas across the 17. In order to calculate weighted total costs for crop and pasture land we multiplied the total acres of each land use/cover type by their average cost per acre. For the “Other” category, we calculated the cost per acre by dividing the total acres acquired through all programs by the total costs of acquiring the land. We
6 For both Federal and state TPL fee-simple acquisition data it was necessary to drop certain states from the data base because some costs represented a purchase of an extremely small area for a very large sum of money, thereby causing what we term as the “parking lot effect”. For example, we deleted a National Park Service acquisition of about 3 acres for a cost of nearly $7,000/acre for a lot in Grand Teton National Park. 7 2005 values were multiplied by 1.03 to adjust for three percent annual consumer price inflation in 2006 compared to the previous year (Council of Economic Advisors 2007). 8 We combined these data sets because there was insufficient cost data on acquisitions for each of the non-agricultural land cover types. For example, although the FLP primarily acquires forest lands, we chose to incorporate FLP data into the “Other” category because many TPL acquisitions are also comprised of forest lands.
21
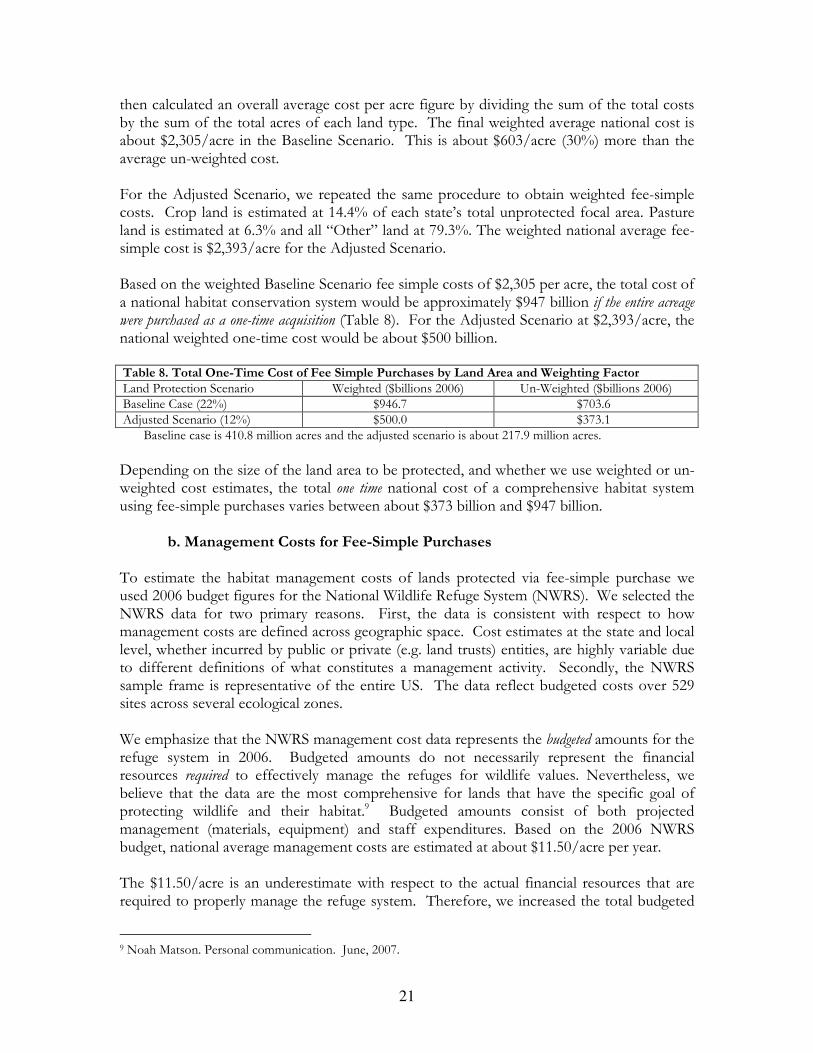
then calculated an overall average cost per acre figure by dividing the sum of the total costs by the sum of the total acres of each land type. The final weighted average national cost is about $2,305/acre in the Baseline Scenario. This is about $603/acre (30%) more than the average un-weighted cost. For the Adjusted Scenario, we repeated the same procedure to obtain weighted fee-simple costs. Crop land is estimated at 14.4% of each state’s total unprotected focal area. Pasture land is estimated at 6.3% and all “Other” land at 79.3%. The weighted national average fee-simple cost is $2,393/acre for the Adjusted Scenario. Based on the weighted Baseline Scenario fee simple costs of $2,305 per acre, the total cost of a national habitat conservation system would be approximately $947 billion if the entire acreage were purchased as a one-time acquisition (Table 8). For the Adjusted Scenario at $2,393/acre, the national weighted one-time cost would be about $500 billion. Table 8. Total One-Time Cost of Fee Simple Purchases by Land Area and Weighting Factor Land Protection Scenario Weighted ($billions 2006) Un-Weighted ($billions 2006) Baseline Case (22%) $946.7 $703.6 Adjusted Scenario (12%) $500.0 $373.1
Baseline case is 410.8 million acres and the adjusted scenario is about 217.9 million acres.
Depending on the size of the land area to be protected, and whether we use weighted or un-weighted cost estimates, the total one time national cost of a comprehensive habitat system using fee-simple purchases varies between about $373 billion and $947 billion.
b. Management Costs for Fee-Simple Purchases To estimate the habitat management costs of lands protected via fee-simple purchase we used 2006 budget figures for the National Wildlife Refuge System (NWRS). We selected the NWRS data for two primary reasons. First, the data is consistent with respect to how management costs are defined across geographic space. Cost estimates at the state and local level, whether incurred by public or private (e.g. land trusts) entities, are highly variable due to different definitions of what constitutes a management activity. Secondly, the NWRS sample frame is representative of the entire US. The data reflect budgeted costs over 529 sites across several ecological zones. We emphasize that the NWRS management cost data represents the budgeted amounts for the refuge system in 2006. Budgeted amounts do not necessarily represent the financial resources required to effectively manage the refuges for wildlife values. Nevertheless, we believe that the data are the most comprehensive for lands that have the specific goal of protecting wildlife and their habitat.9 Budgeted amounts consist of both projected management (materials, equipment) and staff expenditures. Based on the 2006 NWRS budget, national average management costs are estimated at about $11.50/acre per year. The $11.50/acre is an underestimate with respect to the actual financial resources that are required to properly manage the refuge system. Therefore, we increased the total budgeted
9 Noah Matson. Personal communication. June, 2007.

22
per-acre level by about 91%, as recommended in a report by the Cooperative Alliance for Refuge Enhancement (2007). With this adjustment, management costs increased to about $22.1/acre per year. 2. Conservation Easements Conservation easements usually entail the purchase of development rights that are acquired by either a public or private entity. Wildlife conservation easements stipulate that specific habitat values be protected by the landowner in exchange for payment. Private landowners are responsible for managing the land on which they sell an easement for biodiversity values. In calculating the total cost of a national habitat system using easements, we count the costs of purchasing development rights and add estimates for transactions costs. In estimating easement costs, we utilize information from public entities. Easement cost information from private land trusts or individual companies is extremely difficult to obtain. For public easement programs, we include cost data from Federal and state agencies across an array of land use types. For Federal and state conservation easement programs there are both mid-term (30-year) and permanent easement options to select from. For the purposes of this report, we assumed that 30-year easements could be considered permanent because the likelihood of development would be minimized. Still, it should be recognized for that for any non-permanent easement, landowners will revisit their decision at the time a particular easement period is about to expire and any decision to renew the easement will be based on the economic circumstances at that time.
a. Conservation Easement Purchase Costs A national habitat protection cost estimate using easements is based on data from four Federal easement programs and state-level easement information assembled by TPL. The four Federal programs include the Farm and Ranchland Protection Program (FRPP), the Wetland Reserve Program (WRP), the Grassland Reserve Program (GRP) and the Forest Legacy Program (FLP).10 Two of these programs, FRPP and WRP, are managed by the USDA Natural Resources Conservation Service. FLP is managed by the US Forest Service and GRP is jointly managed by NRCS, the Farm Services Administration (FSA) and the US Forest Service. Together, the four programs cover a variety of land use types across the continental US. The same procedures that were used in developing fee-simple purchase estimates were applied to easements. State cost estimates were adjusted to 2006 levels and aggregated to the national level. Estimates were weighted by land use type and cover. The weighted average easement cost was estimated at about $874/acre, which represents about 38% of the weighted Baseline fee-simple cost ($2,305/acre) and 36% of the weighted cost in the Adjusted Scenario ($2,393).
Based on an average overall weighted easement cost of $874/acre, the total one time national costs of protecting the Baseline Scenario would be about $359 billion if all conservation
10 Kathryn Conant. Personal communication. April, 2007.
23
lands were put under easement at today. The weighted Adjusted Scenario easement cost would be approximately $190.4 billion.
b. Easement Transactions Costs
Transactions costs are generally defined as those costs that are incurred in the process of selling and buying goods and services. In the case of habitat conservation easements, buyer transactions costs include expenses for surveys, appraisal, environmental assessments, title search and insurance, legal costs for creating easements, staff time, transfer taxes and recording and monitoring costs. In some cases, especially those acquisitions that involve public entities, transaction delays may also represent significant opportunity costs. The challenge with estimating buyer transactions costs is that they are rarely documented as separate expenditures. There are no centralized databases that systematically record these costs. To address this issue, we queried key informants that have experience in negotiating and completing easements.11 Across our sample, the average transaction cost is estimated at about $140/acre. This represents roughly 16% of the national weighted average per-acre cost of all easement programs combined ($874/acre). Thus, the total buyer cost for easements is estimated at about $1014/acre on average (weighted purchase of development rights plus transactions costs). The total one-time weighted easement and transactions costs range from $416 billion in the Baseline Scenario to about $221 billion in the Adjusted Scenario.
3. Land Rentals/Leases For land rental/lease costs we assume that the landowner receiving the rental/lease payment is responsible for maintaining the habitat values of the land. We obtained land rental data from two main sources: the USDA National Agricultural Statistics Service (2006) and the USDA/NRCS for the Conservation Reserve and Grassland Reserve Programs. The NASS data reflects the price of leasing private crop and pastureland for production purposes. Depending on the state, commercial rents for cropland could be higher or lower than in the case where land is rented for conservation purposes. As with the national fee-simple purchase and easement cost estimates, national private and public costs associated with land rentals represent 2006 payment levels that are aggregated over all states and land use categories. The national average land rental cost is estimated at $36/acre per year in 2006. Comprehensive data on the actual land areas that were rented under each type of public or private program is not available. Thus, a weighted average national rental rate based on land cover type could not be estimated. The total un-weighted cost in the first year of a comprehensive national habitat system, if it were to all be rented at once, would be approximately $14.7 billion in the Baseline Scenario and $7.8 billion for the Adjusted Scenario. However, these are only the first year costs. Because rentals are annual, costs would continue to be incurred indefinitely and at higher levels due to assumed increases in rental rates over time.
11 Transactions cost information was obtained from public (both Federal and state) agencies holding easements, as well as private entities such as land trusts and habitat mitigation companies.

24
In contrast to the management costs that were included as part of the total costs of fee-simple purchases and the transactions costs calculated for easements, we do not account for transactions or management costs associated with land rentals. We assume that management costs are included in the rental payment and that transaction costs would be quite low for rental of commercial crop and pasture land and/or would be incorporated as part of the rental rate. In the case of CRP and GRP, both programs do involve some transactions costs on the part of the USDA (Farm Services Administration and the Natural Resources Conservation Service) and landowners. USDA agencies do not track administrative or other types of transactions costs in such a way as to allocate those costs to the total of protected acres. We know that landowners spend time and resources applying to CRP and GRP and therefore do incur some level of transactions costs, but we do not have the data to determine their extent. Therefore, the cost estimates for the land rental protection strategy may be considered a low end estimate. Summary of Methodological Approach The following simplified list of steps summarizes our methodological approach to this study. All steps were applied equally to each of the land protection strategies, thereby guaranteeing the comparability of per-acre and cumulative cost results across all strategies. 1. For each of the states in our sample, we estimated per acre fee-simple, easement and rental costs by averaging all state, Federal and private sector cost data by type of protection strategy and by land type. 2. Average per-acre costs were estimated for each strategy by state across all programs, by land cover type, and were weighted by the total acreage of each land cover type. 3. All cost data were adjusted to reflect 2006 price levels. 4. The average of state prices for each protection strategy across was used to calculate the cost of a national habitat conservation system. 5. The amount of land needed for conservation (for both the 22% and the 12% land base scenarios) was divided into 30-year increments. That is, 1/30th of the total land area would be added to the conservation estate each year for 30 years. We assumed an annual 3% increase in the real cost of land irrespective of whether it was protected through fee-simple, easements or rentals in order to account for real price increases caused by the growing relative scarcity of land. 6. Management costs were added to fee-simple purchase costs on an annual basis, and were recurrent for each year on previously acquired land. That is, management costs on 1/30th of the conservation estate acquired in year one also were incurred in years, 2, 3, etc. in addition to the management costs on lands newly purchased in those years. 7. One-time transactions costs were added to the costs of new easements in each of the 30 years of incremental easement purchases. 8. Annual rental costs were treated like management costs. Because land is rented on a year to year basis, land that was rented in year 1 would also have to be rented in years 2-30. 9. The national costs for each protection scenario represent “cumulative costs” for the 30 and 40 year periods, respectively.

25
V. Deliverables
This Project Completion Report constitutes a summary of the methodology and findings presented in a more in-depth Final Technical Report.
The forthcoming deliverables associated with this project will consist of the following:
A. The Final Completion Report will be posted on the websites of the NCSE/WHPRP program and on Defenders Conservation Economics website.
B. The Final Technical Report (with Appendices that detail the disaggregated cost data utilized to provide a national cost estimate) will be completed in the form of a Conservation Economics White Paper and will be made available in hard copy, electronic copy, and posted on the NCSE/WHPRP and Defenders of Wildlife websites. Expected completion date is November 2008.
C. A White Paper on the issue of price endogenity affecting cost estimates of implementing the State Plans will be completed by December 31, 2008.
D. PowerPoint presentations will be submitted to NCSE/WHPRP as they are given to various public audiences. Target audiences for outreach with respect to research findings will include public and private land conservation agencies and organizations, the scientific community involved in land conservation, wildlife habitat conservation policy makers and general audiences, as suitable. Thus far, the general results of this study have been presented to Defenders staff, to senior staff of the Association of Fish and Wildlife Agencies, to national conservation groups and at a plenary session at the annual meeting of the Association of Fish and Wildlife Agencies.
E. Defenders of Wildlife will provide a synopsis of the cost findings in the form of an outreach document and fact sheets to public and private policy makers, land use planners and researchers that work in the realm wildlife habitat conservation.
F. The results of the cost study will be summarized and submitted to a peer-reviewed journal for publication.

26
VI. References Casey, F., S. Vickerman, C. Hummon, and B. Taylor. 2006. Incentives for Biodiversity
Conservation: An Ecological and Economic Assessment. Defenders of Wildlife. Washington DC. Casey, F. 2005. “Contours of Conservation Finance in the United States at the Turn of the
Twenty-first Century.” in Levitt, J. (ed). From Walden to Wall Street: Frontiers of Conservation Finance. Island Press. Washington D.C.
Cooperative Alliance for Refuge Enhancement (CARE). 2007. Restoring America's Wildlife Legacy 2007. Washington, DC.
Council of Economic Advisors. 2007. Economic Indicators, May 2007. Government Printing Office. Washington, DC.
Hummon, L. and F. Casey. 2004. Status and Trends in Federal Resource Conservation Incentive Programs: 1996-2001. Conservation Economics Program Working Paper 1. Defenders of Wildlife. Washington D.C.
Kroeger, T. and F. Casey. 2007. An assessment of market-based approaches for providing ecosystem services on agricultural lands. Ecological Economics 64(2):321-332.
Lerner, J., B. Cochran, and J. Michalak. 2006. Conservation Across the Landscape: A Review of the State Wildlife Action Plans. Defenders of Wildlife. Washington DC.
Lerner, J., J. Mackey, and F. Casey. 2006. What’s in Noah’s Wallet? Land Conservation Spending in the U.S. BioScience 57(5):419-423.
Shaffer, M., J. Scott, and F. Casey. 2002. Noah’s Options: Initial Cost Estimates of a National System of Habitat Conservation Areas in the United States. BioScience 52(5): 439-443.
U.S. Department of Agriculture. National Agricultural Statistics Service. 2006. Land Values and Cash Rents 2006 Summary. August 2006. Washington DC.
U.S. Environmental Protection Agency. 2000. Guidelines for Preparing Economic Analyses. Report, September 2000. EPA 240-R-00-003. Washington, DC.
U.S. Office of Management and Budget (OMB). 1992. OMB Circular No. A-94. Washington DC.
Weitzman, Martin L. 1994. On the “environmental” discount rate. Journal of Environmental Economics and Management 26(2):200-209.
Weitzman, Martin L. 2001. Gamma discounting. American Economic Review 91(1):261-271.

27
VII. APPENDICES
28
Appendix I. List of Research Contacts Andrew du Moulin – Trust for Public Land Mary Bruce Alford – Trust for Public Land Andrew James – Arkansas Natural Resources Conservation Service (NRCS) Alan Forkey – California NRCS Gary Finstad – Colorado NRCS Sally Kepfer – Delaware NRCS Ken Murray – Florida NRCS David Lamm – Georgia NRCS Bob Bartholomew – Idaho NRCS Dave Hiatt – Illinois NRCS Monica Monk – Iowa NRCS John Skerrit – Iowa NRCS Lynn Thurlow – Kansas NRCS Jack Kuhn – Kentucky NRCS Ronald Marcantel – Louisiana NRCS Beth Shreier – Massachusetts NRCS Jim Marshall – Michigan NRCS Harold Deckerd – Missouri NRCS Yancy Magee- Mississippi NRCS Carrie Mosley – Montana NRCS Randy Epperson – Nebraska NRCS Pam Schell- North Dakota NRCS Sandra Fife – Oregon NRCS Martha Joseph – Pennsylvania NRCS Glenn Sandifer – South Carolina NRCS Sara Thompson – South Dakota NRCS Mike Zeman – Tennessee NRCS Claude Ross – Texas NRCS Karen Fullen – Utah NRCS Barry Harris – Virginia NRCS Heather Wetzstein – Vermont NRCS David Brown – Washington NRCS Alison Pena – Wisconsin NRCS Carole Jett – Washington DC NRCS Richard Pritzlaff – Biophilia Foundation Derek Johnson – Oregon Nature Conservancy Eric Banks – Arizona NRCS Bowen Blair – Trust for Public Land Oregon Astor Boozer – NRCS Washington, DC John Gregory – Tennessee Wildlife Resources Agency Walter Cartwright – Alabama Forestry Commission Skip Hyberg – Farm Services Administration Washington DC Molly Docherty – Maine Beginning with Habitat Raquel Goodrich – Maine Beginning with Habitat Chris Canalos – Georgia Department of Natural Resources
29
Becky Gwynne – Virginia Department of Game and Inland Fisheries Kendell Ryan – Virginia Department of Game and Inland Fisheries Sandra Johnson – North Dakota Game and Fish Department James Renn – Illinois Department of Natural Resources Mark Cramer – Kentucky Department of Fish and Wildlife Resources Keith Wethington – Kentucky Department of Fish and Wildlife Resource Scott Covington – Wyoming Game and Fish Department Keith Fletcher – Maine Nature Conservancy Jeanette Jones – Tennessee Wildlife Resources Agency Jeff Lerner- Defenders of Wildlife Washington, DC Heather Rorer – Defenders of Wildlife Washington, DC Noah Matson – Defenders of Wildlife Washington, DC Noah Kahn – Defenders of Wildlife Washington, DC Bruce Taylor – Defenders of Wildlife West Linn, Oregon Ron Fowler – U.S. Fish and Wildlife Service Arlington, VA Steve Farrell – U.S. Fish and Wildlife Service Arlington, VA Robin Heard – NRCS Washington, DC Robert Glennon – NRCS Washington, DC Doug Harr – Iowa Department of Natural Resources Monica Ulman – Iowa Department of Natural Resource Dennis Figg – Missouri Department of Conservation Jennifer Soper – Massachusetts Executive Office of Energy and Environmental Affairs Charles Vickers – Delaware Department of Natural Resources and Environmental Control Matthew Chesser – Delaware Department of Natural Resources and Environmental Control Curt Soper – Georgia Land Conservation Program Sarah Richardson – Virginia Department of Conservation and Recreation Dan Zekor – Missouri Department of Conservation Robyn Hilliard – Missouri Department of Conservation Judy Davenport – Maryland Department of Natural Resources Eric Knudsen – New Jersey Department of Environmental Protection Brent Frazier – Kentucky Department of Agriculture Holly Green – New Hampshire Department of Environmental Services Hope Gruzlovic – New Jersey Department of Agriculture John Hall – Maryland Department of Natural Resources Hazel Linn – Georgia Department of Natural Resources Tom Hinz – Montana Wetlands Legacy Partnership Milton Melendez – Delaware Department of Agriculture Michelle Haefele – The Wilderness Society Tony Puga – NRCS, Washington DC Scott Shimmin – National Agricultural Statistics Service Washington, DC Kathryn Conant – US Forest Service Washington, DC Jody Latimer – Arizona State Land Department Penny Isom – Florida Department of Forestry Patty Cate – Oregon Department of Forestry Hugh Archer – Kentucky Natural Lands Trust Bob Wilber – Massachusetts Audubon Society Glenn Pauley – Wyoming Stock Growers Agricultural Land Trust Nick Williams – Maryland Department of Natural Resources
30
Frank McIntosh – Georgia Land Trust Steffney Thompson – Oconee River Land Trust Bill Greenleaf – Capital Region Land Conservancy Tom Dwyer – Ducks Unlimited Washington Steve Dyke – North Dakota Game and Fish Department Glenn Therres – Maryland Department of Natural Resources Scott Story – Montana Fish, Wildlife, and Parks Karen Bennett – Delaware Department of Natural Resources and Environmental Control Lois Loop – Oregon Farm Service Agency Petra Royston – Florida Nature Conservancy Don Neumann – York Water District, Maine Candace Weymouth – Maine FSA Tim Glidden – Maine State Planning Office Fran Recht – Central Coast Land Conservancy, Oregon Ken Bierly – Oregon Watershed Enhancement Board Anne Davidson – Gap Analysis Program Moscow, Idaho Mike Tedder – Florida Department of Environmental Protection Greg Brock – Florida Department of Environmental Protection Paula Allen – Florida Department of Environmental Protection.

31
Appendix II. List of Forthcoming Publications and Presentations
1. Final Technical Report on “A Cost Estimate for a Comprehensive National Habitat Cost System”. Submission expected by November 30th, 2008 to the National Council on Science and the Environment. The Final Technical Report will also be issued as a Defenders of Wildlife Conservation Economics Working Paper.
2. A White Paper on the issue of price endogenity and impacts on land prices will be issued by December 31, 2008.
3. Fact Sheets Summarizing the Findings of the Study. To be completed by December 15, 2008 and submitted to the National Council on Science and the Environment.
4. Peer-reviewed journal article. To be submitted by January/February 2009. Final version will be submitted to the National Council on Science and the Environment.
5. Presentations of to conservation groups, public agencies, and other interested parties will continue at least through March of 2009. Copies of power point presentations and other relevant materials will be made available to the NCSE.