the cost of capital for heat distribution and supply
TRANSCRIPT

Oxera Draft for Comment: Strictly Confidential i
The cost of capital for heat distribution and supply
Final report
Prepared for Energiekamer
September 18th 2009

Oxera Consulting Ltd is registered in England No. 2589629 and in Belgium No. 0883.432.547. Registered offices at Park Central, 40/41 Park End Street, Oxford, OX1 1JD, UK, and Stephanie Square Centre, Avenue Louise 65, Box 11, 1050 Brussels, Belgium. Although every effort has been made to ensure the accuracy of the material and the integrity of the analysis presented herein, the Company accepts no liability for any actions taken on the basis of its contents.
Oxera Consulting Ltd is not licensed in the conduct of investment business as defined in the Financial Services and Markets Act 2000. Anyone considering a specific investment should consult their own broker or other investment adviser. The Company accepts no liability for any specific investment decision, which must be at the investor’s own risk.
© Oxera, 2009. All rights reserved. Except for the quotation of short passages for the purposes of criticism or review, no part may be used or reproduced without permission.

Oxera The cost of capital for heat distribution and supply
Contents
1 Introduction and executive summary 1
2 Risk exposure of heat networks 4 2.1 Nature of heat networks 5 2.2 Risk exposure 5 2.3 Conclusion 7
3 Estimating the cost of equity 9 3.1 Beta estimation 10 3.2 Cost of equity estimates 17
4 Gearing and debt premium 20 4.1 Target credit rating 20 4.2 Gearing 23 4.3 Debt premium 27
5 Cost of capital estimates 32
6 Cross-checks for the cost of capital 34
7 Conclusions 37
A1 Methodology for assessing asymmetric risk 38 A1.1 Rationale for using real options framework 38 A1.2 Proposed analytical framework 40 A1.3 Estimation methodology 42
A2 Asymmetric risk: technical details 46 A2.1 Estimating MP 46 A2.2 Estimating RP 47
A3 Statistical tests of beta estimates 48
Oxera The cost of capital for heat distribution and supply
List of tables Table 1.1 Cost of capital estimates for heat networks 2 Table 2.1 Risk exposure of DHNs in comparison with energy networks 7 Table 3.1 EK estimation methodology for the beta 10 Table 3.2 Heat network comparators 11 Table 3.3 Regulated comparators: sample 12 Table 3.4 Multi-utility comparators: sample 13 Table 3.5 Sample of regulated or partially regulated companies exposed to a degree of
demand risk 14 Table 3.6 Regulated network comparators 15 Table 3.7 Local multi-utility comparators 16 Table 3.8 Sample of regulated or partially regulated companies exposed to a degree of
demand risk 16 Table 3.9 Cost of equity estimates 19 Table 4.1 Summary of regulatory precedent: gearing 26 Table 4.2 Sources of evidence on gearing 27 Table 4.3 EK estimation methodology for the debt premium 28 Table 4.4 Spreads on a sample of corporate bonds—regulated networks (bp) 30 Table 4.5 Conclusions—debt premium 31 Table 5.1 Inflation range for the assessment of the WACC 32 Table 5.2 Illustrative WACC estimates at 0% gearing 33 Table 5.3 Cost of capital estimates for heat networks 33 Table 6.1 Discount rates (%) used by Nuon to calculate accounting impairments (pre-tax
nominal) 34 Table A3.1 Beta estimates for groups of comparators (median) 49
List of figures Figure 2.1 Assessing the risk borne by shareholders in heat distribution and supply 4 Figure 3.1 Yield on ten-year Dutch sovereign and trailing averages (%) 18 Figure 4.1 Bond issuances by European companies by rating, all sectors (€ billion) 21 Figure 4.2 Bond issuances by European companies by rating, energy and utilities (€
billion) 21 Figure 4.3 S&P issuer rating of comparable network companies: sample of regulated
networks 22 Figure 4.4 S&P issuer rating of comparable companies: samples multi-utilities and
companies exposed to a degree of demand risk 23 Figure 4.5 Gearing levels (book value) for A-rated comparator companies 25 Figure 4.6 Gearing levels (market value) for A-rated comparator companies 25 Figure 4.7 Yields and spreads on EUR-denominated ten-year corporate bond indices
(BBB to AA ratings) 29 Figure 4.8 Spreads on EUR-denominated ten-year corporate bond indices (A rating) and
trailing averages (bp) 29 Figure 6.1 Discount rates used by A2A for different business units 35 Figure 6.2 Using returns on hybrid capital to estimate the cost of equity for heat projects
(illustration) 36 Figure A1.1 Effect of price capping on expected returns 39 Figure A1.2 Illustration of pay-off for constant RP, uncorrelated to gas prices 39 Figure A1.3 Illustration of pay-off for variable RP, with a degree of correlation to gas
prices 40 Figure A1.4 Valuation of the cap on price 41 Figure A1.5 Correlation between RP and MP 42

Oxera The cost of capital for heat distribution and supply
1
1 Introduction and executive summary
Energiekamer (EK) has asked Oxera to estimate the cost of capital for heat distribution and supply activities in the Netherlands. This parameter is needed to set ‘reasonable prices’ for heat under the new regulatory framework for heat distribution and supply. This report provides a description of the methodology used, and the results of the analysis.
Because very few companies finance their district heating activities on a stand-alone basis (in the Netherlands or elsewhere), it is not possible to directly observe or estimate the returns required by investors for this business. Under these circumstances, the estimation of the cost of capital for district heating must, necessarily, rely on more indirect evidence, based on a comparison between the risk profile of district heating and those of other segments of the utilities industry for which market data is available.
In many respects, the business profiles of heat businesses are comparable to those of other regulated utilities, such as energy and water networks. Their activity involves significant fixed costs, they have significant monopoly power, they provide essential services, and their prices are regulated.
Unlike energy networks, however, heat businesses include a supply component, involving the purchasing and reselling of a commodity—ie, heat. In and by itself, this characteristic may entail a different level of risk in comparison with pure infrastructure activities. Under the proposed cost-plus regulatory regime, however, regulated prices will frequently be readjusted to cover costs. Under this framework, the business risk attached to the supply function is essentially borne by customers, not companies.
For these reasons, it is legitimate to compare heat businesses in the Netherlands with traditional regulated utilities, and this report draws largely on evidence from such companies to estimate the cost of capital for heat distribution and supply.
There is, however, one potential aspect of the proposed regulatory model that might not be fully reflected in this traditional utility model. Under the proposed framework, district heating companies are only allowed to charge ‘reasonable prices’ (which cover each project’s costs) insofar as these do not exceed ‘maximum prices’ (which approximate the cost of heating using individual gas boilers). This regulatory mechanism might introduce a degree of asymmetry into the risk profile of district heating projects: on the one hand, project sponsors may not be able to earn more than the rate of return allowed in reasonable prices; but on the other hand, they may face a risk of losses if the maximum price cap takes effect.
This potential effect of the regulatory regime has been identified by the main stakeholders, and a number of ‘safety nets’ are being considered to mitigate its financial implications. These mitigating factors include: a mechanism allowing project sponsors to pool the costs and revenues of their different projects; a system of subsidies to support uneconomic projects; various options for profiling the depreciation of the asset base in the calculation of reasonable prices; and a mechanism for carrying forward potential losses.
If these measures are implemented, and if they are effective in mitigating the risk of losses, then it remains legitimate to assess the cost of capital for heat projects by reference to evidence from regulated networks. If, however, the regulatory regime beds down in a situation in which project sponsors are left to bear a significant risk of losses, then it might be appropriate to recognise the corresponding risk in the allowed return.
A possible approach to assessing the corresponding uplift to the rate of return is to use a real options framework. The basic rationale for this approach is as follows: when making an
Oxera The cost of capital for heat distribution and supply
2
irreversible investment in a DHN, a project sponsor is exposed to the risk that the cost of gas heating (the maximum price) will fall below the cost of district heating (the reasonable price) in the area covered by the project; consumers, on the other hand, do not face the same exposure to risk—if district heating is more competitive than gas heating, consumers will pay the cost of district heating, but if gas heating becomes more competitive, they will pay the cost of gas heating.
Oxera has outlined a methodology for implementing this approach in the context of heat distribution and supply in the Netherlands (see Appendix 1). While this approach seems particularly suitable for the regulatory and business environment under consideration, it is also data intensive. Because all the parameters of the price control are not known at present, it has not been possible to carry out this approach with a suitable degree of accuracy at this stage in the process.
An alternative approach to evaluating the risk associated with the maximum price cap is to enlarge the sample of comparator companies used for the estimation of WACC parameters to include those segments of the utilities sector exposed to a degree of demand and switching risk. This approach necessarily involves a degree of judgement, but it does provide an informed estimate of required returns for utility companies that face similar business and regulatory constraints to heat networks.
For these reasons, a comparison with regulated or partially regulated companies that are exposed to a degree of demand risk is used to provide a different but complementary insight into the risk profile of district heating networks. These companies have different cost structures and business profiles to heat networks, but, to the extent that heat networks are subject to a degree of demand risk, they share an important characteristic with these networks insofar as they are, although regulated, nonetheless exposed to a degree of demand risk.
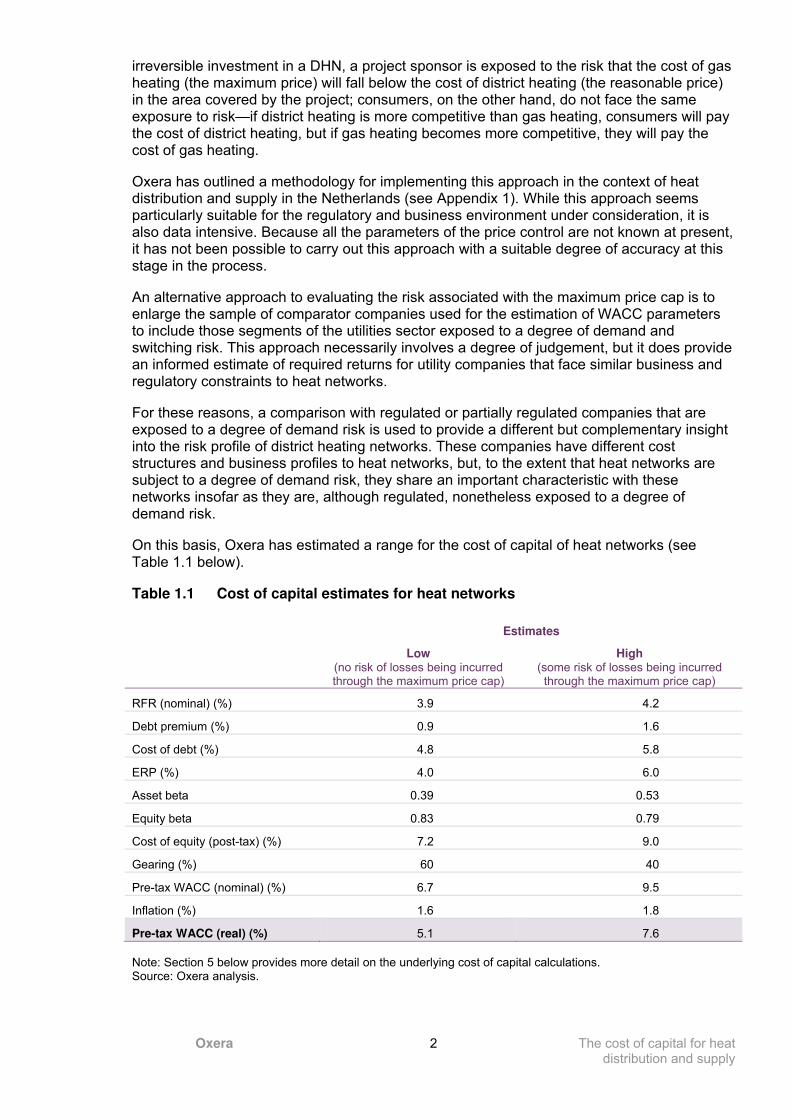
On this basis, Oxera has estimated a range for the cost of capital of heat networks (see Table 1.1 below).
Table 1.1 Cost of capital estimates for heat networks
Estimates
Low (no risk of losses being incurred through the maximum price cap)
High (some risk of losses being incurred through the maximum price cap)
RFR (nominal) (%) 3.9 4.2
Debt premium (%) 0.9 1.6
Cost of debt (%) 4.8 5.8
ERP (%) 4.0 6.0
Asset beta 0.39 0.53
Equity beta 0.83 0.79
Cost of equity (post-tax) (%) 7.2 9.0
Gearing (%) 60 40
Pre-tax WACC (nominal) (%) 6.7 9.5
Inflation (%) 1.6 1.8
Pre-tax WACC (real) (%) 5.1 7.6
Note: Section 5 below provides more detail on the underlying cost of capital calculations. Source: Oxera analysis.

Oxera The cost of capital for heat distribution and supply
3
The low end of the range represents an estimate of the WACC for district heating networks, whereby the various safety nets considered fully mitigate the risk of losses incurred through the maximum price cap. In contrast, the high end of the range represents a plausible estimate of the WACC for this business, whereby the regulatory framework leaves a substantial risk of under-recovery for project sponsors.

Oxera The cost of capital for heat distribution and supply
4
2 Risk exposure of heat networks
District heating networks rely on network infrastructure to distribute and supply heat to their consumers. They have several features in common with traditional utility networks: they are generally infrastructure-based businesses; they provide an essential service; they have monopoly power; and they are price-regulated.
In principle, the most appropriate approach to estimating the cost of capital for a given business is to measure market returns on securities issued by companies that are involved exclusively or primarily in the business under consideration and subject to similar regulatory environments (‘pure-play’ comparators).
However, very few DHNs finance their activity on a stand-alone basis. Historically, most district heating systems have been developed by municipalities or by integrated energy groups. As a consequence, very few companies meet the two necessary criteria of both having some traded securities issued and having a substantial share of their business in heat distribution and supply.1
To overcome the paucity of ‘direct’ market information for DHNs, it is necessary to identify ‘indirect’ comparators—ie, companies that have a risk profile comparable to that of DHNs.
For the purpose of estimating the cost of capital, the relevant risk exposure is the entirety of risk that a company faces. Therefore, when comparing the risk exposure of heat networks and utilities, it is important to take into account both the underlying business risk as well as the mitigating or magnifying effects of the regulatory regime on risk exposure (see Figure 2.1). For instance, to the extent that there is any risk, a company’s exposure may be mitigated by the structure of the regulatory regime.
Figure 2.1 Assessing the risk borne by shareholders in heat distribution and supply
Source: Oxera.
The remainder of this section is structured as follows:
– the nature of heat networks is presented in section 2.1, along with a discussion of their similarities to network utilities;
– section 2.2 analyses the relative risk exposure of heat networks in comparison with network utilities, including the effects of the proposed regulatory measures;
– section 2.3 concludes.
1 Appendix 1 lists some pure-play comparators, most of which were either unlisted a few years ago or had a very illiquid stock.
What are the
underlying business
risks of district heating?
How does the price
control regime
(reasonable prices
and maximum
prices) allocate
these risks between
customers and
shareholders?
How do the other
features of the
regulatory regime
(pooling and subsidy
mechanisms)
mitigate these risks?
What is the residual
risk borne by
shareholders?

Oxera The cost of capital for heat distribution and supply
5
2.1 Nature of heat networks
This section reviews the nature of heat networks, and compares it to network utilities wherever applicable.
District heating networks buy heat centrally and distribute it as hot water through their local network of pipes. Heat networks are typically organised as independent local networks, distributing heat to either whole cities or smaller blocks of apartments or houses. Consumers consist mainly of households and, to a smaller extent, small businesses.
Once a heat network is installed, consumers cannot, in practice, switch to gas heating. The type of network constructed in a given residential or commercial development is decided at the stage of urban planning, at which point it becomes part of the real-estate complex. This indicates that heat networks enjoy a degree of monopoly power once they have been constructed.
As for water and energy, provision of heat is an essential service. Therefore, as in the case for the regulation of energy and water, the regulation for heat networks is designed to ensure that the providers of heat network assets can operate, maintain and finance these assets. A regulatory framework is currently being designed for heat networks. The proposed regime includes an allowance for cost-based prices (the reasonable price), which provides a significant buffer against business risk.
Although heat networks are predominantly a network business, their operations involve an element of supply of the commodity of heat. Heat networks distribute heat locally by purchasing it directly from heat generators and re-selling it mainly to residential and small industrial buildings. However, as discussed in the next section, the implications of this factor for risk exposure are mitigated by the regulatory regime for heat networks.
In summary, heat networks are largely comparable to regulated utilities, which enjoy a certain degree of monopoly power and which will soon be subject to regulation. Other types of networks, such as energy or water networks, have similar characteristics. These can be used as the closest set of indirect comparators, given that their risk exposure is relatively similar. This is discussed in the next section.
2.2 Risk exposure
This sub-section discusses the relative risk exposure of heat networks in comparison with regulated network utilities.
The distribution of heat involves some risk factors that are similar to those faced by network utilities (eg, energy or water distribution).
– Both types of networks are exposed to a similar degree of construction and operating cost risk, as input price fluctuations may occur regardless of the type of network constructed or operated.
– Exposure to take-up risk is similar for heat and gas distribution networks, as both types of networks may face variations in the number of connections established once the network is constructed.
Other factors imply differences in the relative risk exposure of heat networks and network utilities. These are discussed next.
Competition, monopoly power and maximum price Gas heating, as an alternative to heat provided by heat networks, can be considered as potential competition for DHNs, even if it is relatively difficult for consumers to switch between the two, at least in the short to medium term.

Oxera The cost of capital for heat distribution and supply
6
The structure of the proposed regulatory regime mimics, to a certain extent, the competitive pressures that would occur in an unregulated environment in which customers could switch between suppliers and technologies depending on their respective competitiveness. However, it should be noted that companies facing demand risk have both upside and downside potential, which is not the case with a maximum price cap.
The imposition of a maximum price cap ensures that consumers never pay more than the corresponding price of gas heating. If the unit costs of a project increase (or if gas prices decrease), then shareholders might not be able to recover the cost of their investment, due to the cap on the price they are able to charge for the provision of heat. This effectively exposes shareholders to an asymmetric risk: at best, they would recover their investment, but on average they would under-recover.
However, the regulatory regime includes a number of dispositions intended to minimise the risks (or the consequences) of the reasonable price (RP) exceeding the maximum price (MP) (including flexible depreciation profiles, loss carry forward mechanisms, and pooling mechanisms). The extent to which these mechanisms protect heat networks from the asymmetric risk will depend on the final details of the proposed regulatory regime.
Regulatory regime features The regulatory regime is centred on cost-based reasonable prices. This structure provides a significant buffer against construction and operating cost risk. If reasonable prices are effectively readjusted at each review to reflect observed costs, then shareholders bear only those risks associated with changes in costs and demand between reviews. In contrast, European network utilities are regulated on a price-cap basis and also face efficiency incentives. Such a framework does not eliminate the exposure to cost risk.
The relatively short duration of the price control period, and the frequent re-setting of prices, also reduce the risk exposure for heat networks in comparison with other regulated utilities.2 Moreover, the absence of an efficiency check on companies’ costs would seem to make the regulatory regime for heat less risky than that for energy networks.
Customer base A large share of a heat network’s customer base is composed of households, while a large proportion of an energy network’s customers will be industrial businesses. Heat consumption by households is less sensitive to economic shocks; as a result, heat networks may face lower demand volatility.
Scope of activities The operations of heat networks involve a procurement and a re-sale element—ie, the supply of heat. In isolation, this would tend to increase the risk exposure of heat networks in comparison with, for instance, energy networks.
However, it is important not to overstate this risk differential, as energy networks may also face a degree of exposure to commodity prices. For instance, electricity losses occur in electricity networks (both distribution and transmission), and gas transmission activities are subject to fluctuations in the price of ‘shrinkage gas’ (the gas necessary for the operation of fuel compressors).
Nonetheless, the residual exposure of heat networks to this risk is limited, or perhaps even non-existent, due to the cost-plus nature of the regulatory regime.
Water and sewerage companies conduct activities with similar scope, since they operate under vertically integrated structures involving both supply and network activities. In this respect they are more similar to DHNs.
2 The proposed regulatory regime for heat networks has a one-year maturity, which is much shorter than the three- to five-year
maturity applied to energy distribution networks in the Netherlands and the five years valid for TenneT.

Oxera The cost of capital for heat distribution and supply
7
Scale of activities District heating networks are typically developed and operated on a local scale—to supply an agglomeration (‘city networks’) or a housing development (‘block networks’). The size of individual networks is therefore smaller than for energy distribution or transmission, notwithstanding the fact that 80% of ‘city’ networks in the Netherlands are owned and operated by the three largest energy groups in the country (Nuon, Essent and Eneco).
One issue with respect to scale is that, in the presence of inefficiencies in capital markets, small undertakings might not be able to access the most competitive sources of finance. For example, small undertakings might not be able to issue bonds directly onto the market (in which case they would have to rely more heavily on bank loans than large companies are obliged to), or they might be prevented from using derivatives and structured finance options (such as credit wrapping or inflation-linked swaps) to manage their debt efficiently. Furthermore, where small undertakings do raise finance directly on the debt and equity markets, their securities might typically be less liquid than those of large companies. If this is the case, investors might require a premium to compensate for illiquidity and trading costs.
However, it is not evident that these factors apply to the heat distribution and supply sector in the Netherlands. The magnitude of the impact of these factors depends on the scale of financing, not the scale of operations. The majority of district heating networks in the Netherlands do not raise finance on a stand-alone basis as they are owned and operated by larger groups—indeed, this is the very reason why this report must rely on indirect evidence to assess the cost of capital. In the absence of direct, specific evidence to the contrary, there appears to be no basis on which to include a specific adjustment for size outside of the CAPM framework.
2.3 Conclusion
In summary, this section has argued that heat networks are similar to traditional utility networks (energy and water) in several respects. The following table summarises those elements by comparing the risk exposure of DHNs to that of energy networks.
Table 2.1 Risk exposure of DHNs in comparison with energy networks
DHNs Energy networks Is systematic risk higher or lower for DHNs relative to energy networks?
Where does the regulatory regime allocate systematic risk for DHNs?
Competition Gas heating Limited Higher To shareholders (depending on safety net)
Basis for regulation
Cost-plus Price cap n/a To consumers
Length of regulatory period
One year Up to five years n/a To consumers
Customer base
Domestic Domestic and industrial
Lower To customers
Scope of activities
Infrastructure and supply function
Infrastructure Higher To customers (cost-plus)
Scale of activities
Local (but joint ownership structures)
Regional to national Similar n/a
Source: Oxera.
Table 2.1 illustrates that while the differences between DHNs and energy networks tend to, in themselves, increase the exposure of DHNs to systematic risk in comparison with energy

Oxera The cost of capital for heat distribution and supply
8
networks, the effects of the regulatory regime are, in large part, to re-allocate this risk from shareholders to consumers. The main exception to this concerns the effects of the maximum price cap, which largely allocate the systematic risk to shareholders. This will impact the choice of comparators used to estimate the asset beta as a measure of business risk—the subject of the next section.

Oxera The cost of capital for heat distribution and supply
9
3 Estimating the cost of equity
This analysis seeks to estimate the required return to compensate equity investors. It takes into account investors’ exposure to systematic risk—ie, the risk that equity returns on heat projects might fall below expectations because of events affecting the economy and the capital markets as a whole, as well as risk factors that are specific to the regulatory regime under which a company operates, such as the asymmetric risk exposure.
EK uses the capital asset pricing model (CAPM) to assess systematic risk and the corresponding cost of equity for energy networks, as do most other industry regulators in Europe.
The CAPM defines the cost of equity for a particular business as the combination of:
– the risk-free rate and the equity risk premium (ERP), which are generic parameters (ie, they are identical for all companies throughout the economy);
– the beta, which is a specific parameter (ie, it applies only to the business under consideration and to other businesses of similar risk).
EK estimates the generic parameters of the CAPM for energy networks, and there is no reason to suppose that different values would apply to the heat sector. The purpose of this section is therefore to estimate the asset beta for heat distribution and supply activities.
Box 3.1 The capital asset pricing model
The CAPM is predicated on the assumption that investors hold a broad portfolio of assets and are concerned only about the total return that this portfolio yields. The implication is that investors do not require any compensation for ‘idiosyncratic risk’ (ie, risk that affects only the company under consideration), since they can diversify this risk away. Investors require compensation only for ‘systematic risk’ (ie, risk that affects both the company and the market as a whole, such as demand shocks or cost input price increases).
The generic formula for estimating the cost of equity of company ek under the CAPM is:
β+= x ERP rk fe
where:
– rf is the risk-free rate;
– ERP is the equity risk premium for the whole equity market;
– ȕ is the risk of an asset relative to the market.
The beta is estimated empirically as the covariance between returns on the market portfolio, divided by the variance of returns on the market portfolio:
( )( )m
me
RVar
R,RCov=β
where:
– Re is the return on the asset;
– Rm is the return on the market.
Oxera The cost of capital for heat distribution and supply
10
Importantly, within the CAPM framework, beta only captures the effects of symmetric risk. To the extent that a company is a normal utility, its systematic risk exposure is captured by the beta of utilities.
To the extent that the maximum price cap has similar effects to an increase in competition, it may be appropriate to infer from companies facing greater demand risk a rough estimate of the impact of such risk. Some utility-like companies face a degree of demand risk and, as a result, have a higher beta.
Therefore, two options are available to estimate the effect of the maximum price cap:
– it can either be estimated within the CAPM framework by uplifting the beta on the basis of evidence from the beta of companies that face a degree of demand risk (as presented in this section); or
– it can be estimated by keeping the beta at the low end of the range and compensating for that risk using real options (Appendix 1 provides details of one such approach).
The rest of this section is structured as follows:
– an estimate of the asset beta of DHNs is provided in section 3.1, based on information for indirect comparators;
– section 3.2 presents the generic parameters (ie, the risk-free rate and the ERP), as well as estimates for the cost of equity of heat networks.
3.1 Beta estimation
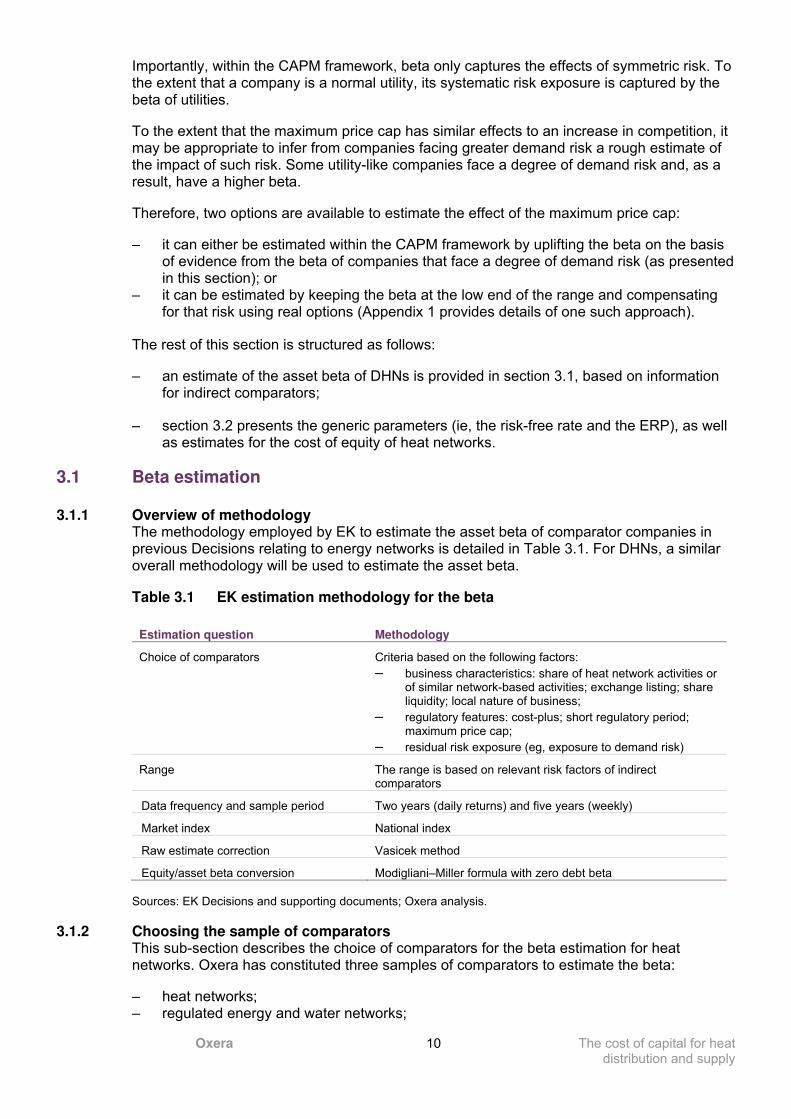
3.1.1 Overview of methodology The methodology employed by EK to estimate the asset beta of comparator companies in previous Decisions relating to energy networks is detailed in Table 3.1. For DHNs, a similar overall methodology will be used to estimate the asset beta.
Table 3.1 EK estimation methodology for the beta
Estimation question Methodology
Choice of comparators Criteria based on the following factors:
– business characteristics: share of heat network activities or of similar network-based activities; exchange listing; share liquidity; local nature of business;
– regulatory features: cost-plus; short regulatory period; maximum price cap;
– residual risk exposure (eg, exposure to demand risk)
Range The range is based on relevant risk factors of indirect comparators
Data frequency and sample period Two years (daily returns) and five years (weekly)
Market index National index
Raw estimate correction Vasicek method
Equity/asset beta conversion Modigliani–Miller formula with zero debt beta
Sources: EK Decisions and supporting documents; Oxera analysis.
3.1.2 Choosing the sample of comparators This sub-section describes the choice of comparators for the beta estimation for heat networks. Oxera has constituted three samples of comparators to estimate the beta:
– heat networks; – regulated energy and water networks;

Oxera The cost of capital for heat distribution and supply
11
– local multi-utilities; – regulated companies subject to considerable demand risk.
Sample of heat networks This sample includes companies that are involved exclusively or primarily in heat distribution and supply, and which have some equity traded in capital markets. A sample of heat networks is presented in Table 3.2 below.
Table 3.2 Heat network comparators
Company Country/ Region Business mix Turnover (€m)
Share of heat (DH and CHP)
Share liquidity
Fernheizwerk Neukoelln AG
Germany: Berlin Heat (DH + CHP)
22 97% 48%
Prazska Teplarenska AS
Czech Republic: Prague
Heat (DH + CHP), other
n/a 92% 2% (delisted in 2003)
United Energy AG Czech Republic: KomoĜany, Most and Litvinov
Electricity, heat (DH + CHP)
155 37% (97% with CHP)
3% (delisted in 2006)
Teplarny AS Czech Republic Heat, electricity (generation and distribution)
53 73% 0% (delisted in 2005)
Fortum Wroclaw SA
Poland Heat 63 97% (delisted in 2006)
Note: CHP denotes ‘combined heat and power’. Liquidity is calculated as the number of days in a given year on which the share was traded, divided by the total number of working days (260). Sources: Bloomberg; Datastream; Oxera calculations.
The paucity of market data on district heating is explained by economic and institutional factors. Historically, most district heating systems have been developed by municipalities or by integrated energy groups. As a consequence, very few companies meet the two necessary criteria of having both some traded equity and a substantial share of their business in heat distribution and supply. For this reason, it is not possible to implement the direct approach with sufficient reliability.
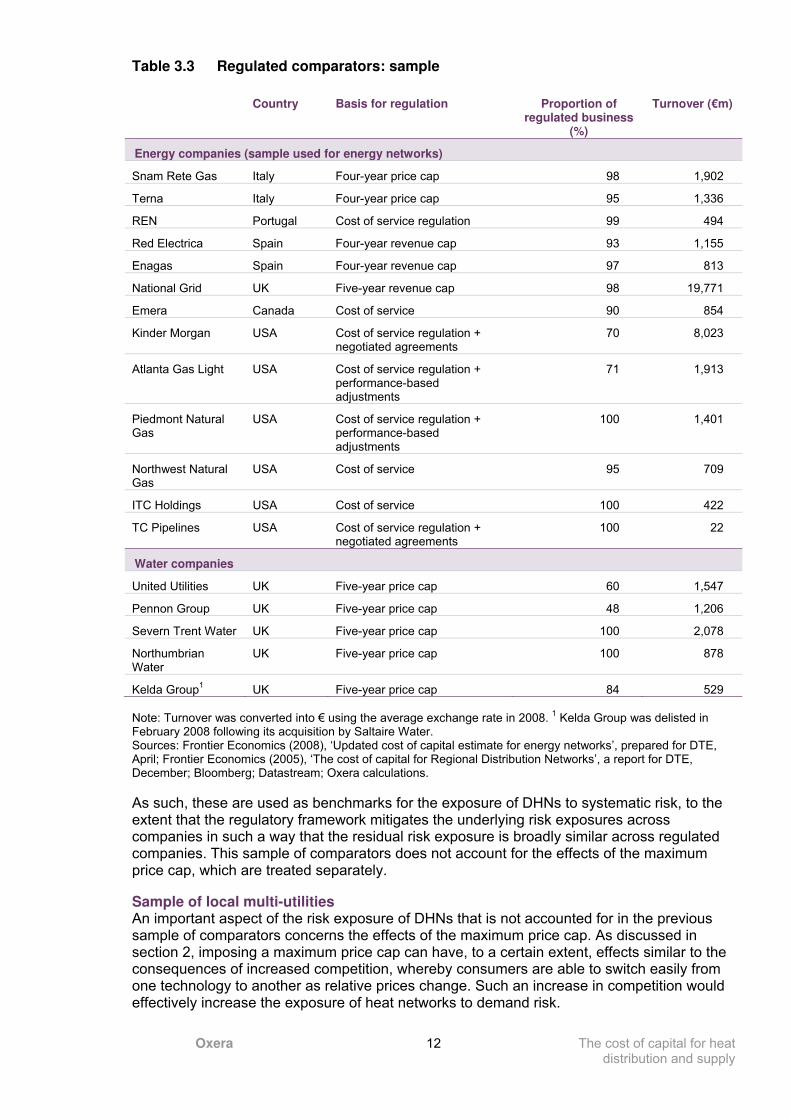
Sample of regulated energy and water networks The first sample consists of utilities whose business portfolio focuses on regulated activities—ie, energy transmission and distribution, and water. It represents an updated version of the comparator sample used by EK for the determination of the cost of capital for energy networks in the 2008 review.3
As outlined in section 2, regulated network utilities are similar to heat networks in many respects: they are largely an infrastructure-based business, provide an essential service, have monopoly power, and are regulated. Water and sewerage companies are also included in this sample because their regional dimension and their vertically integrated structure (comprising both supply and network activities) are attributes shared by heat networks.
3 NMa (2008), ‘Determination of the WACC—Addendum 2—Decision 102610-1/27’.
Oxera The cost of capital for heat distribution and supply
12
Table 3.3 Regulated comparators: sample
Country Basis for regulation Proportion of regulated business
(%)
Turnover (€m)
Energy companies (sample used for energy networks)
Snam Rete Gas Italy Four-year price cap 98 1,902
Terna Italy Four-year price cap 95 1,336
REN Portugal Cost of service regulation 99 494
Red Electrica Spain Four-year revenue cap 93 1,155
Enagas Spain Four-year revenue cap 97 813
National Grid UK Five-year revenue cap 98 19,771
Emera Canada Cost of service 90 854
Kinder Morgan USA Cost of service regulation + negotiated agreements
70 8,023
Atlanta Gas Light USA Cost of service regulation + performance-based adjustments
71 1,913
Piedmont Natural Gas
USA Cost of service regulation + performance-based adjustments
100 1,401
Northwest Natural Gas
USA Cost of service 95 709
ITC Holdings USA Cost of service 100 422
TC Pipelines USA Cost of service regulation + negotiated agreements
100 22
Water companies
United Utilities UK Five-year price cap 60 1,547
Pennon Group UK Five-year price cap 48 1,206
Severn Trent Water UK Five-year price cap 100 2,078
Northumbrian Water
UK Five-year price cap 100 878
Kelda Group1 UK Five-year price cap 84 529
Note: Turnover was converted into € using the average exchange rate in 2008.
1 Kelda Group was delisted in
February 2008 following its acquisition by Saltaire Water. Sources: Frontier Economics (2008), ‘Updated cost of capital estimate for energy networks’, prepared for DTE, April; Frontier Economics (2005), ‘The cost of capital for Regional Distribution Networks’, a report for DTE, December; Bloomberg; Datastream; Oxera calculations.
As such, these are used as benchmarks for the exposure of DHNs to systematic risk, to the extent that the regulatory framework mitigates the underlying risk exposures across companies in such a way that the residual risk exposure is broadly similar across regulated companies. This sample of comparators does not account for the effects of the maximum price cap, which are treated separately.
Sample of local multi-utilities An important aspect of the risk exposure of DHNs that is not accounted for in the previous sample of comparators concerns the effects of the maximum price cap. As discussed in section 2, imposing a maximum price cap can have, to a certain extent, effects similar to the consequences of increased competition, whereby consumers are able to switch easily from one technology to another as relative prices change. Such an increase in competition would effectively increase the exposure of heat networks to demand risk.

Oxera The cost of capital for heat distribution and supply
13
The purpose of the second sample is to reflect the risk profile of a utility company exposed to a degree of demand and switching risk. It comprises mid-sized utilities companies which meet the following two criteria:
– the company’s business portfolio focuses on regulated networks (energy and water) and supply functions (energy and heat); the company’s traded equity meets the liquidity criteria set out by EK in previous WACC determinations—ie, the turnover of the company must exceed €100m per year, and the share must be traded at least 90% of opening days in a year.
This sample was constituted using both financial databases and industry publications. The major European energy companies (E.ON, Vattenfal, RWE, EDF, etc) were not included in this sample because their exposure to ‘upstream’ risks (generation and wholesale markets) was deemed too significant to be comparable to that of heat networks.
Because of their involvement in unregulated supply activities, these companies face a greater degree of demand risk than regulated networks. In the same way that Dutch district heating networks face the risk that the maximum price cap might reduce their revenues when the notional cost of gas heating becomes more competitive, these multi-utilities companies face the risk that they might have to reduce their prices to retain customers when other suppliers become more competitive.
Table 3.4 Multi-utility comparators: sample
Country Business mix Turnover
(€m)
EN ESG W H Other
EVN AG Austria c c c c 2,397
A2A SpA Italy c c c c 5,963
Hera SpA Italy c c c 3,716
IRIDE S.P.A. Italy c c c c 2,356
Hafslund ASA Norway c c Manages investment portfolio and offers power trading
1,346
Note: ‘EN’ denotes energy networks, ‘ESG’ denotes energy supply and generation, ‘W’ denotes water, and ‘H’ denotes heat. Turnover was converted to € using the average exchange rate in 2008. Sources: Bloomberg; Datastream; company annual accounts; Oxera analysis.
Sample of regulated or partially regulated companies exposed to a degree of demand risk The last sample of comparators provides a different and complementary insight into the risk profiles of district heating networks. It comprises telecommunications and airports companies. These companies have a different cost structure and business profile to heat networks, but they share an important characteristic insofar as they are, although regulated, nonetheless exposed to a degree of demand risk.
– The fixed-line businesses of incumbent telecoms companies (and notably the local copper loop networks) are typically regulated because these operations hold a degree of market power. However, these businesses also face a risk of customer switching and stranding if alternative technologies (such as fibre, cable, etc) become more competitive. This competitive pressure is normally reflected in the price control regime for these activities, which seeks to replicate market-based price signals (based on forward-looking measures of costs).

Oxera The cost of capital for heat distribution and supply
14
– Airports may also be regulated where they hold a degree of market power regionally, but are also exposed to potential competitive pressures from substitutes (new airports or high-speed train links). More generally, they are exposed to significant demand risk since the service that they provide is not ‘essential’ in the sense of traditional utilities, and since traffic is dependent on the economic climate.
For these reasons, the evidence from these companies can provide a benchmark to inform the effect of the maximum price cap.
Table 3.5 Sample of regulated or partially regulated companies exposed to a degree of demand risk
Country Sector
Belgacom Belgium Telecoms
Elisa Finland Telecoms
TeliaSonera Finland Telecoms
France Telecom France Telecoms
eircom Ireland Telecoms
KPN The Netherlands Telecoms
BT Group UK Telecoms
BAA Airports Limited UK Airport
Macquarie airports UK, Belgium, Denmark, Australia
Airport
Frapport AG (Frankfurt) Germany Airport
Flughafen Wien AG (Vienna) Austria Airport
Flughafen Zuerich AG (Zurich) Switzerland Airport
Source: Oxera.
3.1.3 Estimating the beta for the comparator samples This sub-section presents the beta estimates for each sample of companies—except for heat networks, whose shares are not sufficiently liquid to provide reliable estimates for their beta.
The estimates for regulated network comparators are presented in Table 3.6. The resulting median for their asset beta is 0.39–0.45 (based on daily and weekly estimates). This is slightly lower than the estimates for Dutch energy networks (0.39–0.46), with the differences being due to the addition of water companies. This range, which does not take into account the effects of the maximum price cap, will be used as the basis for the asset beta estimate for heat networks.

Oxera The cost of capital for heat distribution and supply
15
Table 3.6 Regulated network comparators
Country Asset beta
(daily) Asset beta
(weekly)
Snam Rete Gas Italy 0.11 0.20
Terna Italy 0.24 0.24
REN Portugal 0.38 0.41
Red Electrica Spain 0.40 0.46
Enagas Spain 0.42 0.50
National Grid UK 0.39 0.46
Emera Canada 0.18 0.22
Kinder Morgan USA 0.35 0.45
Atlanta Gas Light USA 0.41 0.47
Piedmont Natural Gas USA 0.56 0.49
Northwest Natural Gas USA 0.46 0.40
ITC Holdings USA 0.50 0.61
TC Pipelines USA 0.38 0.65
United Utilities UK 0.44 0.50
Pennon Group UK 0.33 0.44
Severn Trent Water UK 0.36 0.45
Northumbrian Water UK 0.26 0.33
Kelda Group UK 0.42 0.39
Mean 0.37 0.43
Median 0.39 0.45
Note: Betas are adjusted using the Vasicek adjustment. Estimates based on data up to July 1st 2009 (except for Kelda Group, for which the estimate is based on data up to February 2008), and consistent with the methodology previously employed by EK for energy networks. The statistical properties of these estimates are discussed in Appendix 3. Sources: Bloomberg; Datastream; Oxera calculations.
The next two sets of comparators are intended to reflect the effects of the maximum price cap, as approximated (conservatively) by exposure to demand risk.
The estimates for local multi-utility comparators have a median of 0.37–0.47, based on daily and weekly estimates (see Table 3.7 below). The relatively small difference compared to regulated network utilities suggests that either these multi-utilities do not face, on balance, higher demand risk, or that other factors are present and effectively offset most of the higher demand risk.

Oxera The cost of capital for heat distribution and supply
16
Table 3.7 Local multi-utility comparators
Country Asset beta (daily) Asset beta (weekly)
EVN AG Austria 0.31 0.37
A2A SpA Italy 0.46 0.47
Hera SpA Italy 0.37 0.63
IRIDE S.P.A. Italy 0.31 0.47
Hafslund ASA Norway 0.40 0.54
Mean 0.38 0.50
Median 0.37 0.47
Note: Betas are adjusted using the Vasicek adjustment. Estimates based on data up to July 1st 2009, and consistent with the methodology previously employed by EK for energy networks. The statistical properties of these estimates are discussed in Appendix 3. Sources: Bloomberg; Datastream; Oxera calculations.
The median asset beta for the sample of regulated or partially regulated companies exposed to a degree of demand risk ranges from 0.50 to 0.57 (see Table 3.8). Compared to regulated networks and multi-utilities, this higher range mainly reflects the greater demand risk faced by airports and telecoms.
Table 3.8 Sample of regulated or partially regulated companies exposed to a degree of demand risk
Country Asset beta (daily) Asset beta (weekly)
Belgacom Belgium 0.42 0.35
Elisa Finland 0.58 0.62
TeliaSonera Finland 0.59 0.67
France Telecom France 0.39 0.40
eircom1 Ireland 0.45 0.70
KPN The Netherlands 0.34 0.38
BT Group UK 0.56 0.55
BAA Airports (Group)1 UK 0.52 0.52
Macquarie airports Australia, Belgium, Denmark, UK
0.52 0.69
Frapport AG (Frankfurt) Germany 0.65 0.75
Flughafen Wien AG (Vienna) Austria 0.48 0.58
Flughafen Zuerich AG (Zurich)
Switzerland 0.31 0.34
Mean 0.48 0.55
Median 0.50 0.57
Note: Betas are adjusted using the Vasicek adjustment, except as otherwise noted. Estimates are based on data up to July 1st 2009, and are consistent with the methodology previously employed by EK for energy networks. The statistical properties of these estimates are discussed in Appendix 3.
1 Betas are estimated from regulatory
determinations. Asset beta is implied from the reported equity betas, gearing and debt beta assumptions. Sources: Bloomberg; Datastream; Oxera analysis; regulatory documents: ComReg (2008), ‘Eircom’s Cost of Capital: Response to Consultation and Decision Notice’, May 22nd; Competition Commission (2007) ‘BAA Ltd: A report on the economic regulation of the London airports companies (Heathrow Airport Ltd and Gatwick Airport Ltd)’, September 28th, Appendix F.

Oxera The cost of capital for heat distribution and supply
17
3.1.4 Beta range for energy networks Based on this evidence, the relevant range for heat networks in the Netherlands can be estimated as 0.39–0.53, where:
– the high end (0.53) is based on the comparators exposed to greater demand risk, where the midpoint of the range is used. This fully incorporates the estimated effects of the maximum price cap and assumes that there are no compensatory measures;
– the low end (0.39) is based on the range for network utility comparators, where the low end is used to reflect the effects of the regulatory regime proposed for heat networks, which re-allocates most of the risk to consumers (excluding the effects of the maximum price cap, which is taken into account in the high end of the range).
The adoption of a point estimate within this range will primarily depend on the final design of the regulatory regime, and notably on how well the various ‘safety nets’ provided (the pooling mechanism, the subsidies, the depreciation profiling options, etc) protect heat networks against the risk of losses incurred through the implementation of the maximum price cap.
3.2 Cost of equity estimates
The risk-free rate and the ERP are generic parameters —that is, they do not vary across sectors. EK estimates the generic parameters of the CAPM for energy networks. The resulting estimates are summarised here.
3.2.1 Risk-free rate In previous decisions relating to energy networks, EK estimated the risk-free rate on the basis of the two- and five-year average yield on Dutch sovereign debt with a maturity of ten years.
Applying this methodology in the current context yields a range for the risk-free rate of 3.9–4.2%. The low end of the range corresponds to the five-year average of the sovereign yield, and the high end of the range corresponds to the two-year average (see Figure 3.1 below).

Oxera The cost of capital for heat distribution and supply
18
Figure 3.1 Yield on ten-year Dutch sovereign and trailing averages (%)
Sources: Datastream; Oxera analysis.
3.2.2 Equity risk premium In previous decisions relating to energy networks, EK estimated the ERP to be within a range of 4% to 6%, based on evidence from both historical returns and from forward-looking models. Since EK last updated its ERP estimate in 2008, returns in equity markets have dropped very significantly, and it is conceivable that investors are incorporating this information into their expectations. On the other hand, indicators of risk and risk aversion (such as historical and implied volatility) have increased, which might suggest an effect working in the opposite direction.
For these reasons, there would not appear to be any sufficient basis for departing from the range used at the last determinations.
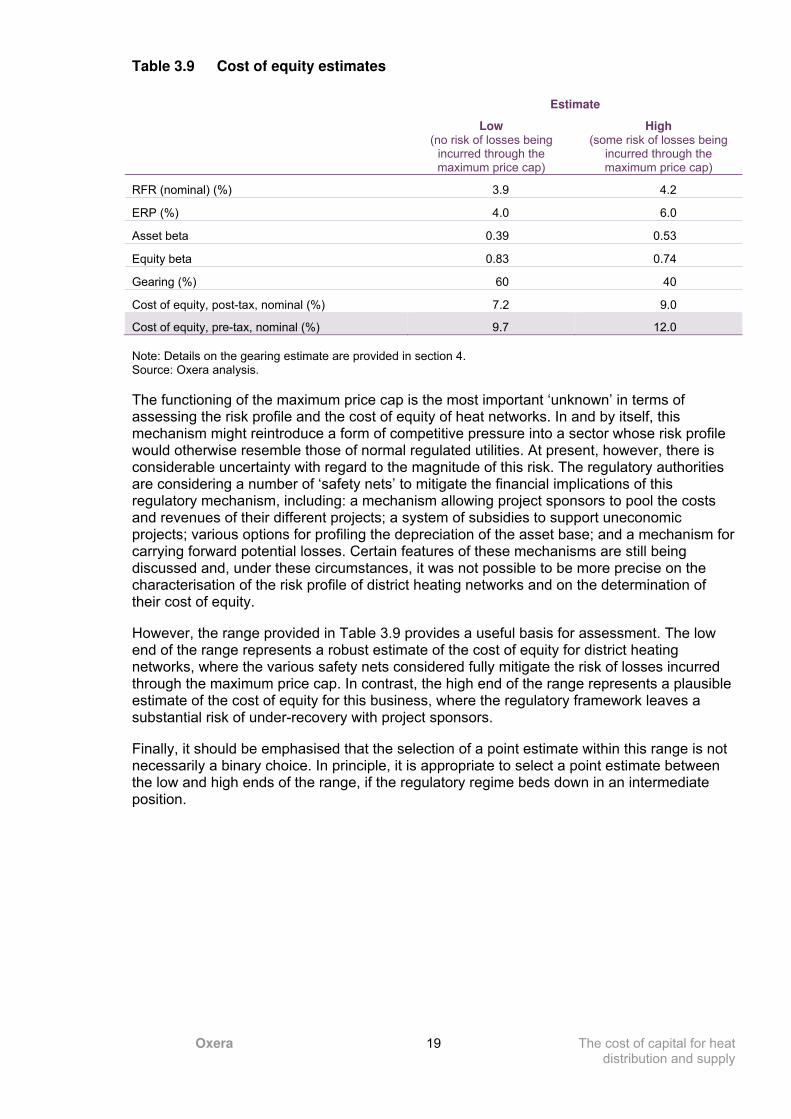
3.2.3 Cost of equity estimates Combining the risk-free rate, the ERP and the asset beta assumptions developed in this section with the gearing assumption developed in section 4.2 gives the cost of equity estimates presented in Table 3.9 below.
0
1
2
3
4
5
6
7
Jan-04 Jul-04 Jan-05 Jul-05 Jan-06 Jul-06 Jan-07 Jul-07 Jan-08 Jul-08 Jan-09 Jul-09
Netherlands ten-year sovereign bond index Two-year trailing average Five-year trailing average
Oxera The cost of capital for heat distribution and supply
19
Table 3.9 Cost of equity estimates
Estimate
Low (no risk of losses being
incurred through the maximum price cap)
High (some risk of losses being
incurred through the maximum price cap)
RFR (nominal) (%) 3.9 4.2
ERP (%) 4.0 6.0
Asset beta 0.39 0.53
Equity beta 0.83 0.74
Gearing (%) 60 40
Cost of equity, post-tax, nominal (%) 7.2 9.0
Cost of equity, pre-tax, nominal (%) 9.7 12.0
Note: Details on the gearing estimate are provided in section 4. Source: Oxera analysis.
The functioning of the maximum price cap is the most important ‘unknown’ in terms of assessing the risk profile and the cost of equity of heat networks. In and by itself, this mechanism might reintroduce a form of competitive pressure into a sector whose risk profile would otherwise resemble those of normal regulated utilities. At present, however, there is considerable uncertainty with regard to the magnitude of this risk. The regulatory authorities are considering a number of ‘safety nets’ to mitigate the financial implications of this regulatory mechanism, including: a mechanism allowing project sponsors to pool the costs and revenues of their different projects; a system of subsidies to support uneconomic projects; various options for profiling the depreciation of the asset base; and a mechanism for carrying forward potential losses. Certain features of these mechanisms are still being discussed and, under these circumstances, it was not possible to be more precise on the characterisation of the risk profile of district heating networks and on the determination of their cost of equity.
However, the range provided in Table 3.9 provides a useful basis for assessment. The low end of the range represents a robust estimate of the cost of equity for district heating networks, where the various safety nets considered fully mitigate the risk of losses incurred through the maximum price cap. In contrast, the high end of the range represents a plausible estimate of the cost of equity for this business, where the regulatory framework leaves a substantial risk of under-recovery with project sponsors.
Finally, it should be emphasised that the selection of a point estimate within this range is not necessarily a binary choice. In principle, it is appropriate to select a point estimate between the low and high ends of the range, if the regulatory regime beds down in an intermediate position.

Oxera The cost of capital for heat distribution and supply
20
4 Gearing and debt premium
The exercise of estimating the gearing and debt premium parameters relies on both general market indices and comparators. To the extent that comparators have to be relied upon, the analysis of the gearing and the debt premium therefore requires the use of indirect comparisons similar to those made in the context of beta estimates. As mentioned previously, most heat networks are part of larger group structures, and that they do not issue debt instruments specifically to finance their heat networks. In the absence of direct comparators, the cost of debt and gearing will be estimated on the basis of market evidence from the same sample of indirect comparators as used for the beta analysis—ie, regulated network utilities, local multi-utilities, and a sample of companies exposed to demand risk.
This section provides evidence to establish the appropriate values for the gearing (sub-section 4.2) and debt premium (sub-section 4.3) parameters for heat networks, given an assumption regarding the appropriate credit rating (discussed below in sub-section 4.1).
4.1 Target credit rating
A ‘comfortable’ or ‘solid’ credit rating should enable companies to absorb some downside shock and still retain a credit rating within the investment grade category. It should also enable companies to access finance on reasonable terms under a range of market conditions.
The following evidence can inform the choice of an appropriate rating reference.
4.1.1 Market data on issuance volumes and costs Prior to the recent financial turmoil, the debt market appeared to be liquid for all categories of investment-grade debt (see Figure 4.1 below), and the spread between BBB- and A-rated debt was relatively modest (see Figure 4.7 below). Under these circumstances, a credit rating within the BBB category might appear prudent and efficient. Since the financial crisis began, however, the cost of BBB-rated debt has risen substantially above that of A-rated debt, and the volume of new issuances of BBB-rated debt has decreased significantly over certain periods. In other words, the benefits of ‘moving down’ the rating scale have decreased, while the risks of doing so have, arguably, increased. Data on utilities issuances also shows that the vast majority of new debt issued by energy and utility companies is rated in the A category (see Figure 4.2 below).

Oxera The cost of capital for heat distribution and supply
21
Figure 4.1 Bond issuances by European companies by rating, all sectors (€ billion)
Source: Dealogic.
Figure 4.2 Bond issuances by European companies by rating, energy and utilities (€ billion)
Sources: Datastream; Oxera analysis.
0
20
40
60
80
100
120
140
Q1 Q2 Q3 Q4 Q1 Q2 Q3 Q4 Q1 Q2 Q3 Q4 Q1 Q2 Q3 Q4 Q1 Q2 Q3 Q4 Q1 Q2 Q3
2004 2005 2006 2007 2008 2009
AA A BBB
-
10
20
30
40
50
60
70
80
90
100
2005 H2 2006 H1 2006 H2 2007 H1 2007 H2 2008 H1 2008 H2 2009 H1
AAA AA A BBB

Oxera The cost of capital for heat distribution and supply
22
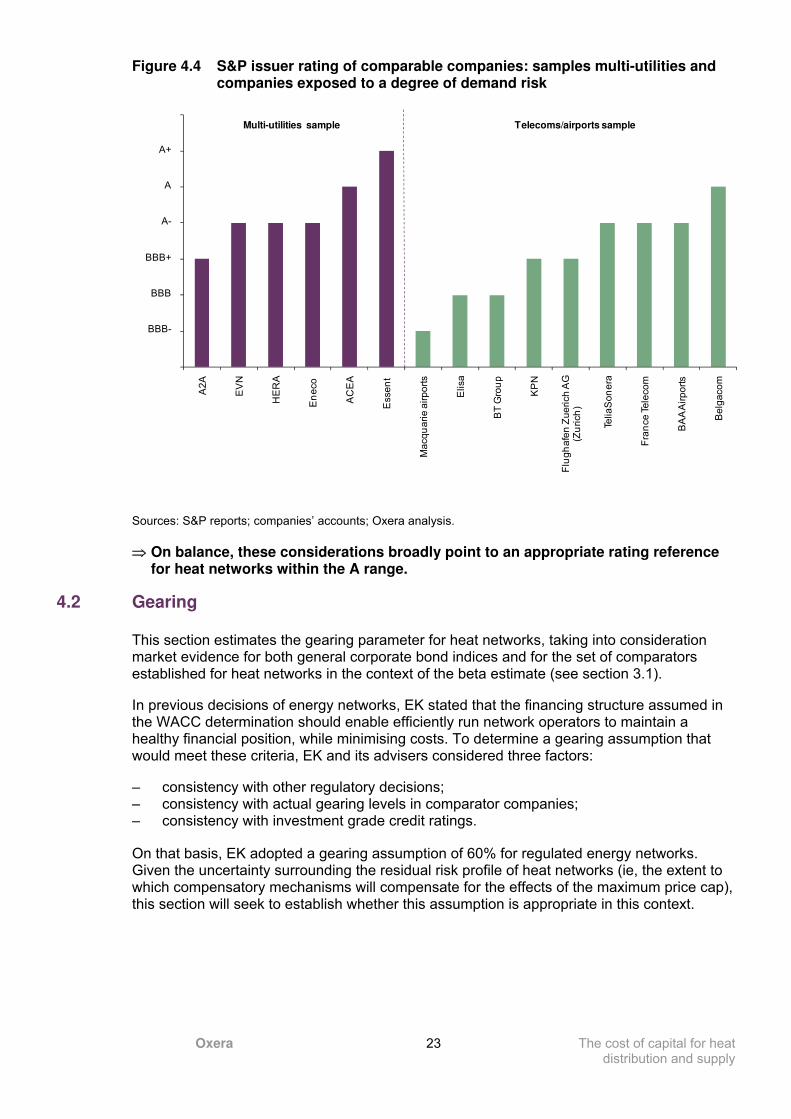
4.1.2 Credit ratings of comparator companies The proportion of issuer ratings for regulated networks and multi-utilities in Europe appears to be evenly distributed across rating categories from BBB to AA, with a median of A– (see Figure 4.3 below). The credit ratings for those multi-utilities and regulated or partially regulated companies exposed to a degree of demand risk ranges from BBB to A, with medians of A– and BBB+, respectively (see Figure 4.4 below). This suggests that, on balance, telecoms and airports are subject to greater total risk than regulated networks and multi-utilities, because the credit ratings for these sectors incorporate the effects of both business and financial risks.
Figure 4.3 S&P issuer rating of comparable network companies: sample of regulated networks
Note: S&P has not yet confirmed the ratings of Stedin, Alliander and Enexis, and the ratings reported here reflect the integrated businesses. Sources: S&P reports; companies’ accounts; Oxera analysis.
We
ste
rn P
ow
er
En
ve
str
a
Sco
tia
Ga
s
Au
str
alia
n P
ipe
lin
e
Em
era
Kin
de
r M
org
an
Exe
lon
ITC
Ho
ldin
gs C
orp
Ke
lda
Gro
up
Ltd
No
rth
ern
Ga
s
CE
Ele
ctr
ic
We
sse
x W
ate
r
No
rth
um
bri
an
Un
ite
d U
tilitie
s
Elia
Se
ve
rn T
ren
t
Na
tio
na
l Gri
d
Atla
nta
Ga
s L
igh
t
TC
Pip
elin
es
Ca
na
dia
n U
tilitie
s
Pid
em
on
t Na
tura
l Ga
s
Nu
on
RE
N
Bo
rd G
áis
Tern
a
Fin
gri
d
Ga
su
nie
En
ag
as
RT
E
Sn
am
Sta
tne
tt
Re
d E
lectr
ica
No
rth
we
st N
atu
ral G
as
En
erg
ine
t
AA+
AA
AA-
A+
A
A-
BBB+
BBB
BBB-
Oxera The cost of capital for heat distribution and supply
23
Figure 4.4 S&P issuer rating of comparable companies: samples multi-utilities and companies exposed to a degree of demand risk
Sources: S&P reports; companies’ accounts; Oxera analysis.
⇒ On balance, these considerations broadly point to an appropriate rating reference for heat networks within the A range.
4.2 Gearing
This section estimates the gearing parameter for heat networks, taking into consideration market evidence for both general corporate bond indices and for the set of comparators established for heat networks in the context of the beta estimate (see section 3.1).
In previous decisions of energy networks, EK stated that the financing structure assumed in the WACC determination should enable efficiently run network operators to maintain a healthy financial position, while minimising costs. To determine a gearing assumption that would meet these criteria, EK and its advisers considered three factors:
– consistency with other regulatory decisions; – consistency with actual gearing levels in comparator companies; – consistency with investment grade credit ratings.
On that basis, EK adopted a gearing assumption of 60% for regulated energy networks. Given the uncertainty surrounding the residual risk profile of heat networks (ie, the extent to which compensatory mechanisms will compensate for the effects of the maximum price cap), this section will seek to establish whether this assumption is appropriate in this context.
A2
A
EV
N
HE
RA
En
eco
AC
EA
Esse
nt
Ma
cq
ua
rie
air
po
rts
Elisa
BT
Gro
up
KP
N
Flu
gh
afe
n Z
ue
rich
AG
(Z
uri
ch
)
Telia
So
ne
ra
Fra
nce
Te
leco
m
BA
A A
irp
ort
s
Be
lga
co
m
A+
A
A-
BBB+
BBB
BBB-
Multi-utilities sample Telecoms/airports sample

Oxera The cost of capital for heat distribution and supply
24
4.2.1 What gearing level is consistent with the target credit rating? The following evidence can inform the choice of a gearing assumption consistent with the target rating reference of A.4
– Observed gearing for rated companies (book value)—the average gearing of network companies rated in the A category is 57% when measured on the basis of the book value of their assets (see Figure 4.5 below). This compares to 46% for the multi-utilities and 49% for the sample of regulated or partially regulated companies facing a degree of demand risk.5 However, because most companies report their asset values at historical costs (or only revalue their assets at infrequent intervals), this measure of gearing might overstate the underlying gearing based on market value.
– Observed gearing for rated companies (market value)—it is possible to obtain a measure of gearing based on the market value of equity for the sample of companies used for the estimation of the beta (see Figure 4.6 below).6 This measure of gearing might provide a better estimate of the economic gearing of the companies, although it varies with short-term movements in equity prices. For the sample of regulated networks, the average gearing of the companies rated in the A category is 47%. Gearing for the sample of multi-utilities that are rated A is broadly consistent, at 46%. However, gearing for the A-rated sample of regulated or partially regulated companies exposed to a degree of demand risk is lower. This suggests that, to compensate for their increased risk profile and still attain a credit rating in the A category, these companies operate under a reduced level of gearing.
– Regulatory precedent—most European energy and water regulators have adopted gearing assumptions between 50 and 60% in recent years (see Table 4.1 below). Ofwat has recently proposed adopting a gearing assumption of 57.5% for its next determination, up from 55% in its last determination. In contrast, regulatory determinations for telecoms networks and airports have set a lower level of gearing, ranging between 30% and 60%.
⇒ These considerations suggest that if the heat networks face a degree of demand risk, as discussed in section 2, then the range for a reasonable level of gearing that might be adopted by heat networks might need to be wider than in the case of energy networks. In particular, if heat networks face a material level of demand risk, then the notional level of gearing at the low end might need to be lower, suggesting an overall range of 40–60%.
4 It is important to note that gearing does not determine the credit rating of companies in a mechanistic way—ratings will also be
affected by other financial ratios, as well as by qualitative considerations. 5 The average excludes BAA, which reported negative book equity in 2008.
6 Because the market value of debt is difficult to observe or measure when it is not traded, the gearing estimates provided in this
section combine the market value of equity and the book value of debt.

Oxera The cost of capital for heat distribution and supply
25
Figure 4.5 Gearing levels (book value) for A-rated comparator companies
Note: BAA’s gearing level is greater than 100% due to negative equity in its 2008 financial statements. Sources: S&P reports; companies’ accounts; Oxera analysis.
Figure 4.6 Gearing levels (market value) for A-rated comparator companies
Sources: S&P reports; Bloomberg; Oxera analysis.
0.0%
20.0%
40.0%
60.0%
80.0%
100.0%
120.0%
RE
N A
+
Pid
em
on
t Na
tura
l Ga
s A
Bo
rd G
áis
A
+
Tern
a A
+
Atla
nta
Ga
s L
igh
t A-
Un
ite
d U
tilitie
s A
-
Se
ve
rn T
ren
t A
-
EV
N A
-
En
eco
A-
HE
RA
A-
AC
EA
A
Telia
So
ne
ra A
-
Be
lga
co
m A
Fra
nce
Te
leco
m A
-
BA
A A
irp
ort
s A
-
A-rated regulated networks A-rated multi-utilities A-rated telecoms/airports
0%
10%
20%
30%
40%
50%
60%
70%
Ca
na
dia
n U
tilitie
s A
Pid
em
on
t Na
tura
l Ga
s A
TC
Pip
elin
es A
-
Tern
a A
+
Atla
nta
Ga
s L
igh
t A-
RE
N A
+
Un
ite
d U
tilitie
s A
-
Se
ve
rn T
ren
t A
-
Na
tio
na
l Gri
d A
-
EV
N A
-
AC
EA
A
HE
RA
A-
Be
lga
co
m A
Telia
So
ne
ra A
-
Fra
nce
Te
leco
m A
-
A-rated regulated networks A-rated multi-utilities A-rated telecoms

Oxera The cost of capital for heat distribution and supply
26
Table 4.1 Summary of regulatory precedent: gearing
Review Year Gearing (%)
Regulated network utilities
Ofgem Fourth Electricity Distribution Review (UK—electricity distribution)
2004 57.5
Ofgem Fourth Electricity Transmission Review (UK—transmission) 2006 60
AEEG (Italy—energy networks) 2007 44–47
CER (Ireland—gas transmission and distribution) 2007 55
Ofgem Gas Distribution Price Control Review (UK—gas distribution) 2007 62.5
Ofwat (UK—water) 2009 57.5
CRE (France—electricity transmission and distribution) 2009 60
Average 57
Companies exposed to greater demand risk
BIPT (Belgacom) 2006 35
FICORA (Finnish fixed telecoms interconnection) 2006 30
OPTA (Dutch wholesale telecoms activities) 2006 38.9
CAA-CC (Heathrow and Gatwick airports) 2007 60
CAA-CC (Stansted airport) 2008 50
ARCEP (French fixed-line and mobile determinations) 2008 30
ComReg (Ireland-telecoms) 2008 40
Ofcom (UK-fixed telecoms activities) 2009 35
Average 40
Sources: AEEG (2007), ‘Tariffe per l’erogazione dei servizi di transmission, distribuzione e misura dell’energie electtrica per il period 2008-2011—Orientamenti finali’; Commission for Energy Regulation (2007), ‘Bord Gáis Networks: Revenue Review 2007/8–2011/12’; Commission de Régulation de l’Energie (2009), ‘Proposition de la CRE du 26 février 2009 relative aux tarifs d’utilisation des réseaux publics de transport et de distribution d’electricité’; Ofwat (2009), ‘Future Water and Sewerage Charges 2010–15: Draft Determinations’; BIPT (2006), ‘Décision du Conseil de l'IBPT du 22 Novembre 2006 Concernant le Coût du Capital à Utiliser Dans les offres de Référence de Belgacom’, November 22nd; FICORA (2006), ‘Assessment principles for the pricing of fixed network interconnection’, June 28th; FICORA (2006), ‘Assessment principles for the pricing of fixed network interconnection’, June 28th; NERA (2006), ‘The cost of capital for KPN's wholesale activities’, a final report for OPTA, February 21st; ARCEP (2008), ‘Decision numbers 2008-0162 and 2008-0163’; ComReg (2008), ‘Eircom's Cost of Capital: Response to Consultation and Decision Notice’, May 22nd; Ofcom (2009), ‘A New Pricing Framework for Openreach’, May 22nd; Civil Aviation Authority (2009), ‘Economic Regulation of Stansted Airport, 2009–14’; Competition Commission (2007) ‘BAA Ltd: A report on the economic regulation of the London airports companies (Heathrow Airport Ltd and Gatwick Airport Ltd)’, September 28th, Appendix F, Competition Commission (2008) ‘Stansted Airport Ltd: Q5 price control review’, Appendix L.
4.2.2 Conclusion Comparators rated within the A range exhibit different levels of gearing, depending on the sample considered and the measurement standard adopted. Table 4.2 below summarises the evidence on gearing gathered in this section.
The evidence also suggests a differential in gearing between traditional networks and regulated or partially regulated companies exposed to a degree of demand risk. For example, the companies in the telecoms and airports sample (which include unregulated parts of the business) exhibit a lower gearing. This is consistent with the hypothesis that, given their greater risk profile, they create more headroom to face unanticipated cash flow shocks.
While there is no automatic relationship between gearing and credit rating, taken together this evidence suggests that:

Oxera The cost of capital for heat distribution and supply
27
– if regulated networks are the more appropriate comparators (ie, if the compensatory mechanisms fully offset the maximum price cap), a gearing of 50% to 60% could be consistent with a credit rating within the A range. Given that a rating in the low part of the A range should be sufficient to meet regulatory objectives, it might be appropriate to narrow down this range to 55–60%;
– if, on the other hand, the compensatory measures do not limit heat networks’ potential exposure to a degree of demand risk, a lower level of notional gearing might be appropriate and consistent with a credit rating within the A range.
– overall, a range of 40–60% for the notional gearing of heat networks seems appropriate. At the high end, it reflects the gearing for A-rated regulated networks, while at the low end it reflects a reasonable financial structure that would be consistent with potential exposure to a degree of demand risk.
Table 4.2 Sources of evidence on gearing
Company Average (%) Min (%) Max (%)
Regulated networks
Book value gearing for A-rated network companies 57 46 75
Market value gearing for A-rated network companies 47 34 59
RAB value gearing for A-rated network companies 60 49 70
Assumptions adopted at regulatory reviews 57 44 63
Multi-utilities
Book value gearing for A-rated network companies 46 35 57
Market value gearing for A-rated network companies 46 41 50
Assumptions adopted at regulatory reviews 54 40 62
Regulated or partially regulated companies exposed to a degree of demand risk
Book value gearing for A-rated companies 64 32 110
Market value gearing for A-rated companies 27 17 40
Assumptions adopted at regulatory reviews 40 30 60
Source: This table summarises the evidence obtained from all sources referred to above.
4.3 Debt premium
4.3.1 Methodology This section presents evidence of the debt premium using the same methodology as used by EK in previous decisions for energy networks. In those decisions, EK estimated the debt premium for energy networks on the basis of the five-year average spread for corporate bond indexes and the two-year average spread on a sample of reference bonds issued by comparator companies (see Table 4.3 below.)

Oxera The cost of capital for heat distribution and supply
28
Table 4.3 EK estimation methodology for the debt premium
Estimation question EK methodology
References Spread on general corporate bond indices
Spread on traded bonds for comparator companies
Maturity Around ten years
Credit rating Single A
Averaging period Five years (bond indices)
Two years (specific bonds)
Source: EK decisions for energy networks.
The following sub-section reviews the corresponding market evidence.
4.3.2 Market evidence Market data on corporate debt spreads shows the following.
– Yields and spreads on corporate bonds have increased since the second half of 2008, particularly for BBB-rated bonds (Figure 4.7).7
– The five-year average spread on an index of A-rated bonds has increased from 55bp in January 2008 to 89bp currently (Figure 4.8).
– The median of two-year average spreads is 159bp and 195bp for A-rated energy networks (including multi-utilities), and for the sample of regulated or partially regulated companies exposed to a degree of demand risk, respectively (Table 4.4). The spread for regulated networks is broadly in line with the two-year average spread on the general bond index (149bp—see Figure 4.8), while the two-year average spread for the sample of regulated or partially regulated companies exposed to a degree of demand risk is above that of the general bond index, partly in reflection of their companies’ greater risk characteristics.
7 There is some uncertainty regarding the reliability of price signals for BBB-rated debt, given the low volumes of issuances in
this segment of the market.

Oxera The cost of capital for heat distribution and supply
29
Figure 4.7 Yields and spreads on EUR-denominated ten-year corporate bond indices (BBB to AA ratings)
Sources: Bloomberg; Oxera calculations.
Figure 4.8 Spreads on EUR-denominated ten-year corporate bond indices (A rating) and trailing averages (bp)
Sources: Bloomberg; Oxera calculations.
0
100
200
300
400
500
600
700
800
900
0.0
1.0
2.0
3.0
4.0
5.0
6.0
7.0
8.0
9.0
Mar-02 Mar-03 Mar-04 Mar-05 Mar-06 Mar-07 Mar-08 Mar-09
bp
s
Yie
ld (%
)
AA ten-year yield A ten-year yield BBB ten-year yield
AA ten-year spread A ten-year spread BBB ten-year spread
0
50
100
150
200
250
300
Ma
r-0
4
Ma
y-0
4
Ju
l-0
4
Se
p-0
4
No
v-0
4
Ja
n-0
5
Ma
r-0
5
Ma
y-0
5
Ju
l-0
5
Se
p-0
5
No
v-0
5
Ja
n-0
6
Ma
r-0
6
Ma
y-0
6
Ju
l-0
6
Se
p-0
6
No
v-0
6
Ja
n-0
7
Ma
r-0
7
Ma
y-0
7
Ju
l-0
7
Se
p-0
7
No
v-0
7
Ja
n-0
8
Ma
r-0
8
Ma
y-0
8
Ju
l-0
8
Se
p-0
8
No
v-0
8
Ja
n-0
9
Ma
r-0
9
Ma
y-0
9
A ten-year spread Two-year trailing average Five-year trailing average

Oxera The cost of capital for heat distribution and supply
30
Table 4.4 Spreads on a sample of corporate bonds—regulated networks (bp)
Issue rating Residual maturity (years)
Two-year average spread (bp)
Regulated networks
Terna A+ 10 144
RWE A+ 12 161
Scottish & Southern A+ 13 157
RWE A+ 14 167
Nuon/Alliander A 10 117
Transco A 8 156
United Utilities A 9 164
RWE A 7 89
Transco A 8 156
National Grid A 15 172
Severn Trent A- 8 205
Severn Trent A- 7 218
National Grid A- 11 210
Elia system operator A- 10 110
Energias de Portugal A- 8 185
Transco A- 15 171
Median: regulated networks 10 161
Mean: regulated networks 11 158
Multi-utilities
Energie Oberoesterreich A+ 16 98
EWE A- 10 132
Hera A- 7 176
Median: multi-utilities 10 132
Mean: multi-utilities 11 135
Regulated or partially regulated companies exposed to a degree of demand risk
Belgacom A 7 139
France Telecom A- 11 188
France Telecom A- 9 202
TeliaSonera A- 5 209
Median: regulated or partially regulated companies exposed to a degree of demand risk
8 195
Mean: regulated or partially regulated companies exposed to a degree of demand risk
8 185
Median: A-rated comparators 10 162
Mean: A-rated comparators 10 160
Sources: Datastream; Oxera calculations.
The results in Table 4.4 above show that the average spread for the selected telecoms companies is higher than for the sample of regulated network utilities. This would seem contradictory, as one would expect companies of a similar credit rating to have a similar

Oxera The cost of capital for heat distribution and supply
31
credit spread. However, it should be noted that most of the telecoms bonds are rated A–, and the spreads of these companies are not widely different from other A– bonds for network utilities. In addition, the sample, consisting of only four bonds, is too small to allow the drawing of firm conclusions. As such, this analysis considers the group of A-rated bonds as a whole.
4.3.3 Conclusions In previous decisions, EK has not used a mechanistic approach to setting a range for the debt premium. A possible approach to this exercise is to base the low end of the range on the five-year average spread of the bond index for A-rated debt, and the high end of the range on the median of the two-year average spreads for selected issuances. Based on the sample of selected bonds for A-rated comparators, the high end of the debt premium range can be set to 160bp (see Table 4.4 above). This yields a range of 90bp to 160bp for the debt premium of heat networks (Table 4.5).
Table 4.5 Conclusions—debt premium
Low High
Debt premium 90 160
Sources: Datastream; Oxera analysis.

Oxera The cost of capital for heat distribution and supply
32
5 Cost of capital estimates
This section presents the cost of capital estimates for DHNs, calculated on the basis of the analysis presented in the preceding sections.
The cost of capital is linked to the cost of equity, cost of debt and gearing in the following way: WACC (pre-tax, nominal) = kd * g + ke / (1 – t) * (1 – g), where kd denotes the cost of debt, ke the cost of equity (post-tax), g denotes the level of gearing, and t denotes the corporate tax rate (25.5% in the Netherlands).
To arrive to a WACC in real terms, an assumption for inflation needs to be established.8 This is achieved by combining the two- and five-year averages of realised inflation with the most recent forecast of the Bureau for Economic Policy Analysis (Centraal Planbureau, CPB). This gives a range of 1.6% to 1.8% (see Table 5.1). This assumption is also consistent with historical inflation levels in the Netherlands in the recent past, which have been below, but close to, the European average.
Table 5.1 Inflation range for the assessment of the WACC
2005
realised 2006
realised 2007
realised 2008
realised 2009
realised 2010
forecast Average
Two-year average
1.8 2.4 1.3 1.8
Five-year average
1.4 1.5 1.3 1.8 2.4 1.3 1.6
Sources: Statistics Netherlands; CPB; Oxera calculations.
One approach to estimating the cost of capital involves assuming a 100% share of equity capital. For regulatory purposes, assuming zero gearing would be expected to allow the company at least a sufficient return to cover its cost of capital under any capital structure. A 100% equity-financed structure could be seen to represent an upper limit for the actual cost of capital, and to allow the full recovery of investment costs.
A company might still choose to take on some debt instead of relying on 100% equity finance if it were able to benefit from the lower cost of capital in comparison with that which would apply under a zero gearing assumption, or if it were able to generate other benefits such as access to a liquid source of finance. Therefore, an advantage of assuming an equity-only capital structure in the regulatory determination is that companies are implicitly given discretion to choose the optimal corporate finance policy. Table 5.2 below presents the results at 0% gearing.
8 The inflation rate is used to translate nominal rates into real rates; this is done using the Fischer formula. According to the
Fischer formula, the nominal return (n) is related to the real return (r) and the level of inflation (i) as follows: (1 + n) = (1 + r)*(1 + i).
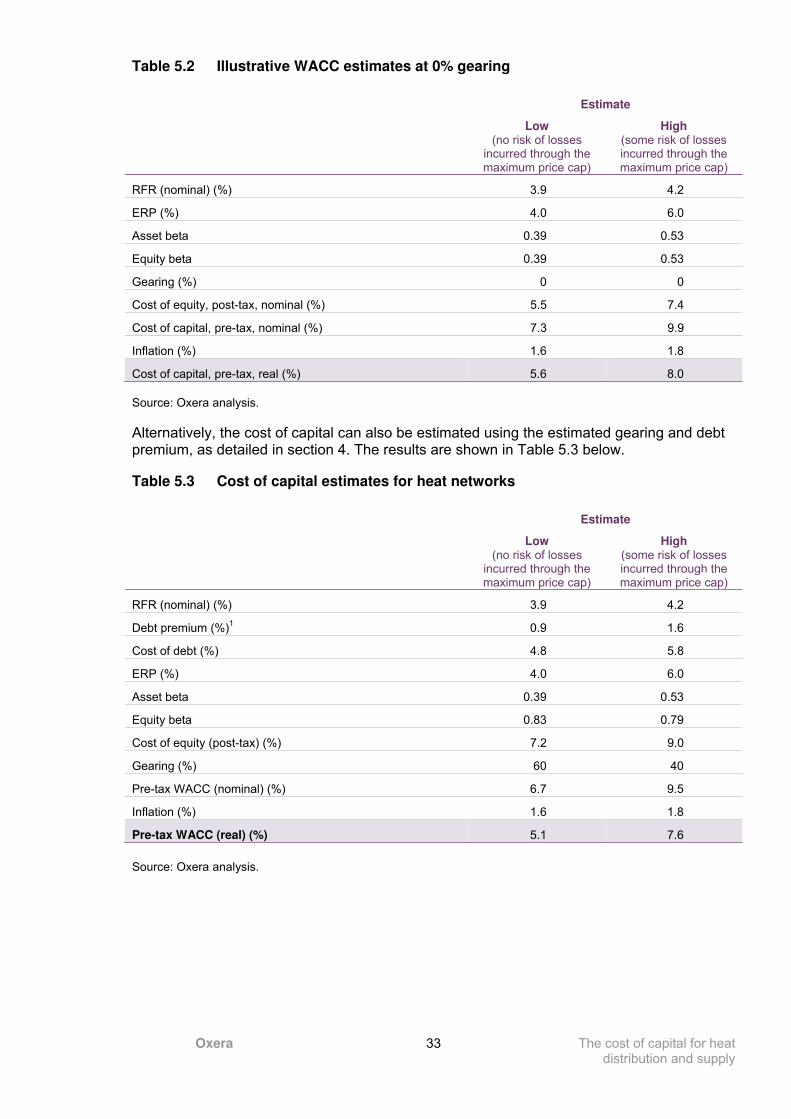
Oxera The cost of capital for heat distribution and supply
33
Table 5.2 Illustrative WACC estimates at 0% gearing
Estimate
Low (no risk of losses
incurred through the maximum price cap)
High (some risk of losses incurred through the maximum price cap)
RFR (nominal) (%) 3.9 4.2
ERP (%) 4.0 6.0
Asset beta 0.39 0.53
Equity beta 0.39 0.53
Gearing (%) 0 0
Cost of equity, post-tax, nominal (%) 5.5 7.4
Cost of capital, pre-tax, nominal (%) 7.3 9.9
Inflation (%) 1.6 1.8
Cost of capital, pre-tax, real (%) 5.6 8.0
Source: Oxera analysis.
Alternatively, the cost of capital can also be estimated using the estimated gearing and debt premium, as detailed in section 4. The results are shown in Table 5.3 below.
Table 5.3 Cost of capital estimates for heat networks
Estimate
Low (no risk of losses
incurred through the maximum price cap)
High (some risk of losses incurred through the maximum price cap)
RFR (nominal) (%) 3.9 4.2
Debt premium (%)1 0.9 1.6
Cost of debt (%) 4.8 5.8
ERP (%) 4.0 6.0
Asset beta 0.39 0.53
Equity beta 0.83 0.79
Cost of equity (post-tax) (%) 7.2 9.0
Gearing (%) 60 40
Pre-tax WACC (nominal) (%) 6.7 9.5
Inflation (%) 1.6 1.8
Pre-tax WACC (real) (%) 5.1 7.6
Source: Oxera analysis.

Oxera The cost of capital for heat distribution and supply
34
6 Cross-checks for the cost of capital
The previous section estimated the cost of capital on the basis of its bottom-up parameters. Other methods can also be used to draw inferences about these estimates. To that end, Oxera has examined information available from the financial accounts of companies with heat network activities.
Under certain circumstances, energy companies may disclose certain types of information that may be relevant to the assessment of the cost of capital for heat. This section examines the following cross-checks:
– discount rates used for calculating impairments; – effective rates on project-specific loans and hybrid capital.
Discount rates used for calculating impairments The discount rates used for the assessment of asset impairment can be considered as a measure of a company’s cost of capital. Most companies are required to review periodically the carrying value of their assets against a measure of their recoverable value. To this end, companies must discount the projected future cash flows relating to these assets using their own estimates of the cost of capital for different business divisions.
For example, Nuon discloses its divisional discount rates on a periodical basis (see Table 6.1). A2A also discloses divisional discount rates (see Figure 6.1 below).
Table 6.1 Discount rates (%) used by Nuon to calculate accounting impairments (pre-tax nominal)
Segment 2007 discount rate 2008 discount rate
Network activities 8.7 7.4
Heat activities 9.5 9.7
Production and supply activities 10.7 9.9
Note: It is not clear whether the ‘heating’ segment includes heat generation as well as distribution and supply. Source: Nuon, ‘Annual Report 2008’, p. 106.

Oxera The cost of capital for heat distribution and supply
35
Figure 6.1 Discount rates used by A2A for different business units
Note: It is not clear whether the ‘heating’ segment includes heat generation as well as distribution and supply. Source: A2A (2008), ‘Annual Report’, p. 70.
The findings in Table 6.1 and Figure 6.1 above provide valuable information on the relative risk exposure of different business activities.9 On this basis, both datasets indicate that heat activities have a higher discount rate than network activities. In addition the data suggests that heat activities are riskier than water and certain environment activities, but less risky than production, supply, gas and certain environment activities.
Effective rates on project-specific loans and hybrid capital Certain companies issue loans and hybrid capital to finance ring-fenced projects, and disclose information on the cost of these issuances. For example, Nuon states that the company has issued risk-bearing loans specifically to finance district heating projects. Nuon also discloses the effective rate paid on these loans, although the calculation of this indicator is not made transparent. Repayment of these loans is conditional on the operating profits of the projects they are intended to finance. The yield on this risk-bearing debt therefore provides a good cross-check for the lower limit of the range for the cost of equity (see Figure 6.2 below).
9 Relative risk can be only be assessed if it is assumed that both Nuon and A2A attribute a proportional share of debt to each
division such that the gearing ratio is constant across divisions. Although the companies’ reporting does not disclose gearing levels at the divisional level, it is not unreasonable to assume that operations are financed at the group level, and therefore that gearing can be assumed constant across business divisions.
10.4%
9.8%
8.8% 8.8%
8.2% 8.2%
6.1%5.9%
0%
2%
4%
6%
8%
10%
12%
Gas Environment Heat Environment Network Network Network Water

Oxera The cost of capital for heat distribution and supply
36
Figure 6.2 Using returns on hybrid capital to estimate the cost of equity for heat projects (illustration)
Source: Oxera.
The effective rate on risk-bearing debt can also be used as a cross-check. For example, Nuon paid effective rates of 8% in 2007 and 2008 on risk-bearing debt issued to finance heating projects.10
Conclusions from cross-checks The evidence from the above cross-checks suggests that a discount rate of 8–9.7% is used to finance the heat activities of multi-utilities. Assuming that the figures are expressed in pre-tax and nominal terms, this is broadly consistent with the range estimated for DHNs in the Netherlands (6.7–9.5%). However, it is unclear what level of gearing is assumed in these numbers, and the difference may be due to the allocation of debt within the corporate structure.
Another useful result from the cross-checks is the relative risk of heat activities in comparison with other business segments. The evidence presented by Nuon indicates that heat networks are more risky relative to other network activities, but safer than production and supply activities; this is consistent with the mix of distribution and supply activities of DHNs. This is not inconsistent with the results presented in this report, which uses network utilities as comparators, because the cost-plus feature of the regulatory regime is expected to mitigate most of the additional risk emerging from the supply activities of heat networks. Moreover, Nuon’s heat activities may include heat generation, which would make it riskier than DHNs. However, given the lack of transparency relating to the parameters used in these cross-checks, precise inferences from these numbers may be misleading.
10
Nuon (2008), ‘Annual Report’, p. 114.
Retu
rns e
xpecte
d b
y in
vesto
rs
Assets
Project
assets
Claims on
assets
Equity
Risk-bearing
loans
Conventional
debt
The cost of
equity needs to
be estimated
The cost of
more senior
liabilities can be
observed with
more accuracy
Senio
rity ra
nkin
g o
f cla
ims (ris
k)

Oxera The cost of capital for heat distribution and supply
37
7 Conclusions
This report has provided an estimate of the cost of capital for DHNs in the Netherlands. It takes into account the proposed regulatory framework, including the effects of the asymmetric risk to which DHNs are exposed due to the imposition of a price cap linked to the cost of the main heating alternative, gas.
The resulting beta estimate, which reflects the risk exposure of heat networks, is presented as a range.
– The low end (0.39) reflects the business risk of heat networks, and is based on market data for regulated utility networks, which are used as a comparator due to their similarities to heat networks and because of the paucity of market data on equity returns for district heating activities. This is also consistent with the multi-utility sample.
– The high end (0.53) is based on companies exposed to a certain degree of demand risk, which is used as a proxy to the effects of the maximum price cap, excluding any mitigating effects from safety nets.
The resulting estimates for the cost of capital for heat networks is in the range 5.6–8.0 (at 0% gearing), or, alternatively, using the debt premium and gearing estimated for Dutch heat networks, 5.1–7.6%.
The robustness of these results relies on the assumption that the effect of demand risk on beta (a symmetric risk, which can be accounted for in the CAPM framework) is a good proxy for the exposure to the maximum price cap (an asymmetric risk, which needs to be accounted for separately). Due to data availability, indicative modelling results using a real options framework are not provided at this stage, but this method could prove to be a useful alternative in estimating the risk exposure of DHNs as new information becomes available.

Oxera The cost of capital for heat distribution and supply
38
A1 Methodology for assessing asymmetric risk
This appendix describes an alternative approach to estimating the impact of asymmetric risk. This approach, based on the theory of real options, has the potential to provide a more precise estimate and is more firmly theoretically founded than an adjustment to the asset beta.
This section discusses the implications of the asymmetric risk arising from the imposition of a maximum price cap. More specifically, it addresses the following.
– The rationale for using a real options framework in the presence of asymmetric risk is discussed in section A1.1.
– An analytical framework to assess the asymmetric risk and estimate the appropriate compensation for DHNs, reviewed in section A1.2.
– The implementation of the proposed approach and estimation of the required compensation, detailed in section A1.3, feasibility and related data requirements.
A1.1 Rationale for using real options framework
Oxera understands that, in the proposed regulatory regime for heat networks, there are two main components of the regulatory price-setting mechanism: the maximum price (MP) and the reasonable price (RP).
In the absence of fully adequate compensatory measures, investors in DHNs might face an asymmetric risk. The CAPM framework does not address the issue of asymmetric risk (it assumes a symmetric distribution of returns), but the fact that investors require compensation for it is well established, in both corporate finance theory and regulatory practice.
What causes asymmetric risk and expected under-recovery? Oxera understands that the new regulatory regime for heat specifies two price references for DHNs: RP, which approximates the costs of providing the service, and MP, which approximates the costs to customers of using gas heating. DHNs can charge RP as long as it does not exceed MP, in which case they can charge only maximum prices. Therefore, so long as there is a non-zero probability that MP falls below RP, DHNs will face an asymmetric risk and would rationally expect a certain value to be lost due to this asymmetry.
This would in practice transform a profitable investment into a negative net-present-value investment. Therefore, the prospect of maximum price regulation would lead to underinvestment or abandonment of the project.
This issue is sometimes termed the ‘truncation problem’, in reference to the resulting shape of the probability distributions in returns facing project sponsors (see Figure A1.1 below). The figure shows the total gross return, including cost recovery. As one moves to the right, the network needs to recover higher costs (RP increases) but these are truncated at the MP level.

Oxera The cost of capital for heat distribution and supply
39
Figure A1.1 Effect of price capping on expected returns
Source: Oxera.
Why are real options useful to account for the implications of asymmetric risk? Figure A1.2 below illustrates the pay-off structure of this real option—in good times, consumers pay the RP of district heating up to the point at which the price of gas reaches the level that makes gas heating more competitive (M*); beyond that point consumers pay the MP of gas heating as it decreases with the price of gas (bad times). This real option has a value for consumers, and represents a cost for investors. This is because consumers are protected from the downside (ie, protected against heat becoming relatively expensive relative to gas boilers) at the expense of DHNs and their investors.
Figure A1.2 Illustration of pay-off for constant RP, uncorrelated to gas prices
Note: The solid bold line represents the price a DHN is allowed to charge. This simplified example assumes that the reasonable price is invariant to gas prices. Source: Oxera.
Figure A1.3 illustrates the implications of a non-constant RP. For example, if RP is positively correlated with the price of gas, a network would be allowed to charge more in times where no cap applies (to the left of the chart), and would lose less—ie, the difference between RP and MP would be smaller—in times where the cap does apply (to the right of the chart).
Modified mean
expected return
– Probability-weighted returns +
‘Maximum
price’ cap
Distribution of gross returns subject to cap
Pri
ce
Gas price (inverted scale)
Maximum
price
M*
Reasonable
price
For low gas prices a
DHN would not be able to charge RP but would
be capped at MP

Oxera The cost of capital for heat distribution and supply
40
Figure A1.3 Illustration of pay-off for variable RP, with a degree of correlation to gas prices
Note: The solid bold line represents the price a DHN is allowed to charge. Source: Oxera.
Real option theory might be helpful in quantifying the necessary compensation required so that investors, on average, can expect to recover in full their investments and their required return. The compensation would take into account the irreversibility of the investments in heating networks while keeping NPV at zero.
The value loss from the asymmetric risk is independent of any potential compensatory mechanisms. However, to the extent that such a mechanism would actually compensate the company for all, or a portion of, the value lost, the net required compensation to the company would be reduced. Therefore, a two-step approach is required:
1) an estimation of the value that is expected to be lost due to a network’s exposure to asymmetric risk;
2) the degree to which that expected value loss can be recovered through compensatory mechanisms.
This is discussed in more detail in sub-section A1.3.5, and will be considered separately from the estimation of the required compensation for asymmetric risk.
A1.2 Proposed analytical framework
This section proposes an analytical framework to assess the impact of asymmetric risk by valuing a real option, both in principle and given practical constraints.
Using a real option framework, the approach to estimating the exposure of a DHN to the asymmetric risk involves estimating the value of the price cap faced by a DHN whenever MP falls below RP. This involves three elements, as illustrated in Figure A1.4.
Pri
ce
Gas price (inverted scale)
Maximum
price
M*
Reasonable
price

Oxera The cost of capital for heat distribution and supply
41
Figure A1.4 Valuation of the cap on price
Note: Year N represents the investment horizon of a typical investor in a DHN. Source: Oxera.
These elements can be described as follows.
– Probability of being capped. The probability that RP will be capped by MP is equivalent to the probability that investors will be exposed to negative returns in a given year. This probability will vary from year to year as the relative level of MP and RP changes.
– Expected loss given the occurrence of a cap. Estimation of the yearly cash-flow shortfall to which investors would be exposed if MP were to fall below RP. This requires an estimation of the expected difference between MP and RP when a cap occurs.
– Option value for the cap. This represents the amount required to compensate investors for the expected loss in a given year. The option value (V) each year can be computed directly or indirectly, as described below.
The total value of the option can then be obtained by adding each individual yearly option across the time horizon, in present-value terms.
In cases where RP is not assumed to remain constant over time, it is important to carefully estimate its expected future correlation with MP. A high and low correlation have quite distinct implications for the likelihood of a cap (ie, MP being less than RP), as illustrated in Figure A1.5.
Year 1
Probability of being capped
Year 2
Expected loss (EL) given cap
Prob 1 (MP < RP)
Option value (V) for cap
The value of the cap for all N years is the
sum, in present value, of all N options
Year N
EL1
Prob 2 (MP < RP) Prob N (MP < RP)
EL2 ELN
V1 V2 VN

Oxera The cost of capital for heat distribution and supply
42
Figure A1.5 Correlation between RP and MP
Source: Oxera
The charts in Figure A1.5 illustrate that low, or negative correlation, could lead to more uncertainty around the future relative level of MP and RP. Correlation between the two variables is therefore an important input in the estimation of the compensation required for exposure to asymmetric risk.
Ultimately, the analysis would require reliable information on MP, RP and their drivers, which include prices of different energy sources (gas, electricity, etc), as well as operating and capital costs for DHNs. This information could be used to estimate the expected level, volatility and correlation of MP and RP. These parameters would in turn be fed into one of the proposed methods to provide a fairly robust estimate of the asymmetric risk faced by DHNs.
A1.3 Estimation methodology
The required compensation for the exposure to asymmetric risk could be estimated using one of the following methods.
– Direct estimation. This method would involve the calculation of the expected pay-off of the options in terms of simple formulae, as outlined in Appendix 2. Inputs required for such estimation include the expected value and volatility of MP, time horizon, discount rate (risk neutral) and the level of RP.
– Indirect estimation. The required compensation could also be estimated indirectly using the underlying probability of being capped and the expected loss given a cap. The binomial tree method is an example of an indirect estimation. Other, more complex, simulation methods could also be used to conduct such estimation (see Appendix 2).
These methods, reviewed in detail in Appendix 2, would require specific assumptions on MP, RP, their level of correlation, and the appropriate time horizon. These are discussed next.
A1.3.1 Maximum price The future level of MP would need to be estimated on the basis of historical or spot data for each underlying component. Because the price of gas is an important driver of uncertainty in MP, the analysis would rely on the statistical distribution of that variable, more precisely, on its mean and volatility. These could be used to estimate the expected value and volatility of future gas prices.
Year 1 Year 2 Year 3 Year 4 Year 5
RP MP
Correlation of -0.8
Year 1 Year 2 Year 3 Year 4 Year 5
RP MP
Correlation of +1.0

Oxera The cost of capital for heat distribution and supply
43
All other components of MP could be assumed to remain fixed for the purposes of calculating the MP. In addition, the current level of MP could be used to ensure that the forecasts are broadly sensible.
A1.3.2 Reasonable price Once the regulatory mechanisms are finalised and implemented, the current RP may be observed for each individual network. Depending on data availability, the proposed analysis would consider one or all of the following:
– RP is assumed to remain constant at a certain level;
– RP is assumed to evolve in a particular way, based on, for instance, an assumed correlation between RP and MP (see section A1.3.3 for a discussion on correlation);
– RP is assumed to evolve as a random variable, in which case an assumption about its expected level and volatility will be necessary.
A question can be raised as to whether the level of RP can be determined as one measure for all networks, or whether it is necessary to have one value of RP for each network. On the one hand, determining an average value for all networks—which could be based on the average remaining life of the networks—can be a preferred solution given its practicality and simplicity. On the other hand, not all networks will have the same operating costs, and therefore attributing an ‘average’ RP to all networks will over-compensate some and under-compensate others.
One factor which is expected to affect RP is the remaining useful life of the network’s assets. For a new network being built to supply heat to a planned residential development, the RP can be expected to decline over time, as the residential development expands and more customers get connected. On the other hand, for an established network providing heat to a stable set of customers, the RP will vary according to the cost components of the DHN and its exposure to input (ie, energy) prices.
This suggests that, by assuming a constant RP, the analysis would over-estimate the option value for new networks. This is because a declining RP over the first years of a new network’s operation will reduce the probability that MP<RP (ie, the probability of being capped) in comparison with the base case in which RP is fixed at the current, higher, level.
To mitigate this problem, the analysis could consider RP for a group of networks that contain a mix of older and newer networks. By grouping networks, the results would also encompass an element of the pooling mechanism, which is described in the next section. However, this would hold only in cases in which some of the grouped networks are capped while others are not.
Ultimately, a reasonable assumption would be made for RP based on the information that is available.
A1.3.3 Correlation between MP and RP As outlined in the sub-sections above, another important factor is the degree of correlation between MP and RP. In the absence of concrete historical data that might be used to estimate the correlation between the two variables, the correlation assumption could be based on observable energy prices that feed into MP and RP. For example, if electricity prices are determined to be an important determinant of RP, the correlation between the Dutch electricity and gas indices could be used as an estimate.
To test the robustness of the results, a sensitivity analysis could be conducted. This would assess the impact on the option value of replacing a constant RP with a value that fluctuates along with movements in MP, based on different assumed correlations.

Oxera The cost of capital for heat distribution and supply
44
A1.3.4 Time horizon The option value should be calculated on the basis of a maturity equal to the useful life of the networks, using all information available at the time of estimation (ie, without adjusting the option value over the asset life as new information comes in). To see why this is appropriate, it is worth considering the case if the option value is re-calculated every year. If, five years later, the price of gas heating unexpectedly falls by a large amount, the option will increase in value, and, as a result, RP will increase for the following year. However, this is exactly at a time where the network faces the maximum price cap (because gas heating is now much cheaper) and therefore the network cannot be compensated for the option value through RP. This simple example illustrates the necessity of estimating the option value for the whole life of the assets, and allowing networks to recover that value from the onset.
A1.3.5 Compensatory mechanisms These mechanisms are one way in which DHNs (and their investors) can recover part of the cost resulting from their exposure to asymmetric risk. Two compensatory mechanisms have been proposed: a pooling mechanism and a loss carry forward mechanism. Ultimately, the analysis would examine the extent to which these measures compensate for the exposure of DHNs to asymmetric risk. However, as discussed below, the precision with which this question can be answered would depend on the level of detail that can be provided about these mechanisms.
Pooling mechanism This mechanism allows groups that operate multiple heat networks to cross-subsidise across the networks. The proposed working details of the pooling mechanism are reviewed in Box A1.1.
Box A1.1 Proposed pooling mechanism
The proposed pooling mechanism works as follows.
Assume two networks, both owned by the same group. The networks face the same MP but each has its own RP (RP1 and RP2).
Assume that Network 1 can charge only MP (because MP<RP1), and that Network 2 is able to charge its full RP (because MP>RP2).
By using the pooling mechanism, the second network would be able to charge either RP2 + (RP1 – MP) or MP, whichever is less.
Source: Oxera, based on explanation by Energiekamer.
The likely effects of the pooling mechanism on groups of networks that regulated under the proposed cap could be estimated using the same assumptions on RP and MP as those used for the valuation exercise.
Loss carry forward mechanism New networks that are exposed to losses due to the maximum price cap may be able to carry forward these losses for future recovery, provided that the networks are expected to be financially viable in the long term.
A1.3.6 Estimation of appropriate compensation for asymmetric risk The final stage of implementation would combine MP, RP, and compensatory mechanisms to estimate the level of compensation needed by DHNs to offset the presence of asymmetric risk.
The option value can be translated into an upward adjustment to the cost of capital for DHNs. This uplift can be set such that, in expectations, an investor recovers the full initial investment

Oxera The cost of capital for heat distribution and supply
45
over the investment horizon despite the price charged by DHNs being capped by MP in some years. In the event that a network is financed by equity only, this would correspond to an uplift on the cost of equity. Data requirements for this approach include the value of fixed assets (ie, capital equipment for district heat networks). For example, if the expected loss for three years is equal to €3 and the value of total assets is €100 (assumed constant across years for this illustration), the required uplift on the cost of capital is 1%, as this would allow the company to recover €1 in each year, giving a total of €3. Note that an uplift on the cost of capital allows the company to recover losses (on an expected value basis) in each year, regardless of whether the loss actually occurs ex post. This mechanism can be compared to an insurance premium, which is paid regardless of whether or not an ‘insured event’ occurs.
The proposed analysis would translate the impact of the asymmetric risk into a range for the cost of equity by combining the results with the analysis of systematic risk.

Oxera The cost of capital for heat distribution and supply
46
A2 Asymmetric risk: technical details
In general, there are three approaches to calculating the option value, all of which will deliver the same results.
– Partial differential equations. Depending on the complexity of the problem, it is sometimes possible to derive closed-form solutions to value options. This procedure involves the analytical or numerical solution of partial differential equations.
– The ‘expectations’ approach. This approach relies on being able to calculate expectations of the pay-off of the option in terms of simple formulae.
– Monte Carlo simulation. The use of this method allows the simulation of many sample paths, given structural form and parameters. The simulation allows the identification of the statistical distribution around MP and therefore allows an estimation of the probability of MP being below RP.
A2.1 Estimating MP
Given that MP is a function of gas prices, it necessary to assess its dynamics. It is common to assume that gas prices follow a mean-reverting process, which can be described, in continuous-time t, as follows:
Equation A2.1 dP 噺 が盤P岫t岻 伐 P匪dt 髪 げdz
where P is the log of spot gas price (daily); 鶏岫建岻 is a time-dependent seasonal trend of gas price (in log form); 紅 伴 ど is the speed of mean reversion, 穴権 denotes random shocks
(normally distributed); and 絞 is the volatility of the shocks to the increments of gas prices. The intuition behind the equation is that gas prices will be subject to random shocks, given
by the term 絞穴権, but that prices will be ‘pulled’ to their seasonal trend 鶏岫建岻┻ For example, if a
series of positive shocks drive gas prices above their long-term equilibrium, the term 鶏岫建岻 伐 鶏 becomes negative, so this induces a negative drift in the process that forces gas prices P(t)
to revert to its mean 鶏岫建岻.
Independently of the approach used to value the option created by the maximum price cap, it will be necessary to estimate the parameters used in Equation A2.1. The standard approach is to transform the continuous-time Equation A2.1 into a discrete-time equation and to a level of detail that matches the dataset, and to apply it daily for gas prices. The discrete version of Equation A2.1 is known as an AR(1) process and its parameters are straightforward to calculate using standard regression techniques.
If a Monte Carlo approach is employed to value the real option held by consumers, this requires the simulation of gas prices based on the estimated AR (1) process. The key element provided by the Monte Carlo simulation is that the simulation of the paths of gas prices will allow an estimation of the probability of MP being greater than RP. Moreover, it is noted that, in a simple setting, where the shocks to the price process in Equation A2.1 are Gaussian, it is possible to calculate the probability of gas prices being above or below M*.

Oxera The cost of capital for heat distribution and supply
47
A2.2 Estimating RP
One approach to presenting variability in the delivery-dependent cost component is to assume a heat price structure similar to the gas price structure.
Equation A2.2 dH 噺 ゎ岫H拍 岫t岻 伐 H岻dt 髪 ぐdw where H is a spot price of heat (daily); 茎(t) is a time-dependent seasonal trend of the heat price; 糠 is the speed of mean reversion; and 紘denotes the random shocks with volatility 紘.
Importantly, as 茎(t) will be estimated using historical data but used to infer forward-looking prices, the presence of structural changes would bias the results of the estimation exercise.
It might be reasonable to assume that heat prices, similar to gas prices, follow an autoregressive process of order one (ie, an AR(1)) with a degree of mean reversion.
As in the case of gas prices, for the purposes of Monte Carlo simulation, it is necessary to estimate all the parameters of the equation presented above, where daily heat prices are known variables.
The degree of correlation with gas prices (ie, the correlation between 穴拳 and 穴権) might be estimated using historical data. For this purpose, it may be necessary to gain access to actual pricing arrangement between heat networks and electricity plants which produce combined heat and power (CHP). In general, Monte Carlo analysis can be used for the estimation of two correlated processes, given that the coefficient of correlation is known.

Oxera The cost of capital for heat distribution and supply
48
A3 Statistical tests of beta estimates
The ordinary least square (OLS) regressions used to estimate the beta build on a set of ‘standard assumptions’ that the error term in the regression follows a normal distribution and does not exhibit heteroscedasticity or autocorrelation. In practice, violation of these assumptions does not invalidate the estimate of the beta, but it undermines its reliability: while OLS estimates remain unbiased, the procedure no longer produces the least variance estimator, meaning that the beta estimate may be more uncertain than indicated by the OLS standard errors. Failure of normality could indicate the presence of outliers, which raises questions about the robustness of the estimates.
A number of standard diagnostic tests have been carried out to detect heteroscedasticity, autocorrelation and non-normal distribution of the regression residuals. Separate tests were conducted based on daily and weekly data. The following tests were conducted:
– Durbin alternative test for autocorrelation; – Durbin Watson test for autocorrelation; – Breusch-Pagan/Cook-Weisberg test for heteroscedasticity; – White test for heteroscedasticity; – Skewness and kurtosis test for normality.
The results are tested at the 5% significance level. In general, the results vary from company to company, and a test failure tends to occur more frequently for weekly estimates. In general, heteroscedasticity is detected in about half of the companies concerned. Around a third of the companies exhibit some degree of autocorrelation. The error terms do not seem to follow a normal distribution based on skewness and kurtosis tests.
Results are summarised in Table A3.1 below, which lists the average and median beta estimates for each group of comparators, but excludes those estimates that fail the autocorrelation or heteroscedasticity tests, separately.

Oxera The cost of capital for heat distribution and supply
49
Table A3.1 Beta estimates for groups of comparators (median)
Asset beta (daily) Asset beta (weekly)
Full sample
Regulated networks 0.39 0.45
Multi-utilities 0.37 0.47
Regulated and partly regulated companies exposed to a degree of demand risk
0.50 0.57
‘No autocorrelation’ estimates
Regulated networks 0.38 0.46
Multi-utilities 0.37 0.47
Regulated and partly regulated companies exposed to a degree of demand risk
0.50 0.61
‘No heteroscedasticity’ estimates
Regulated networks 0.38 0.45
Multi-utilities 0.37 0.54
Regulated and partly regulated companies exposed to a degree of demand risk
0.52 0.60
Note: ‘No autocorrelation’ estimates consist of estimates that do not fail at least one of the two autocorrelation tests. ‘No heteroscedasticity’ estimates consist of estimates that do not fail at least one of the two heteroscedasticity tests. Sources: Bloomberg; Datastream; Oxera calculations.
As Table A3.1 shows, the medians for the estimates that do not fail the autocorrelation test are almost identical to the full sample results for each group of comparators, with the difference ranging between 0.00 and 0.01 in all cases except for the weekly estimates of those companies in the sample of regulated and partially regulated companies with a degree of exposure to demand risk. On balance, autocorrelation does not appear to significantly bias the estimates.
Table A3.1 also reports the effects of removing the estimates that fail the heteroscedasticity test. It shows that the results are also almost identical to the full sample results for each group of comparators, with the difference ranging between 0.00 and 0.02 in all cases except for the weekly estimates of the multi-utilities sample. The large sensitivity of the estimates for the multi-utility sample is mainly due to the smaller number of observations in that sample. On balance, heteroscedasticity does not appear to significantly bias the estimates.

www.oxera.com
Park Central 40/41 Park End Street
Oxford OX1 1JD United Kingdom
Tel: +44 (0) 1865 253 000 Fax: +44 (0) 1865 251 172
Stephanie Square Centre Avenue Louise 65, Box 11
1050 Brussels Belgium
Tel: +32 (0) 2 535 7878 Fax: +32 (0) 2 535 7770
Thavies Inn House 7th Floor
3/4 Holborn Circus London EC1N 2HA
United Kingdom
Tel: +44 (0) 20 7822 2650 Fax: +44 (0) 20 7822 2651