the cost of capital: misunderstood, misestimated and …
TRANSCRIPT

THE COST OF CAPITAL: MISUNDERSTOOD, MISESTIMATED AND MISUSED!
Aswath Damodaran

THE ULTIMATE MULTI-PURPOSE TOOL: AN OPPORTUNITY COST & OPTIMIZING TOOL

3
The Mechanics of Computing the Cost of Capital
Cost of Equity Weight of equity Cost of Debt Weight
of Debt
Risk free Rate
Risk Premium Risk free Rate Default Spread (1- tax rate)
Cost of Capital
X + X
+ +[ ]
=
What should we use as the risk free rate?What equity risks are rewarded?Should we scale equity risk across companies?How do we measure the risk premium per unit of risk?
How do we estimate the default spread?What tax rate do we use?
What are the weights that we attach to debt and equity?

4
In investment analysis: The cost of capital as a hurdle rate & opportunity cost
The cost of capital for an investment
Should reflect the risk of the investment, not the entity taking the investment.Should use a debt ratio that is reflective of the investment's cash flows.
The Hurdle Rate
Accounting TestReturn on invested capital (ROIC) > Cost of Capital
Time Weighted CF TestNPV of the Project > 0
Time Weighted % ReturnIRR > Cost of Capital
No risk subsidiesIf you use the cost of capital of the company as your hurdle rate for all investments, risky investments (and businesses) will be subsidized by safe investments.(and businesses).
No debt subsidiesIf you fund an investment disprportionately with debt, you are using the company's debt capacity to subsidize the investment.
5
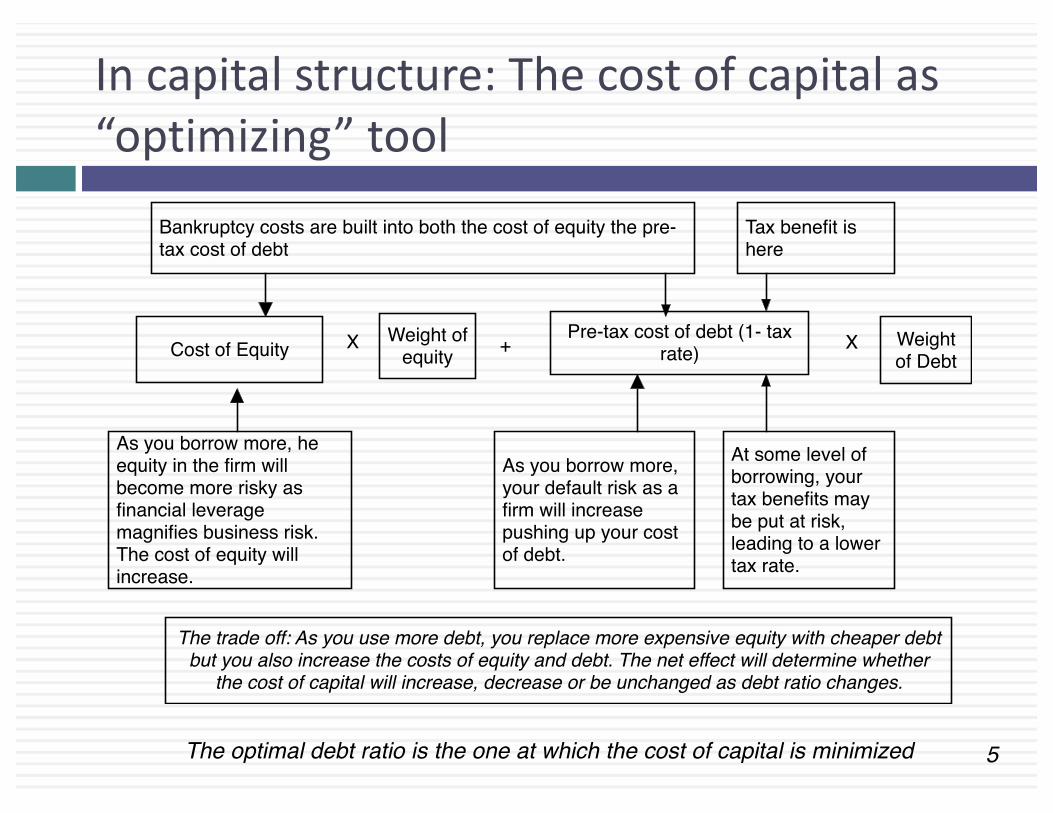
In capital structure: The cost of capital as “optimizing” tool
The optimal debt ratio is the one at which the cost of capital is minimized
As you borrow more, he equity in the firm will become more risky as financial leverage magnifies business risk. The cost of equity will increase.
Cost of EquityWeight of
equityPre-tax cost of debt (1- tax
rate)Weight of Debt
X + X
As you borrow more, your default risk as a firm will increase pushing up your cost of debt.
At some level of borrowing, your tax benefits may be put at risk, leading to a lower tax rate.
Bankruptcy costs are built into both the cost of equity the pre-tax cost of debt
Tax benefit ishere
The trade off: As you use more debt, you replace more expensive equity with cheaper debt but you also increase the costs of equity and debt. The net effect will determine whether
the cost of capital will increase, decrease or be unchanged as debt ratio changes.
6
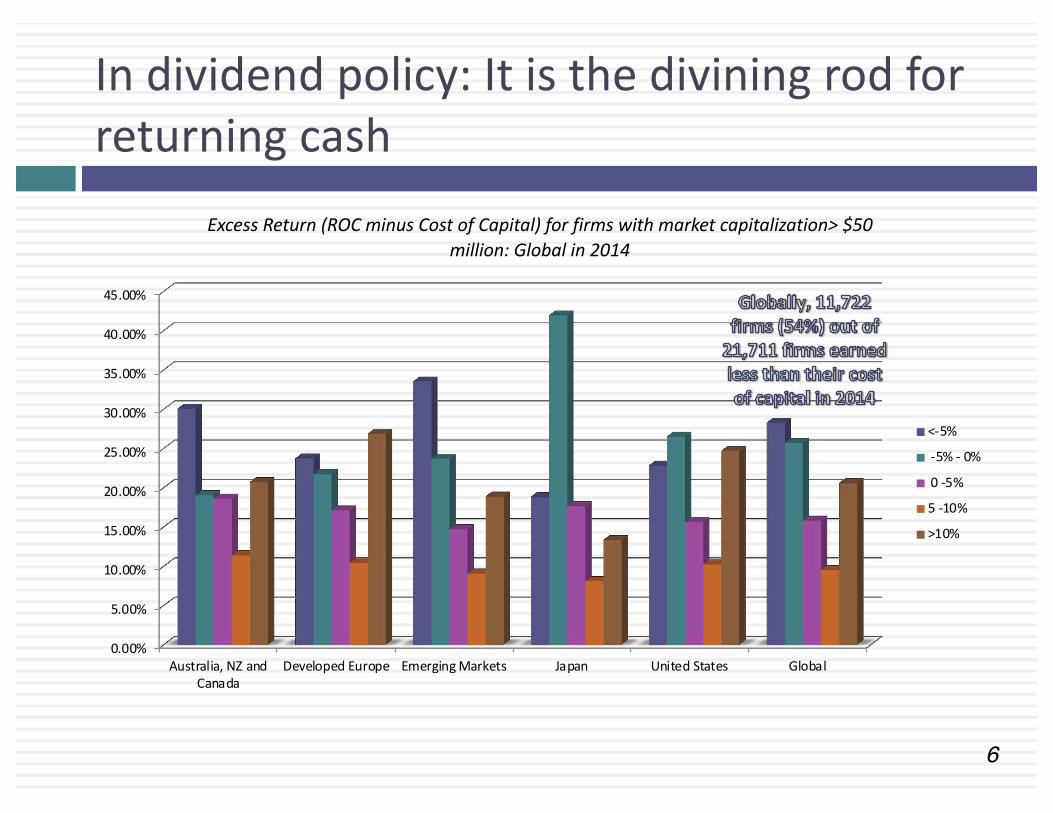
In dividend policy: It is the divining rod for returning cash
0.00%
5.00%
10.00%
15.00%
20.00%
25.00%
30.00%
35.00%
40.00%
45.00%
Australia, NZ andCanada
Developed Europe Emerging Markets Japan United States Global
Excess Return (ROC minus Cost of Capital) for firms with market capitalization> $50 million: Global in 2014
<-5%
-5% - 0%
0 -5%
5 -10%
>10%
7
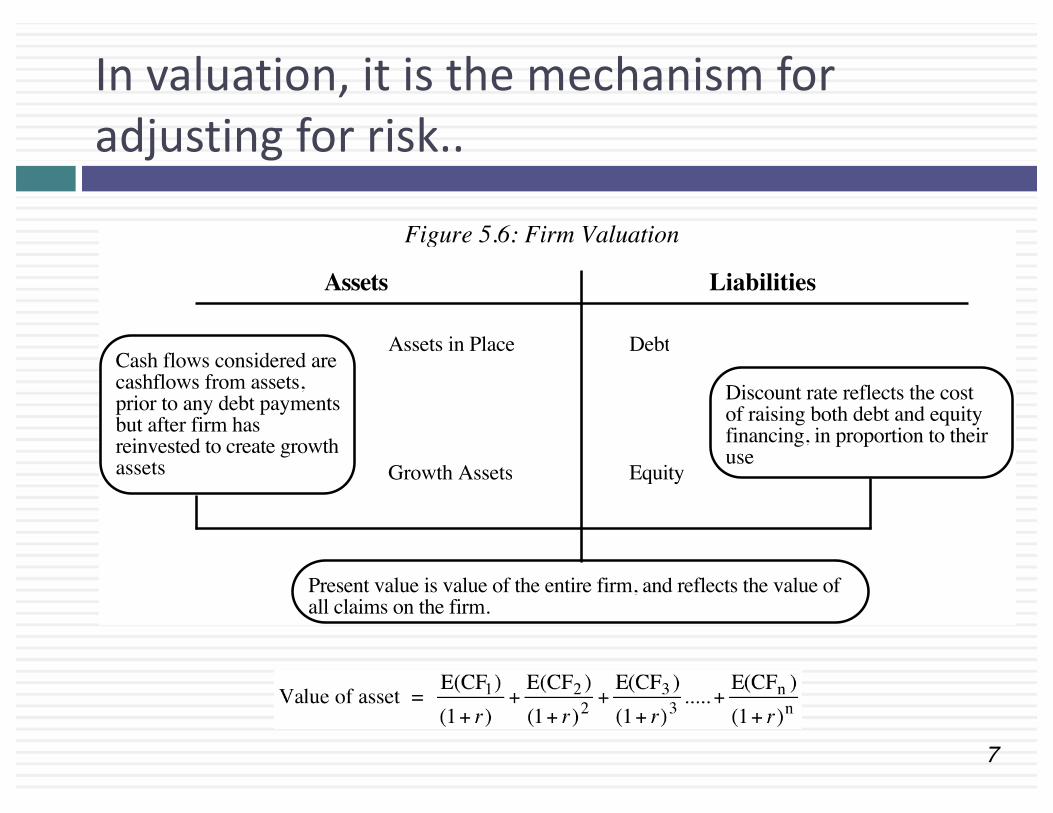
In valuation, it is the mechanism for adjusting for risk..
Assets Liabilities
Assets in Place Debt
Equity
Discount rate reflects the cost of raising both debt and equity financing, in proportion to their use
Growth Assets
Figure 5.6: Firm Valuation
Cash flows considered are cashflows from assets, prior to any debt paymentsbut after firm has reinvested to create growth assets
Present value is value of the entire firm, and reflects the value of all claims on the firm.

8
Though you can value with just an equity focus..
Assets Liabilities
Assets in Place Debt
EquityDiscount rate reflects only the cost of raising equity financingGrowth Assets
Figure 5.5: Equity Valuation
Cash flows considered are cashflows from assets, after debt payments and after making reinvestments needed for future growth
Present value is value of just the equity claims on the firm

9
Both costs are sometimes disguised under a different names..
¨ In real estate, the cost of equity or capital is often called a “capitalization” or “cap” rate. It is used to capitalize the income on a real estate property to get to its value:Value of property (or business) = Income/ Cap Rate
¨ Since the cap rate is just a euphemism for discount rate, to understand what cap rate to use, you have to look at the numerator:¤If the numerator is net income (after interest expenses and taxes), it is the cost of equity.¤If the numerator is pre-tax net income (after interest expenses but before taxes), is a pre-tax cost of equity.¤If the numerator is operating income after taxes (before interest expenses), it is the cost of capital.¤If the numerator is operating income before taxes, it is the pre-tax cost of capital.
10
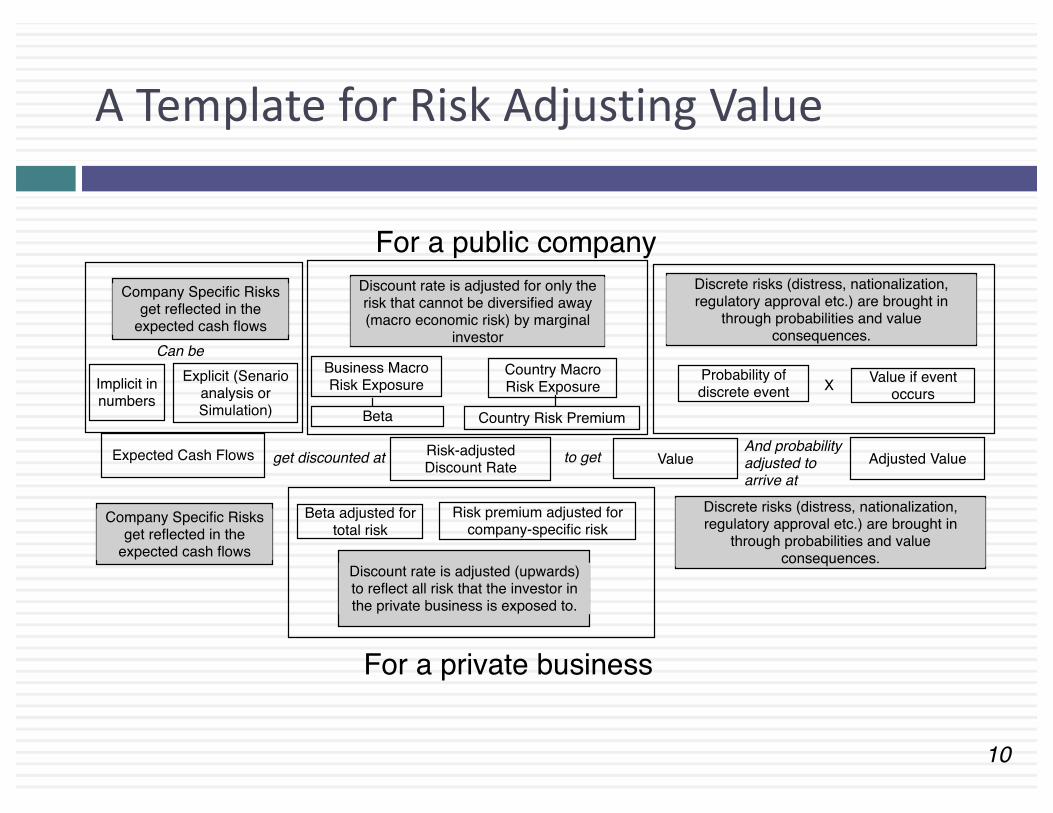
A Template for Risk Adjusting Value
Expected Cash Flows Risk-adjusted Discount Rate Value
Company Specific Risks get reflected in the
expected cash flows
Discount rate is adjusted for only the risk that cannot be diversified away (macro economic risk) by marginal
investor
get discounted at to get Adjusted Value
Discrete risks (distress, nationalization, regulatory approval etc.) are brought in
through probabilities and value consequences.
And probability adjusted to arrive at
For a public company
Company Specific Risks get reflected in the
expected cash flowsDiscount rate is adjusted (upwards) to reflect all risk that the investor in the private business is exposed to.
Discrete risks (distress, nationalization, regulatory approval etc.) are brought in
through probabilities and value consequences.
Business Macro Risk Exposure
Country Macro Risk Exposure
Beta Country Risk Premium
Probability of discrete event
Value if event occursImplicit in
numbersExplicit (Senario
analysis or Simulation)
Beta adjusted for total risk
Risk premium adjusted for company-specific risk
For a private business
Can be
X

11
What the cost of capital is not..
1. It is not the cost of equity: There is a time and a place to use the cost of equity and a time a place for the cost of capital. You cannot use them interchangeably.
2. It is not a return that you would like to make: Both companies and investors mistake their “hopes” fore expectations. The fact that you would like to make 15% is nice but it is not your cost of capital.
3. It is not a receptacle for all your hopes and fears: Some analysts take the “risk adjusting” in the discount rate too far, adjusting it for any and all risks in the company and their “perception” of those risks.
4. It is not a mechanism for reverse engineering a desired value: A cost of capital is not that discount rate that yields a value you would like to see.
5. It is not the most important input in your valuation: The discount rate is an input into a discounted cash flow valuation but it is definitely not the most critical.
6. It is not a constant across time, companies or even in your company’s valuation.
I. THE RISK FREE RATE
Feel the urge to normalize?
13
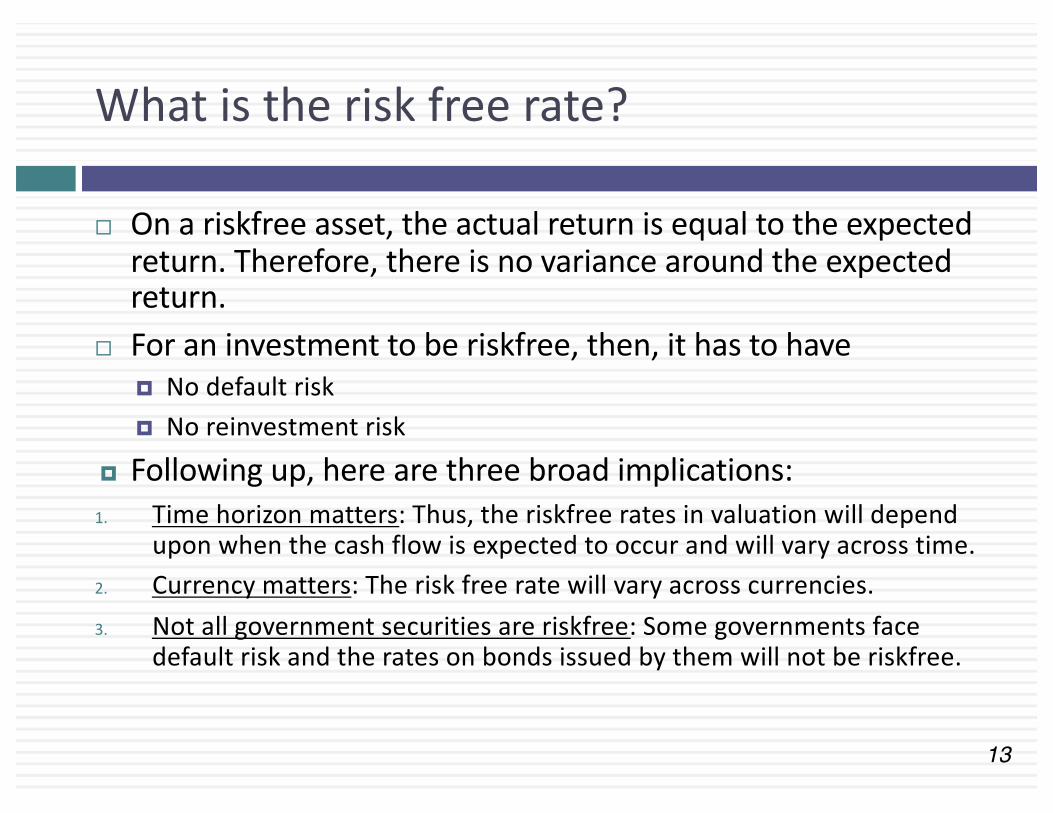
What is the risk free rate?
¨ On a riskfree asset, the actual return is equal to the expected return. Therefore, there is no variance around the expected return.
¨ For an investment to be riskfree, then, it has to have¤ No default risk¤ No reinvestment risk
¤ Following up, here are three broad implications:1. Time horizon matters: Thus, the riskfree rates in valuation will depend
upon when the cash flow is expected to occur and will vary across time. 2. Currency matters: The risk free rate will vary across currencies.3. Not all government securities are riskfree: Some governments face
default risk and the rates on bonds issued by them will not be riskfree.
14
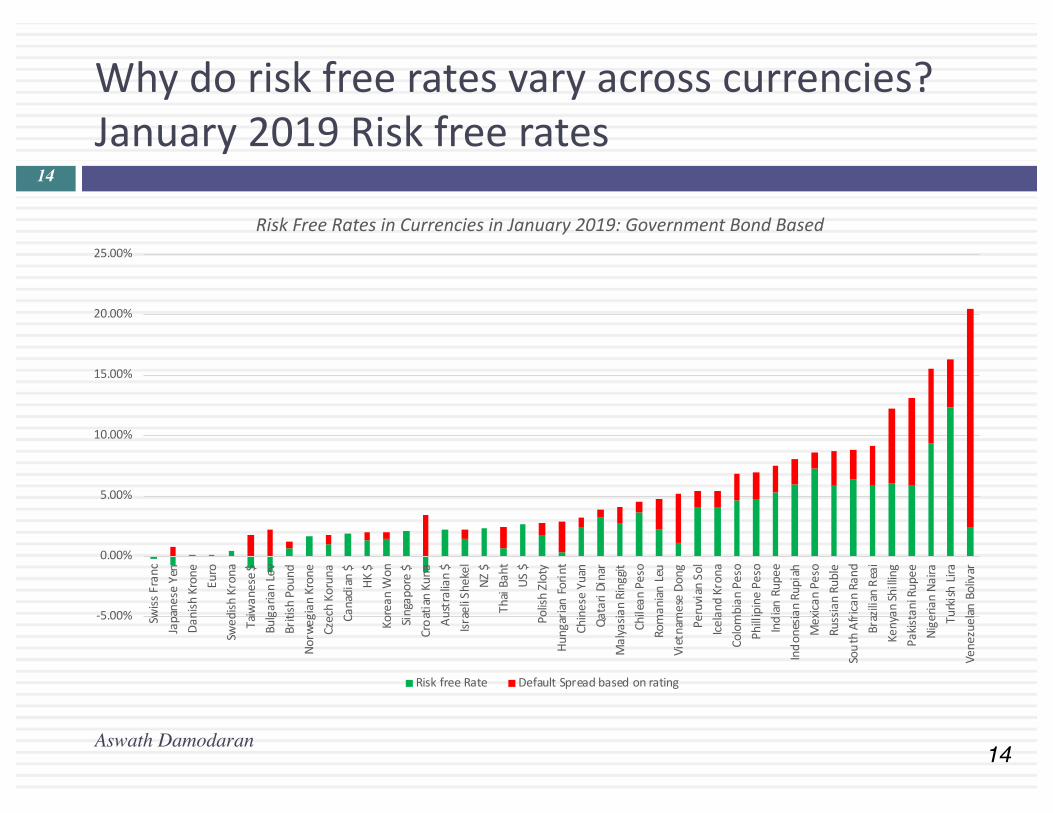
Why do risk free rates vary across currencies?January 2019 Risk free rates
Aswath Damodaran
14
-5.00%
0.00%
5.00%
10.00%
15.00%
20.00%
25.00%
Swis
s Fr
anc
Japa
nese
Yen
Dan
ish
Kron
e
Euro
Swed
ish
Kron
a
Taiw
anes
e $
Bulg
aria
n Le
v
Briti
sh P
ound
Nor
weg
ian
Kron
e
Czec
h Ko
runa
Cana
dian
$
HK
$
Kore
an W
on
Sing
apor
e $
Cro
atia
n Ku
na
Aus
tral
ian
$
Isra
eli S
heke
l
NZ
$
Thai
Bah
t
US
$
Polis
h Zl
oty
Hun
gari
an F
orin
t
Chin
ese
Yuan
Qat
ari D
inar
Mal
yasi
an R
ingg
it
Chile
an P
eso
Rom
ania
n Le
u
Viet
nam
ese
Don
g
Peru
vian
Sol
Icel
and
Kron
a
Colo
mbi
an P
eso
Phill
ipin
e Pe
so
Ind
ian
Rupe
e
Ind
ones
ian
Rupi
ah
Mex
ican
Pes
o
Russ
ian
Rubl
e
Sou
th A
fric
an R
and
Braz
ilian
Rea
i
Keny
an S
hilli
ng
Paki
stan
i Rup
ee
Nig
eria
n N
aira
Turk
ish
Lira
Vene
zuel
an B
oliv
ar
Risk Free Rates in Currencies in January 2019: Government Bond Based
Risk free Rate Default Spread based on rating

15
Why is the risk free rate so low?

16
When the risk free rate changes, the rest of your inputs will as well!

II. THE EQUITY RISK PREMIUM
Using history as a crutch?

18
What is the Equity Risk Premium?
¨ Intuitively, the equity risk premium measures what investors demand over and above the riskfree rate for investing in equities as a class. Think of it as the market price for taking on average equity risk.
¨ It should depend upon¤ The risk aversion of investors¤ The perceived risk of equity as an investment class
¨ Unless you believe that investor risk aversion and/or that the perceived risk of equity as a class does not change over time, the equity risk premium is a dynamic number (not a static one).

19
The Historical Risk Premium
¨ The historical premium is the premium that stocks have historically earned over riskless securities.
¨ While the users of historical risk premiums act as if it is a fact (rather than an estimate), it is sensitive to ¤ How far back you go in history…¤ Whether you use T.bill rates or T.Bond rates¤ Whether you use geometric or arithmetic averages.
¨ For instance, looking at the US:Arithmetic Average Geometric Average
Stocks - T. Bills Stocks - T. Bonds Stocks - T. Bills Stocks - T. Bonds1928-2018 7.93% 6.26% 6.11% 4.66%Std Error 2.09% 2.22%1969-2018 6.34% 4.00% 5.01% 3.04%Std Error 2.38% 2.71%2009-2018 13.00% 11.21% 12.48% 11.00%Std Error 3.71% 5.50%

20
A forward-looking ERP?

21
The Implied ERP over time.. Relative to a historical premium
0.00%
1.00%
2.00%
3.00%
4.00%
5.00%
6.00%
7.00%
8.00%
9.00%
10.00%
1961
1962
1963
1964
1965
1966
1967
1968
1969
1970
1971
1972
1973
1974
1975
1976
1977
1978
1979
1980
1981
1982
1983
1984
1985
1986
1987
1988
1989
1990
1991
1992
1993
1994
1995
1996
1997
1998
1999
2000
2001
2002
2003
2004
2005
2006
2007
2008
2009
2010
2011
2012
2013
2014
2015
2016
2017
2018
Figure 10: Historical versus Implied Premium - 1961- 2018
Arithmetic Average
Geometric average
Implied ERP

III. MEASURING RELATIVE RISK
It should not be Greek to you!

23
Unreliable, when it looks bad..
Aswath Damodaran
23

24
Or when it looks good..
Aswath Damodaran
24

And subject to game playing25
Aswath Damodaran

26
Measuring Relative Risk: You don’t like betas or modern portfolio theory? No problem.
Aswath Damodaran
26

27
Bottom-up Betas
Step 1: Find the business or businesses that your firm operates in.
Step 2: Find publicly traded firms in each of these businesses and obtain their regression betas. Compute the simple average across these regression betas to arrive at an average beta for these publicly traded firms. Unlever this average beta using the average debt to equity ratio across the publicly traded firms in the sample.Unlevered beta for business = Average beta across publicly traded firms/ (1 + (1- t) (Average D/E ratio across firms))
If you can, adjust this beta for differencesbetween your firm and the comparablefirms on operating leverage and product characteristics.
Step 3: Estimate how much value your firm derives from each of the different businesses it is in.
While revenues or operating income are often used as weights, it is better to try to estimate the value of each business.
Step 4: Compute a weighted average of the unlevered betas of the different businesses (from step 2) using the weights from step 3.Bottom-up Unlevered beta for your firm = Weighted average of the unlevered betas of the individual business
Step 5: Compute a levered beta (equity beta) for your firm, using the market debt to equity ratio for your firm. Levered bottom-up beta = Unlevered beta (1+ (1-t) (Debt/Equity))
If you expect the business mix of your firm to change over time, you can change the weights on a year-to-year basis.
If you expect your debt to equity ratio to change over time, the levered beta will change over time.
Possible Refinements
Aswath Damodaran
27

28
Estimating Bottom Up Betas & Costs of Equity: Disney
Aswath Damodaran
Business Revenues EV/SalesValue of Business
Proportion of Disney
Unlevered beta Value Proportion
Media Networks $20,356 3.27 $66,580 49.27% 1.03 $66,579.81 49.27%
Parks & Resorts $14,087 3.24 $45,683 33.81% 0.70 $45,682.80 33.81%
Studio Entertainment $5,979 3.05 $18,234 13.49% 1.10 $18,234.27 13.49%
Consumer Products $3,555 0.83 $2,952 2.18% 0.68 $2,951.50 2.18%
Interactive $1,064 1.58 $1,684 1.25% 1.22 $1,683.72 1.25%
Disney Operations $45,041 $135,132 100.00% 0.9239 $135,132.11
Business Unlevered beta Value of business D/E ratio Levered beta Cost of EquityMedia Networks 1.0313 $66,580 10.03% 1.0975 9.07%Parks & Resorts 0.7024 $45,683 11.41% 0.7537 7.09%Studio Entertainment 1.0993 $18,234 20.71% 1.2448 9.92%Consumer Products 0.6752 $2,952 117.11% 1.1805 9.55%Interactive 1.2187 $1,684 41.07% 1.5385 11.61%Disney Operations 0.9239 $135,132 13.10% 1.0012 8.52%

29
Bottom up Betas: Sampling Issues
¨ What are comparable firms, if you just want to extract betas?¤ A comparable firm, at least for measuring betas (exposure to macro risk), is one
that does well when your company does well and badly when it does badly. ¤ It follows then that a comparable firm does not have to be in the same sector as
you do.¤ If you decide to add other criteria to get to comparable firms, you must have an a
priori reason that you are willing to state (and defend) that those criteria are related to what you are trying to measure (exposure to macro risk)
¨ How big a sample?¤ The big advantage of “bottom up” betas is that you are averaging across many
betas. It is thus the law of large numbers that you are benefiting from, not theory.¤ As long as your betas are not systematically biased up or down, the standard error
of the average beta across a sample can be written as follows:
¤ With 100 firms in your sample, your beta will ten times more precise than a single regression beta. Even with 10 firms, it will be about three times more precise.
Standard Error of Beta = Average Standard Error of BetaNumber of firms in sample

III. THE GARNISHING
Here a premium, there a premium..

31
The Build up Approach
¨ For many analysts, the risk free rate and equity risk premium are just the starting points to get to a cost of equity. The required return that you obtain is then augmented with premiums for “other” risks to arrive at a built up cost of equity.
¨ The justifications offered for these premiums are varied but can be broadly classified into:¤ Historical premium: The historical data justifies adding a
premium (for small capitalization, illiquidity)¤ Intuition: There are risks that are being missed that have to be
built in¤ Reasonableness: The discount rate that I am getting looks too
low.

32
The Most Added Premium: The Small Cap Premium

33
Historical data can hide trends..
-40.00%
-20.00%
0.00%
20.00%
40.00%
60.00%
80.00%
100.00%
1927
1929
1931
1933
1935
1937
1939
1941
1943
1945
1947
1949
1951
1953
1955
1957
1959
1961
1963
1965
1967
1969
1971
1973
1975
1977
1979
1981
1983
1985
1987
1989
1991
1993
1995
1997
1999
2001
2003
2005
2007
2009
2011
2013
2015
2017
Smal
l Firm
Ret
urn
-Ave
rage
for m
arke
t, ad
juste
d fo
r risk
Year
Small Firm Premium over time- 1927 -2017
Small cap stocks did worse than large cap stocks
Small cap stocks have earned 0.33% LESS than expected
Small cap stocks did 0.43% worse than the market, after adjusting for risk between 1981
Small cap stocks did worse than large cap stocks
Small cap stocks have earned 0.33% LESS than expected
Small cap stocks did 6.51% better than the market, after adjusting for risk between 1927 and 1980.
34
But, but.. My company is risky..
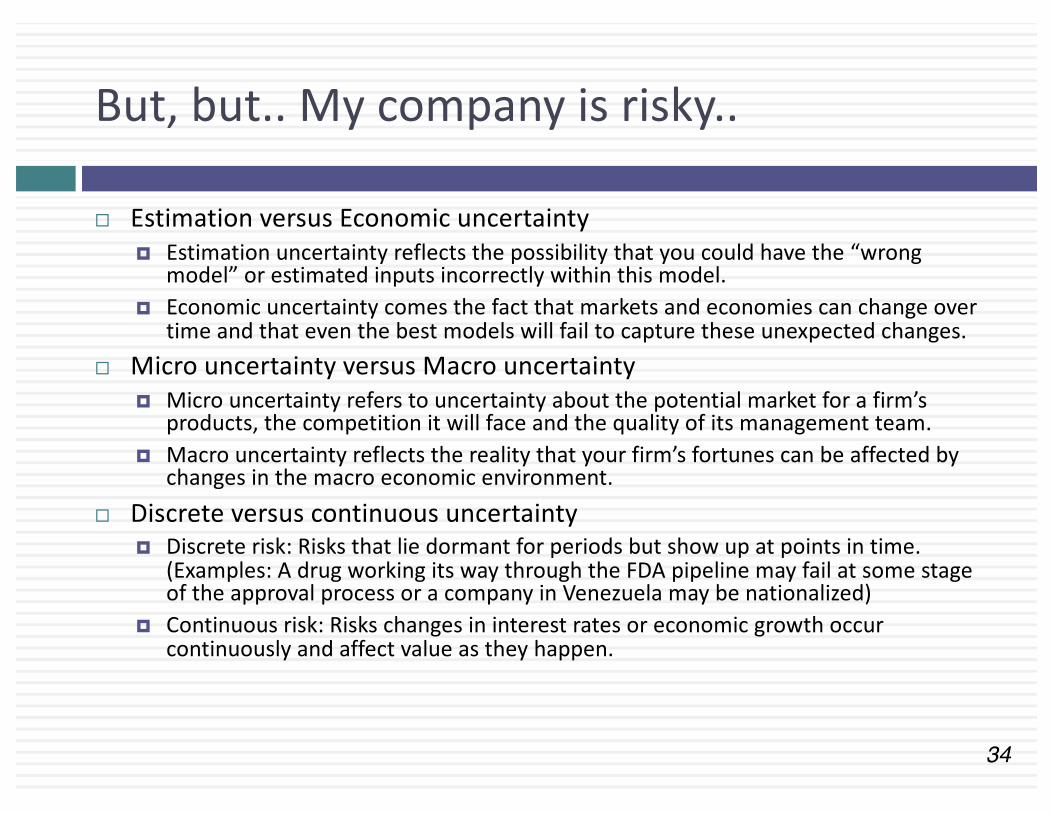
¨ Estimation versus Economic uncertainty¤ Estimation uncertainty reflects the possibility that you could have the “wrong
model” or estimated inputs incorrectly within this model.¤ Economic uncertainty comes the fact that markets and economies can change over
time and that even the best models will fail to capture these unexpected changes.¨ Micro uncertainty versus Macro uncertainty
¤ Micro uncertainty refers to uncertainty about the potential market for a firm’s products, the competition it will face and the quality of its management team.
¤ Macro uncertainty reflects the reality that your firm’s fortunes can be affected by changes in the macro economic environment.
¨ Discrete versus continuous uncertainty¤ Discrete risk: Risks that lie dormant for periods but show up at points in time.
(Examples: A drug working its way through the FDA pipeline may fail at some stage of the approval process or a company in Venezuela may be nationalized)
¤ Continuous risk: Risks changes in interest rates or economic growth occur continuously and affect value as they happen.
35
Risk and Cost of Equity: The role of the marginal investor
¨ Not all risk counts: While the notion that the cost of equity should be higher for riskier investments and lower for safer investments is intuitive, what risk should be built into the cost of equity is the question.
¨ Risk through whose eyes? While risk is usually defined in terms of the variance of actual returns around an expected return, risk and return models in finance assume that the risk that should be rewarded (and thus built into the discount rate) in valuation should be the risk perceived by the marginal investor in the investment
¨ The diversification effect: Most risk and return models in finance also assume that the marginal investor is well diversified, and that the only risk that he or she perceives in an investment is risk that cannot be diversified away (i.e, market or non-diversifiable risk). In effect, it is primarily economic, macro, continuous risk that should be incorporated into the cost of equity.
Aswath Damodaran
35

36
If the “buyer” is not diversified..
80 unitsof firm specificrisk
20 units of market risk
Private owner of businesswith 100% of your weatlthinvested in the business
Publicly traded companywith investors who are diversified
Is exposedto all the riskin the firm
Demands acost of equitythat reflects thisrisk
Eliminates firm-specific risk in portfolio
Demands acost of equitythat reflects only market risk
Market Beta measures justmarket risk
Total Beta measures all risk= Market Beta/ (Portion of the total risk that is market risk)
Private Owner versus Publicly Traded Company Perceptions of Risk in an Investment
RISK ADJUSTED CASH FLOW

38
The two faces of discounted cash flow valuation
¨ The value of a risky asset can be estimated by discounting the expected cash flows on the asset over its life at a risk-adjusted discount rate:
where the asset has an n-year life, E(CFt) is the expected cash flow in period t and r is a discount rate that reflects the risk of the cash flows.
¨ Alternatively, we can replace the expected cash flows with the guaranteed cash flows we would have accepted as an alternative (certainty equivalents) and discount these at the riskfree rate:
where CE(CFt) is the certainty equivalent of E(CFt) and rf is the riskfree rate.
Aswath Damodaran
38

39
What is a risk adjusted cash flow?
¨ Taking an expected value of cash flows across all scenarios is not a risk adjusted cash flow.
¨ As an illustration, think of being offered two choices:¤ An investment that will make $100 million, with 90%
probability, and $10 million with 10% probability¤ A guaranteed cash flow of $90 million¤ Which one would you take?
¨ What guaranteed cashflow would you be willing to accept as an alternative to the risky investment?

40
Why risk adjusting cash flows in business valuation is so difficult
¨ For a finite life investment with a short life, you may be able to estimate certainty equivalents for the two or three years that you have cash flows for.
¨ With publicly traded companies, where the cash flows can last forever, you have to estimate certainly equivalent cashflows forever.
¨ Not only is that tedious, but to the extent that each year’s expected cash flow is not independent of the prior one, you could very quickly be drawn into a hall of mirrors.
41
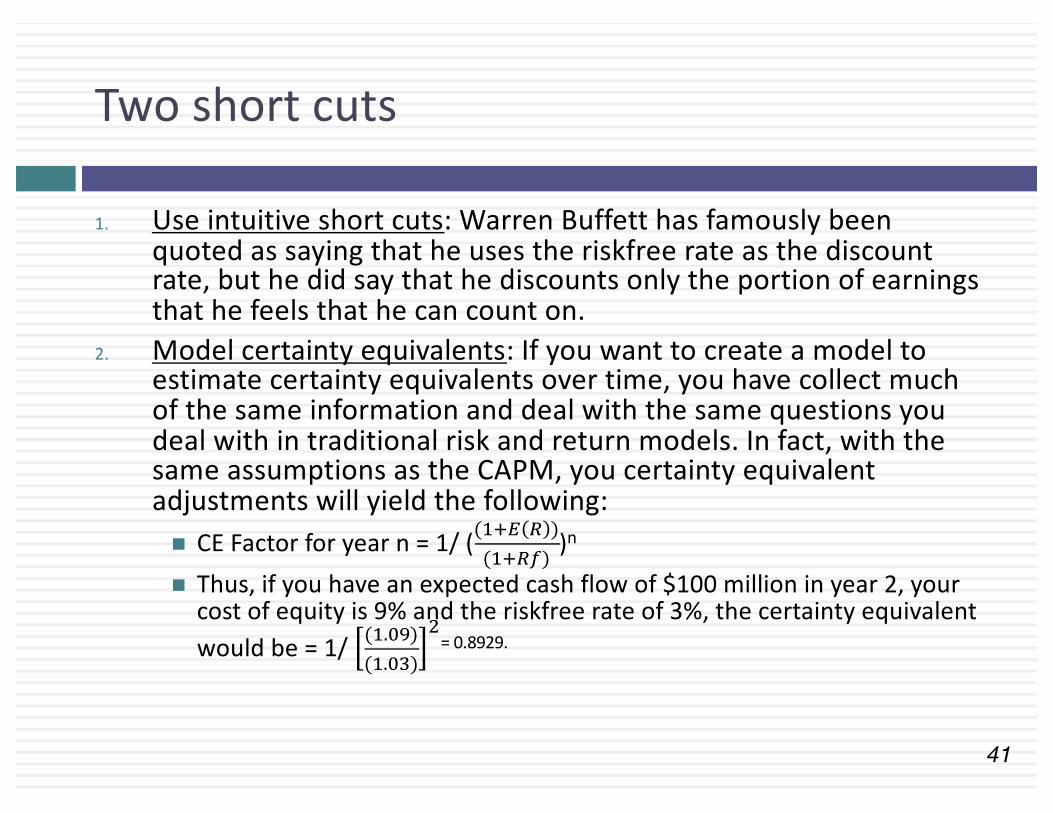
Two short cuts
1. Use intuitive short cuts: Warren Buffett has famously been quoted as saying that he uses the riskfree rate as the discount rate, but he did say that he discounts only the portion of earnings that he feels that he can count on.
2. Model certainty equivalents: If you want to create a model to estimate certainty equivalents over time, you have collect much of the same information and deal with the same questions you deal with in traditional risk and return models. In fact, with the same assumptions as the CAPM, you certainty equivalent adjustments will yield the following: n CE Factor for year n = 1/ (("#$ % )
("#%') )n
n Thus, if you have an expected cash flow of $100 million in year 2, your cost of equity is 9% and the riskfree rate of 3%, the certainty equivalent would be = 1/ (".)*)(".)+)
,= 0.8929.

IN CONCLUSION
Less rules, more first principles

43
Proposition 1: A hurdle rate is an opportunity cost, not a funding cost
¨ Most people, when asked what a cost of capital is, will respond with the answer that it is the cost of raising capital. In the context of its usage as a hurdle rate, that is not true.
¨ It is an opportunity cost, a rate of return that you (as a company or investor) can earn on other investments in the market of equivalent risk.

44
Application 1: The Beta for a Target Firm!
Aswath Damodaran
44
¨ When valuing a target firm in an acquisition, which of the following unlevered betas should you use to come up with your cost of equity?1. Beta of the acquiring firm2. Beta of the target firm3. Weighted average (by market value) of the betas of the
two firms4. Simple average of the betas of the two firms

45
Application 2: The Debt Ratio to use
Aswath Damodaran
45
¨ In computing the cost of capital to use in valuing the target firm, which of the following debt choices should you make in your computation:1. The debt ratio and the cost of debt of acquiring firm2. The debt ratio and the cost of debt of the target firm3. The debt ratio used in the acquisition, with the cost of
debt used for the acquisition4. The optimal debt ratio and cost of debt of the target firm5. The debt ratio for the combined firm after the
acquisition, and the cost of debt after
46
Proposition 2: A company-wide hurdle rate can be misleading and dangerous¨ In corporate finance, the hurdle rate becomes the number to beat,
when you do investment analysis. Most companies claim to have a corporate hurdle rate, a number that all projects that are assessed within the company get measured against.
¨ If your company operates in only one business and one country, this may work, but to the extent that companies operate in many businesses across multiple countries, there can be no one hurdle rate. Even if you use only one currency in analysis, your cost of capital will be a function of which business a project is in, and what country it is aimed at.
¨ The consequences of not making these differential adjustments will be that your safe businesses will end up subsidizing your risky businesses, and over time, both will be hurt, in what I term the "curse of the lazy conglomerate".

47
Test: A Multi Business Company!
!!Cost!of!equity!
Cost!of!debt!
Marginal!tax!rate!
After6tax!cost!of!debt!
Debt!ratio!
Cost!of!capital!
Media!Networks! 9.07%! 3.75%! 36.10%! 2.40%! 9.12%! 8.46%!Parks!&!Resorts! 7.09%! 3.75%! 36.10%! 2.40%! 10.24%! 6.61%!Studio!Entertainment! 9.92%! 3.75%! 36.10%! 2.40%! 17.16%! 8.63%!Consumer!Products! 9.55%! 3.75%! 36.10%! 2.40%! 53.94%! 5.69%!Interactive! 11.65%! 3.75%! 36.10%! 2.40%! 29.11%! 8.96%!Disney!Operations! 8.52%! 3.75%! 36.10%! 2.40%! 11.58%! 7.81%!
Disney has some major investments coming up in setting up a streaming competitor to Netflix. What cost of capital would you use in your assessment?a. Disney’s cost of capital as a companyb. Disney’s media networks cost of capitalc. Other

48
Proposition 3: Currency is a choice, but one that should not change outcomes
¨ If you follow the consistency rule on currency, incorporating inflation into both cash flows and discount rates, your analyses should be currency neutral.
¨ In other words, a project that looks like it is a bad project, when the analysis is done in US dollar terms, cannot become a good project, just because you decide to do the analysis in Indian rupees.
¨ If you do get divergent answers with different currencies, it is because there are inflation inconsistencies in your assessments of discount rates and cash flows.

49
Proposition 4: Your cost of capital cannot be insulated from the market
¨ There are many who remain wary of financial markets and their capacity to be irrational and volatile.
¨ Consequently, they try to generate hurdle rates that are unaffected by market movements, a futile and dangerous exercise, because we have to be price takers on at least some of the inputs into hurdle rates.
¨ Your cost of capital will change, and should change, as risk free rates and the prices of risk (equity risk premiums and default spreads) change.

50
Proposition 5: Gain perspective on cost of capital