the cost of cybercrime - accenture.com · the cybercrime evolution the cost of cybercrime study...
TRANSCRIPT
NINTH ANNUAL COST OF CYBERCRIME STUDYUNLOCKING THE VALUE OF IMPROVED CYBERSECURITY PROTECTION
Independently conducted by Ponemon Institute LLC and jointly developed by Accenture
THE COST OF CYBERCRIME
CONTENTS
Foreword 4
The Cybercrime Evolution 6 Nation-state, Supply Chain and Information Threats 6 New Risks from Innovation and Growth 8 Humans Are Still the Weakest Link 9
Benchmarking Cybersecurity Investment 10 More Attacks and Higher Costs 10 The Value at Risk from Cybercrime 14 Assessing Levels of Investment 15
Improving Cybersecurity Protection 17 Every Type of Attack Is More Expensive 17 The Impact of Cyberattacks Is Rising 18 Targeted Investments Tackle Cybercrime 21 Security Technologies Can Make a Difference 24
Unlocking Cybersecurity Value 27 Three Steps to Unlock Cybersecurity Value 27
About the Research 30 Frequently Asked Questions 30 Framework 32 Benchmarking 36 Sample 38 Limitations 41
Contact Us 44
The ninth annual cost of cybercrime study helps to quantify the economic cost of cyberattacks by analyzing trends in malicious activities over time.By better understanding the impact associated with cybercrime, organizations can determine the right amount of investment in cybersecurity. Looking back at the costs of cybercrime to date is helpful—but looking forward, so that business leaders know how to best target their funds and resources, is even more beneficial. This report does just that. By understanding where they can achieve value in their cybersecurity efforts, business leaders can minimize the consequences—and even prevent— future attacks.
OUR STUDY HELPS ORGANIZATIONS TO ADDRESS ONE OF SECURITY’S BURNING PLATFORMS. WE REVEAL HOW IMPROVING CYBERSECURITY PROTECTION CAN REDUCE THE COST OF CYBERCRIME AND OPEN UP NEW REVENUE OPPORTUNITIES TO UNLOCK ECONOMIC VALUE.
FOREWORD
Kelly Bissell Global Managing Director Accenture Security [email protected]
Larry Ponemon Chairman and Founder Ponemon Institute [email protected]
We are delighted to share with you this ninth edition of the Cost of Cybercrime study. Our extensive research includes in-depth interviews from more than 2,600 senior security professionals at 355 organizations.
Inside, you will find insights that are relevant to security professionals and business leaders to help us all better protect our organizations. We believe these findings, together with our experience and recommendations, can help executives to innovate safely and grow with confidence.
As industries evolve and disrupt the current environment, threats are dramatically expanding while becoming more complex. This requires more security innovation to protect company ecosystems. The subsequent cost to our organizations and economies is substantial— and growing.
My team and I are always on hand to discuss what the latest trends mean to your business. Read on to find out what it is taking to protect your organization today and how you can convert your cybersecurity strategy to achieve greater value for tomorrow.
Once again, the Ponemon Institute is delighted to work with Accenture Security on this comprehensive Cost of Cybercrime Study.
From a relatively modest start, we have now grown the scope of our research to include 11 countries and 16 industry sectors. We have extended our research timeline, too. This year, we have collaborated with Accenture to model the financial impact of cybercrime across these industries over the next five years—to get a better understanding of how cybersecurity strategies can make a difference in the future.
We feel sure that this report will be a useful guide as you attempt to navigate the cyber threatscape. We know that our work is being actively used today by prestigious organizations, such as the World Economic Forum and the United States Government, to help shape defenses.
The Ponemon Institute is proud to team with Accenture to produce these research findings. We believe this report not only illustrates our joint commitment to keeping you informed about the nature and extent of cyberattacks, but also offers you practical advice to improve your cybersecurity efforts going forward.
FEW ORGANIZATIONS TO REDUCE THEIR OVERALL COST OF CYBERCRIME. WHAT IF THEY COULD ALSO OPEN UP NEW REVENUE OPPORTUNITIES AT THE SAME TIME?Our Cost of Cybercrime study, now in its ninth year, offers that enticing prospect. In this report we show how better protection from people-based attacks, placing a priority on limiting information loss, and adopting breakthrough security technologies can help to make a difference.
4 > NINTH ANNUAL COST OF CYBERCRIME STUDY
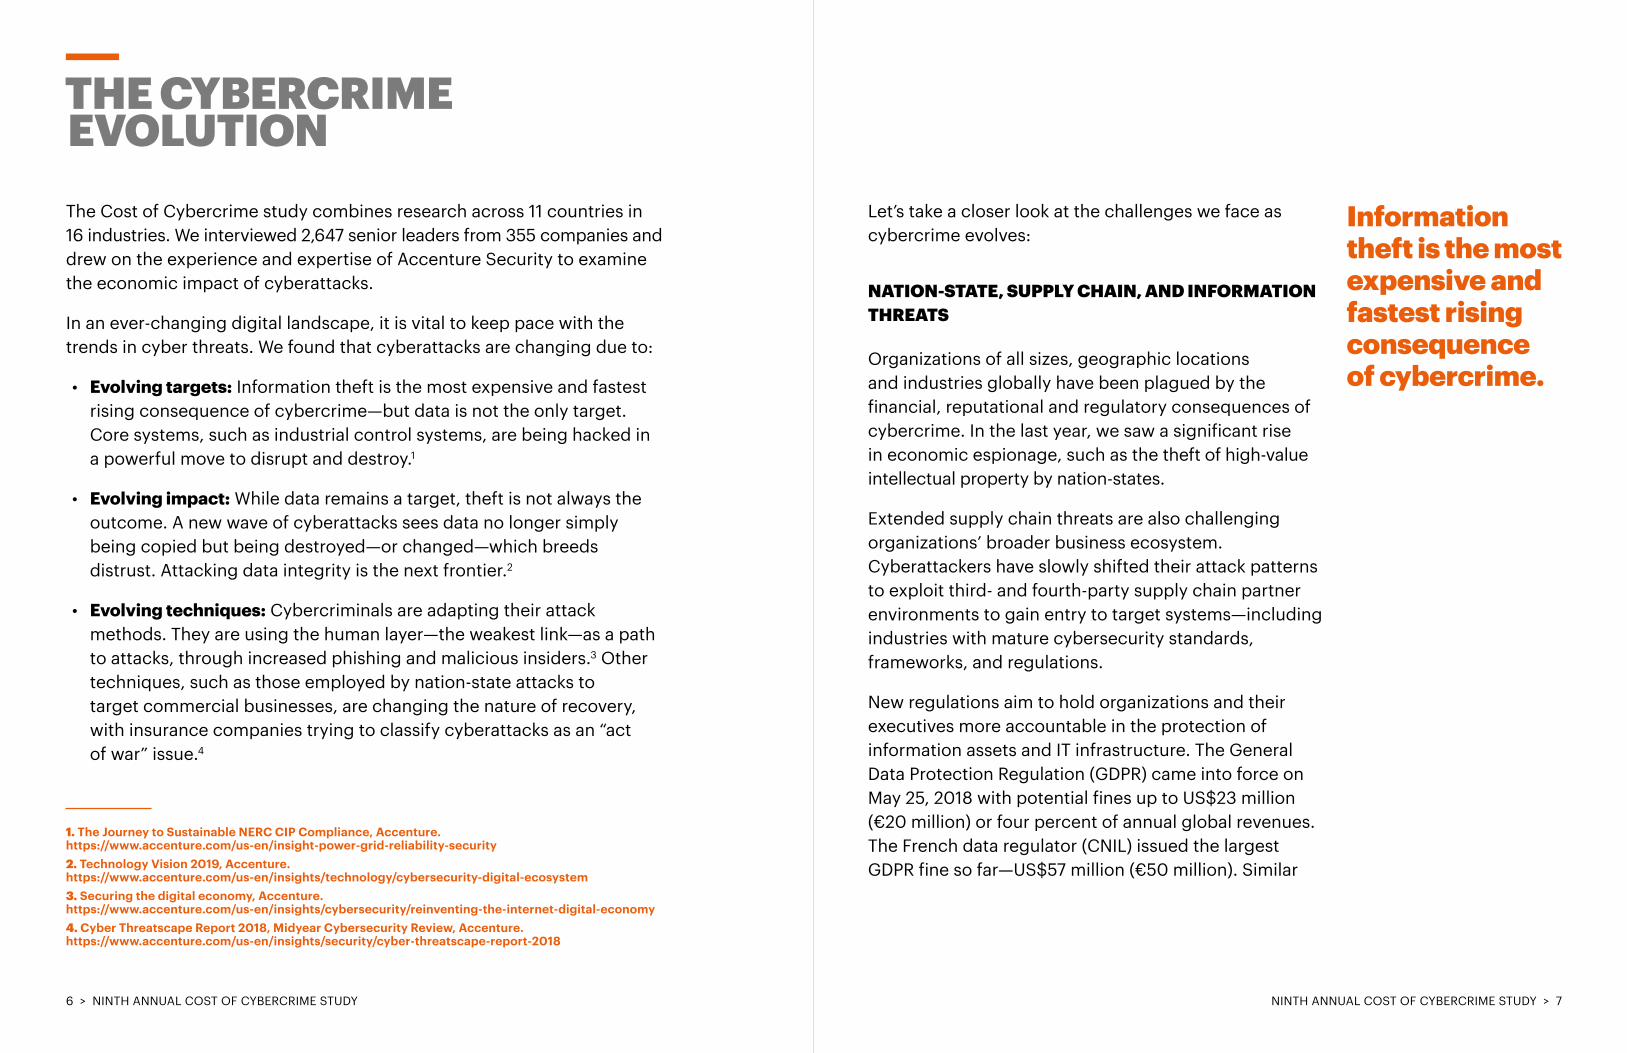
THE CYBERCRIME EVOLUTIONThe Cost of Cybercrime study combines research across 11 countries in 16 industries. We interviewed 2,647 senior leaders from 355 companies and drew on the experience and expertise of Accenture Security to examine the economic impact of cyberattacks.
In an ever-changing digital landscape, it is vital to keep pace with the trends in cyber threats. We found that cyberattacks are changing due to:
• Evolving targets: Information theft is the most expensive and fastest rising consequence of cybercrime—but data is not the only target. Core systems, such as industrial control systems, are being hacked in a powerful move to disrupt and destroy.1
• Evolving impact: While data remains a target, theft is not always the outcome. A new wave of cyberattacks sees data no longer simply being copied but being destroyed—or changed—which breeds distrust. Attacking data integrity is the next frontier.2
• Evolving techniques: Cybercriminals are adapting their attack methods. They are using the human layer—the weakest link—as a path to attacks, through increased phishing and malicious insiders.3 Other techniques, such as those employed by nation-state attacks to target commercial businesses, are changing the nature of recovery, with insurance companies trying to classify cyberattacks as an “act of war” issue.4
Let’s take a closer look at the challenges we face as cybercrime evolves:
NATION-STATE, SUPPLY CHAIN, AND INFORMATION THREATS
Organizations of all sizes, geographic locations and industries globally have been plagued by the financial, reputational and regulatory consequences of cybercrime. In the last year, we saw a significant rise in economic espionage, such as the theft of high-value intellectual property by nation-states.
Extended supply chain threats are also challenging organizations’ broader business ecosystem. Cyberattackers have slowly shifted their attack patterns to exploit third- and fourth-party supply chain partner environments to gain entry to target systems—including industries with mature cybersecurity standards, frameworks, and regulations.
New regulations aim to hold organizations and their executives more accountable in the protection of information assets and IT infrastructure. The General Data Protection Regulation (GDPR) came into force on May 25, 2018 with potential fines up to US$23 million (€20 million) or four percent of annual global revenues. The French data regulator (CNIL) issued the largest GDPR fine so far—US$57 million (€50 million). Similar
Information theft is the most expensive and fastest rising consequence of cybercrime.
1. The Journey to Sustainable NERC CIP Compliance, Accenture. https://www.accenture.com/us-en/insight-power-grid-reliability-security 2. Technology Vision 2019, Accenture. https://www.accenture.com/us-en/insights/technology/cybersecurity-digital-ecosystem 3. Securing the digital economy, Accenture. https://www.accenture.com/us-en/insights/cybersecurity/reinventing-the-internet-digital-economy 4. Cyber Threatscape Report 2018, Midyear Cybersecurity Review, Accenture. https://www.accenture.com/us-en/insights/security/cyber-threatscape-report-2018
6 > NINTH ANNUAL COST OF CYBERCRIME STUDY NINTH ANNUAL COST OF CYBERCRIME STUDY > 7
THE CYBERCRIME EVOLUTION
regulations, such as the California Consumer Privacy Act (CCPA), impose smaller fines (US$7,500 per violation) but highlight the increasing regulatory risks for businesses globally.
NEW RISKS FROM INNOVATION AND GROWTH
According to the Accenture report “Securing the Digital Economy,”5 businesses have never been more dependent on the digital economy and the Internet for growth. Fewer than one in four companies relied on the Internet for their business operations 10 years ago; now, it is 100 percent. A trustworthy digital economy is critical to their organization’s future growth according to 90 percent of business leaders—but the drive for digital innovation is introducing new risks.
While Internet dependency and the digital economy are flourishing, 68 percent of business leaders said their cybersecurity risks are also increasing. Almost 80 percent of organizations are introducing digitally fueled innovation faster than their ability to secure it against cyberattackers. No wonder, then, that cyberattacks and data fraud or theft are now two of the top five risks CEOs are most likely to face according to the latest World Economic Forum report on global risks.6
HUMANS ARE STILL THE WEAKEST LINK
Whether by accident or intent, many employees are often the root cause of successful cyberattacks. Executives polled in the Accenture 2018 State of Cyber Resilience survey identified the accidental publication of confidential information by employees and insider attacks as having the greatest impact, second only to hacker attacks in successfully breaching their organizations.7
Today, the security function is largely centralized and its staff are rarely included when new products, services, and processes—all of which involve some sort of cyber risk—are being developed. Such a silo’ed approach can result in a lack of accountability across the organization and a sense that security is not everyone’s responsibility. Only 16 percent of CISOs said employees in their organizations are held accountable for cybersecurity today. Providing ongoing training and skill reinforcement—for instance, with phishing tests—is essential, alongside training and education.
Employees need the tools and incentives to help them to define and address risks. New work arrangements—greater use of contractors and remote work—make the need for employee training more urgent. Even so, training employees to think and act with security in mind is the most underfunded activity in cybersecurity budgets.8
To embed cybersecurity into the fabric of the organization and be effective against any insider threats, organizations must bring together human resources, learning and development, legal and IT teams to work closely with the security office and business units.
Training employees to think and act with security in mind is the most underfunded activity in cybersecurity budgets.
5. Securing the digital economy, Accenture. https://www.accenture.com/us-en/insights/cybersecurity/reinventing-the-internet-digital-economy 6. WEF Global Risks Report 2019. http://www3.weforum.org/docs/WEF_Global_Risks_Report_2019.pdf
7. 2018 State of Cyber Resilience, Accenture. https://www.accenture.com/in-en/insights/security/2018-state-of-cyber-resilience-index8. Security Awareness Training Explosion, Cybersecurity Ventures, February 6, 2017. https://cybersecurityventures.com/security-awareness-training-report/
8 > NINTH ANNUAL COST OF CYBERCRIME STUDY NINTH ANNUAL COST OF CYBERCRIME STUDY > 9
BENCHMARKING CYBERSECURITY INVESTMENTIn the backdrop of this challenging environment, our research reveals that cybercrime is increasing in size and complexity. Based on the trends identified in previous publications, this may not come as a surprise. However, this year our report offers an additional perspective—a forward looking projection of the economic value at risk from future cyberattacks in the next five years.
MORE ATTACKS AND HIGHER COSTS
As the number of cyberattacks increase, and take more time to resolve, the cost of cybercrime continues to rise.
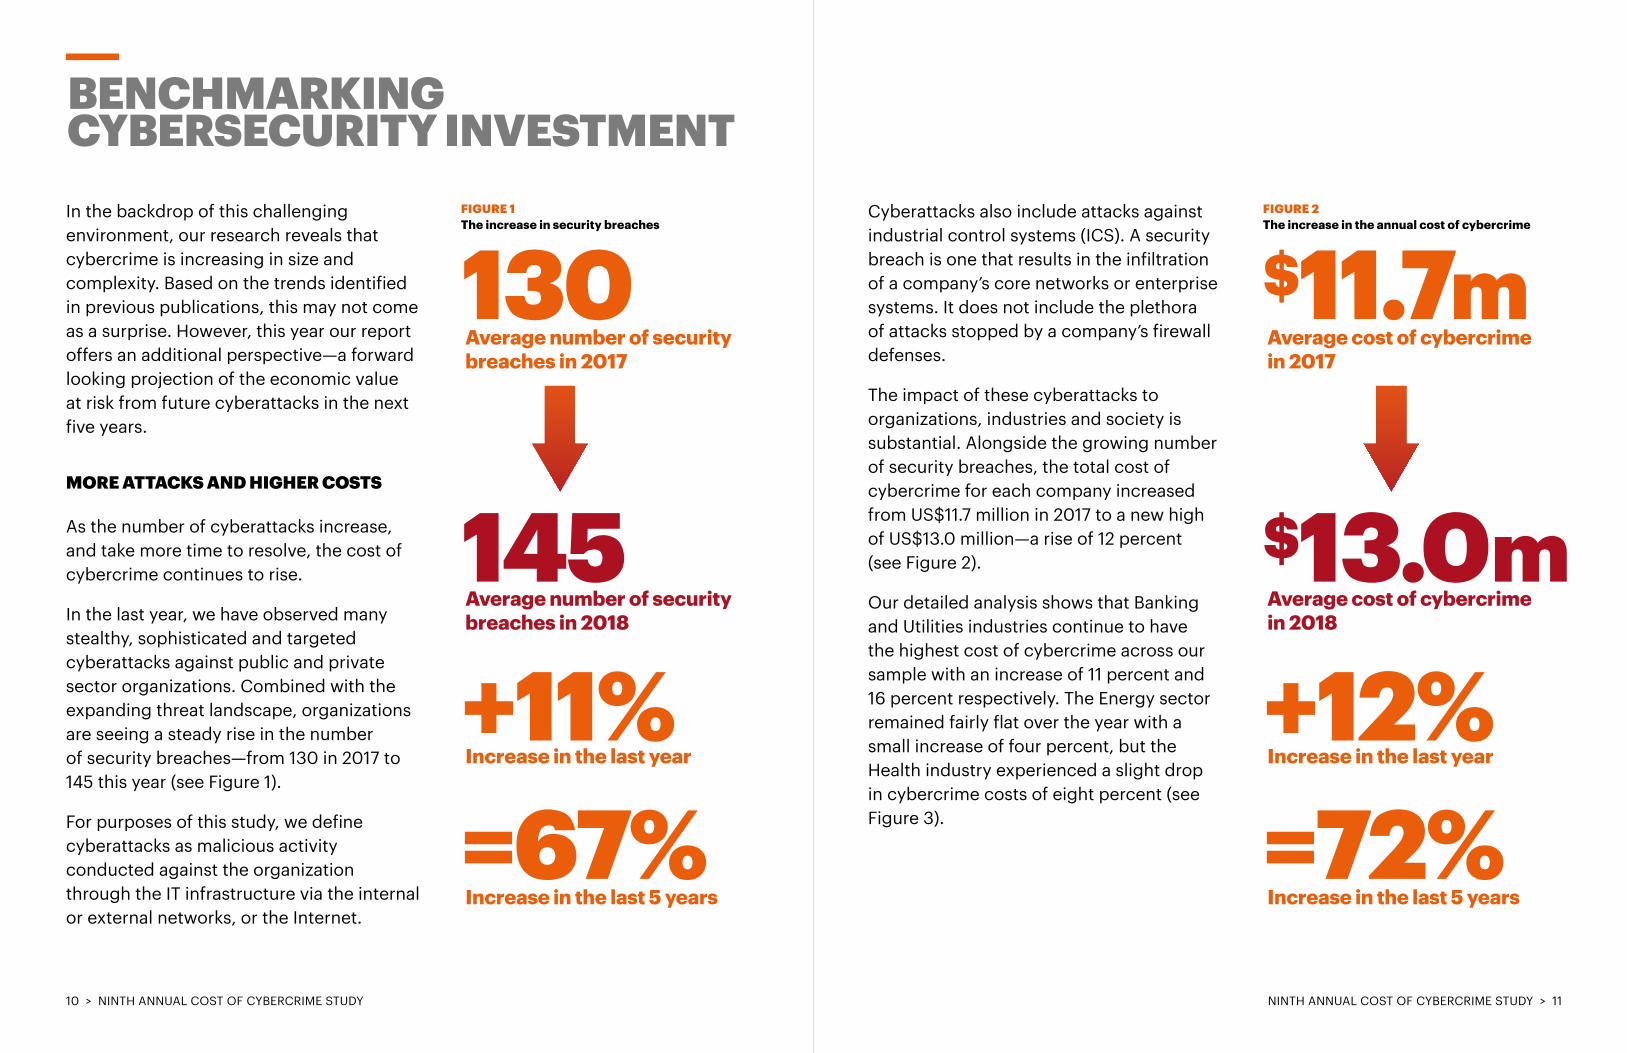
In the last year, we have observed many stealthy, sophisticated and targeted cyberattacks against public and private sector organizations. Combined with the expanding threat landscape, organizations are seeing a steady rise in the number of security breaches—from 130 in 2017 to 145 this year (see Figure 1).
For purposes of this study, we define cyberattacks as malicious activity conducted against the organization through the IT infrastructure via the internal or external networks, or the Internet.
Cyberattacks also include attacks against industrial control systems (ICS). A security breach is one that results in the infiltration of a company’s core networks or enterprise systems. It does not include the plethora of attacks stopped by a company’s firewall defenses.
The impact of these cyberattacks to organizations, industries and society is substantial. Alongside the growing number of security breaches, the total cost of cybercrime for each company increased from US$11.7 million in 2017 to a new high of US$13.0 million—a rise of 12 percent (see Figure 2).
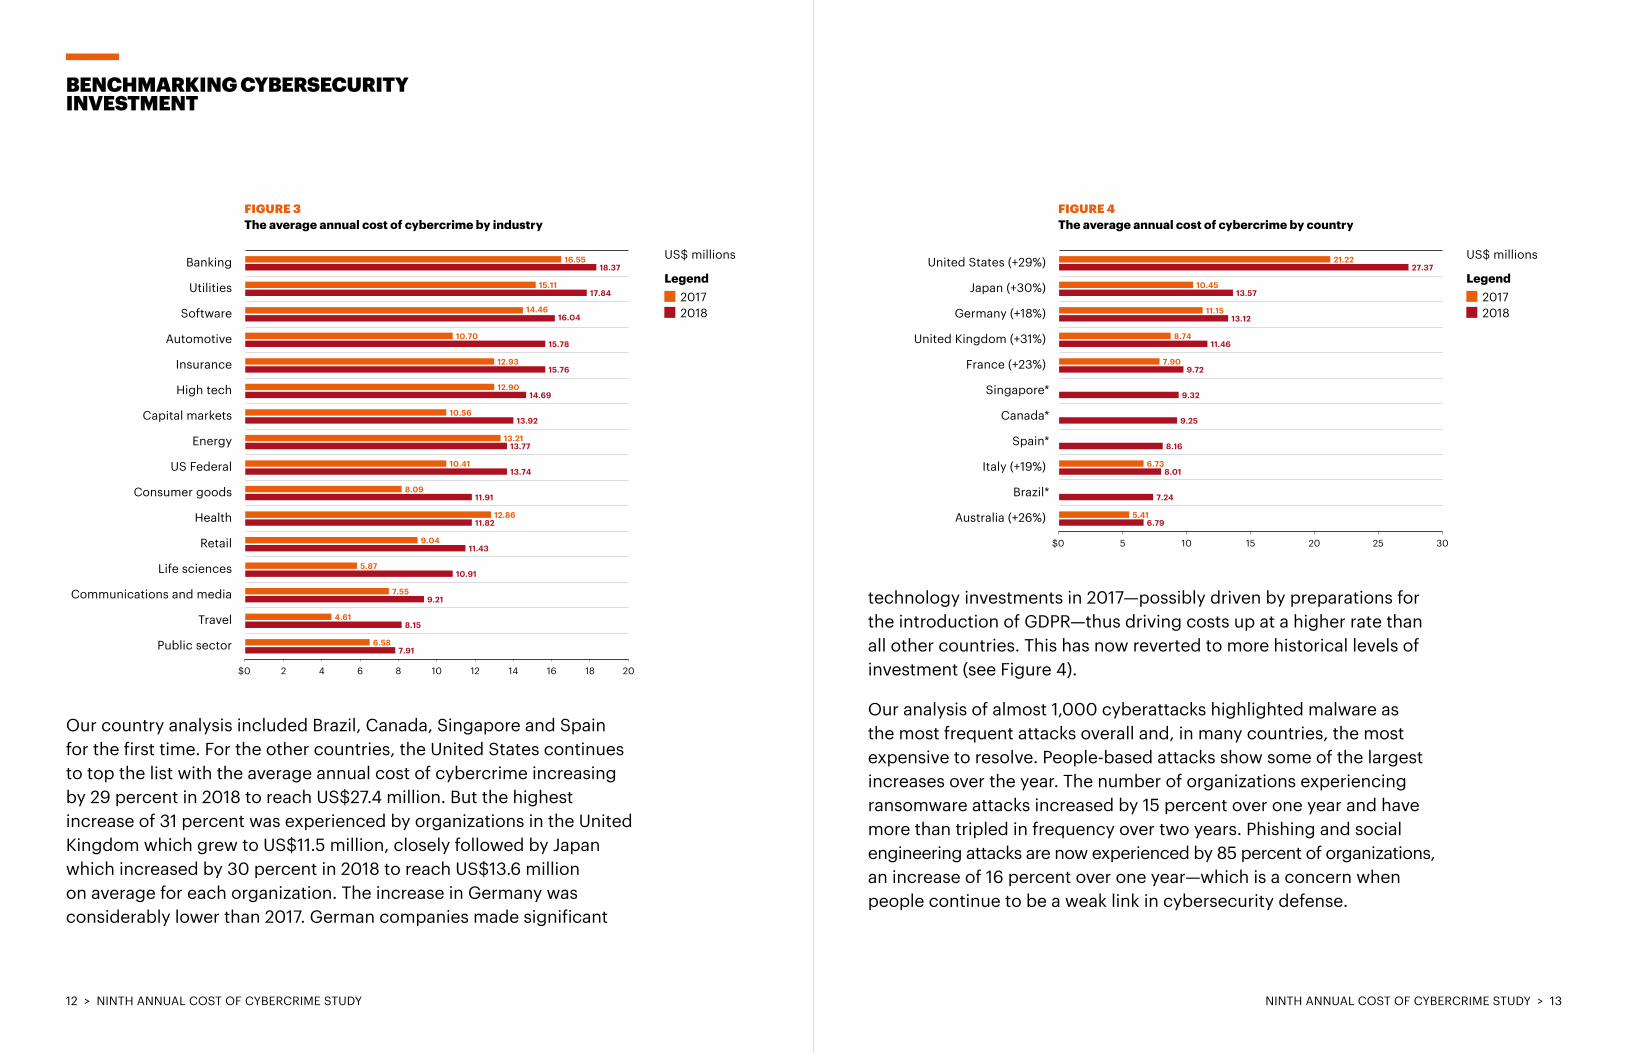
Our detailed analysis shows that Banking and Utilities industries continue to have the highest cost of cybercrime across our sample with an increase of 11 percent and 16 percent respectively. The Energy sector remained fairly flat over the year with a small increase of four percent, but the Health industry experienced a slight drop in cybercrime costs of eight percent (see Figure 3).
+11%=67%Increase in the last year
Increase in the last 5 years
FIGURE 1 The increase in security breaches
130
145
Average number of security breaches in 2017
Average number of security breaches in 2018
+12%=72%Increase in the last year
Increase in the last 5 years
FIGURE 2 The increase in the annual cost of cybercrime
$11.7m
$13.0m
Average cost of cybercrime in 2017
Average cost of cybercrime in 2018
10 > NINTH ANNUAL COST OF CYBERCRIME STUDY NINTH ANNUAL COST OF CYBERCRIME STUDY > 11
BENCHMARKING CYBERSECURITY INVESTMENT
FIGURE 3 The average annual cost of cybercrime by industry
FIGURE 4 The average annual cost of cybercrime by country
Our country analysis included Brazil, Canada, Singapore and Spain for the first time. For the other countries, the United States continues to top the list with the average annual cost of cybercrime increasing by 29 percent in 2018 to reach US$27.4 million. But the highest increase of 31 percent was experienced by organizations in the United Kingdom which grew to US$11.5 million, closely followed by Japan which increased by 30 percent in 2018 to reach US$13.6 million on average for each organization. The increase in Germany was considerably lower than 2017. German companies made significant
technology investments in 2017—possibly driven by preparations for the introduction of GDPR—thus driving costs up at a higher rate than all other countries. This has now reverted to more historical levels of investment (see Figure 4).
Our analysis of almost 1,000 cyberattacks highlighted malware as the most frequent attacks overall and, in many countries, the most expensive to resolve. People-based attacks show some of the largest increases over the year. The number of organizations experiencing ransomware attacks increased by 15 percent over one year and have more than tripled in frequency over two years. Phishing and social engineering attacks are now experienced by 85 percent of organizations, an increase of 16 percent over one year—which is a concern when people continue to be a weak link in cybersecurity defense.
14 16 1810 126 842
Utilities
Banking
Software
Automotive
Insurance
High tech
Capital markets
Energy
US Federal
Consumer goods
Health
Retail
Life sciences
Communications and media
Travel
Public sector
18.37
17.84
16.04
15.78
15.76
14.69
13.92
13.77
13.74
11.91
11.82
11.43
10.91
9.21
8.15
7.91
16.55
15.11
14.46
10.70
12.93
12.90
10.56
13.21
10.41
8.09
12.86
9.04
5.87
7.55
4.61
6.58
20$0
United States (+29%)
Japan (+30%)
Germany (+18%)
United Kingdom (+31%)
France (+23%)
Singapore*
Canada*
Spain*
Italy (+19%)
Brazil*
Australia (+26%)
2515 20105
27.37
13.57
13.12
11.46
9.72
9.32
9.25
8.16
8.01
7.24
6.79
21.22
10.45
11.15
8.74
7.90
6.73
5.41
30$0
US$ millions
Legend 2017 2018
US$ millions
Legend 2017 2018
12 > NINTH ANNUAL COST OF CYBERCRIME STUDY NINTH ANNUAL COST OF CYBERCRIME STUDY > 13
THE VALUE AT RISK FROM CYBERCRIME
We have talked about the cost of cyberattacks, but what about the other side of the coin? How might better cybersecurity practices create value for businesses?
Building on our understanding of cybercrime cost, we developed an economic model to assess the value at risk globally over the next five years. We began by estimating the expected cost of cybercrime as a percentage of revenue for companies in a range of industries. Next, we calculated the total industry revenues and multiplied those figures by the expected cost of cybercrime percentage for that industry. Finally, we analyzed how improved cybersecurity protection translates into less value at risk for business.
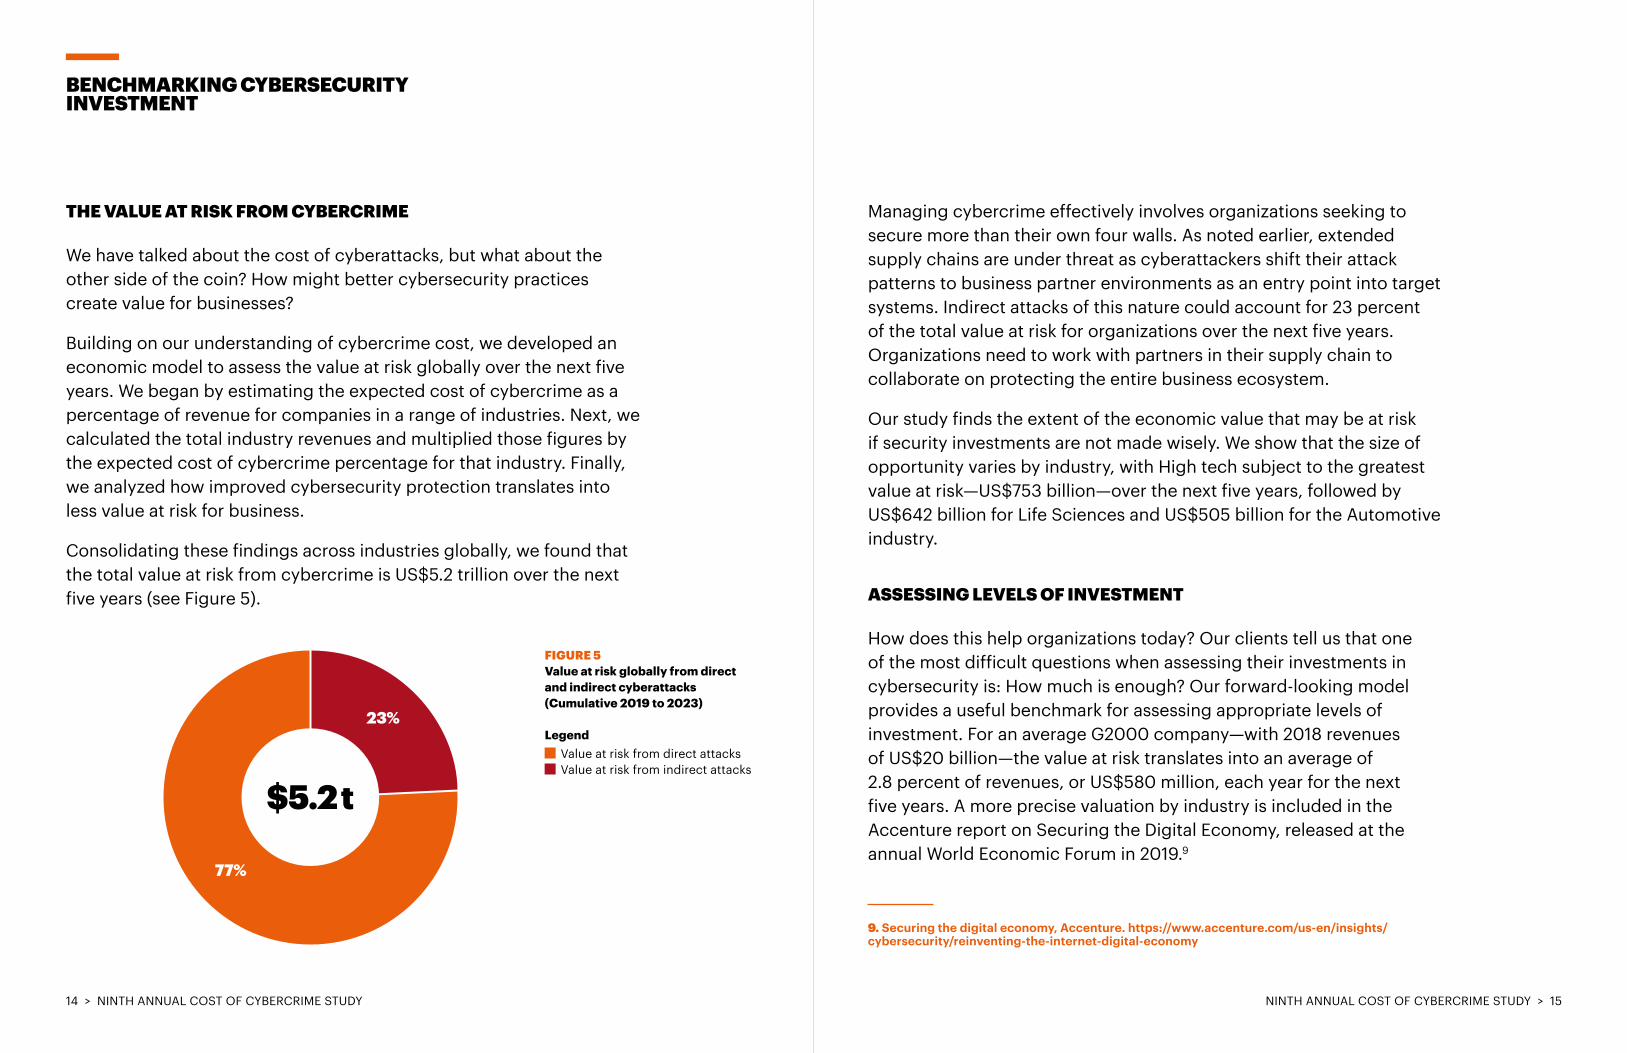
Consolidating these findings across industries globally, we found that the total value at risk from cybercrime is US$5.2 trillion over the next five years (see Figure 5).
Managing cybercrime effectively involves organizations seeking to secure more than their own four walls. As noted earlier, extended supply chains are under threat as cyberattackers shift their attack patterns to business partner environments as an entry point into target systems. Indirect attacks of this nature could account for 23 percent of the total value at risk for organizations over the next five years. Organizations need to work with partners in their supply chain to collaborate on protecting the entire business ecosystem.
Our study finds the extent of the economic value that may be at risk if security investments are not made wisely. We show that the size of opportunity varies by industry, with High tech subject to the greatest value at risk—US$753 billion—over the next five years, followed by US$642 billion for Life Sciences and US$505 billion for the Automotive industry.
ASSESSING LEVELS OF INVESTMENT
How does this help organizations today? Our clients tell us that one of the most difficult questions when assessing their investments in cybersecurity is: How much is enough? Our forward-looking model provides a useful benchmark for assessing appropriate levels of investment. For an average G2000 company—with 2018 revenues of US$20 billion—the value at risk translates into an average of 2.8 percent of revenues, or US$580 million, each year for the next five years. A more precise valuation by industry is included in the Accenture report on Securing the Digital Economy, released at the annual World Economic Forum in 2019.9
BENCHMARKING CYBERSECURITY INVESTMENT
$5.2t
77%
23%
FIGURE 5 Value at risk globally from direct and indirect cyberattacks (Cumulative 2019 to 2023)
Legend Value at risk from direct attacks Value at risk from indirect attacks
9. Securing the digital economy, Accenture. https://www.accenture.com/us-en/insights/cybersecurity/reinventing-the-internet-digital-economy
14 > NINTH ANNUAL COST OF CYBERCRIME STUDY NINTH ANNUAL COST OF CYBERCRIME STUDY > 15
There is another way to view value at risk—seeing it as a revenue-earning opportunity that is linked to improvements in cybersecurity protection. As protection improves, fewer attacks will breach defenses and the cost of cybercrime reduces. Trust, the fuel which drives the digital economy, can also strengthen the organization’s standing and lead to new revenue-generating opportunities with customers. Confidence in the organization is especially helpful when competitors do not inspire the same levels of trust. In an expanding threat landscape with more sophisticated attacks, the key question is: How can organizations refocus resources to make the greatest improvements in cybersecurity protection?
BENCHMARKING CYBERSECURITY INVESTMENT
Our in-depth interviews enable us to not only assess the detailed business impact of each type of cybersecurity attack, but also to understand where and how enabling security technologies can make a difference. Armed with this knowledge, organizations can better guide their security investments toward technologies with the largest potential cost savings. Further, they can focus those technologies on the internal activities with the greatest strategic impact on improving cybersecurity protection.
EVERY TYPE OF ATTACK IS MORE EXPENSIVE
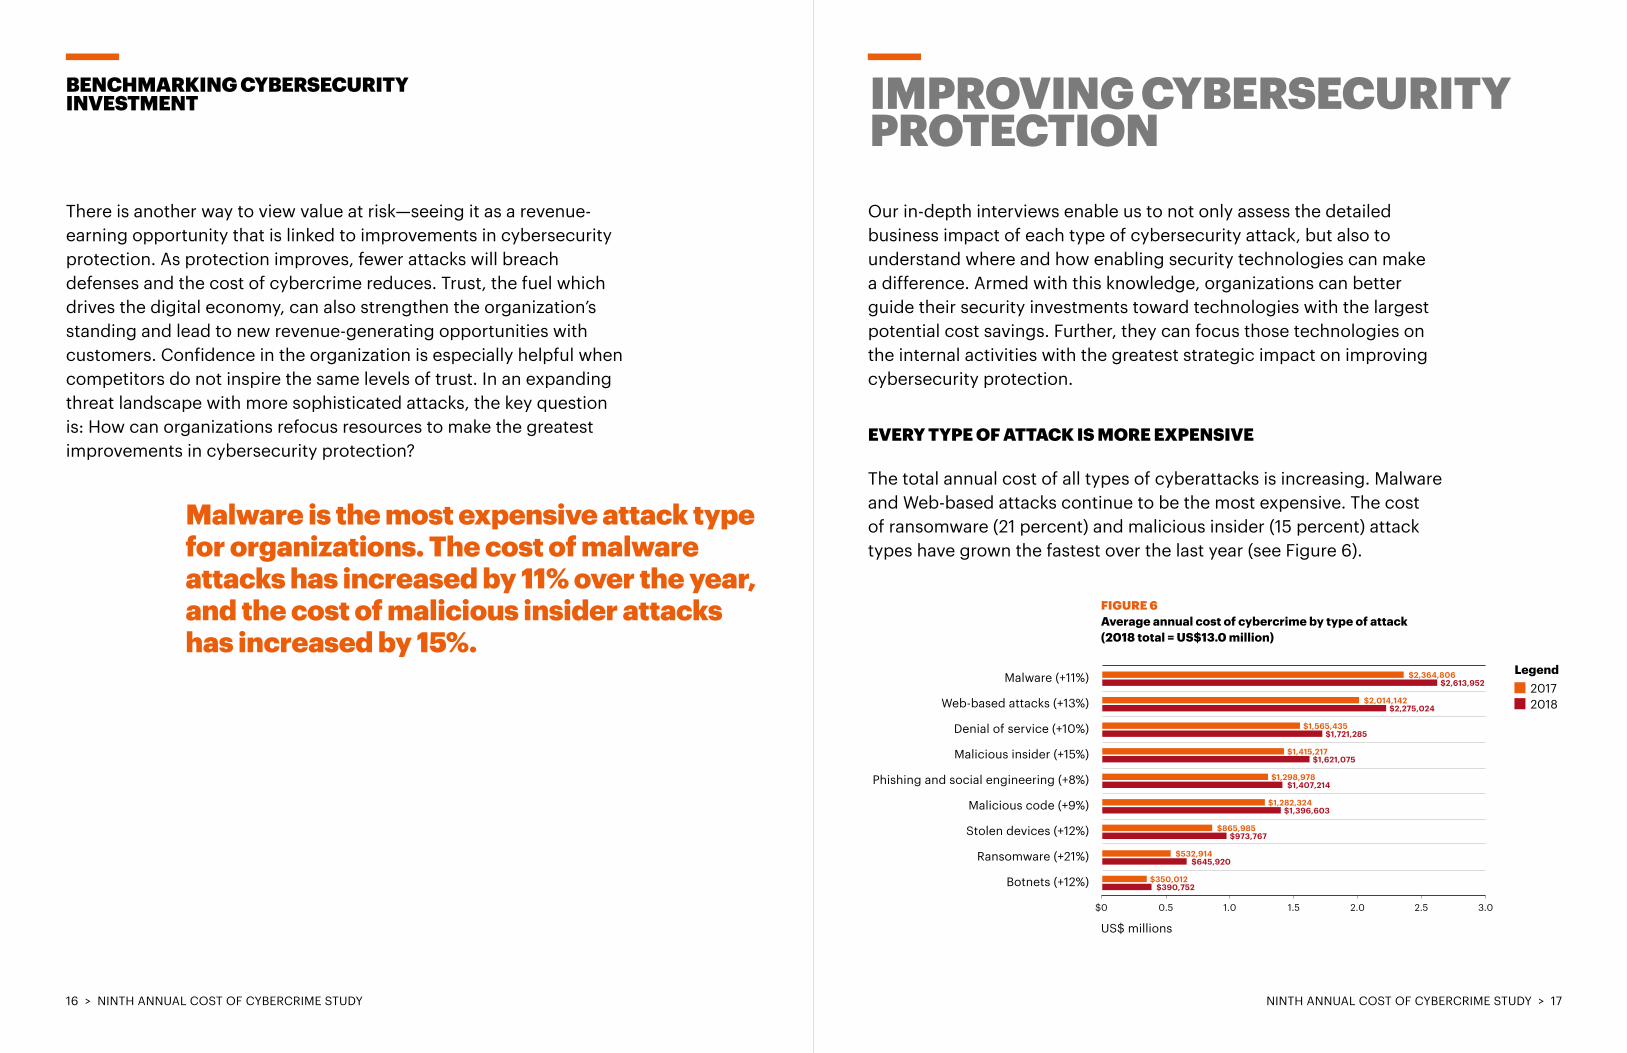
The total annual cost of all types of cyberattacks is increasing. Malware and Web-based attacks continue to be the most expensive. The cost of ransomware (21 percent) and malicious insider (15 percent) attack types have grown the fastest over the last year (see Figure 6).
Malware is the most expensive attack type for organizations. The cost of malware attacks has increased by 11% over the year, and the cost of malicious insider attacks has increased by 15%.
IMPROVING CYBERSECURITY PROTECTION
FIGURE 6 Average annual cost of cybercrime by type of attack (2018 total = US$13.0 million)
Malware (+11%)
Web-based attacks (+13%)
Denial of service (+10%)
Malicious insider (+15%)
Phishing and social engineering (+8%)
Malicious code (+9%)
Stolen devices (+12%)
Ransomware (+21%)
Botnets (+12%)
2.51.5 2.01.00.5
$2,613,952
$2,275,024
$1,721,285
$1,621,075
$1,407,214
$1,396,603
$973,767
$645,920
$390,752
$2,364,806
$2,014,142
$1,565,435
$865,985
$350,012
$532,914
$1,282,324
$1,298,978
$1,415,217
3.0$0
US$ millions
Legend 2017 2018
16 > NINTH ANNUAL COST OF CYBERCRIME STUDY NINTH ANNUAL COST OF CYBERCRIME STUDY > 17
IMPROVING CYBERSECURITY PROTECTION
What’s in the chart?
• Malware is the most expensive attack type for organizations. The figure (in parenthesis) indicates the cost for malware attacks has increased by 11 percent over the year and is now an average of US$2.6 million annually for organizations.
• Similarly, the cost of malicious insider attacks has increased by 15 percent over the year and is now an average of US$1.6 million annually for an organization.
• Adding the individual cost for each type of cyberattack gives us the total cost of cybercrime to an organization in 2018 (US$13.0 million).
THE IMPACT OF CYBERATTACKS IS RISING
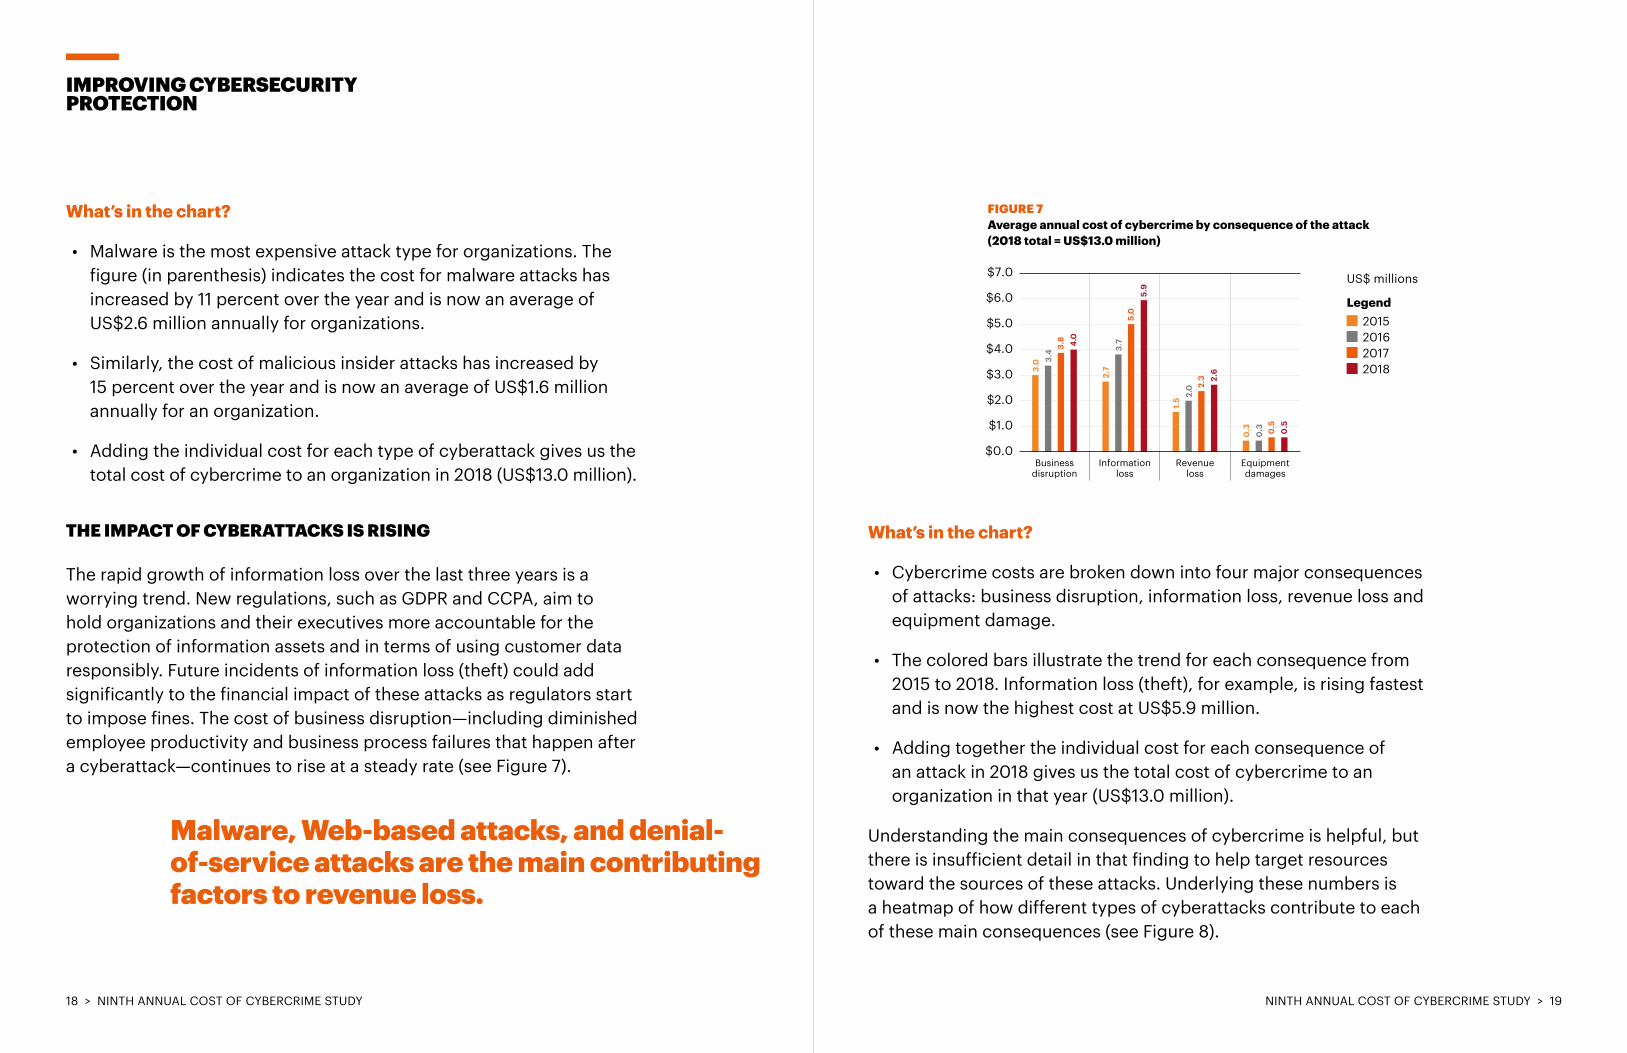
The rapid growth of information loss over the last three years is a worrying trend. New regulations, such as GDPR and CCPA, aim to hold organizations and their executives more accountable for the protection of information assets and in terms of using customer data responsibly. Future incidents of information loss (theft) could add significantly to the financial impact of these attacks as regulators start to impose fines. The cost of business disruption—including diminished employee productivity and business process failures that happen after a cyberattack—continues to rise at a steady rate (see Figure 7).
$5.0
$6.0
$7.0
$4.0
$3.0
$2.0
$1.0
$0.0Business
disruption
4.0
3.8
3.0 3.
4
Informationloss
5.9
5.0
2.7
3.7
Revenueloss
2.6
2.3
1.5 2.
0
Equipmentdamages
0.5
0.5
0.3
0.3
What’s in the chart?
• Cybercrime costs are broken down into four major consequences of attacks: business disruption, information loss, revenue loss and equipment damage.
• The colored bars illustrate the trend for each consequence from 2015 to 2018. Information loss (theft), for example, is rising fastest and is now the highest cost at US$5.9 million.
• Adding together the individual cost for each consequence of an attack in 2018 gives us the total cost of cybercrime to an organization in that year (US$13.0 million).
Understanding the main consequences of cybercrime is helpful, but there is insufficient detail in that finding to help target resources toward the sources of these attacks. Underlying these numbers is a heatmap of how different types of cyberattacks contribute to each of these main consequences (see Figure 8).
Malware, Web-based attacks, and denial- of-service attacks are the main contributing factors to revenue loss.
US$ millions
Legend 2015 2016 2017 2018
FIGURE 7 Average annual cost of cybercrime by consequence of the attack (2018 total = US$13.0 million)
18 > NINTH ANNUAL COST OF CYBERCRIME STUDY NINTH ANNUAL COST OF CYBERCRIME STUDY > 19
What’s in the chart?
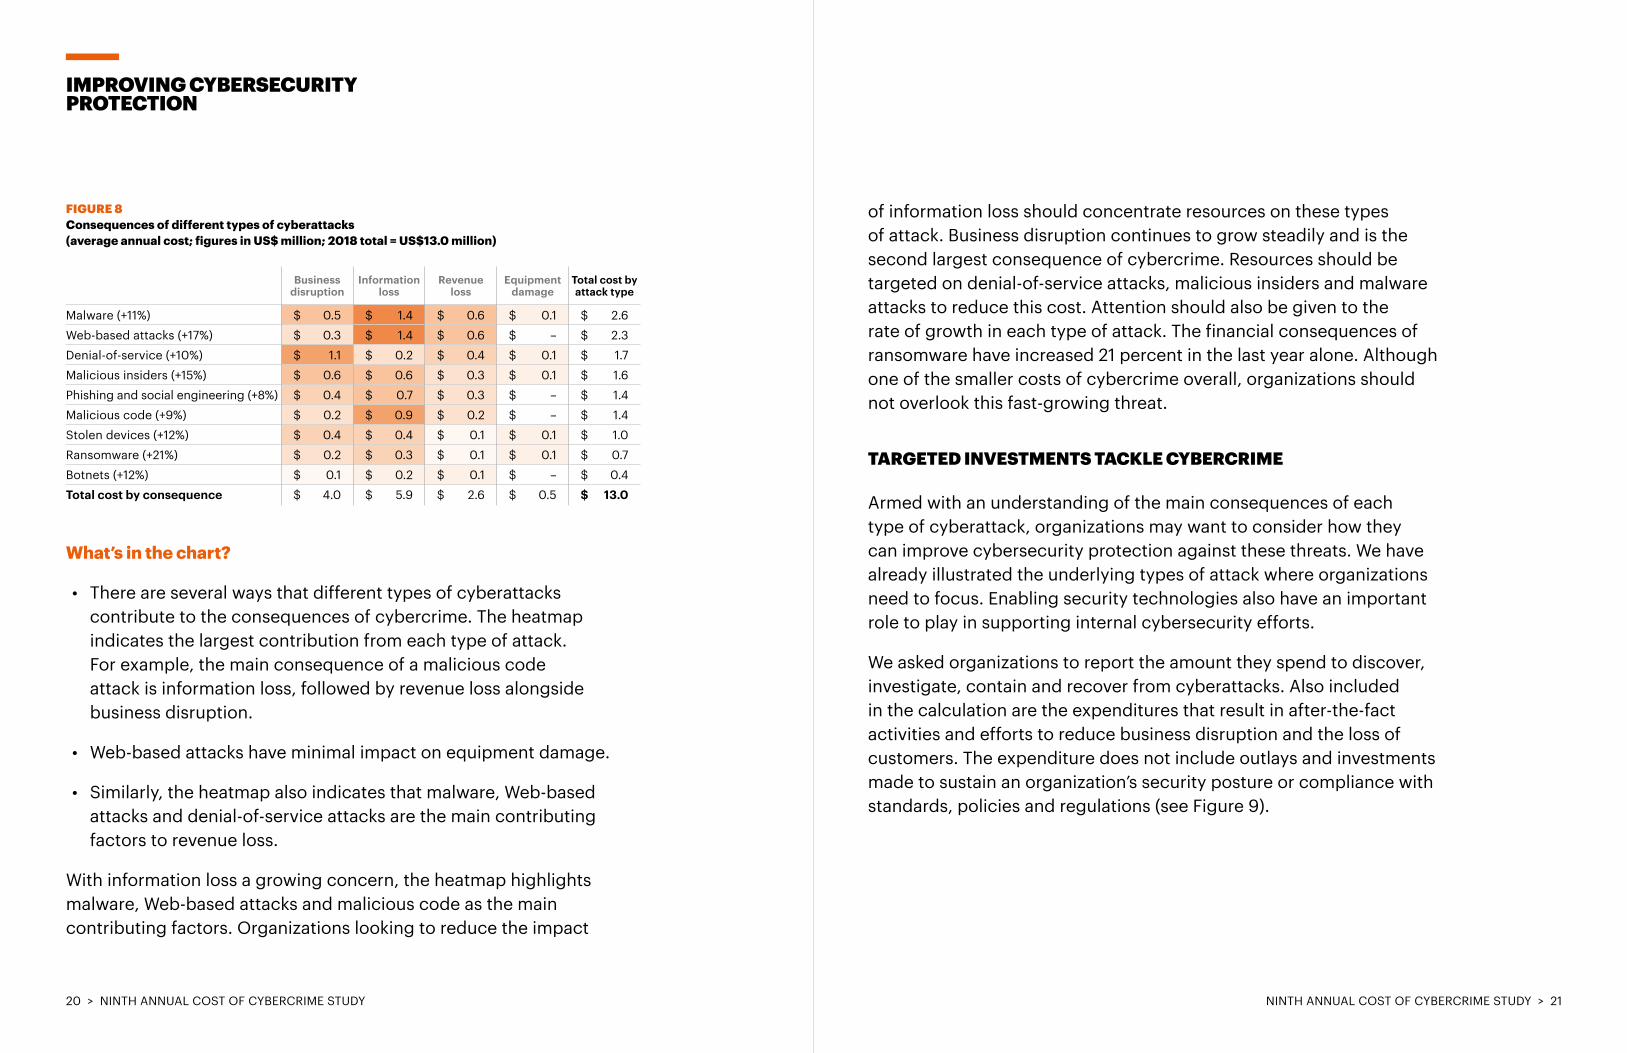
• There are several ways that different types of cyberattacks contribute to the consequences of cybercrime. The heatmap indicates the largest contribution from each type of attack. For example, the main consequence of a malicious code attack is information loss, followed by revenue loss alongside business disruption.
• Web-based attacks have minimal impact on equipment damage.
• Similarly, the heatmap also indicates that malware, Web-based attacks and denial-of-service attacks are the main contributing factors to revenue loss.
With information loss a growing concern, the heatmap highlights malware, Web-based attacks and malicious code as the main contributing factors. Organizations looking to reduce the impact
of information loss should concentrate resources on these types of attack. Business disruption continues to grow steadily and is the second largest consequence of cybercrime. Resources should be targeted on denial-of-service attacks, malicious insiders and malware attacks to reduce this cost. Attention should also be given to the rate of growth in each type of attack. The financial consequences of ransomware have increased 21 percent in the last year alone. Although one of the smaller costs of cybercrime overall, organizations should not overlook this fast-growing threat.
TARGETED INVESTMENTS TACKLE CYBERCRIME
Armed with an understanding of the main consequences of each type of cyberattack, organizations may want to consider how they can improve cybersecurity protection against these threats. We have already illustrated the underlying types of attack where organizations need to focus. Enabling security technologies also have an important role to play in supporting internal cybersecurity efforts.
We asked organizations to report the amount they spend to discover, investigate, contain and recover from cyberattacks. Also included in the calculation are the expenditures that result in after-the-fact activities and efforts to reduce business disruption and the loss of customers. The expenditure does not include outlays and investments made to sustain an organization’s security posture or compliance with standards, policies and regulations (see Figure 9).
IMPROVING CYBERSECURITY PROTECTION
FIGURE 8 Consequences of different types of cyberattacks (average annual cost; figures in US$ million; 2018 total = US$13.0 million)
Malware (+11%) $ 0.5 $ 1.4 $ 0.6 $ 0.1 $ 2.6
Web-based attacks (+17%) $ 0.3 $ 1.4 $ 0.6 $ – $ 2.3
Denial-of-service (+10%) $ 1.1 $ 0.2 $ 0.4 $ 0.1 $ 1.7
Malicious insiders (+15%) $ 0.6 $ 0.6 $ 0.3 $ 0.1 $ 1.6
Phishing and social engineering (+8%) $ 0.4 $ 0.7 $ 0.3 $ – $ 1.4
Malicious code (+9%) $ 0.2 $ 0.9 $ 0.2 $ – $ 1.4
Stolen devices (+12%) $ 0.4 $ 0.4 $ 0.1 $ 0.1 $ 1.0
Ransomware (+21%) $ 0.2 $ 0.3 $ 0.1 $ 0.1 $ 0.7
Botnets (+12%) $ 0.1 $ 0.2 $ 0.1 $ – $ 0.4
Total cost by consequence $ 4.0 $ 5.9 $ 2.6 $ 0.5 $ 13.0
Business disruption
Information loss
Revenue loss
Equipment damage
Total cost by attack type
20 > NINTH ANNUAL COST OF CYBERCRIME STUDY NINTH ANNUAL COST OF CYBERCRIME STUDY > 21
What’s in the chart?
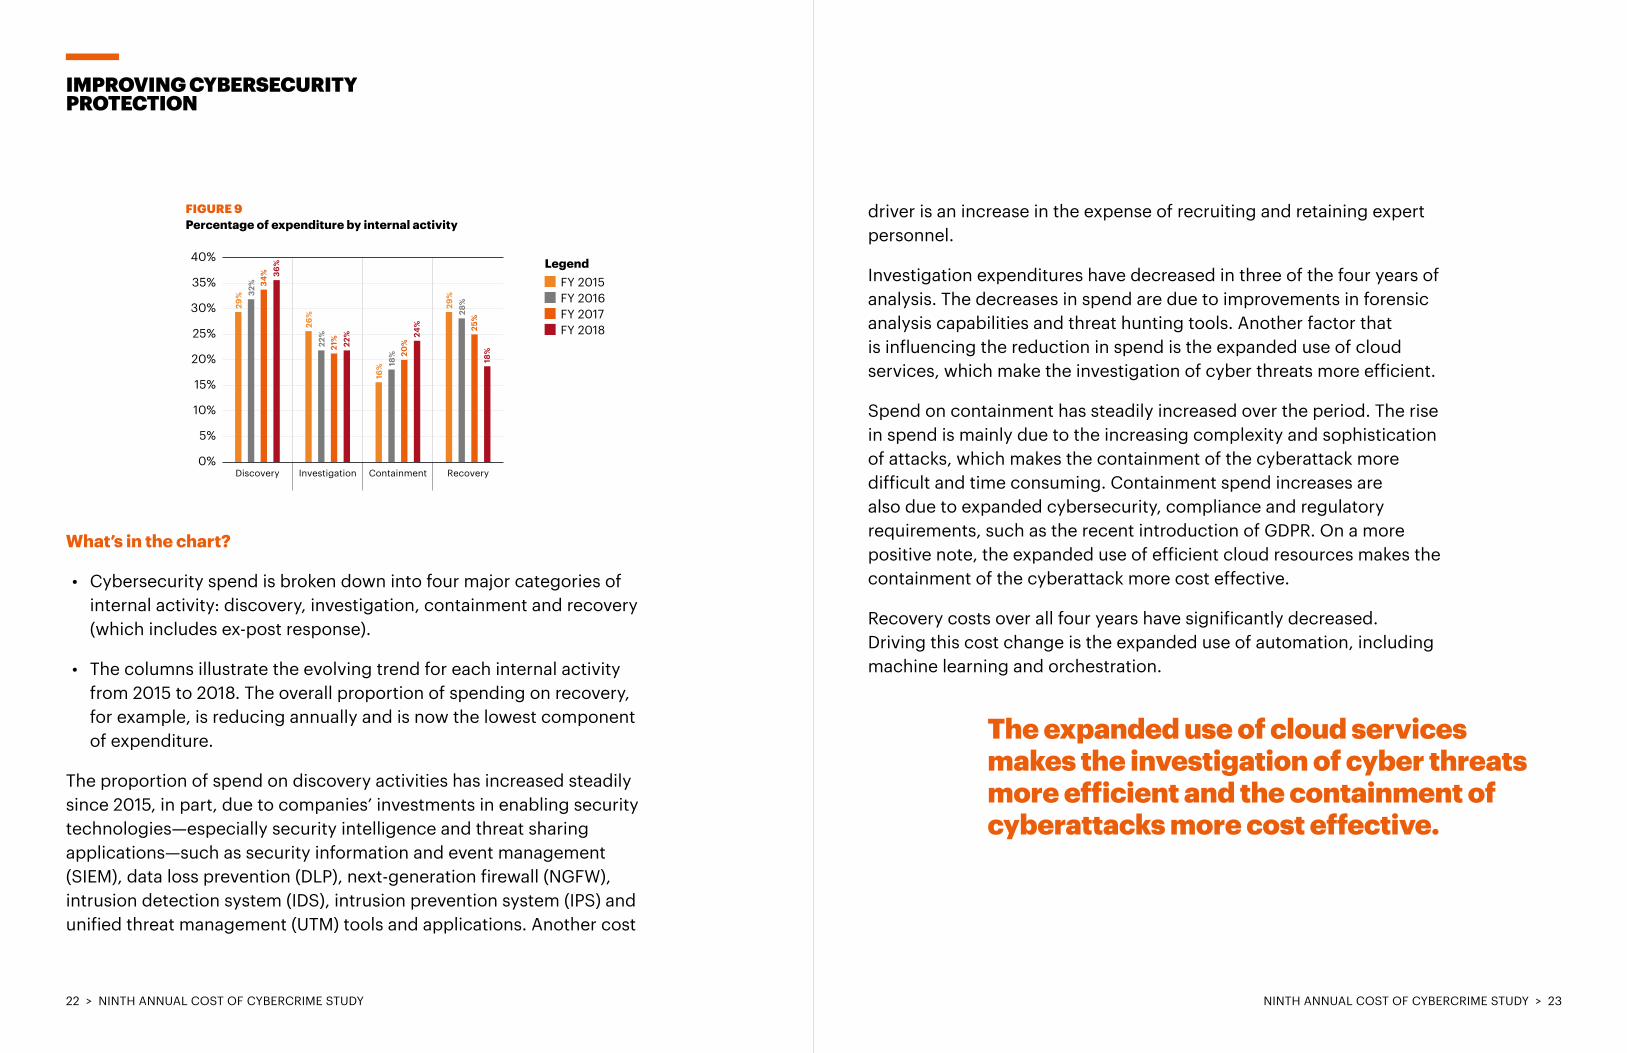
• Cybersecurity spend is broken down into four major categories of internal activity: discovery, investigation, containment and recovery (which includes ex-post response).
• The columns illustrate the evolving trend for each internal activity from 2015 to 2018. The overall proportion of spending on recovery, for example, is reducing annually and is now the lowest component of expenditure.
The proportion of spend on discovery activities has increased steadily since 2015, in part, due to companies’ investments in enabling security technologies—especially security intelligence and threat sharing applications—such as security information and event management (SIEM), data loss prevention (DLP), next-generation firewall (NGFW), intrusion detection system (IDS), intrusion prevention system (IPS) and unified threat management (UTM) tools and applications. Another cost
IMPROVING CYBERSECURITY PROTECTION
FIGURE 9 Percentage of expenditure by internal activity
25%
30%
35%
40%
20%
15%
10%
5%
0%Discovery
36%
34%
29% 32
%
Investigation
22%
21%
26%
22%
Containment
24%
20%
16% 18
%
Recovery18
%25
%
29%
28%
driver is an increase in the expense of recruiting and retaining expert personnel.
Investigation expenditures have decreased in three of the four years of analysis. The decreases in spend are due to improvements in forensic analysis capabilities and threat hunting tools. Another factor that is influencing the reduction in spend is the expanded use of cloud services, which make the investigation of cyber threats more efficient.
Spend on containment has steadily increased over the period. The rise in spend is mainly due to the increasing complexity and sophistication of attacks, which makes the containment of the cyberattack more difficult and time consuming. Containment spend increases are also due to expanded cybersecurity, compliance and regulatory requirements, such as the recent introduction of GDPR. On a more positive note, the expanded use of efficient cloud resources makes the containment of the cyberattack more cost effective.
Recovery costs over all four years have significantly decreased. Driving this cost change is the expanded use of automation, including machine learning and orchestration.
The expanded use of cloud services makes the investigation of cyber threats more efficient and the containment of cyberattacks more cost effective.
Legend FY 2015 FY 2016 FY 2017 FY 2018
22 > NINTH ANNUAL COST OF CYBERCRIME STUDY NINTH ANNUAL COST OF CYBERCRIME STUDY > 23
IMPROVING CYBERSECURITY PROTECTION
SECURITY TECHNOLOGIES CAN MAKE A DIFFERENCE
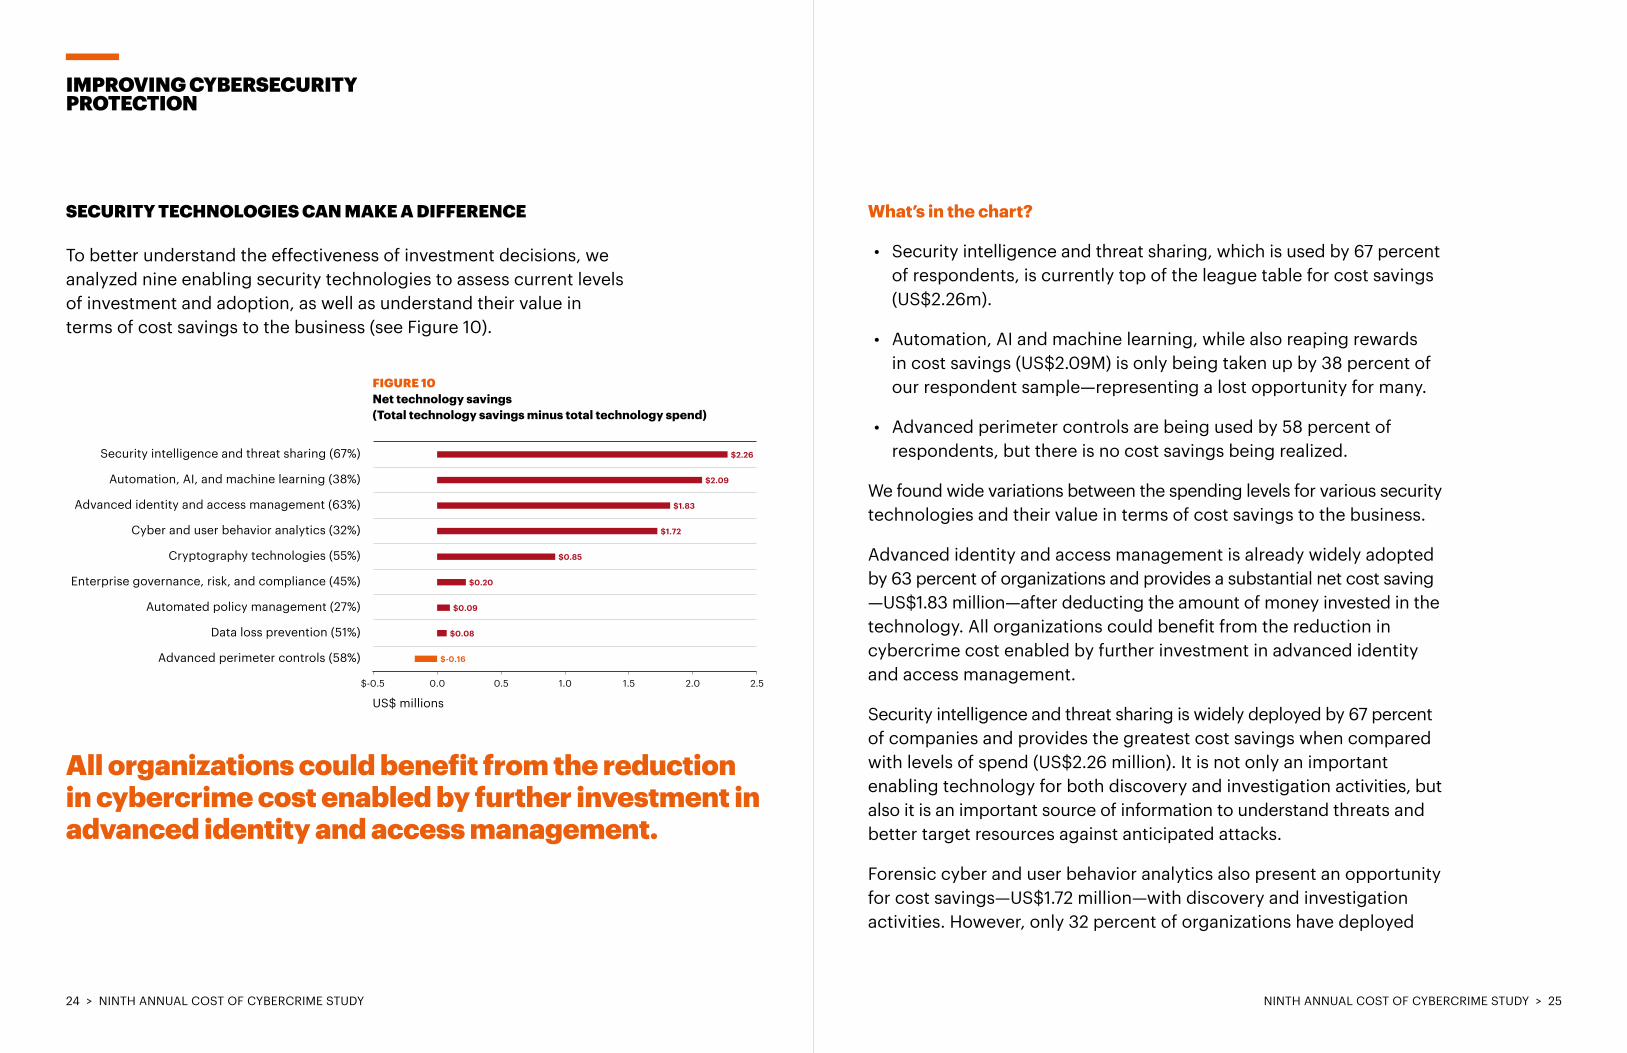
To better understand the effectiveness of investment decisions, we analyzed nine enabling security technologies to assess current levels of investment and adoption, as well as understand their value in terms of cost savings to the business (see Figure 10).
FIGURE 10 Net technology savings (Total technology savings minus total technology spend)
What’s in the chart?
• Security intelligence and threat sharing, which is used by 67 percent of respondents, is currently top of the league table for cost savings (US$2.26m).
• Automation, AI and machine learning, while also reaping rewards in cost savings (US$2.09M) is only being taken up by 38 percent of our respondent sample—representing a lost opportunity for many.
• Advanced perimeter controls are being used by 58 percent of respondents, but there is no cost savings being realized.
We found wide variations between the spending levels for various security technologies and their value in terms of cost savings to the business.
Advanced identity and access management is already widely adopted by 63 percent of organizations and provides a substantial net cost saving —US$1.83 million—after deducting the amount of money invested in the technology. All organizations could benefit from the reduction in cybercrime cost enabled by further investment in advanced identity and access management.
Security intelligence and threat sharing is widely deployed by 67 percent of companies and provides the greatest cost savings when compared with levels of spend (US$2.26 million). It is not only an important enabling technology for both discovery and investigation activities, but also it is an important source of information to understand threats and better target resources against anticipated attacks.
Forensic cyber and user behavior analytics also present an opportunity for cost savings—US$1.72 million—with discovery and investigation activities. However, only 32 percent of organizations have deployed
All organizations could benefit from the reduction in cybercrime cost enabled by further investment in advanced identity and access management.
US$ millions
Security intelligence and threat sharing (67%)
Automation, AI, and machine learning (38%)
Advanced identity and access management (63%)
Cyber and user behavior analytics (32%)
Cryptography technologies (55%)
Enterprise governance, risk, and compliance (45%)
Automated policy management (27%)
Data loss prevention (51%)
Advanced perimeter controls (58%)
2.01.0 1.50.50.0
$2.26
$2.09
$1.83
$1.72
$0.85
$0.20
$0.09
$0.08
$-0.16
2.5$-0.5
24 > NINTH ANNUAL COST OF CYBERCRIME STUDY NINTH ANNUAL COST OF CYBERCRIME STUDY > 25
IMPROVING CYBERSECURITY PROTECTION
these technologies enterprise-wide. Clearly, a wider level of adoption could realize greater cost benefits from these technologies.
The main driver for the rise in containment costs is the increasing complexity and sophistication of cyberattacks. Another factor is the expansion of compliance and regulatory requirements. Enterprise governance, risk and compliance technology and automated policy management all have a marginal impact on lowering the cost of cybercrime, so careful management and appropriate levels of investment may be required to improve the efficiency and cost of regulatory compliance.
Automation, including artificial intelligence and machine learning, already account for some of the downward trend in spend on recovery activities. Automation offers the second highest net savings of US$2.09 million, once investment costs are considered. Levels of adoption are still relatively low and more organizations could benefit from the savings generated. These technologies could begin to address the shortage in skilled security staff by supplementing existing skills and capabilities.
The costs associated with information loss is rising faster than any other consequence of cybercrime. The extensive use of cryptography technologies provides a healthy net saving of US$0.85 million. Although the return is lower, organizations should also consider the use of data loss prevention technologies where appropriate.
The situation with advanced perimeter controls deserves further discussion. The average level of investment in this enabling technology is US$1.4 million —the highest level of investment of all the technologies in our analysis. Advanced perimeter controls also return a healthy cost saving of US$1.2 million. With the exponential growth of the Internet of Things (IoT), and the movement of more processing power to “the edge”, organizations must be careful to maintain their advance perimeter controls in line with their risk of attack.
Security should to be a core competency across the organization and embedded in all that a business is and does. From people to data to technologies, every aspect of a business invites risk. Despite their investments, business leaders still need to improve the economic value from their cybersecurity strategies.
THREE STEPS TO UNLOCK CYBERSECURITY VALUE
1. Prioritize protecting people-based attacks: Counteracting internal threats is still one of the biggest challenges facing business leaders today. Increases in phishing, ransomware and malicious insider attacks mean that greater emphasis needs to be on nurturing a security-first culture. Accountability is key. Training and education are essential to reinforce safe behaviors, both for people within the organization and across the entire business ecosystem. Partners, third parties and relationships are growing as a result of conducting business electronically. Organizations should work with these ecosystem partners to jointly protect and defend their operations. The people involved are not always the people within an organization.
2. Invest to limit information loss and business disruption: Information is the lifeblood of any organization—whether related to customers, employees, products, business processes or services. As new privacy regulations, such as GDPR and CCPA, extend considerable fines for non-compliance, the onus is on organizations to take a responsible attitude to their critical information. Information protection is at the heart of trustworthy business practices, and it is essential to defend against business disruption. Taking a data-centric approach to security,10
UNLOCKING CYBERSECURITY VALUE
10. Achieving data-centric security, Accenture. https://www.accenture.com/us-en/insight-data-achieving-centric-security-2017
26 > NINTH ANNUAL COST OF CYBERCRIME STUDY NINTH ANNUAL COST OF CYBERCRIME STUDY > 27
As this annual study shows, the scale and scope of cybercrime is far from waning. Indeed, as digital technologies introduce new vulnerabilities faster than they can be secured, the prospect of beating cyberattackers at their own game diminishes. Even so, by understanding the pattern of evolution in the cyber landscape and adopting an intelligence-based approach, security leaders can invest in the right areas to be ready.
NOW, MORE THAN EVER, THE ABILITY TO ENGAGE ORGANIZATIONS’ WORKFORCES, ADOPT SOUND DATA PRACTICES, AND APPLY POWERFUL, NEW TECHNOLOGIES CAN HELP TO DRIVE CYBER RESILIENCE.
adopting data loss prevention technologies and using cryptographic technology extensively can all help to reduce the cost of cybercrime. Enhancing security measures around the handling, maintenance and sharing of information can shift an organization’s approach to information loss from damage limitation to robust proprietary practices.
3. Target technologies that reduce rising costs: Organizations should manage the largest component of spend, the cost of discovering an attack. Unsurprisingly, as the number of cyberattacks grows, so discovery costs are rising—and breakthrough technologies could be the answer to finding and reversing this increasing expense. Investments in enabling security technologies, such as security intelligence and threat sharing, can help to reduce the cost of cybercrime. Cloud services can make the investigation of cyber threats more efficient. Automation and advanced analytics can be used to investigate cybercrime and enhance recovery efforts, as well as being applied to supplement the work of scarce specialist security personnel.
UNLOCKING CYBERSECURITY VALUE
28 > NINTH ANNUAL COST OF CYBERCRIME STUDY
How do you calculate the cost? To determine the average cost of cybercrime, organizations were asked to report what they spent to deal with cybercrimes over four consecutive weeks. Once the costs over the four-week period were compiled and validated, these figures were then grossed-up to determine the annualized cost. These are costs to detect, recover, investigate and manage the incident response. Also covered are the costs that result in after-the-fact activities and efforts to reduce business disruption and the loss of customers. These costs do not include expenditures and investments made to sustain an organization’s security posture or compliance with standards, policies and regulations.
Are you tracking the same organizations each year? For consistency purposes, our benchmark sample consists of only larger-sized organizations (that is, a minimum of approximately 5,000 enterprise seats). Each annual study involves a different sample of companies. In short, we do not track the same sample of companies over time. To be consistent, we recruit and match companies with similar characteristics such as the company’s industry, headcount, geographic footprint and size of data breach.
COST OF CYBERCRIME FREQUENTLY ASKED QUESTIONS
What types of cyberattacks are included in this research? For purposes of this study, we define cyberattacks as criminal activity conducted through the organization’s IT infrastructure via the internal or external networks or the Internet. Cyberattacks also include attacks against industrial controls. A successful cyberattack is one that results in the infiltration of a company’s core networks or enterprise systems. It does not include the plethora of attacks stopped by a company’s firewall defenses.
How does benchmark research differ from survey research? The unit of analysis in the Cost of Cybercrime Study is the organization. In survey research, the unit of analysis is the individual. In our experience, a traditional survey approach does not capture the necessary details required to extrapolate cybercrime costs. We conduct field-based research that involves interviewing senior-level personnel about their organizations’ actual cybercrime incidents.
How do you collect the data? In our study, our researchers collected in-depth qualitative data through 2,647 separate interviews conducted in 355 companies in eleven countries: Australia, Brazil, Canada, France, Germany, Italy, Japan, Singapore, Spain, the United Kingdom and the United States. In each of the 355 participating organizations, we spoke with IT, compliance and information security practitioners who are knowledgeable about the cyberattacks experienced by the company and the costs associated with resolving the cybercrime incidents. For privacy purposes we did not collect organization-specific information.
ABOUT THE RESEARCH
30 > NINTH ANNUAL COST OF CYBERCRIME STUDY NINTH ANNUAL COST OF CYBERCRIME STUDY > 31
COST FRAMEWORK FOR CYBERCRIME
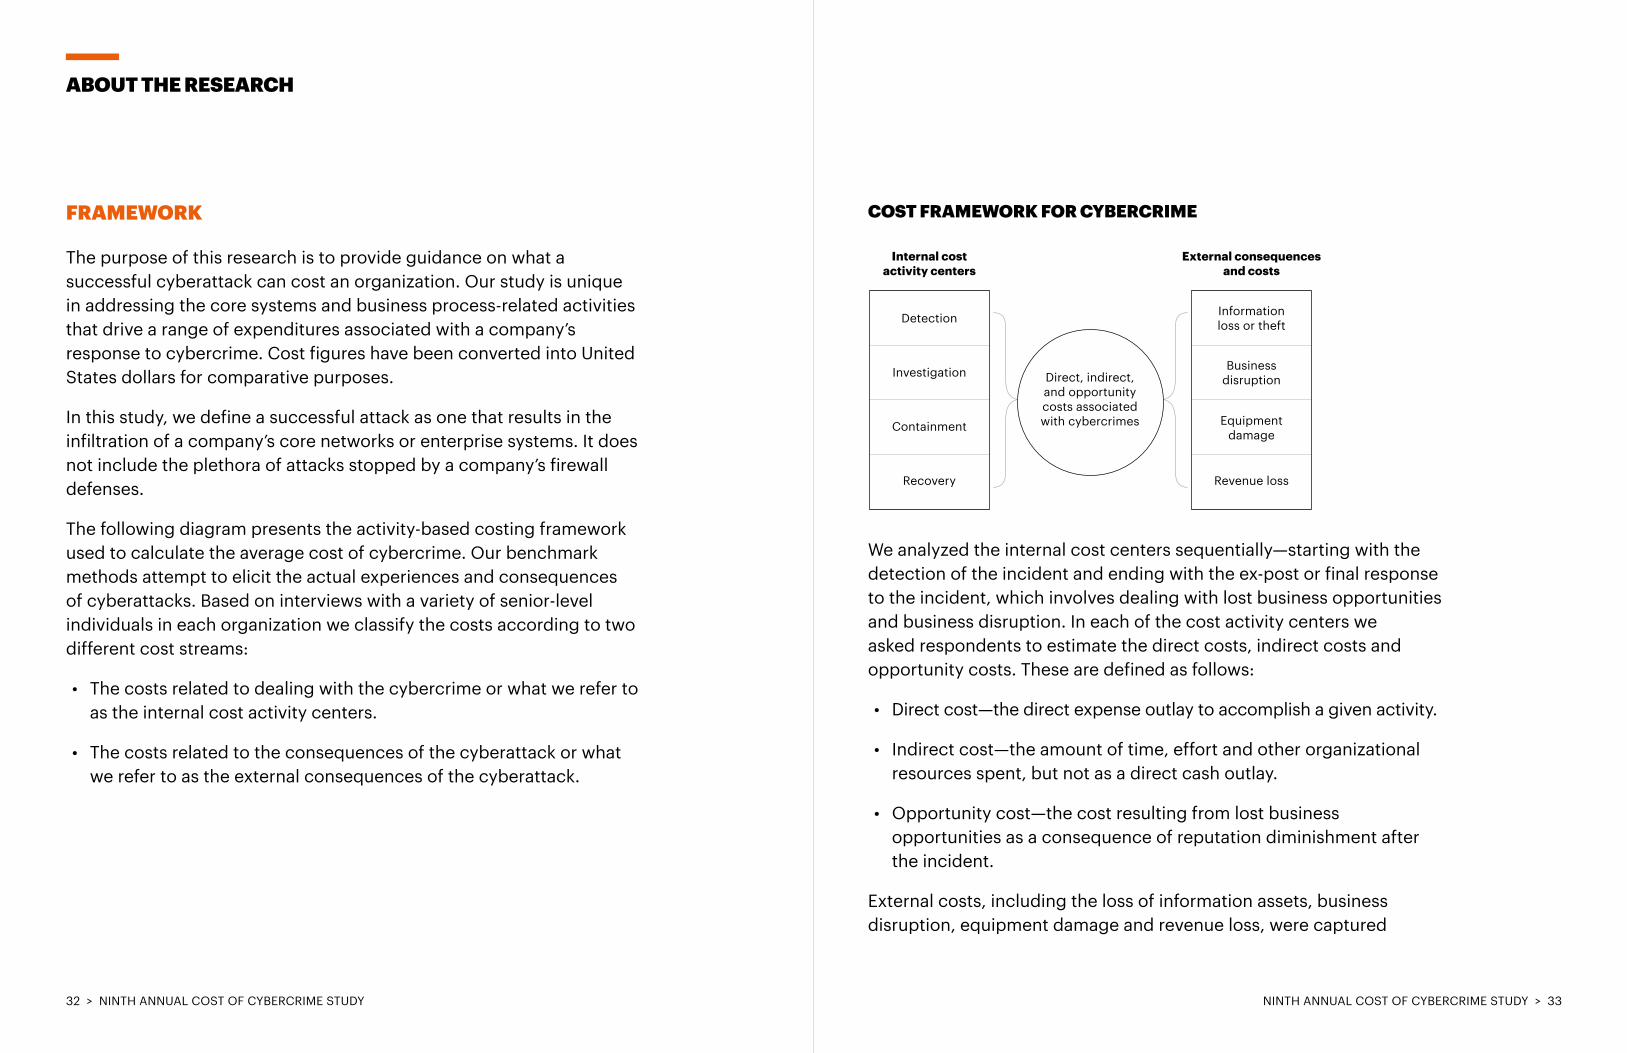
We analyzed the internal cost centers sequentially—starting with the detection of the incident and ending with the ex-post or final response to the incident, which involves dealing with lost business opportunities and business disruption. In each of the cost activity centers we asked respondents to estimate the direct costs, indirect costs and opportunity costs. These are defined as follows:
• Direct cost—the direct expense outlay to accomplish a given activity.
• Indirect cost—the amount of time, effort and other organizational resources spent, but not as a direct cash outlay.
• Opportunity cost—the cost resulting from lost business opportunities as a consequence of reputation diminishment after the incident.
External costs, including the loss of information assets, business disruption, equipment damage and revenue loss, were captured
ABOUT THE RESEARCH
Internal costactivity centers
Detection
Revenue loss
External consequencesand costs
Businessdisruption
Informationloss or theft
Equipmentdamage
Investigation
Containment
Recovery
Direct, indirect,and opportunity costs associatedwith cybercrimes
FRAMEWORK
The purpose of this research is to provide guidance on what a successful cyberattack can cost an organization. Our study is unique in addressing the core systems and business process-related activities that drive a range of expenditures associated with a company’s response to cybercrime. Cost figures have been converted into United States dollars for comparative purposes.
In this study, we define a successful attack as one that results in the infiltration of a company’s core networks or enterprise systems. It does not include the plethora of attacks stopped by a company’s firewall defenses.
The following diagram presents the activity-based costing framework used to calculate the average cost of cybercrime. Our benchmark methods attempt to elicit the actual experiences and consequences of cyberattacks. Based on interviews with a variety of senior-level individuals in each organization we classify the costs according to two different cost streams:
• The costs related to dealing with the cybercrime or what we refer to as the internal cost activity centers.
• The costs related to the consequences of the cyberattack or what we refer to as the external consequences of the cyberattack.
32 > NINTH ANNUAL COST OF CYBERCRIME STUDY NINTH ANNUAL COST OF CYBERCRIME STUDY > 33
containing costs from business disruption and information loss as well as adding new enabling technologies and control systems.
In addition to the above process-related activities, organizations often experience external consequences or costs associated with the aftermath of successful attacks—which are defined as attacks that infiltrate the organization’s network or enterprise systems. Accordingly, our research shows that three general cost activities associated with these external consequences are as follows:
Cost of information loss or theft: Loss or theft of sensitive and confidential information as a result of a cyberattack. Such information includes trade secrets, intellectual properties (including source code), customer information and employee records. This cost category also includes the cost of data breach notification in the event that personal information is wrongfully acquired.
Cost of business disruption: The economic impact of downtime or unplanned outages that prevent the organization from meeting its data processing requirements.
Cost of equipment damage: The cost to remediate equipment and other IT assets as a result of cyberattacks to information resources and critical infrastructure.
Notes: We acknowledge that these attack categories are not mutually independent and they do not represent an exhaustive list. Classification of a given attack was made by the researcher and derived from the facts collected during the benchmarking process.
Internal costs are extrapolated using labor (time) as a surrogate for direct and indirect costs. This is also used to allocate an overhead component for fixed costs such as multi-year investments in technologies.
ABOUT THE RESEARCH
11. Internal costs are extrapolated using labor (time) as a surrogate for direct and indirect costs. This is also used to allocate an overhead component for fixed costs such as multi-year investments in technologies.
using shadow-costing methods. Total costs were allocated to nine discernible attack vectors: viruses, worms, trojans, malware, botnets, Web-based attacks, phishing and social engineering, malicious insiders, stolen or damaged devices, malicious code (including SQL injection), and denial-of-services.
This study addresses the core process-related activities that drive a range of expenditures associated with a company’s cyberattack. The internal cost activity centers in our framework include:11
Discovery: Activities that enable an organization to reasonably detect and possibly deter cyberattacks or advanced threats. This includes allocated (overhead) costs of certain enabling technologies that enhance mitigation or early detection.
Investigation: Activities necessary to thoroughly uncover the source, scope, and magnitude of one or more incidents. The escalation activity also includes the steps taken to organize an initial management response.
Containment: Activities that focus on stopping or lessening the severity of cyberattacks or advanced threats. These include shutting down high-risk attack vectors such as insecure applications or endpoints.
Recovery: Activities associated with repairing and remediating the organization’s systems and core business processes. These include the restoration of damaged information assets and other IT (data center) assets. Ex-post response activities are also included in recovery to help the organization minimize potential future attacks. These include
34 > NINTH ANNUAL COST OF CYBERCRIME STUDY NINTH ANNUAL COST OF CYBERCRIME STUDY > 35
ABOUT THE RESEARCH
The size and scope of survey items was limited to known cost categories that cut across different industry sectors. In our experience, a survey focusing on process yields a higher response rate and better quality of results. We also used a paper instrument, rather than an electronic survey, to provide greater assurances of confidentiality.
To maintain complete confidentiality, the survey instrument did not capture company-specific information of any kind. Subject materials contained no tracking codes or other methods that could link responses to participating companies.
We carefully limited items to only those cost activities we considered crucial to the measurement of cybercrime cost to keep the benchmark instrument to a manageable size. Based on discussions with learned experts, the final set of items focused on a finite set of direct or indirect cost activities. After collecting benchmark information, each instrument was examined carefully for consistency and completeness. In this study, a few companies were rejected because of incomplete, inconsistent or blank responses.
Field research was conducted over several months, concluding in October 2018. To maintain consistency for all benchmark companies, information was collected about the organizations’ cybercrime experience was limited to four consecutive weeks. This time frame was not necessarily the same time period as other organizations in this study. The extrapolated direct, indirect and opportunity costs of cybercrime were annualized by dividing the total cost collected over four weeks (ratio = 4/52 weeks).
BENCHMARKING
The cost of cybercrime benchmark instrument is designed to collect descriptive information from IT, information security and other key individuals about the actual costs incurred either directly or indirectly as a result of cyberattacks actually detected. Our cost method does not require subjects to provide actual accounting results, but instead relies on estimation and extrapolation from interview data over a four-week period.
Cost estimation is based on confidential diagnostic interviews with key respondents within each benchmarked organization.
Data collection methods did not include actual accounting information, but instead relied upon numerical estimation based on the knowledge and experience of each participant. Within each category, cost estimation was a two-stage process. First, the benchmark instrument required individuals to rate direct cost estimates for each cost category by marking a range variable defined in the following number-line format.
The numerical value obtained from the number line, rather than a point estimate for each presented cost category, preserved confidentiality and ensured a higher response rate. The benchmark instrument also required practitioners to provide a second estimate for indirect and opportunity costs, separately.
Cost estimates were then compiled for each organization based on the relative magnitude of these costs in comparison to a direct cost within a given category. Finally, we administered general interview questions to obtain additional facts, including estimated revenue losses as a result of the cybercrime.
36 > NINTH ANNUAL COST OF CYBERCRIME STUDY NINTH ANNUAL COST OF CYBERCRIME STUDY > 37
ABOUT THE RESEARCH
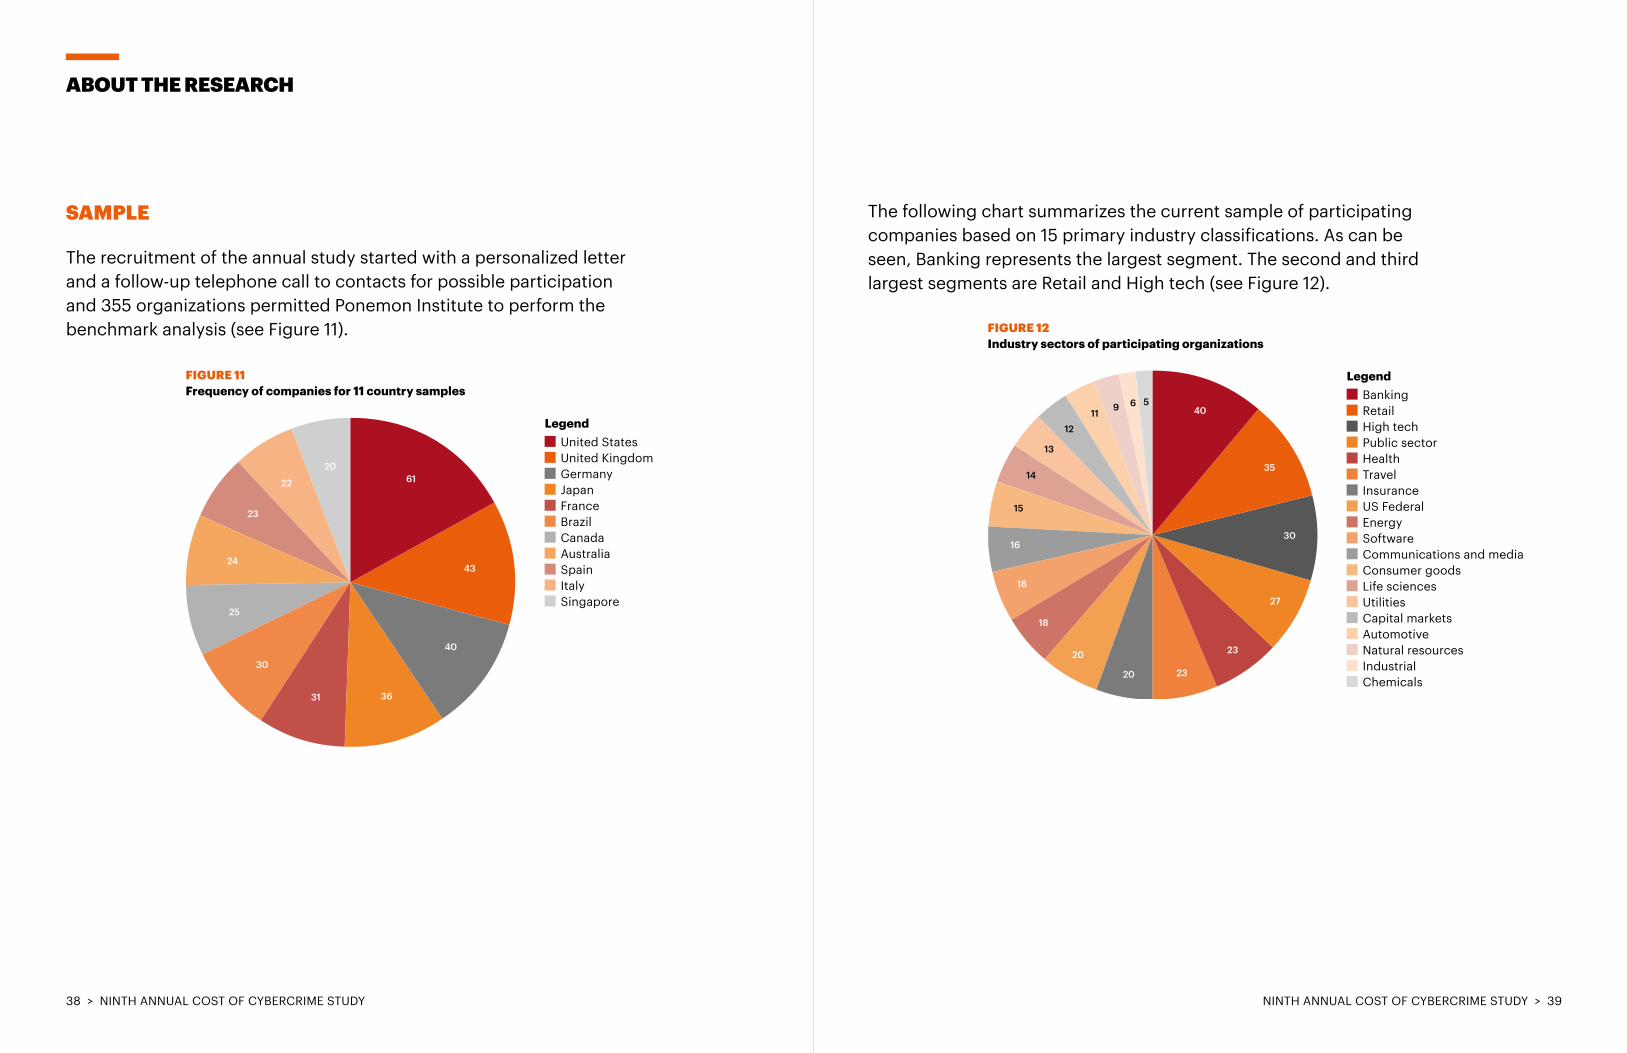
The following chart summarizes the current sample of participating companies based on 15 primary industry classifications. As can be seen, Banking represents the largest segment. The second and third largest segments are Retail and High tech (see Figure 12).
SAMPLE
The recruitment of the annual study started with a personalized letter and a follow-up telephone call to contacts for possible participation and 355 organizations permitted Ponemon Institute to perform the benchmark analysis (see Figure 11). FIGURE 12
Industry sectors of participating organizations
Legend Banking Retail High tech Public sector Health Travel Insurance US Federal Energy Software Communications and media Consumer goods Life sciences Utilities Capital markets Automotive Natural resources Industrial Chemicals
5691112
13
14
15
16
18
18
20
20 23
23
27
30
35
40
FIGURE 11 Frequency of companies for 11 country samples
Legend United States United Kingdom Germany Japan France Brazil Canada Australia Spain Italy Singapore
61
43
40
3631
30
25
24
23
22
20
38 > NINTH ANNUAL COST OF CYBERCRIME STUDY NINTH ANNUAL COST OF CYBERCRIME STUDY > 39
ABOUT THE RESEARCH
LIMITATIONS
This study utilizes a confidential and proprietary benchmark method that has been successfully deployed in earlier Ponemon Institute research. However, there are inherent limitations to benchmark research that need to be carefully considered before drawing conclusions from findings.
Non-statistical results: The purpose of this study is descriptive rather than normative inference. The current study draws upon a representative, non-statistical sample of organizations of mostly larger-sized entities experiencing one or more cyberattacks during a four-week fielding period. Statistical inferences, margins of error and confidence intervals cannot be applied to these data given the nature of our sampling plan.
Non-response: The current findings are based on a small representative sample of completed case studies. An initial mailing of benchmark surveys was sent to a targeted group of organizations, all believed to have experienced one or more cyberattacks. A total of 355 companies provided usable benchmark surveys. Non-response bias was not tested so it is always possible companies that did not participate are substantially different in terms of the methods used to manage the cybercrime containment and recovery process, as well as the underlying costs involved.
Sampling frame bias: Because our sampling frame is judgmental, the quality of results is influenced by the degree to which the frame is representative of the population of companies being studied. It is our belief that the current sampling frame is biased toward companies with more mature information security programs.
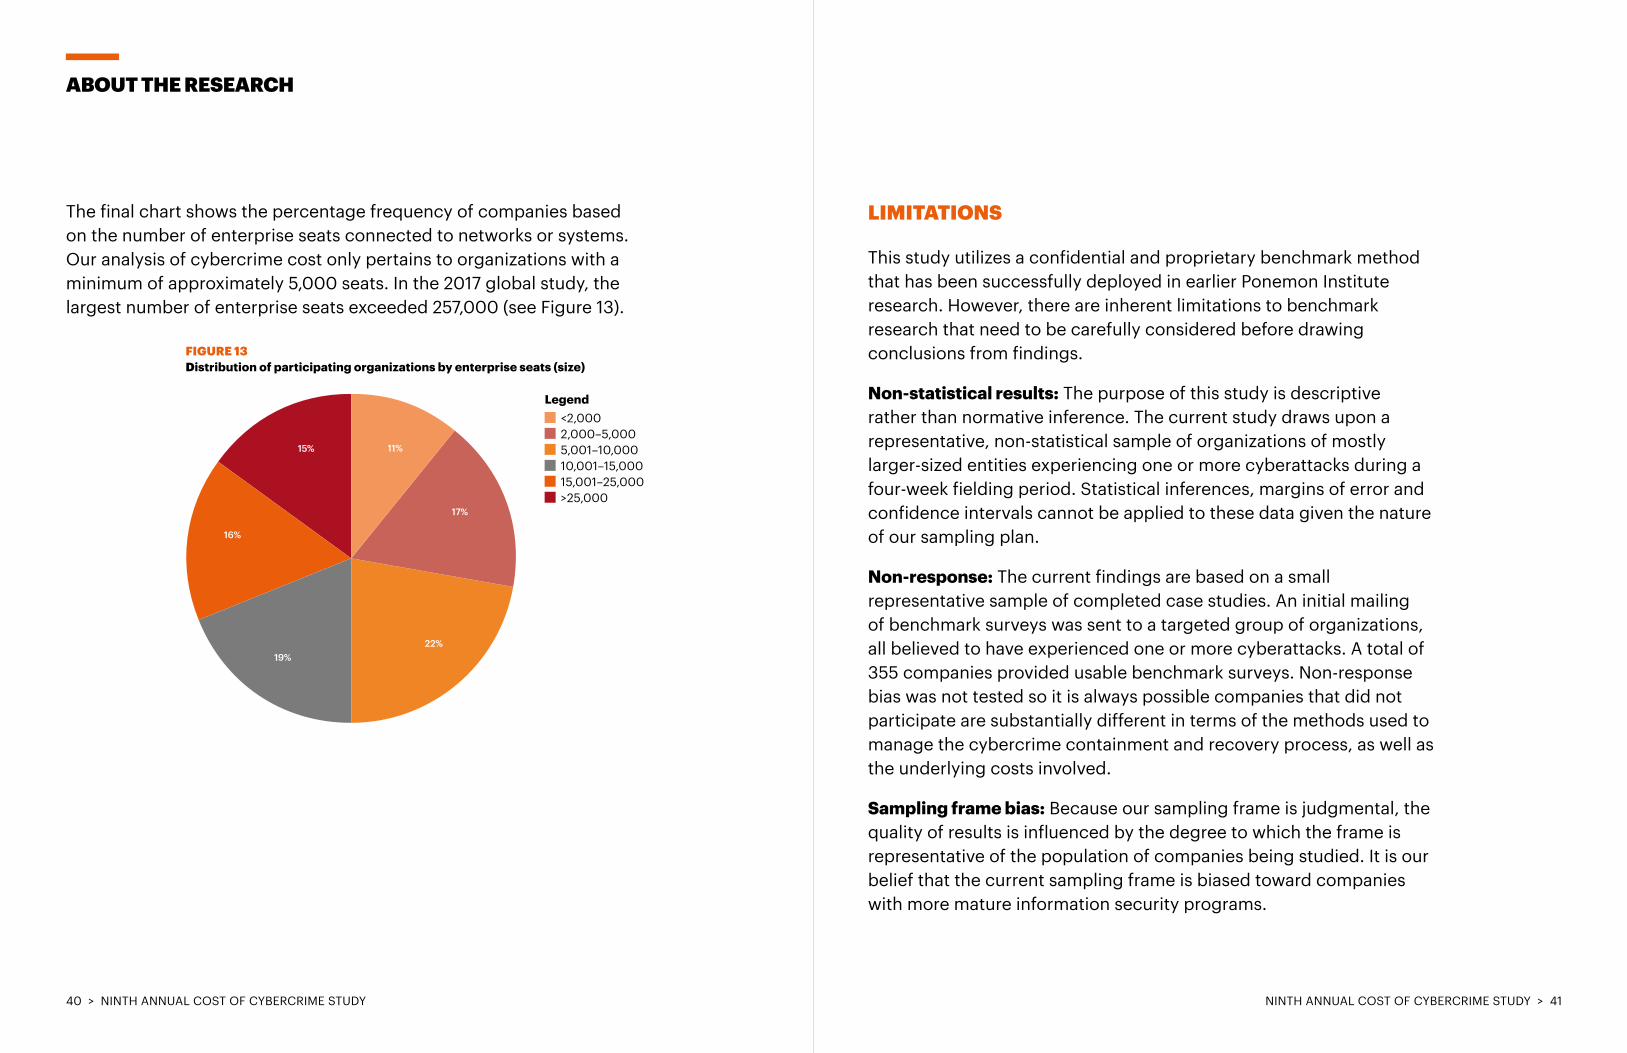
The final chart shows the percentage frequency of companies based on the number of enterprise seats connected to networks or systems. Our analysis of cybercrime cost only pertains to organizations with a minimum of approximately 5,000 seats. In the 2017 global study, the largest number of enterprise seats exceeded 257,000 (see Figure 13).
FIGURE 13 Distribution of participating organizations by enterprise seats (size)
Legend <2,000 2,000–5,000 5,001–10,000 10,001–15,000 15,001–25,000 >25,000
11%
17%
22%19%
16%
15%
40 > NINTH ANNUAL COST OF CYBERCRIME STUDY NINTH ANNUAL COST OF CYBERCRIME STUDY > 41
Company-specific information: The benchmark information is sensitive and confidential. The current instrument does not capture company-identifying information. It also enables individuals to use categorical response variables to disclose demographic information about the company and industry category. Industry classification relies on self-reported results.
Unmeasured factors: To keep the survey concise and focused, we decided to omit other important variables from our analyses such as leading trends and organizational characteristics. The extent to which omitted variables might explain benchmark results cannot be estimated at this time.
Estimated cost results: The quality of survey research is based on the integrity of confidential responses received from companies. Checks and balances were incorporated into the survey process. In addition, the use of a cost estimation technique (termed shadow costing methods) rather than actual cost data could create significant bias in presented results.
ABOUT THE RESEARCH
42 > NINTH ANNUAL COST OF CYBERCRIME STUDY
CONTACT USKelly Bissell [email protected]
Ryan LaSalle [email protected]
Paolo Dal Cin [email protected]
Ponemon Institute LLC Attn: Research Department 2308 US 31 North Traverse City, Michigan 49629 USA 1.800.887.3118 [email protected]
ABOUT ACCENTUREAccenture is a leading global professional services company, providing a broad range of services and solutions in strategy, consulting, digital, technology and operations. Combining unmatched experience and specialized skills across more than 40 industries and all business functions—underpinned by the world’s largest delivery network—Accenture works at the intersection of business and technology to help clients improve their performance and create sustainable value for their stakeholders. With approximately 469,000 people serving clients in more than 120 countries, Accenture drives innovation to improve the way the world works and lives. Visit us at www.accenture.com.
ABOUT ACCENTURE SECURITYAccenture Security helps organizations build resilience from the inside out, so they can confidently focus on innovation and growth. Leveraging its global network of cybersecurity labs, deep industry understanding across client value chains and services that span the security lifecycle, Accenture protects organization’s valuable assets, end-to-end. With services that include strategy and risk management, cyber defense, digital identity, application security and managed security, Accenture enables businesses around the world to defend against known sophisticated threats, and the unknown. Follow us @AccentureSecure on Twitter or visit the Accenture Security blog.
ABOUT PONEMON INSTITUTEAdvancing Responsible Information ManagementPonemon Institute is dedicated to independent research and education that advances responsible information and privacy management practices within business and government. Our mission is to conduct high quality, empirical studies on critical issues affecting the management and security of sensitive information about people and organizations.
We uphold strict data confidentiality, privacy and ethical research standards. We do not collect any personally identifiable information from individuals (or company identifiable information in our business research). Furthermore, we have strict quality standards to ensure that subjects are not asked extraneous, irrelevant or improper questions.
© 2019 Accenture. All rights reserved. Accenture, the Accenture logo, iDefense and other trademarks, service marks, and designs are registered or unregistered trademarks of Accenture and its subsidiaries in the United States and in foreign countries. All trademarks are properties of their respective owners. All materials are intended for the original recipient only. The reproduction and distribution of this material is forbidden without express written permission from iDefense. The opinions, statements, and assessments in this report are solely those of the individual author(s) and do not constitute legal advice, nor do they necessarily reflect the views of Accenture, its subsidiaries, or affiliates. Given the inherent nature of threat intelligence, the content contained in this alert is based on information gathered and understood at the time of its creation. It is subject to change. Accenture provides the information on an “as-is” basis without representation or warranty and accepts no liability for any action or failure to act taken in response to the information contained or referenced in this alert.
Follow us @AccentureSecure
Connect with us
Visit us at www.accenture.com