the cost of insecure mobile devices in the workplacet mobility report... · ponemon institute©...
TRANSCRIPT

The Cost of Insecure Mobile Devices in the Workplace
!
Ponemon Institute© Research Report
Sponsored by AT&T Independently conducted by Ponemon Institute LLC Publication Date: March 2014

Ponemon Institute© Research Report 1
The Cost of Insecure Mobile Devices in the Workplace
Ponemon Institute: March 2014 Part 1. Introduction Sponsored by AT&T, we are pleased to present the findings of the Cost of Insecure Mobile Devices in the Workplace. The study focuses on the risk created by employees’ use of insecure mobile devices and what the potential financial exposure could be for companies. The findings reveal that the average organization has approximately 23,000 mobile devices in use by employees within their organizations (including personally-owned mobile devices or BYOD). These include smartphones, tablets and other mobile devices. On average, 37 percent of these mobile devices are estimated to contain the organization’s sensitive content or data. The potential financial exposure of lost or stolen devices and malware-infected devices is significant. The estimated cost to organizations resulting from lost or stolen mobile devices averages $3.44 million per year. The estimated cost to organizations resulting from malware-infected devices averages $3.65 million per year. Ponemon Institute surveyed 618 IT and IT security practitioners who are familiar with their organization’s management and security of mobile devices used by employees. To ensure a knowledgeable respondent, all participants in this research have some level of responsibility for monitoring or enforcing the security of mobile devices used in the workplace. Some of the most interesting findings include the following: § The majority of organizations in this study have experienced the loss or theft of
sensitive or confidential data due to employees’ careless use of mobile devices. Sixty-three percent of respondents believe data breaches involving mobile devices occurred in their organizations.
§ Why organizations are at risk. Reasons that put sensitive data at risk on mobile devices
include the difficulty in stopping employees from using insecure mobile devices (81 percent of respondents) and the inability to detect those employees who use insecure mobile devices (67 percent of respondents).
§ Inadequate security or control features and jailbreaking contribute to the risk. While 47
percent say mobile devices used within their organization have adequate security or control features, 49 percent say they do not and 4 percent are unsure. Even if there are controls, the majority of respondents (52 percent) say employees circumvent or disable required security settings (a.k.a. jailbreaking) frequently (23 percent of respondents) and occasionally (29 percent of respondents).
§ The popularity of public cloud-based applications puts sensitive data on mobile
devices at risk. Thirty-six percent of respondents say their organization allows employees to copy sensitive or confidential data to public cloud-based applications. However, 46 percent of respondents say they are not able to manage or control what is copied in the cloud and 11 percent are unsure.
§ Companies still rely upon passwords to secure mobile devices. The top two security
measures to secure mobile devices are passwords or key lock on the device and manual policies. The least used are device level encryption and VPN from mobile device.
Ponemon Institute© Research Report 2
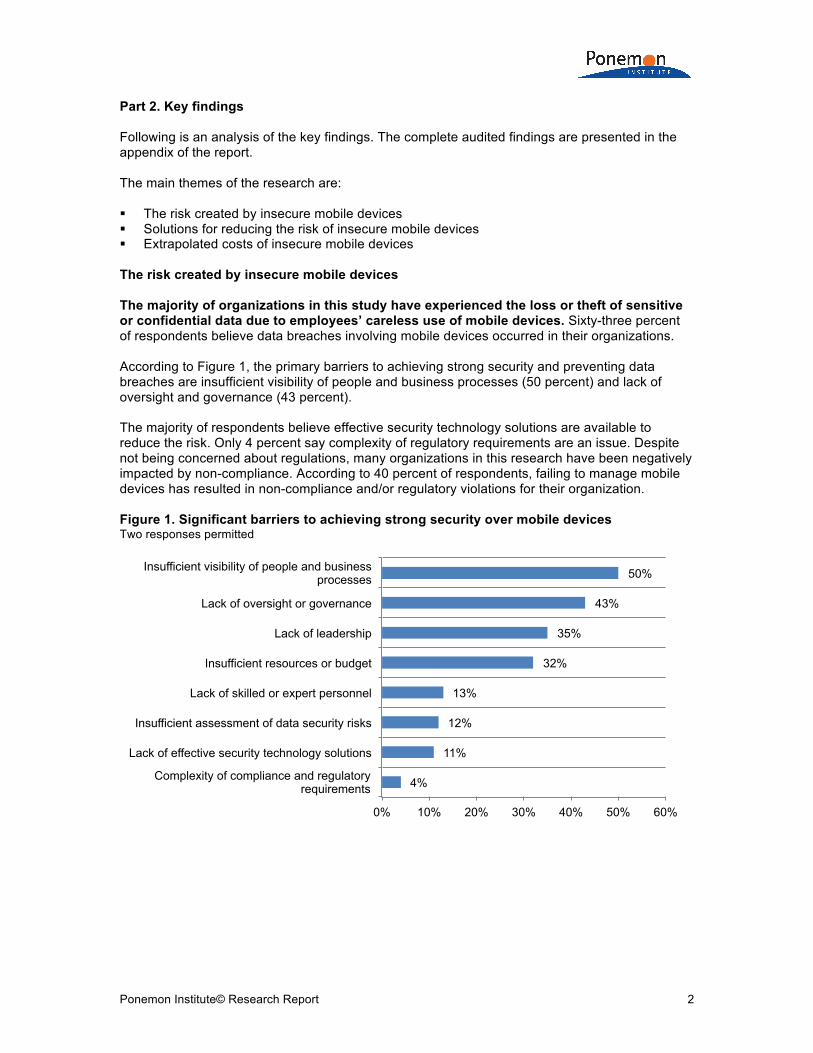
Part 2. Key findings Following is an analysis of the key findings. The complete audited findings are presented in the appendix of the report. The main themes of the research are: § The risk created by insecure mobile devices § Solutions for reducing the risk of insecure mobile devices § Extrapolated costs of insecure mobile devices The risk created by insecure mobile devices The majority of organizations in this study have experienced the loss or theft of sensitive or confidential data due to employees’ careless use of mobile devices. Sixty-three percent of respondents believe data breaches involving mobile devices occurred in their organizations. According to Figure 1, the primary barriers to achieving strong security and preventing data breaches are insufficient visibility of people and business processes (50 percent) and lack of oversight and governance (43 percent). The majority of respondents believe effective security technology solutions are available to reduce the risk. Only 4 percent say complexity of regulatory requirements are an issue. Despite not being concerned about regulations, many organizations in this research have been negatively impacted by non-compliance. According to 40 percent of respondents, failing to manage mobile devices has resulted in non-compliance and/or regulatory violations for their organization. Figure 1. Significant barriers to achieving strong security over mobile devices Two responses permitted
4%
11%
12%
13%
32%
35%
43%
50%
0% 10% 20% 30% 40% 50% 60%
Complexity of compliance and regulatory requirements
Lack of effective security technology solutions
Insufficient assessment of data security risks
Lack of skilled or expert personnel
Insufficient resources or budget
Lack of leadership
Lack of oversight or governance
Insufficient visibility of people and business processes

Ponemon Institute© Research Report 3
Figure 2 presents the biggest risks as a result of using insecure mobile devices. These are, according to respondents, leakage of information assets, reputation damage and business disruption. Figure 2. Negative consequences that could occur with insecure mobile devices 7 = most to 1 = least severe
Why organizations are at risk. Reasons that put sensitive data at risk on mobile devices include the difficulty in stopping employees from using insecure mobile devices (81 percent of respondents) and inability to detect those employees who use insecure mobile devices (67 percent of respondents), according to Figure 3. Figure 3. Why sensitive data is at risk on mobile devices Strongly agree or agree
1.71
2.16
3.61
4.75
5.72
5.99
6.22
1.00 2.00 3.00 4.00 5.00 6.00 7.00
Cost of consultants and experts
Regulatory actions or lawsuits
Customer turnover
Damage to IT systems
Business disruption
Reputation damage
Leakage of information assets
15%
26%
33%
37%
35%
40%
44%
19%
19%
31%
30%
33%
35%
37%
0% 10% 20% 30% 40% 50% 60% 70% 80% 90%
The use of employee-owned mobile devices in the workplace is encouraged
The safe use of mobile devices by employees is considered a top security priority
Unable to account for all mobile devices that connect to networks or enterprise systems
Difficult to detect employees who use insecure mobile devices
Unable to track all employee-owned mobile devices that connect to networks and enterprise
systems
Employees’ use of mobile apps and devices has substantially increased over the past 12 months
It is difficult to prevent employees use of insecure mobile devices
Ponemon Institute© Research Report 4
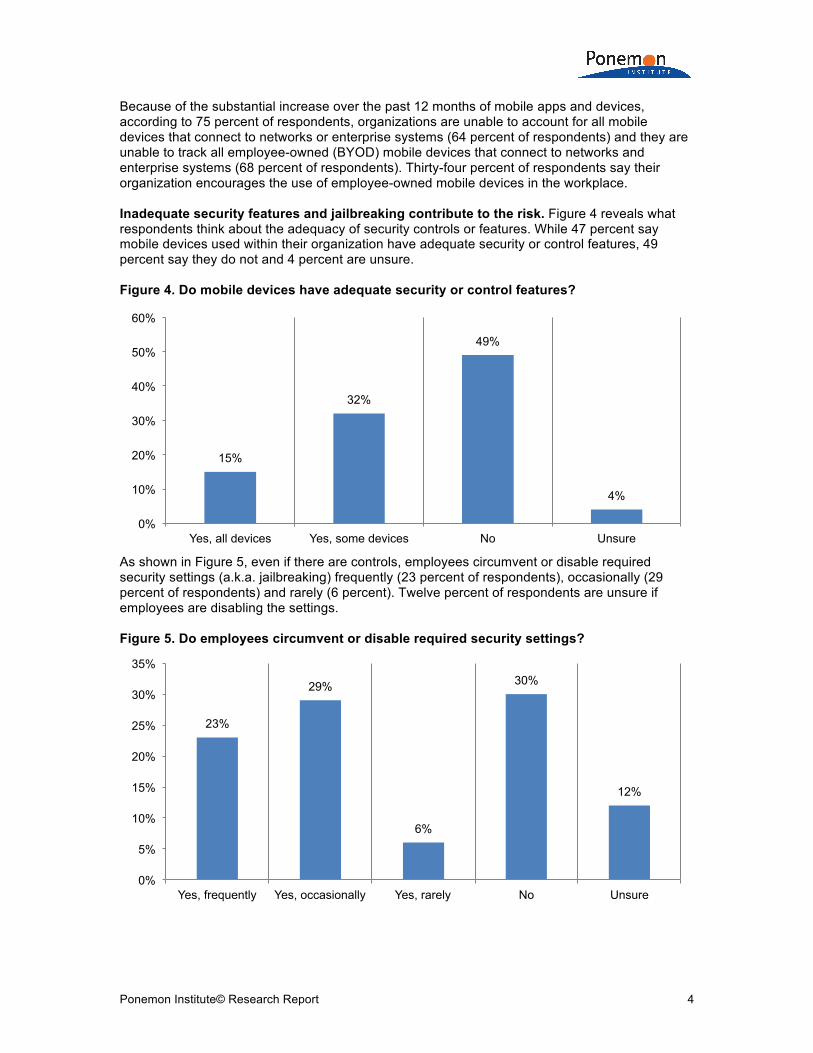
Because of the substantial increase over the past 12 months of mobile apps and devices, according to 75 percent of respondents, organizations are unable to account for all mobile devices that connect to networks or enterprise systems (64 percent of respondents) and they are unable to track all employee-owned (BYOD) mobile devices that connect to networks and enterprise systems (68 percent of respondents). Thirty-four percent of respondents say their organization encourages the use of employee-owned mobile devices in the workplace. Inadequate security features and jailbreaking contribute to the risk. Figure 4 reveals what respondents think about the adequacy of security controls or features. While 47 percent say mobile devices used within their organization have adequate security or control features, 49 percent say they do not and 4 percent are unsure. Figure 4. Do mobile devices have adequate security or control features?
As shown in Figure 5, even if there are controls, employees circumvent or disable required security settings (a.k.a. jailbreaking) frequently (23 percent of respondents), occasionally (29 percent of respondents) and rarely (6 percent). Twelve percent of respondents are unsure if employees are disabling the settings. Figure 5. Do employees circumvent or disable required security settings?
15%
32%
49%
4%
0%
10%
20%
30%
40%
50%
60%
Yes, all devices Yes, some devices No Unsure
23%
29%
6%
30%
12%
0%
5%
10%
15%
20%
25%
30%
35%
Yes, frequently Yes, occasionally Yes, rarely No Unsure

Ponemon Institute© Research Report 5
The popularity of public cloud-based applications puts sensitive data on mobile devices at risk. Thirty-six percent of respondents say their organization allows employees to copy sensitive or confidential data to public cloud-based applications. However, as shown in Figure 6, 46 percent of respondents say they are not able to manage or control what is copied in the cloud and 11 percent are unsure. Figure 6. The ability to manage and control what is copied in the cloud
Solutions for reducing the risk of insecure mobile devices Have and enforce a policy that specifies the acceptable use of personally owned mobile devices in the workplace. According to Figure 7, 46 percent of respondents say their organizations do not have a policy and 6 percent are unsure. The policy should provide guidelines on the appropriate steps to take to protect sensitive and confidential information on the mobile devices. The policy should also explain how these guidelines will be enforced and why employees should not engage in jailbreaking. Figure 7. Policy that specifies the acceptable use of personally owned mobile devices
43% 46%
11%
0%
5%
10%
15%
20%
25%
30%
35%
40%
45%
50%
Yes No Unsure
48% 46%
6%
0%
10%
20%
30%
40%
50%
60%
Yes No Unsure

Ponemon Institute© Research Report 6
Implement security measures to make sure all mobile devices used in the workplace are secure. Figure 8 shows the top 7 security measures taken by the organizations represented in this research. Most organizations require passwords or key locks (65 percent), manual policies and SOPs (64 percent), anti-malware/anti-virus software (59 percent) and network security solutions (55 percent). Less than half of the organizations use mobile device management, endpoint security management and device anti-theft solutions with remote wipe. Another measure to take is enhanced monitoring procedures. The majority of organizations represented in this research do not have such procedures in place. Currently, 42 percent of respondents say they use enhanced monitoring procedures. Figure 8. Top security measures organizations take to secure mobile devices More than one response permitted
Understand the types of company-related information employees access using their mobile devices. According to Figure 9, 57 percent of respondents do not know what types of company-related information is being accessed. If they do know, it is by using manual controls or monitoring of employees and network level controls. Figure 9. Do you know the company-related information employees access with mobile devices?
40%
43%
49%
55%
59%
64%
65%
0% 10% 20% 30% 40% 50% 60% 70%
Device anti-theft solutions with remote wipe
Endpoint security management
Mobile device management
Network security solutions
Anti-virus/anti-malware software
Manual policies and SOPs
Passwords or key lock on the device
43%
57%
0%
10%
20%
30%
40%
50%
60%
Yes No

Ponemon Institute© Research Report 7
Improve visibility of people and business processes. As discussed previously, the inability to have visibility into what employees are doing is a serious impediment to improving the security of mobile devices. This risk will continue to grow as the proliferation of mobile devices in the workplace continues. On average, 41 percent of all mobile devices in the workplace are employee-owned. Extrapolated costs of insecure mobile devices In this section, we attempt to estimate the economic exposure and cost that organizations may realize as a result of security lapses on mobile devices. We calculate cost utilizing an expected value framework, defined as follows: Expected value = (Probability of occurrence X Maximum exposure) The expected value is our estimate of total cost of insecure mobile devices defined from sample data for two mutually exclusive scenarios (noted below). The probability of occurrence is defined as the likelihood that a malicious insider or external attacker will compromise the insecure device. Scenario 1. The loss or theft of an employee’s mobile device: Whether by mistakes, poor judgment or incompetence, mobile devices such as smart phones, tablets and laptops are stolen or lost. Sometimes these compromised mobile devices contain unencrypted information such as contact lists, email histories and data about the employee or user. Figure 10 shows that 86 percent of respondents believe this scenario is very likely or likely to occur over the next 12 months. Figure 10. Do you believe Scenario 1 will happen over the next 12 months?
63%
23%
12%
2% 0%
10%
20%
30%
40%
50%
60%
70%
Very likely Likely Not likely No chance
Ponemon Institute© Research Report 8
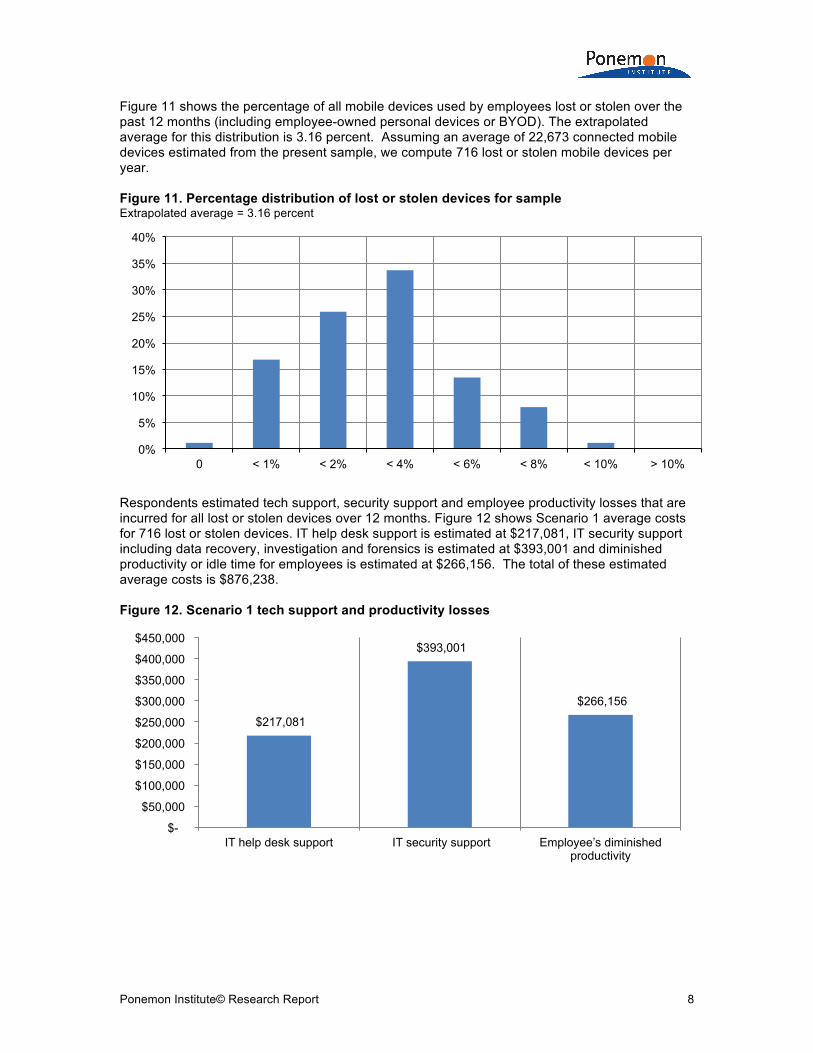
Figure 11 shows the percentage of all mobile devices used by employees lost or stolen over the past 12 months (including employee-owned personal devices or BYOD). The extrapolated average for this distribution is 3.16 percent. Assuming an average of 22,673 connected mobile devices estimated from the present sample, we compute 716 lost or stolen mobile devices per year. Figure 11. Percentage distribution of lost or stolen devices for sample Extrapolated average = 3.16 percent
Respondents estimated tech support, security support and employee productivity losses that are incurred for all lost or stolen devices over 12 months. Figure 12 shows Scenario 1 average costs for 716 lost or stolen devices. IT help desk support is estimated at $217,081, IT security support including data recovery, investigation and forensics is estimated at $393,001 and diminished productivity or idle time for employees is estimated at $266,156. The total of these estimated average costs is $876,238. Figure 12. Scenario 1 tech support and productivity losses
0%
5%
10%
15%
20%
25%
30%
35%
40%
0 < 1% < 2% < 4% < 6% < 8% < 10% > 10%
$217,081
$393,001
$266,156
$-
$50,000
$100,000
$150,000
$200,000
$250,000
$300,000
$350,000
$400,000
$450,000
IT help desk support IT security support Employee’s diminished productivity

Ponemon Institute© Research Report 9
Figure 13 shows the percentage of lost or stolen mobile devices used by employees that will be compromised over the next 12 months. The extrapolated average for this distribution is 4.44 percent. Assuming an average of 716 lost or stolen mobile devices estimated from the present sample, we compute 32 compromised devices per year. Figure 13. Probability that one or more lost or stolen mobile devices will be compromised over the next 12 months Extrapolated average = 4.44 percent
Maximum exposure: Respondents were asked to provide an estimate of the maximum exposure resulting from 32 compromised mobile devices. The three categories of potential exposure are defined as follows:1
§ Cost associated with data breach or the value of stolen intellectual property § Cost associated with regulatory scrutiny resulting from non-compliance § Cost associated with reputation and brand damages Figure 14 summarizes the maximum exposure extrapolated from sample averages for three separate categories. Compliance cost is estimated at $11.4 million, information loss is estimated at $22.9 million and reputation damage is estimated at $23.4 million. Figure 14. Maximum exposures for Scenario 1
1Please note that the cost estimate should include all direct cash outlays, direct labor expenditures, indirect labor costs, overhead costs and lost business opportunities.
0%
5%
10%
15%
20%
25%
30%
0 < 1% < 2% < 4% < 6% < 8% < 10% > 10%
$11,449,050
$22,907,740 $23,411,210
$-
$5,000,000
$10,000,000
$15,000,000
$20,000,000
$25,000,000
Compliance costs Information losses Reputation damages

Ponemon Institute© Research Report 10
Figure 15 reports the expected values calculated for three separate categories. As noted above, expected value is the product of probability of occurrence (4.44 percent) by maximum exposure. Compliance cost is estimated at $508,791, information loss is estimated at $1,018,010 and reputation damage is estimated at $1,040,384. Figure 15. Expected values for Scenario 1
Table 1 provides a recap of all estimated costs resulting from the loss or theft of 716 mobile devices over 12 months. As reported, the extrapolated cost per lost or stolen device is $4,810 and the cost for all network connected mobile devices is $152 per device (including BYOD). Table 1. Scenario 1 recap Scenario 1 extrapolated costs Compliance costs $508,791 Information losses $1,018,010 Reputation damages $1,040,384 Tech support & productivity losses $876,237 Estimated total average costs $3,443,422 Cost per compromised devices $108,243 Cost for all lost or stolen devices $4,810 Cost for all connected mobile devices $152
$508,791
$1,018,010 $1,040,384
$-
$200,000
$400,000
$600,000
$800,000
$1,000,000
$1,200,000
Compliance costs Information losses Reputation damages

Ponemon Institute© Research Report 11
Scenario 2. Malware infections on insecure mobile devices: Employees inadvertently download mobile apps for business and personal use. These mobile apps may contain malicious software such as viruses, worms and Trojans, sometimes infecting devices that go undetected for months or even years. When activated, malware can disrupt business processes, cause IT downtime and result in the ex-filtration of sensitive or confidential data. Figure 16 shows that 92 percent of respondents believe this scenario is very likely or likely to occur one or more times over the next 12 months. Figure 16. Do you believe this Scenario 2 will happen over the next 12 months?
Figure 17 shows the percentage of all mobile devices infected by malware over the past 12 months (including employee-owned personal devices or BYOD). The extrapolated average for this distribution is 4.13 percent. Assuming an average of 22,673 connected mobile devices estimated from the present sample, we compute 936 malware infected mobile devices per year. Figure 17. Percentage distribution malware-infected mobile devices for sample Extrapolated average = 4.13 percent
72%
20%
5% 3%
0%
10%
20%
30%
40%
50%
60%
70%
80%
Very likely Likely Not likely No chance
0%
5%
10%
15%
20%
25%
30%
35%
0 < 1% < 2% < 4% < 6% < 8% < 10% > 10%

Ponemon Institute© Research Report 12
Figure 18 shows Scenario 2 average costs for 936 malware-infected devices. IT help desk support is estimated at $316,894, IT security support including data recovery, investigation and forensics is estimated at $205,286 and diminished productivity or idle time for employees is estimated at $299,058. The total of these estimated average costs is $821,238. Figure 18. Scenario 2 tech support and productivity losses
Figure 19 shows the percentage of malware-infected mobile devices used by employees that will be compromised over the next 12 months. The extrapolated average for this distribution is 5.08 percent. Assuming an average of 936 malware-infected mobile devices estimated from the present sample, we compute 48 compromised devices per year. Figure 19. Probability that one or more malware-infected mobile devices will be compromised over the next 12 months Extrapolated average = 5.08 percent
$316,894
$205,286
$299,058
$-
$50,000
$100,000
$150,000
$200,000
$250,000
$300,000
$350,000
IT help desk support IT security support Employee's diminished productivity
0%
5%
10%
15%
20%
25%
30%
0 < 1% < 2% < 4% < 6% < 8% < 10% > 10%

Ponemon Institute© Research Report 13
Maximum exposure: Respondents were asked to provide an estimate of the maximum exposure resulting from 48 mobile devices that are seriously compromised as a result of a malware infection. The three categories of potential exposure are defined as follows:2 § Cost associated with the loss of sensitive or confidential information § Cost associated with regulatory scrutiny resulting from non-compliance § Cost associated with reputation and brand damages
Figure 20 summarizes the maximum exposure extrapolated from sample averages for three separate categories. Compliance cost is estimated at $12.4 million, reputation damage is estimated at $20.3 million and information loss is estimated at $23.0 million. Figure 20. Maximum exposures for Scenario 2
2Please note that the cost estimate should include all direct cash outlays, direct labor expenditures, indirect labor costs, overhead costs and lost business opportunities.
$12,444,840
$20,272,830
$23,001,530
$-
$5,000,000
$10,000,000
$15,000,000
$20,000,000
$25,000,000
Compliance costs Reputation damages Information losses
Ponemon Institute© Research Report 14
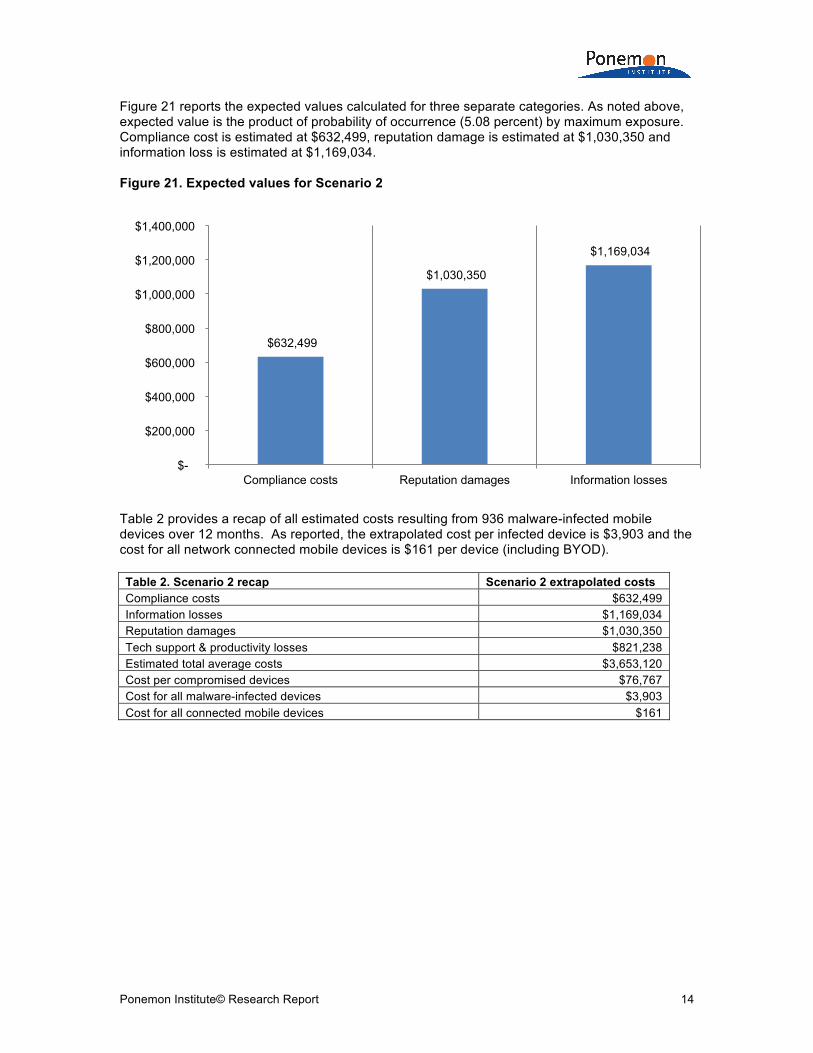
Figure 21 reports the expected values calculated for three separate categories. As noted above, expected value is the product of probability of occurrence (5.08 percent) by maximum exposure. Compliance cost is estimated at $632,499, reputation damage is estimated at $1,030,350 and information loss is estimated at $1,169,034. Figure 21. Expected values for Scenario 2
Table 2 provides a recap of all estimated costs resulting from 936 malware-infected mobile devices over 12 months. As reported, the extrapolated cost per infected device is $3,903 and the cost for all network connected mobile devices is $161 per device (including BYOD). Table 2. Scenario 2 recap Scenario 2 extrapolated costs Compliance costs $632,499 Information losses $1,169,034 Reputation damages $1,030,350 Tech support & productivity losses $821,238 Estimated total average costs $3,653,120 Cost per compromised devices $76,767 Cost for all malware-infected devices $3,903 Cost for all connected mobile devices $161
$632,499
$1,030,350
$1,169,034
$-
$200,000
$400,000
$600,000
$800,000
$1,000,000
$1,200,000
$1,400,000
Compliance costs Reputation damages Information losses

Ponemon Institute© Research Report 15
Part 3. Methods
A sampling frame of 16,558 experienced IT and IT security practitioners located in all regions of the United States were selected as participants to this survey. To ensure knowledgeable responses, all participants in this research have some level of familiarity of their organization’s management and security of mobile devices used by employees. Table 3 shows 803 returns. Screening and reliability checks required the removal of 185 surveys. Our final sample consisted of 618 surveys (3.7 percent response rate). Table 3. Sample response Freq Pct% Total sampling frame 16,558 100.0% Total returns 803 4.8% Rejected & screened surveys 185 1.1% Final sample 618 3.7%
Pie Chart 1 reports the respondent’s organizational level within participating organizations. By design, 56 percent of respondents are at or above the supervisory levels. Pie Chart 1. Current position within the organization
Pie Chart 2 reports the primary person the respondent or their immediate supervisor reports to. Sixty-three percent report to the CIO and 18 percent report to the CISO. Pie Chart 2. Respondents’ reporting channel
1% 2%
16%
21%
16%
36%
5%
3%
Senior Executive Vice President Director Manager Supervisor Technician Staff Other
63% 18%
9%
5%
2% 2% 1%
Chief Information Officer
Chief Information Security Officer
Chief Risk Officer
Chief compliance Officer
Chief Financial Officer
Chief Security Officer
CEO/Executive Committee

Ponemon Institute© Research Report 16
Pie Chart 3 reports the industry segments of respondents’ organizations. This chart identifies financial services (19 percent) as the largest segment, followed by health & pharmaceutical, public sector and retail. Pie Chart 3. Industry distribution of respondents’ organizations
As shown in Pie Chart 4, 75 percent of respondents are from organizations with a global headcount of 1,000 or more employees.
Pie Chart 4. Worldwide headcount of the organization
19%
13%
9%
9% 8%
7%
6%
5%
5%
4%
4%
3% 3%
5% Financial services Health & pharmaceutical Public sector Retailing Industrial Consumer products Services Hospitality Technology & software Entertainment & media Transportation Education & research Energy & utilities Other
11%
14%
21%
21%
20%
7% 6%
Less than 500
501 to 1,000
1,001 to 5,000
5,001 to 10,000
10,001 to 25,000
25,001 to 75,000
More than 75,000

Ponemon Institute© Research Report 17
Part 5. Caveats to this study There are inherent limitations to survey research that need to be carefully considered before drawing inferences from findings. The following items are specific limitations that are germane to most web-based surveys. ! Non-response bias: The current findings are based on a sample of survey returns. We sent
surveys to a representative sample of individuals, resulting in a large number of usable returned responses. Despite non-response tests, it is always possible that individuals who did not participate are substantially different in terms of underlying beliefs from those who completed the instrument.
! Sampling-frame bias: The accuracy is based on contact information and the degree to which
the list is representative of individuals who are IT or IT security practitioners. We also acknowledge that the results may be biased by external events such as media coverage. Finally, because we used a web-based collection method, it is possible that non-web responses by mailed survey or telephone call would result in a different pattern of findings.
! Self-reported results: The quality of survey research is based on the integrity of confidential
responses received from subjects. While certain checks and balances can be incorporated into the survey process, there is always the possibility that a subject did not provide accurate responses.

Ponemon Institute© Research Report 18
Appendix: Detailed Survey Results
The following tables provide the frequency or percentage frequency of responses to all survey questions contained in this study. All survey responses were captured in December 2013.
Sample response Freq Pct% Total sampling frame 16,558 100.0% Total returns 803 4.8% Rejected & screened surveys 185 1.1% Final sample 618 3.7% Part 1. Screening questions S1. How familiar are you with your organization’s management and security of mobile devices used by employees in the workplace? Pct% Very familiar 32% Familiar 42% Somewhat familiar 26% Little or no knowledge (Stop) 0% Total 100% S2. Do you have responsibility for monitoring or enforcing the security of mobile devices used in the workplace, including employee-owned devices (a.k.a. BYOD)? Pct% Yes, full responsibility 35% Yes, some responsibility 65% Minimal or no responsibility (Stop) 0% Total 100%
Part 2. Attributions Strongly
agree Agree Q1a. My organization is unable to account for all mobile devices that connect to networks or enterprise systems. 33% 31% Q1b. My organization is unable to track all employee-owned (BYOD) mobile devices that connect to networks and enterprise systems. 35% 33% Q1c. The inability to manage mobile devices is increasing my organization’s operational cost and reducing efficiency of business processes. 29% 30% Q1d. Employees’ use of mobile apps and devices has caused a spike in malware infections. 20% 21% Q1e. Employees’ use of mobile apps and devices has substantially increased over the past 12 months. 40% 35% Q1f. Failing to manage mobile devices has resulted in non-compliance and/or regulatory violations for my organization. 19% 21% Q1g. My organization considers the safe use of mobile devices by employees a top security priority. 26% 19% Q1h. My organization encourages the use of employee-owned mobile devices in the workplace. 15% 19% Q1i. My organization is vigilant in protecting sensitive or confidential data on mobile devices. 14% 16% Q1j. It is difficult to prevent employees from using insecure mobile devices. 44% 37% Q1k. It is difficult to detect employees who use insecure mobile devices. 37% 30% Q1l. Employees have privacy concerns about the organization scanning their personally owned (BYOD) mobile devices for malware and other vulnerabilities. 22% 18%

Ponemon Institute© Research Report 19
Part 3. General Questions Q2. Did your organization’s IT helpdesk and/or security support activities increase as a result of mobile device usage by employees? Pct% Yes, significant increase 17% Yes, moderate increase 33% Yes, nominal increase 18% No increase 24% Unsure 8% Total 100% Q3. Do you believe your organization has lost sensitive or confidential data as a result of employee carelessness while using mobile devices in the workplace? Pct% Yes, with certainty 20% Yes, most likely 24% Yes, likely 19% Unlikely 8% No 21% Unsure 8% Total 100% Q4a. Approximately, how many mobile devices are in use by employees within your organization today? Please include smartphones, tablets and other portable mobile devices used in the workplace. Pct% Less than 500 7% 501 to 1,000 13% 1,001 to 5,000 16% 5,001 to 10,000 20% 10,001 to 50,000 21% 50,001 to 100,000 8% More than 100,000 5% Cannot determine 10% Total 100% Q4b. Approximately, what is the percentage of all mobile devices used by employees within your organization over the past 12 months were lost or stolen? Pct% Zero 1% Less than 1% 15% 1 to 2% 23% 3 to 4% 30% 5 to 6% 12% 7 to 8% 7% 9 to 10% 1% More than 10% 0% Cannot determine 11% Total 100%

Ponemon Institute© Research Report 20
Q4c. Approximately, what is the percentage of all mobile devices used by employees within your organization over the past 12 months were infected with malware? Pct% Zero 5% Less than 1% 7% 1 to 2% 27% 3 to 4% 22% 5 to 6% 8% 7 to 8% 8% 9 to 10% 4% More than 10% 10% Cannot determine 9% Total 100% Q4d. Approximately, what is the percentage of mobile devices containing sensitive or confidential content or data? Pct% None 13% Less than 10% 13% 10 to 25% 11% 26 to 50% 19% 51 to 75% 22% 76 to 100% 10% Cannot determine 12% Total 100% Q5. Approximately, what is the percentage of employee-owned mobile devices used within your organization (BYOD)? Pct% None 8% Less than 10% 6% 10 to 25% 14% 26 to 50% 28% 51 to 75% 23% 76 to 100% 10% Cannot determine 11% Total 100% Q6. Does your organization have a policy that specifies the acceptable use of personally owned mobile devices in the workplace? Pct% Yes 48% No 46% Unsure 6% Total 100%

Ponemon Institute© Research Report 21
Q7. What security measures does your organization take to secure mobile devices? Please check all that apply. Pct% Mobile DRM 23% Mobile device management (MDM) 49% Mobile application management (MAM) 26% Complete virtual desktop approach 19% VPN from mobile device 18% Manual policies and SOPs 64% Anti-virus/anti-malware software 59% Passwords or key lock on the device 65% Device anti-theft solutions with remote wipe 40% Client firewall on the mobile device 32% Device blacklisting or white listing 20% Network security solutions 55% Use of device level encryption 17% Endpoint security management 43% Device monitoring 29% None of the above 20% Q8. In your opinion, do mobile devices used within your organization have adequate security or control features? Pct% Yes, all devices 15% Yes, some devices 32% No 49% Unsure 4% Total 100% Q9. Do employees ever circumvent or disable required security settings on their mobile devices (a.k.a. jail breaking)? Pct% Yes, frequently 23% Yes, occasionally 29% Yes, rarely 6% No 30% Unsure 12% Total 100% Q10. Does your organization have enhanced monitoring procedures for mobile devices used by employees who have access to or use sensitive or confidential information? Pct% Yes 42% No 50% Unsure 8% Total 100% Q11. Does your organization permit contractors to access business applications from their mobile devices? Pct% Yes 35% No 55% Unsure 10% Total 100% Q12a. Do you know what types of company-related information employees access using their mobile devices? Pct% Yes 43% No 57% Total 100%

Ponemon Institute© Research Report 22
Q12b. If yes, what tools or procedures enable you to know? Please select all that apply. Pct% Manual controls over users 76% Manual monitoring of users 73% Software that scans devices 41% Forensics tools and capabilities 27% Network level controls 73% Next generation firewalls (NGFW) 15% Network proxy 28% Data loss prevention 13% Don’t know 12% Other (please specify) 6% Q13a. Does your organization allow employees to copy sensitive or confidential data to public cloud-based applications? Pct% Yes 36% No 55% Unsure 9% Total 100% Q13b. If yes, are you able to manage and control what is copied in the cloud? Pct% Yes 43% No 46% Unsure 11% Total 100% Q14. Please rank each one of the following seven negative consequences that could occur if employees use insecure mobile devices, from 1 = most to 7 = least severe.
Average rank Rank order
Leakage of information assets 1.78 1 Damage to IT systems 3.25 4 Business disruption 2.28 3 Regulatory actions or lawsuits 5.84 6 Reputation damage 2.01 2 Customer turnover 4.39 5 Cost of outside consultants and experts 6.29 7 Q15. What do you see as the most significant barriers to achieving strong security over employee access and use of mobile devices? Please select your top two choices. Pct% Insufficient resources or budget 32% Lack of effective security technology solutions 11% Lack of skilled or expert personnel 13% Lack of leadership 35% Lack of oversight or governance 43% Insufficient visibility of people and business processes 50% Insufficient assessment of data security risks 12% Complexity of compliance and regulatory requirements 4% Total 200%
Ponemon Institute© Research Report 23
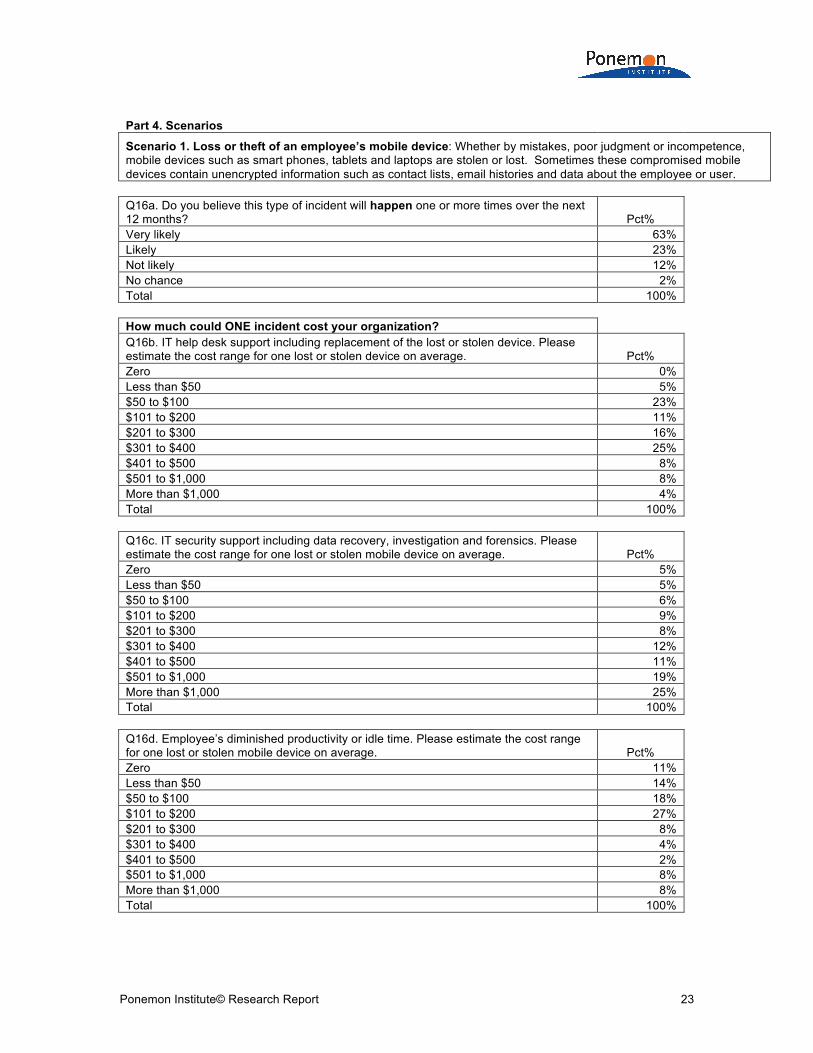
Part 4. Scenarios
Scenario 1. Loss or theft of an employee’s mobile device: Whether by mistakes, poor judgment or incompetence, mobile devices such as smart phones, tablets and laptops are stolen or lost. Sometimes these compromised mobile devices contain unencrypted information such as contact lists, email histories and data about the employee or user. Q16a. Do you believe this type of incident will happen one or more times over the next 12 months? Pct% Very likely 63% Likely 23% Not likely 12% No chance 2% Total 100% How much could ONE incident cost your organization? Q16b. IT help desk support including replacement of the lost or stolen device. Please estimate the cost range for one lost or stolen device on average. Pct% Zero 0% Less than $50 5% $50 to $100 23% $101 to $200 11% $201 to $300 16% $301 to $400 25% $401 to $500 8% $501 to $1,000 8% More than $1,000 4% Total 100% Q16c. IT security support including data recovery, investigation and forensics. Please estimate the cost range for one lost or stolen mobile device on average. Pct% Zero 5% Less than $50 5% $50 to $100 6% $101 to $200 9% $201 to $300 8% $301 to $400 12% $401 to $500 11% $501 to $1,000 19% More than $1,000 25% Total 100% Q16d. Employee’s diminished productivity or idle time. Please estimate the cost range for one lost or stolen mobile device on average. Pct% Zero 11% Less than $50 14% $50 to $100 18% $101 to $200 27% $201 to $300 8% $301 to $400 4% $401 to $500 2% $501 to $1,000 8% More than $1,000 8% Total 100%

Ponemon Institute© Research Report 24
Q16e. What is your best estimate of the probability that one or more lost or stolen mobiles device will be compromised over the next 12 months? Pct% Zero 2% Less than 1% 11% 1 to 2% 13% 3 to 4% 25% 5 to 6% 19% 7 to 8% 12% 9 to 10% 4% More than 10% 5% Cannot determine 9% Total 100% Q16f. How much could this incident cost your organization in terms of the value of the data stolen? Please provide the maximum exposure or "worst case" scenario. Pct% Zero 0% Less than $10,000 1% $10,001 to $100,000 3% $100,001 to $250,000 2% $250,001 to $500,000 12% $500,001 to $1,000,000 11% $1,000,001 to $5,000,000 10% $5,000,001 to $10,000,000 13% $10,000,001 to $25.000,000 13% $25,000,001 to $50,000,000 11% $50,00,001 to $100,000,000 4% More than $100,000,000 11% Cannot determine 9% Total 100% Q16g. How much could the theft of sensitive or confidential data cost your organization in terms of non-compliance or regulatory violations? Please provide the maximum exposure or "worst case" scenario. Pct% Zero 0% Less than $10,000 0% $10,001 to $100,000 1% $100,001 to $250,000 2% $250,001 to $500,000 10% $500,001 to $1,000,000 11% $1,000,001 to $5,000,000 20% $5,000,001 to $10,000,000 15% $10,000,001 to $25.000,000 12% $25,000,001 to $50,000,000 6% $50,00,001 to $100,000,000 7% More than $100,000,000 5% Cannot determine 11% Total 100%

Ponemon Institute© Research Report 25
Q16h. How much could this incident cost your organization in terms of your organization’s reputation and customer goodwill? Please provide the maximum exposure or "worst case" scenario. Pct% Zero 0% Less than $10,000 4% $10,001 to $100,000 2% $100,001 to $250,000 2% $250,001 to $500,000 5% $500,001 to $1,000,000 3% $1,000,001 to $5,000,000 8% $5,000,001 to $10,000,000 8% $10,000,001 to $25.000,000 13% $25,000,001 to $50,000,000 18% $50,00,001 to $100,000,000 18% More than $100,000,000 8% Cannot determine 11% Total 100% Scenario 1 recap (total exposure) Exposure Value of data $22,907,740 Compliance cost $11,449,050 Reputation damage $23,411,210 Total $57,768,000
Scenario 1 recap (expected value) Expected
value Value of data $1,018,010 Compliance cost $508,791 Reputation damage $1,040,384 Total $2,567,185 Plus out of pocket cost $876,237 Total value $3,443,422 Estimated cost per device $4,810
Scenario 2. Malware infections on insecure mobile devices: Employees inadvertently download mobile apps for business and personal use. These mobile apps may contain malicious software such as viruses, worms and trojans, sometimes infecting devices that go undetected for months or even years. When activated, malware can disrupt business processes, cause IT downtime and result in the ex-filtration of sensitive or confidential data. Q17a. Do you believe this type of incident will happen one or more times over the next 12 months? Pct% Very likely 72% Likely 20% Not likely 5% No chance 3% Total 100%

Ponemon Institute© Research Report 26
How much could ONE incident cost your organization? Q17b. IT help desk support including replacement of the infected mobile device. Please estimate the cost range for one infected mobile device on average. Pct% Zero 0% Less than $50 13% $50 to $100 11% $101 to $200 15% $201 to $300 15% $301 to $400 21% $401 to $500 8% $501 to $1,000 9% More than $1,000 8% Total 100% Q17c. IT security support including data recovery, investigation and forensics. Please estimate the cost range for one infected mobile device on average. Pct% Zero 3% Less than $50 25% $50 to $100 15% $101 to $200 11% $201 to $300 20% $301 to $400 11% $401 to $500 10% $501 to $1,000 2% More than $1,000 3% Total 100% Q17d. Employee’s diminished productivity or idle time. Please estimate the cost range for one infected mobile device on average. Pct% Zero 3% Less than $50 11% $50 to $100 12% $101 to $200 15% $201 to $300 18% $301 to $400 12% $401 to $500 14% $501 to $1,000 9% More than $1,000 6% Total 100% Q17e. What is your best estimate of the probability that one or more malware-infected mobiles device will compromise your organization's networks or enterprise systems over the next 12 months? Pct% Zero 1% Less than 1% 10% 1 to 2% 11% 3 to 4% 19% 5 to 6% 23% 7 to 8% 13% 9 to 10% 5% More than 10% 9% Cannot determine 9% Total 100%

Ponemon Institute© Research Report 27
Q17f. How much could this incident cost your organization in terms of the value of data or systems compromised? Please provide the maximum exposure or "worst case" scenario. Pct% Zero 1% Less than $10,000 2% $10,001 to $100,000 2% $100,001 to $250,000 3% $250,001 to $500,000 4% $500,001 to $1,000,000 10% $1,000,001 to $5,000,000 11% $5,000,001 to $10,000,000 14% $10,000,001 to $25.000,000 17% $25,000,001 to $50,000,000 10% $50,00,001 to $100,000,000 8% More than $100,000,000 8% Cannot determine 10% Total 100% Q17g. How much could the compromise cost your organization in terms of non-compliance or regulatory violations? Please provide the maximum exposure or "worst case" scenario. Pct% Zero 0% Less than $10,000 1% $10,001 to $100,000 0% $100,001 to $250,000 2% $250,001 to $500,000 9% $500,001 to $1,000,000 9% $1,000,001 to $5,000,000 18% $5,000,001 to $10,000,000 12% $10,000,001 to $25.000,000 13% $25,000,001 to $50,000,000 7% $50,00,001 to $100,000,000 8% More than $100,000,000 9% Cannot determine 12% Total 100% Q17h. How much did (or could) this incident cost your organization in terms of your organization’s reputation and customer goodwill? Please provide the maximum exposure or "worst case" scenario. Pct% Zero 1% Less than $10,000 2% $10,001 to $100,000 3% $100,001 to $250,000 2% $250,001 to $500,000 6% $500,001 to $1,000,000 6% $1,000,001 to $5,000,000 10% $5,000,001 to $10,000,000 12% $10,000,001 to $25.000,000 10% $25,000,001 to $50,000,000 16% $50,00,001 to $100,000,000 15% More than $100,000,000 7% Cannot determine 10% Total 100%
Ponemon Institute© Research Report 28
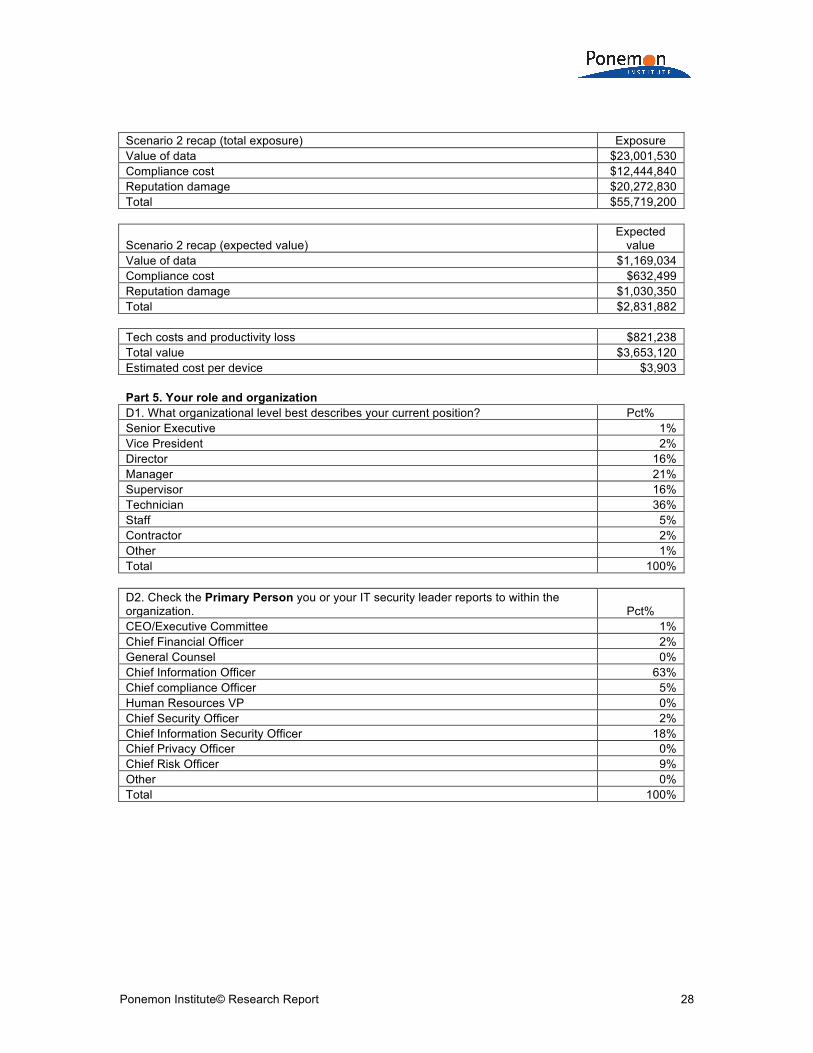
Scenario 2 recap (total exposure) Exposure Value of data $23,001,530 Compliance cost $12,444,840 Reputation damage $20,272,830 Total $55,719,200
Scenario 2 recap (expected value) Expected
value Value of data $1,169,034 Compliance cost $632,499 Reputation damage $1,030,350 Total $2,831,882 Tech costs and productivity loss $821,238 Total value $3,653,120 Estimated cost per device $3,903 Part 5. Your role and organization D1. What organizational level best describes your current position? Pct% Senior Executive 1% Vice President 2% Director 16% Manager 21% Supervisor 16% Technician 36% Staff 5% Contractor 2% Other 1% Total 100% D2. Check the Primary Person you or your IT security leader reports to within the organization. Pct% CEO/Executive Committee 1% Chief Financial Officer 2% General Counsel 0% Chief Information Officer 63% Chief compliance Officer 5% Human Resources VP 0% Chief Security Officer 2% Chief Information Security Officer 18% Chief Privacy Officer 0% Chief Risk Officer 9% Other 0% Total 100%

Ponemon Institute© Research Report 29
D3. What industry best describes your organization’s industry focus? Pct% Agriculture & food services 2% Communications 2% Consumer products 7% Defense 1% Education & research 3% Energy & utilities 3% Entertainment & media 4% Financial services 19% Health & pharmaceutical 13% Hospitality 5% Industrial 8% Public sector 9% Retailing 9% Services 6% Technology & software 5% Transportation 4% Total 100% D4. What is the worldwide headcount of your organization? Pct% Less than 500 11% 501 to 1,000 14% 1,001 to 5,000 21% 5,001 to 10,000 21% 10,001 to 25,000 20% 25,001 to 75,000 7% More than 75,000 6% Total 100%
Ponemon Institute
Advancing Responsible Information Management Ponemon Institute is dedicated to independent research and education that advances responsible information and privacy management practices within business and government. Our mission is to conduct high quality, empirical studies on critical issues affecting the management and security of sensitive information about people and organizations. As a member of the Council of American Survey Research Organizations (CASRO), we uphold strict data confidentiality, privacy and ethical research standards. We do not collect any personally identifiable information from individuals (or company identifiable information in our business research). Furthermore, we have strict quality standards to ensure that subjects are not asked extraneous, irrelevant or improper questions.