the cost of new higher quality assessments: a comprehensive
TRANSCRIPT

The Cost of New Higher Quality Assessments: A Comprehensive Analysis of the Potential
Costs for Future State Assessments
Barry Topol, John Olson, Ed RoeberAssessment Solutions Group
oStanford Center for Opportunity Policy in Education
sc e
Stanford Center for Opportunity Policy in Education

Stanford Center for Opportunity Policy in EducationBarnum Center, 505 Lasuen MallStanford, California 94305Phone: 650.725.8600 [email protected]://edpolicy.stanford.edu
This study was conducted by the Stanford Center for Opportunity Policy in Education (SCOPE) with support from the Ford Foundation and the
Nellie Mae Education Foundation.
© 2010 Stanford Center for Opportunity Policy in Education. All rights reserved.
The Stanford Center for Opportunity Policy in Education (SCOPE) supports cross-disciplinary research, policy analysis, and practice that address issues of educational
opportunity, access, equity, and diversity in the United States and internationally.
Citation: Topol, B., Olson, J., & Roeber, E. (2010). The Cost of New Higher Quality As-sessments: A Comprehensive Analysis of the Potential Costs for Future State Assessments. Stanford, CA: Stanford University, Stanford Center for Opportunity Policy in Education.
Stanford Center for Opportunity Policy in Education
sc e

Table of Contents
Preface and Acknowledgements .................................................................................................. i
Executive Summary ..................................................................................................................... 1
Overview, Purpose, and Background ........................................................................................... 3
Methodology and Key Assumptions ............................................................................................ 10
Results of the Cost Analyses ........................................................................................................ 23
Summary, Conclusions and Discussion, and Recommendations ................................................ 43
References ....... ............................................................................................................................ 49
Appendix A: About the Assessment Solutions Group ................................................................. 50

Stanford Center for Opportunity Policy in Education
Preface and Acknowledgements
This paper is one of eight written through a Stanford University project aimed at summarizing research and lessons learned regarding the development, implementation, consequences, and costs of performance assessments. The project was led by Linda Darling-Hammond, Charles E. Ducommun Professor of Education at Stanford University, with assistance from Frank Adamson and Susan Shultz at Stanford. It was funded by the Ford Foundation and the Nellie Mae Education Foundation and guided by an advisory board of education researchers, practitioners, and policy analysts, ably chaired by Richard Shavelson, one of the nation’s leading experts on performance assessment. The board shaped the specifications for commissioned papers and reviewed these papers upon their completion. Members of the advisory board include:
Eva Baker, Professor, UCLA, and Director of the Center for Research on Evaluation, Standards, and Student Testing
Christopher Cross, Chairman, Cross & Joftus, LLC
Nicholas Donahue, President and CEO, Nellie Mae Education Foundation, and former State Superintendent, New Hampshire
Michael Feuer, Executive Director, Division of Behavioral and Social Sciences and Education in the National Research Council (NRC) of the National Academies
Edward Haertel, Jacks Family Professor of Education, Stanford University
Jack Jennings, President and CEO, Center on Education Policy
Peter McWalters, Strategic Initiative Director, Education Workforce, Council of Chief States School Officers (CCSSO) and former State Superintendent, Rhode Island
Richard Shavelson, Margaret Jacks Professor of Education and Psychology, Stanford University
Lorrie Shepard, Dean, School of Education, University of Colorado at Boulder
Guillermo Solano-Flores, Professor of Education, University of Colorado at Boulder
Brenda Welburn, Executive Director, National Association of State Boards of Education
Gene Wilhoit, Executive Director, Council of Chief States School Officers
i

The Cost of New Higher Quality Assessments
The papers listed below examine experiences with and lessons from large-scale perfor-mance assessment in the United States and abroad, including technical advances, feasi-bility issues, policy implications, uses with English language learners, and costs.
~ Jamal Abedi, Performance Assessments for English Language Learners.
~ Linda Darling-Hammond, with Laura Wentworth, Benchmarking Learning Systems: Student Performance Assessment in International Context.
~ Suzanne Lane, Performance Assessment: The State of the Art.
~ Raymond Pecheone and Stuart Kahl, Developing Performance Assessments: Lessons from the United States.
~ Lawrence Picus, Frank Adamson, Will Montague, and Maggie Owens, A New Conceptual Framework for Analyzing the Costs of Performance Assessment.
~ Brian Stecher, Performance Assessment in an Era of Standards-Based Educational Accountability.
~ Barry Topol, John Olson, and Edward Roeber, The Cost of New Higher Quality Assessments: A Comprehensive Analysis of the Potential Costs for Future State Assessments.
An overview of all these papers has also been written and is available in electronic and print format:
~ Linda Darling-Hammond and Frank Adamson, Beyond Basic skills: The Role of Performance Assessment in Achieving 21st Century Standards of Learning.
All reports can be downloaded from http://edpolicy.stanford.edu.
We are grateful to the funders, the Advisory Board, and these authors for their careful analyses and wisdom. These papers were ably ushered into production by Barbara McKenna. Without their efforts, this project would not have come to come to fruition.
ii

1The Cost of New Higher Quality Assessments
Executive Summary
he Race to the Top (RTTT) funding for common state assessments and the devel-opment of common core standards represent important initiatives in upgrading and improving the educational system in the U.S. Statements by President Barack
Obama and the U.S. Department of Education signal a commitment to including more performance-oriented assessments that engage students in more ambitious intellectual projects in new systems to be created by states and consortia of states. However, with-out any systemic changes in the way assessments are procured, developed, and admin-istered, the cost of new, innovative assessments could exceed the cost of current assess-ments by a significant amount; and, if these costs are not anticipated and controlled, they could spell the end of such innovative approaches to assessment.
The purpose of this study was to: 1) determine the amount of money a typical state would incur to implement a high-quality assessment (HQA) system including perfor-mance components in comparison to the amount currently being spent on their state assessment, and 2) determine if various cost-reduction strategies could be implemented to yield an HQA at a price similar to what a state pays today for its high stakes assess-ment. The data from the study can be used to inform states, policymakers, and other key decision makers how much new HQA systems could cost under various conditions and what the impact of some cost-mitigation strategies might be.
In this study, the Assessment Solutions Group (ASG) used its cost-modeling software to analyze the costs of a traditional, current state assessment and the costs for various innovative state assessments. After estimating costs for a current assessment, the cost model was used to determine the cost of a new HQA for a “typical” single state purchas-ing the assessment for its own use. The model was then used to create different design, development, and delivery strategies in order to reduce the cost of the assessment, such as participation in a state consortium, having teachers score certain items, implementa-tion of an online assessment, distributed scoring, and use of a computerized scoring system. The resulting reduced assessment costs were then compared against the cost of traditional and HQAs.
One of the most important findings from the study is that the development costs of a new HQA are relatively inexpensive relative to the total cost of the assessment. A key factor in the sustainability of new improved assessments and whether or not states can adopt and use them will be the ongoing administration costs that need to be carefully managed. Among the results from the extensive collection of detailed cost analyses done for this study, it was found that total costs could be almost three times higher for the HQA than for the traditional assessment. This is primarily due to the increased costs for scoring of constructed-response (CR) and performance items in the HQA. How-ever, if the performance items are scored by teachers instead of by the vendor, the total costs can be reduced substantially. New uses of technology for delivering assessments
T
2 Stanford Center for Opportunity Policy in Education
and supporting scoring can also reduce costs. And states participating in an assessment consortium can experience a significant reduction in total costs. Combining all cost-re-duction strategies can bring the total cost down to less than what the current traditional assessment costs a typical state. More details of the data are provided in this report.
The authors recommend that developing and implementing an HQA can be affordable for states if they look carefully at the design, find a balance in the number of CR and performance items that are used, and consider various cost-reduction strategies. State consortia interested in implementing a higher-quality assessment need to make sure they can afford the ongoing administration costs of the assessment. It is recommended that all states, as well as state consortia, go about the process of developing and costing a new assessment in a thoughtful manner and use a comprehensive costing model to analyze and determine, in advance, the price of any new assessment system they would like to implement.

3The Cost of New Higher Quality Assessments
Overview, Purpose, and Background
he purpose of this study is to determine, as precisely as possible in advance, the amount of money a typical state would incur to implement a high-quality assess-ment (HQA) system including performance components in comparison to the
amount currently being spent on its state assessment under three new conditions:
1) the economies available from collaborating with other states in a consortium constructing common assessment items and tasks;
2) the economies available from using technology for assessment development, distribution, and scoring; and
3) specific conditions for teacher involvement in moderated scoring.
Additionally, the authors were interested in determining if various cost-reduction strate-gies could be implemented to yield an HQA at a price similar to what a state pays today for its high-stakes assessment. The data from the study will be used to inform states, policymakers, and other key decision makers how much new, higher-quality assessment systems could cost under various conditions, and what the impact of some cost-miti-gation strategies might be. The design of an HQA was developed by staff at the ASG, in particular, Ed Roeber, Michigan State University, based on the work that Linda Darling-Hammond and her colleagues at Stanford University conducted to summarize research on lessons regarding performance assessment over the last several decades.1
As part of the process for designing and developing the new assessments that have been proposed, it was determined that costs for various types of assessment approaches needed to be modeled to provide an accurate estimate on what the overall develop-ment and ongoing administration costs would be to states. This report summarizes the background, assumptions, methodology, and results of the analyses conducted by ASG, the organization contracted to do this work. As noted, ASG developed the designs for a typical current state assessment and a new HQA, and analyzed the costs for these assessments using its cost-model system in order to summarize the costs and compare detailed information for the two. For the purposes of this study, the estimates that are provided are illustrative and not intended to be the only resolutions of the questions regarding how to best implement an HQA system. Different calculations could be ob-tained depending on the specific assessment design and/or vendor solution selected.
BackgroundAmong the many driving forces impacting state assessment, the issues of increased amounts of testing, cost, lack of state funds, and assessment quality are at the forefront.
1. For a summary, see Darling-Hammond & Toch (2010, in press).
T

4 Stanford Center for Opportunity Policy in Education
The Common Core Standards project and the RTTT common-assessments competition (discussed in more detail later in this section), are two new initiatives that are helping focus attention on important steps for improving state assessments. The ongoing work by Stanford University, the Council of Chief State School Officers (CCSSO), the Na-tional Governors Association (NGA), and others to address these issues also are impor-tant steps in this direction. However, given the current financial situation in most states, new assessment designs need to be as cost-effective and efficient as possible, as well as supportive of high-quality learning.
The level of statewide assessment activity occurring in the United States jumped dra-matically during the past two decades. In the early 1990s, fewer than 30 states had some type of statewide assessment activity, and this usually consisted of only one state-wide assessment program component. The adoption of the Improving America’s Schools Act (IASA) in 1994 began the trend to increased statewide assessment activity, since it required that all states create academic content standards in the areas of mathematics and reading/English language arts, as well as assessments at one elementary, one middle school, and one high school grade. The Individuals with Disabilities Education Act of 1997 (IDEA-97) added the requirement that all students with disabilities participate in statewide assessments, while the No Child Left Behind (NCLB) Act of 2001 expanded the number of grades (to grades three through eight plus one high school grade) and content areas assessed (adding science assessment no later than 2007 in at least one elementary, middle school, and high school grade). Both IASA and NCLB also required states to assess the English language proficiency of English language learners (ELLs).
The result is that the amount of statewide assessment in each state has increased dra-matically. In states that pioneered statewide assessment programs, such as Michigan during the 1960s, the state did not add any new assessment components until these federal laws went into effect in the 1990s. It now has six different assessment programs, each covering different grades and/or subgroups of students, for different assessment purposes—a more than 500% increase in the size of the state assessment investment. The amount of change in other states has been comparable, with many adding statewide assessments as a state accountability policy lever for the first time in their states’ history in addition to expanding assessments to meet federal requirements.
Synonymous with the considerable and rapid expansion of statewide assessment efforts is the equally dramatic increases in the costs for the assessment programs. Whereas once states’ assessment costs were a minor part of the state education agencies’ budgets, now the costs are substantially higher (and much more noticeable to policymakers and the public). The required state assessments that once cost just a few million dollars can now run to as much as $100 million per year in a large state. Even though a portion of these costs is paid from federal funds, the state portion of the costs of testing has risen dramatically in recent years.

5The Cost of New Higher Quality Assessments
In the past decade, the total amount of testing-related costs has increased dramatically. ASG estimates that, across the U.S., summative assessment activities now cost in excess of $800 million annually, and are increasing. Other studies estimate that total assess-ment costs (summative, formative, local, etc.) run from $1.0 billion to $1.3 billion. In the conference report accompanying the adoption of NCLB, Congress mandated that the U.S. Government Accounting Office (GAO) conduct a study to estimate the costs to states of complying with NCLB between 2002 and 2008 (GAO, 2003). The GAO chose to cost out three scenarios. The first was an all multiple-choice (MC) item format for all required state tests. The second was a scenario in which states used a combination of MC and short constructed-response (CR) items that were currently in use in 2002. The third scenario listed the costs if states were to use a combination of MC and extended CR items. The actual appropriations from the federal government to states were at slightly above the first level over the six years from 2002 to 2008 (totaling $400+ mil-lion annually). Some states chose MC only programs, although most used a combina-tion of MC- and CR- item formats. Thus, while states did receive some federal support for the added costs of testing, they also had to appropriate additional state dollars to support mandated statewide assessment.
States committed to more extensive performance assessment—such as Connecticut—which included extended writing tasks, science investigations, and other intellectually challenging tasks in its assessments—were unable to afford a large share of the costs of their assessments when NCLB required that every student in certain grade levels be tested annually. Connecticut sued the USED for the costs of maintaining its rich as-sessment program under NCLB, and, in the course of negotiations, was advised by the department to revert to MC testing.2
Other studies also have been done over the years to look at total state assessment costs (Education Sector, 2006; Jackson & Bassett, Eduventures, 2005) and one conclusion is that there is a paucity of recent and accurate cost figures. Although there are a variety of estimates, and overall figures for federal expenditures are readily obtainable, the amount that each state spends on its statewide assessment activities is not systematically col-lected, nor is it analyzed in any appreciable depth.
Also, although states spend a significant amount of money on their statewide assess-ments, many do not have accurate methods to objectively estimate the appropriate costs for their assessment programs. Furthermore, most states do not have access to good information as to what the costs should be for individual components or special features they may wish to include in an assessment, thereby making it extremely dif-ficult to determine the relative cost-benefit of one component/feature versus another when constructing an assessment. Given the size and scope of the contracts, states need good information on costs that will help them create assessment designs that are as efficient as possible. This need becomes even more acute as states try to redesign their
2. Blumenthal, Richard. Why Connecticut Sued the Federal Government over No Child Left Behind. Harvard Educational Review. Vol. 76, No. 4. Winter 2006

6 Stanford Center for Opportunity Policy in Education
assessment programs to reflect higher-quality designs that both improve instruction and student learning.
Many testing experts are encouraging states to assess their students at higher and deeper levels so that problem solving and higher-order thinking skills can be better measured and reported. Therefore, it is important to look closely at the current designs being used in states and compare those to new designs that incorporate other approach-es that can have more validity for improving instruction and assessing student learning, such as more use of Short CR and Extended CR items and use of innovative perfor-mance measures.
Common Core Standards and RTTT Common Assessment InitiativesThe development of the common core standards and RTTT funding for assessment and other educational reforms represent two important initiatives in upgrading the educa-tional system in the United States. The common core standards is a joint project spear-headed by CCSSO and NGA to develop a common set of content standards for the states to benchmark the academic standards of the best and most rigorous educational sys-tems in the world. These standards will be used to focus the curriculum on the rigorous skills students will need to succeed in the 21st century and help states in terms of im-proving student education and assessment. The common state assessment(s), aligned to the common core standards, should make assessment an integral part of curriculum and instruction to actually improve student learning. Through an RTTT competition, funds from the USED will be used for new innovations in education, including assessment, and various consortia of states will be able to use these funds to develop a next genera-tion of higher-quality assessments in reading/language arts and mathematics that can be used as part of their state assessment program in the future. The USED is interested in supporting one or more consortia of states that work toward jointly developing and im-plementing common HQAs aligned with a consortium’s common set of K-12 standards that are internationally benchmarked and that build toward college and career readiness by the time of high school completion. New, innovative assessment designs are being considered that will both help students learn and teachers develop effective teaching and intervention strategies. These new assessments will likely include new item types such as PTs and PEs, as well as the use of more CR items than current assessments.
However, without any systemic changes in the way assessments are procured, devel-oped, and administered, the cost of these new assessments could exceed the cost of current assessments by a significant amount. If these costs are not anticipated and con-trolled, they could spell the end of such innovative approaches to assessment. As more details of this new initiative are being unveiled, few analysts have evaluated how much it will actually cost to develop, administer, and maintain these new, innovative assess-ments under different assessment conditions. Therefore, as noted earlier, this study pro-vides information that can help determine the amount of money a typical state would incur to implement an HQA system in comparison to the amount currently being spent on their state assessment system.

7The Cost of New Higher Quality Assessments
Additional Issues Affecting Current State AssessmentsSome of the other issues concerning the design of current state assessments are that they are largely summative in their approach; the assessments are not always instructionally sensitive, balanced, or innovative; and the assessments do not provide teachers with instructional strategies or other useful information that can positively impact students within the school year.
One of the purposes of these set of papers is to suggest better approaches to large-scale assessments that are cost-effective and make the assessments a valuable part of the cur-riculum. The recent and ongoing work by many researchers and policy makers to design and advocate for more innovative HQAs is an opportunity to improve some of the cur-rent approaches that are being used. Also, the information gleaned by a detailed analysis of the costs for these types of assessments can help in the deliberations on the RTTT competition guidelines, as well as the states themselves.
A key premise behind this report is that the total cost of improved state assessments could be significantly more than current assessments if changes are not made in the way assessments are procured and delivered. Furthermore, assessment cost has been a “black box,” especially since the advent of NCLB, and most states are not aware or informed of costs of many different features and functionalities. Thus, states are not able to make educated trade-offs or other decisions concerning changes to their assessment. In addi-tion, it is likely that states are not as efficient as they could be in their current assessment systems.
The ASG Cost ModelThe ASG Assessment Cost Model is a variable input, metric-based output model. Specific assessment program variables are input to the model and applied against cost factors, metrics, and/or databases, built on real programmatic data, to derive assessment cost. Several hundred variables associated with the functions and activities required to develop and administer an assessment (e.g., item & test development, production and manufac-turing, logistics, editing and scoring, reporting, psychometrics, program management, quality assurance, information technology, etc.) are contained in the model which allows ASG to build up the cost of any assessment from the ground up as opposed to making generalized estimates of the cost of an assessment based on broad industry parameters.
The ASG cost model has the ability to conduct a detailed study of the costs for all types of assessment components to not only determine the cost of the assessment, but to also identify ways to improve the cost effectiveness and efficiency of a state assessment. The model generates detailed cost information, based on actual cost parameters from existing testing programs (secured through the authors’ direct experience, interviews with indus-try participants, and published cost figures), that can be used to evaluate assessment and assessment component cost. Cost reports by function, area, cost type, etc., are generated and key metrics are presented to better understand assessment cost, as well as allow for a comparison to model “efficient cost” data.

8 Stanford Center for Opportunity Policy in Education
Without an assessment-cost model, it is possible that a state, or consortia of states, will spend a significant amount of money on a new assessment, but not have accurate meth-ods to objectively estimate the appropriate costs for the assessment program. Further-more, in designing a new assessment, it is important to have access to good information as to what the costs should be for individual components or special features that may be included in the assessment, thereby making it possible to determine the relative cost-benefit of one component/feature versus another when constructing the assessment. States also may have difficulties preparing requests for proposals (RFPs) and compar-ing vendor cost proposals, and are never quite sure whether assessment contractors are proposing “apples-to-apples” programs.
In a nutshell, states cannot always tell whether prices quoted for an assessment are too high, too low, or about right. The data from a rigorous cost analysis can help a state or consortia of states estimate the individual and total costs of a future assessment. It is hoped that states, as well as the USED, will then be able to budget more efficiently and effectively for assessment because they will have a better understanding of component costs and different options. The Commonwealth of Kentucky commissioned such a study in 2009 when determining the proper amount to budget for its new assessment system.
In this study, ASG used its proprietary, assessment cost-modeling software to determine the costs of a “typical” current state assessment and the costs for various new innovative assessments. After estimating costs for a current assessment, the cost model was used to determine the cost of a new HQA for a “typical” single state purchasing the assessment for its own use. The model was then used to create different design, development, and delivery strategies in order to reduce the cost of the assessment. The resulting reduced assessment costs were then compared against the cost of the current assessment.
Benefits of ASG Methodology for Helping States Analyze Assessment Costs
As various designs are proposed for new assessments in the future, states, or consortia of states, need methods that allow them to understand what they will be paying for—from the total bottom-line price down to each assessment component. This will allow states to make decisions about how to tailor the design of the assessments to most effec-tively and most efficiently assess students (i.e., meeting all federal and state assessment requirements) while still providing the achievement information needed at the state and local district levels. If they are able to better understand their assessment costs, states will be able to better design and implement programs that not only meet federal and state requirements but, more importantly, will be affordable. This may permit states to spend less on testing and more on helping local districts improve instruction and better use the assessment results to improve student learning, and thus achievement—a pri-mary goal of large-scale assessment.

9The Cost of New Higher Quality Assessments
The results from this study help provide data for an apples-to-apples comparison of current “typical state assessments” and new HQA costs that are created with the same model using similar assumptions. The information reported from the cost model yields independent, objective, and accurate estimates of incremental costs for states and provides fair comparisons of various approaches to developing and delivering the new assessment. In addition, the information can help states that may want to upgrade their assessment system and/or cost out various cost-reduction strategies. In the following sections of this report, details are provided on the assumptions used in the model, the methodology used to analyze the data, and the results from the series of cost analyses that were conducted.

10 Stanford Center for Opportunity Policy in Education
Methodology and Key Assumptions
n this section, the methods used to analyze costs in this study are described. Infor-mation on the assumptions for the various models of state assessment programs that were evaluated are listed below, and details are provided on the definitions and
scenarios used to run the cost models and compare the data.
ASG used a straightforward approach to determine the cost of a typical state assessment, for developing and implementing a new HQA system, and to calculate the resulting in-cremental cost to adopt the new system. The following assessment models were created and analyses conducted:
1. Define and price a representative current assessment program for a moderately large state. The goal of this analysis was to calculate the assessment costs associated with a typical current assessment program for reading/language arts and mathematics. This included the costs for the state assessment program run by the state, as well as an interim benchmark assessment program procured by the state for local district use. 3
2. Design and price a high-quality, future assessment program for the same moderately large state. In the same typical state as used in number 1 above, several scenarios were created around the more innovative approaches to assessment that could be used in the future state assessment program. The costs for representative scenarios were determined.
3. Develop cost-reduction strategies based on consortia of various numbers of states implementing the HQA design. In these cases, one or more of the scenarios developed in number 2 above were used to develop costs for a consortium of 10, 20, and 30 states working together. Such cost estimates illustrate the cost savings for groups of states working together to create the assessments that are needed. Several analyses based on the state consortia model (see Model 3, page 18) were created to examine further cost-efficiency scenarios and are notated as follows:
3. A typical state and typical assessment system were defined and noted as the current assess-ment system. The current system served as the baseline model for the calculation of both the development and ongoing administration costs. Cost calculations and comparisons (total and incremental) to other scenarios were made relative to this baseline model. Pricing for the cur-rent assessment system was developed using the ASG cost model to calculate the summative component and pricing of existing interim assessment products and ASG assumptions to calcu-late the interim assessment component.
I

11The Cost of New Higher Quality Assessments
A. Participating in a state assessment consortium to share development and overhead costs. State consortia sizes of 10, 20, and 30 states were analyzed.
B. Moving to online delivery of the assessment. Online assessment (OLA) delivery eliminates much of the cost of pencil-and-paper systems and many states have stated that they want to use an OLA in the future (if they have not already implemented one).
C. Using teachers to score PEs and PT items. Two different models were examined, one (C1) assuming a professional development (PD) model with no additional teacher compensation beyond that supported by the state or district for normal PD days and the other (C2) assuming an $125/day stipend to teachers.
D. Using distributed scoring for CR items. A scenario was run assuming a 50/50 mix of site-based and distributed scoring for the CR items. Distributed scoring was also assumed, in all cases, for the scoring of performance event (PE) and performance task (PT) items.
E. Adopting automated scoring for some CR items. Automated systems are being developed and placed in service using computers to score essay type responses via the use of artificial intelligence (AI) engines. ASG examined one scenario, at a low per-response price point, to determine the impact on assessment cost.
F. Developing a customized interim benchmark assessment system. The cost of developing an interim benchmark system with similar item types and structure as the high-quality system was modeled as case F (1). Case F (2) uses state consortia to develop and make available different options for the administration of an interim assessment system.
Each of these models of assessment programs is explained more fully below. The results of the analyses and costs associated with each model are shown in the next section of this report. For the purposes of this study, the estimates that are provided are illustra-tive and not intended to be the only resolutions of the questions regarding how to best implement an HQA system. Different calculations could be obtained depending on the specific assessment design and/or vendor solution selected.
Model 1: Comprehensive Assessment Program for a Moderately Large State
The typical state assessment program now in use in the United States has a number of characteristics in common. These commonalities are driven by federal requirements for such programs. The No Child Left Behind (NCLB) Act requires that states assess Eng-lish language arts/reading and mathematics at grades three through eight, plus one high school grade, and to assess science at one elementary, one middle school, and one high-

12 Stanford Center for Opportunity Policy in Education
school grade, respectively. There are assessment requirements for ELLs (namely, annual assessment with an English proficiency test) and for students with disabilities (provi-sion of assessment accommodations and an alternate assessment for such students un-able to participate in the regular assessment program).
For purposes of this cost study, a moderately large state was selected to determine what a state could be paying for its assessment services—test development and test administration.
The typical summative assessment was defined as one administered at the end of the school year with 50 multiple-choice (MC) questions and 2 extended CR items in math-ematics and reading, and 10 MC questions and 1 extended CR item in writing. Writing was included because a substantial number of states have writing as part of their ELA assessment. Science was not included because the common core standards being created for use by the states include only English language arts and mathematics. Summative assessment assumptions are shown in Exhibit 1A.
Exhibit 1A. Summative Assessment AssumptionsSummative Assessment
AssumptionDescription
Test Years Year 0 (full field test) + 3 operational years
Grades/Students Assessed Grades 3-8 and 10; 125,000 students per grade
Domains Assessed Mathematics and English Language Arts (Reading & Writing)
Delivery Method Pencil and paper for summative assessment
Number of Unique Test Forms 2 plus a breach form (breach form developed in Year 1 but not printed)
Color 2-color (no items presented in color)
Item Release Rate 25% each year
Field Test Methodology Full field test in Year 0; embedded years 1-3
Travel and Meetings Standard setting, bias review, sensitivity review (standard meetings)
Shipping Method Ground transportation
Scanning Description Scannable answer documents in grades 4-8, 10; scannable books in Grade 3
Scoring of CR Items Vendor scored, 20% read behind rate, 90% exact and adjacent agree-ment required
Reporting End-of-year reports (state, district, school, demographic, etc.) electroni-cally delivered with the exception of the parent report, which is printed and mailed
Vendor Gross Margin 35%*
* Vendor gross margin higher than current industry average. All other things being equal, it is expected that prices will rise in the next few years.

13The Cost of New Higher Quality Assessments
Interim Benchmark Assessment. Interim assessments have become more common among local school systems that are concerned about whether all students will meet the accountability requirements of NCLB. The goal is to use assessments periodically to determine student progress towards mastering the knowledge and skills expected of students when they are assessed on the annual, state-assessment program instruments. There are several ways in which these interim assessments may be implemented and used.
Off-the-Shelf versus Custom-Developed. One of the first choices for districts and states that wish to use interim benchmark assessments is whether to select one of the commercial products on the market or to develop their own instruments. The advantage of using an available set of assessments is that they are readily available and ready to use; they can be implemented easily in the school district. On the other hand, such off-the-shelf products may not measure the skills the district (or the state) considers to be most important, and this mismatch might not permit educators to receive good information on such outcomes.
An alternative that some districts and states are using is to create their own interim benchmark assessments. The advantage of this approach is that the assessments can better measure the skills considered to be important by the district (or the state) and in addition, can use a broader range of assessment types (CR items, PEs, or PTs) not com-monly found in off-the-shelf interim assessment products.
Paper-Based versus Online Testing. Another choice that districts and states face is whether the interim benchmark assessment program is delivered online or via paper-based assessments. The advantage of online assessments is the ease of test administration and the speed of return of results. The major challenge is whether the school has the necessary computer infrastructure to permit assessing large numbers of students in a brief period of time.
Paper-based assessments are useful when a broader array of assessments—those for which online administration would be challenging—are used. In addition, they are helpful when the number of students to be assessed is small or if custom-developed in-terim benchmark assessments were developed and the cost of entering these into online assessment systems is viewed as too high.
State Education Agency Role in Interim Benchmark Assessment. There are several ways in which state education agencies might assist local districts that wish to use interim benchmark assessments. At one extreme are states that purchase a single, interim benchmark assessment system (or that custom-develop one) for all districts in the state. Another potential role would be to provide for the use of such a system locally, but not mandate a single system for the entire state. This may or may not come with the necessary resources for operating such a system. Third, states may provide assessment materials previously used in the state assessment program for local district

14 Stanford Center for Opportunity Policy in Education
use in “stocking” their own interim benchmark assessments. Finally, states might simply acknowledge that districts are using such a system and permit them to use federal, state, or local funds to pay the necessary costs of developing and using such a system.
Given the above, there are currently a wide variety of options and associated pric-ing for interim assessments. If we were to select one “typical” option for pricing purposes, it would be an online test with 40 MC and no CR items delivered three times a year at an all-in-all price of around $8 a student.4
Options for States Working Together. When states form consortia to develop and implement large-scale, summative assessments at the state level, they may also wish to consider how they could work together to provide interim benchmark assessments to their local school districts. There are at least four different options for this to occur:
1. The full consortium buys/leases a complete system (items and online delivery system) from a vendor and this system is provid-ed to local districts to use as they see fit.
2. The consortium purchases/leases an online assessment system from a vendor, but the consortium loads its own assessment (which it has developed) into the system and provides the system for local district use.
3. The consortium develops its own interim benchmark assess-ments and administers these and the state assessments using the same online system that they have either created or leased.
4. The consortium develops its own assessments and provides these to the local school districts to use as they see fit—to load into any online system that they have and/or to use as paper-based assessments.
In order to assist states working in a consortium to understand the costs of these options, cost estimates were prepared to show what each would cost per student and per state.
4. Current and projected interim assessment pricing based on catalog pricing and inter-views with Pearson, CTB/McGraw Hill, and NWEA
15The Cost of New Higher Quality Assessments
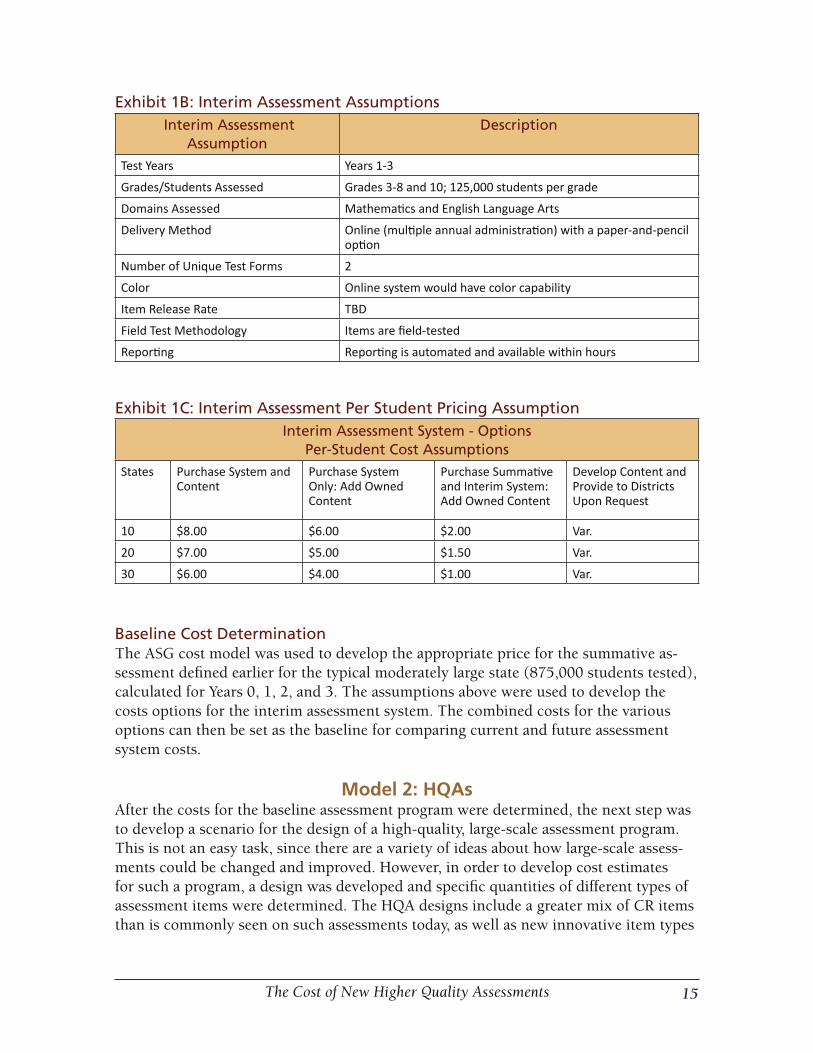
Exhibit 1B: Interim Assessment Assumptions Interim Assessment
AssumptionDescription
Test Years Years 1-3
Grades/Students Assessed Grades 3-8 and 10; 125,000 students per grade
Domains Assessed Mathematics and English Language Arts
Delivery Method Online (multiple annual administration) with a paper-and-pencil option
Number of Unique Test Forms 2
Color Online system would have color capability
Item Release Rate TBD
Field Test Methodology Items are field-tested
Reporting Reporting is automated and available within hours
Exhibit 1C: Interim Assessment Per Student Pricing AssumptionInterim Assessment System - Options
Per-Student Cost AssumptionsStates Purchase System and
ContentPurchase System Only: Add Owned Content
Purchase Summative and Interim System: Add Owned Content
Develop Content and Provide to Districts Upon Request
10 $8.00 $6.00 $2.00 Var.
20 $7.00 $5.00 $1.50 Var.
30 $6.00 $4.00 $1.00 Var.
Baseline Cost Determination The ASG cost model was used to develop the appropriate price for the summative as-sessment defined earlier for the typical moderately large state (875,000 students tested), calculated for Years 0, 1, 2, and 3. The assumptions above were used to develop the costs options for the interim assessment system. The combined costs for the various options can then be set as the baseline for comparing current and future assessment system costs.
Model 2: HQAsAfter the costs for the baseline assessment program were determined, the next step was to develop a scenario for the design of a high-quality, large-scale assessment program. This is not an easy task, since there are a variety of ideas about how large-scale assess-ments could be changed and improved. However, in order to develop cost estimates for such a program, a design was developed and specific quantities of different types of assessment items were determined. The HQA designs include a greater mix of CR items than is commonly seen on such assessments today, as well as new innovative item types

16 Stanford Center for Opportunity Policy in Education
defined as PEs and PTs. Many testing experts view these types of items as doing a much better job of testing a student’s problem solving and higher order critical thinking skills than current multiple-choice (MC) items. Table A shows a description of the types of items assumed to be used in such a program. A summary of the new assessment designs is shown in Exhibit 2 (see page 17).
Table A: HQA Item Types and Examples
Multiple Choice (MC): This is an on-demand item in which students select the correct answer from among four choices given to them.
Example: Who wrote the play Romeo and Juliet?A. William ShakespeareB. Thornton WilderC. William BlakeD. Thomas Smythe
Short Constructed-Response (SCR): This is an on-demand written exercise in which the student pro-duces a response that ranges from a word or a few numbers to a few sentences or a few numbers.
Example: Describe in one paragraph the basic plot of Romeo and Juliet.
Extended Constructed-Response (ECR): This is an on-demand written exercise in which the student produces a response that ranges from one paragraph to a couple of pages in response to a prompt. The essay is typically scored on a 0-4 or 0-6 basis for one or more dimensions.
Example: Write an essay describing one or more central conflicts inherent in the play “Ro-meo and Juliet.” Then describe how such a conflict (or conflicts) could occur in modern-day America. Describe at least two ways in which this play could describe modern America.
Performance Event (PE): This is an on-demand activity that students complete in a class period in school. It may involve a written activity, but often may involve students actually doing something, be-ing observed and rated by the teacher. The PE will be scored on one or more dimensions, each typi-cally on a 0-4 or 0-6 scale.
Example: Sketch the set for a production of Shakespeare’s “Romeo and Juliet” to illustrate how plays were staged in England in Shakespeare’s time. Describe the key elements of the set and why you have portrayed them in this way. You have 45 minutes to complete this ex-ercise.
Performance Task (PT): This is an activity that students will work on in class and outside of class for periods ranging from a couple of days to several weeks. Typically, because these are such complex tasks, they may result in a paper, a completed project, and/or presentation. The PT may involve mul-tiple parts that could be scored holistically or separately. The PT will be scored on one or more dimen-sions, each typically on a 0–4 or 0–6 scale.
Example: Develop a paper, drawings, and a presentation to compare how a play written at the time of Shakespeare might be staged and how the same play might be produced and staged today. Consider changes in how plays were written, the venues where they were staged, the manner in which the audience would “interact” with the players, and the net effect on those who attended the production. Your paper should be at least three pages in length and include, at a minimum, two drawings.

17The Cost of New Higher Quality Assessments
Exhibit 2—Summative and Interim Assessment Test Designs
Summative Assessment DesignSummative Assessment
Item Counts
Mathematics Multiple Choice
Short Constructed Response
Extended Constructed Response
Performance Event
Performance Task
Current Typical Assessment
50 0 2 0 0
High-QualityAssessment
25 2 (1 in Grade 3)
2 (0 in Grade 3, 1 in Grade 4)
2 2 (0 in Grade. 3, 1 in. 4)
Summative Assessment
Item Counts
English Language Arts Multiple Choice
Short Constructed Response
Extended Constructed Response
Performance Event
Performance Task
Current Typical Assessment (Reading)
50 0 2 0 0
Current Typical Assessment (Writing)*
10 0 1 0 0
High-QualityAssessment (Reading)
25 2(1 in Grades 3 & 4)
2 (1 in Grades 3 & 4)
2 1
High-QualityAssessment (Writing)*
10 2 (1 in Grades 3 & 4)
2 (1 in Grades 3 & 4)
2 0
*Administered in Grades 4, 7, and 10
Interim Assessment DesignInterim Assessment Item CountsMathematics Multiple
ChoiceShort Con-structed Re-sponse
Extended Constructed Response
Performance Event
Performance Task
Current Typical Assessment**
40 0 0 0 0
High-QualityAssessment**
25 2 1 (0 in Grade 3)
1 1 (0 in Grade 3)
Interim Assessment Item CountsEnglish Language Arts Multiple
ChoiceShort Constructed Response
Extended Constructed Response
Performance Event
Performance Task
Current Typical Assessment**
40 0 0 0 0
High-QualityAssessment**
25 2 1 1 1
**Administered three times a year

18 Stanford Center for Opportunity Policy in Education
The full “procurement cost” of implementing the new assessment system was calculated which consists of the initial development of the items and forms (a Year-0 incremental expense), as well as the ongoing annual cost of administering the assessment program. Calculations for the cost-per-functional area (development, production, IT, program management, quality assurance, warehousing/logistics, scoring, etc.); cost per student; cost per grade; cost per domain; and key metrics for each functional area and assess-ment as a whole were also generated. The model was used to calculate Year 0, Year 1, Year 2, and Year 3 assessment costs so the same data set was available to compare the future HQA cost data to the baseline current assessment data.
Based on the results of previous studies, our estimates assume that the average time it takes an experienced person to score a PE and PT is three and six minutes, respectively.
5 It is likely that these times could vary depending on the nature of the items actually used in an HQA and, therefore, we also conducted a “sensitivity analysis” using longer scoring times of up to six additional minutes, in one-minute increments, respectively, for the two types of tasks. The estimates are based on average times reported by scorers working under the direction of an assessment organization. These average times include both students who write elaborate responses to the PEs and tasks, and those students who provide little or no response. The latter can sometimes constitute upwards of one-third of the “responses” to these items. The scoring time for each type of item is depen-dent on the number of parts that are written into each PE or task, as well as how elabo-rate the student responses are, and how many students respond. The estimates selected should serve as a starting point in the discussion of the development of new HQAs, with these variables in mind.
Model 3: Cost-Reduction Strategies/CasesOnce the current and HQA system costs were calculated for a given typical moderately large state, strategies were developed to reduce the cost of the new assessment system. The following models were examined and assessment system costs calculated. (Note: Each model and case was calculated independently of the other cases. A final calcula-tion was made to determine the impact on assessment cost if all of the cost-reduction strategies modeled were implemented.)
A. Participation in a consortium of states to develop and administer a new HQA. Participation in state consortia of 10, 20, and 30 states was examined. Participating in a consortium of states allows the members to spread the fixed costs of development and vendor overhead func-tions (IT, QA, etc.) over the entire group. Additionally, a consortium of states should be able to negotiate better pricing from both online and test development vendors. ASG assumed a lower vendor gross margin in the consortia cases.
5. For sources of these estimates, see Baron (1984), Breland, Camp, Jones, Morris & Rock (1987); Hymes (1991); U.S. Congress Office of Technology Assessment (1992); Stevenson (1990); and Hill & Reidy (1993).

19The Cost of New Higher Quality Assessments
B. Use of technology in delivering the assessment. The use of online testing was examined and the impact on assessment cost calculated. Online test development and administration systems can be signifi-cantly less expensive than using paper and pencil to administer the as-sessment. While costs to a state for the purchase of additional PCs was not modeled in our calculations, it would not be difficult for a state to calculate the cost-benefit analysis of moving to online testing using the data in this study. Additionally, several strategies exist that a state can use to mitigate the impact of high student-to-PC ratios on the required testing window.
C. Use of teachers to score PEs and PTs. Different scenarios were run assuming that teachers would score the PEs and PTs. In one scenario (C1), teacher scoring of PEs and PTs was treated as part of teacher PD and, therefore, the cost of scoring these items was not included in the calculation of total future assessment system costs. In another scenario (C2), it was assumed that teachers would be paid a $125-a-day stipend to score the items. The decision as to whether teachers would score their own students’ responses or the responses from other students in the group of states is assumed to be made by the state consortium.
D. Use of distributed scoring to mark the CR items. Distributed scoring allows the person scoring the item to work from his or her home or office while accessing a centralized scoring and monitoring platform. Distributed scoring of CR items is cheaper than centralized on-site scoring because it avoids the fixed facilities, computer, and scoring center management costs. ASG used a 50/50 mix of site-based and dis-tributed scoring because both methods of scoring CR items are typi-cally implemented in order to get the total number of readers required and, to a lesser extent, for the vendor to get a feel for the issues that arise in scoring particular responses. Note that for comparability pur-poses, ASG assumed distributed scoring for PEs and PTs in all cases.
E. Use of AI technology in scoring CR items. The labor required to score CR items is a major assessment cost. A variety of systems have been or are being developed and placed in service to automatically score student essay and other CR items using AI engines. Based on ASG’s research6, today these systems cost between $.50 and $3 per response with the bulk of the pricing by vendors at the higher end of the range. It is assumed that as time passes and systems continue to mature, pricing should become more affordable. A scenario was run, for the 30-state consortium, at $.50 per item to score a student response and
6. Pricing estimates are based on interviews with Vantage Learning, Internet Testing Services, Measurement Inc., and AIR, as well as ASG’s research on other systems.

20 Stanford Center for Opportunity Policy in Education
$6,000 per item system training fee, to determine the impact of com-puter-based scoring on the cost of scoring the CR items.
F. Development of a customized, interim benchmark assessment sys-tem. In the case of a possible future interim assessment system [Case F (1)], it was assumed that the state or state consortia would incur the initial development cost of creating the new interim assessments that would line up with the high-quality summative assessment but would use an existing system to deliver the interim assessments at the same price as is available today. It was also assumed that teachers would score the CR questions as a normal part of the curriculum.
In Case F (2), different options for implementing and administering an interim assessment system were examined. It is quite possible that a state could pay less than commercial prices today for an interim system, particularly if the system is procured by a consortium of states or the same system is used to deliver both the summative and interim assessments. ASG made assumptions on future system prices based on discussions with current interim assessment system providers7.
Finally, it should be noted that having a comprehensive, balanced as-sessment system with classroom-based assessment components occur-ring during the year takes on some of the information purposes that are otherwise carried by interim assessments and thus has the poten-tial to provide some economy in the system.
Exhibit 4 (page 21) provides an overview of the various model cases, number of states testing, and online testing methods, as well as online pricing and vendor profit margin assumptions.
The data generated in the various cases are important in understanding the costs of con-verting to a new assessment system and how to mitigate the additional costs of imple-menting an HQA system. The uses of online technology, teacher scoring of performance items, and participation in a consortium of states to procure and administer assessments are important elements in maintaining affordable assessment systems in the future.
Advantages of Using this MethodologyThe methodology outlined above and used in this study for calculating the baseline costs of a typical current assessment and the incremental costs of moving to a new, higher-quality assessment system has several advantages. First, using the same model to calculate both the current and HQA system costs provides an “apples-to-apples” com-parison of the incremental cost of moving to a new assessment system. While the base-line assessment may not be structured in exactly the same way as that used in a particu-
7. Discussions were held with Pearson, NWEA, and CTB/McGraw Hill

21B
ench
mar
king
Lea
rnin
g Sy
stem
s
Exh
ibit
4 -
Mo
del
Cas
esN
ote:
Hig
h-qu
ality
ass
essm
ent (
HQ
A) c
ases
are
inde
pend
ent o
f eac
h ot
her.
Pric
ing
an
d
Pro
fit
Var
iab
les
1.
Cu
r-re
nt
Stat
e
2.
New
H
QA
3A.
HQ
A w
ith
Sta
te-
Co
nso
rtia
Cas
es
3B.
HQ
A w
ith
On
line
Ass
essm
ent
Cas
es
3C.
Teac
her
Sco
rin
g o
f PE
s an
d P
Ts w
/ an
d
w/o
ut
stip
end
***
3D.
HQ
A w
ith
D
istr
ibu
ted
Sco
rin
g
of
CR
Item
s
3E. H
QA
w
/ O
nlin
e Sc
ori
ng
o
f C
R
Item
s+
3F.
Dev
elo
p
New
In-
teri
m A
s-se
ssm
ent
3F(2
).
Dev
elo
p
New
Inte
rim
A
sses
smen
t A
dm
in.
Op
tio
ns
Num
ber
of S
tate
s1
110
2030
110
2030
1020
3010
2030
30
an
y10
-20-
30
Vend
or
Gro
ss
Profi
t %*
35%
35%
30%
28%
25%
35%
30%
28%
25%
30%
28%
25%
30%
28%
25%
25%
n/
an/
a
Onl
ine
Per-
Stud
ent
Pric
e**
--
--
-$4
.00
$3.5
0 $2
.50
$1.5
0 $3
.50
$2.5
0 $1
.50
$3.5
0 $2
.50
$1.5
0 $
0.50
n/a
var
One
-tim
e O
nlin
e Fi
xed
Cost
($
000)
--
--
-$2
50$3
00$3
25$3
50$3
00$3
25$3
50$3
00$3
25$3
50 $
1,90
0
n/a
$0
* F
or d
evel
opm
ent
and
adm
inis
trat
ive
fun
ctio
ns
in c
ases
wit
h o
nli
ne
com
pon
ents
** P
rim
e co
ntr
acto
r ov
erh
ead
of 3
%-4
% is
add
ed o
n t
op o
f th
is n
um
ber
***
Ven
dor
syst
em c
har
ge o
n t
each
er s
cori
ng
case
s is
rou
ghly
25%
of
tota
l tea
cher
sti
pen
d (w
het
her
pai
d or
not
)+
15%
hu
man
rea
d be
hin
d ra
te a
ssu
med
. $.5
0 is
th
e pe
r-sc
ore
pric
e.C
onst
ruct
ed-R
espo
nse
(C
R)
item
s do
not
incl
ude
per
form
ance
eve
nts
(P
Es)
an
d pe
rfor
man
ce t
asks
(P
Ts).
PE
s an
d P
Ts a
lrea
dy a
ssu
med
to
be s
core
d u
sin
g di
stri
bute
d sc
orin
g.N
ote:
Cas
es 3
B, 3
C, a
nd
3D a
ssu
me
onli
ne
syst
em u
sed
to d
eliv
er t
he
asse
ssm
ent
and
scor
e al
l mu
ltip
le-c
hoi
ce (
MC
) it
ems;
hen
ce, p
rici
ng
for
the
onli
ne
syst
em c
ompo
nen
t do
es n
ot c
han
ge.

22 Stanford Center for Opportunity Policy in Education
lar state, it provides a good approximation of a typical state’s assessment costs. Since the same model and assumptions are used to make the calculations for both the current and future assessment systems, the incremental cost of moving to a new assessment sys-tem has a high degree of validity. Next, the methodology avoids the problem of using a particular state’s assessment cost as a baseline as any given state’s assessment costs may not be representative of typical costs due to the particulars of that state’s assessment program and/or the operational methodology in which the assessment is delivered. The methodology also eliminates differences in vendor pricing and operational assessment delivery practices as potential sources of bias and error. Finally, the methodology pro-vides for further apples-to-apples cost comparisons when new, lower-cost approaches to developing and administering assessments are developed and analyzed.

23The Cost of New Higher Quality Assessments
Results of the Cost Analyses
s described in the previous section, several different assessment designs were analyzed in the ASG cost model. For each of those models, the ASG cost-estima-tion system was used to derive representative costs. This will permit assessment
designers to determine how much HQA systems might cost an individual state (work-ing alone) and how these costs might be reduced through consortia of states working together, as well as by using a variety of cost-savings strategies.
Summaries of the costs for each of these options are provided below.
1. Representative, comprehensive assessment program for a moderately large state The costs for the current assessment program for a “typical” state were estimated for four fiscal years—a base year (labeled Year 0) which is necessary to prepare and field test the needed assessment materials for use—and three additional years of operational testing, labeled Years 1, 2, and 3. For each year, the anticipated costs of operating the typical assessment program in a single state were calculated. Costs were calculated for the following: total cost, cost per student, cost by function, and cost by content area and grade. Each of these is described for this assessment model. The presumption was made that only a limited number of CR items and no performance assessments (events or tasks) are used in this program, since many states have had to cut back or eliminate CR items due to budget cuts.
Table 1 summarizes the total yearly cost for this traditional, comprehensive assessment program. These (and other) costs are based on the specifications shown in the previous section.
Table 1. Total Single-State Assessment Cost by Year
Year Year 0 Year 1 Year 2 Year 3 Total Cost
Single-State Cost
$3,936,258 $16,633,386 $15,566,449 $16,189,107 $52,325,199
Year 0 shown in Table 1 includes development costs for the assessment program. Note that the costs for Year 1, which are higher than those for Years 2 and 3, include develop-ment, but not printing, of a breach form in addition to the operational forms. As can be seen, the cost of operating even a conventional, comprehensive assessment program—one with limited use of CR items and no performance assessment—is substantial. However, since 2002, states have received support from federal funding associated with NCLB in order to afford these costs, with state funds being used to pay for the remain-ing costs.
Another way to examine these costs is on a per-pupil basis. The per-pupil cost is also considerable, as is shown in Table 2 (page 24). However, this cost is substantially less
A

24 Stanford Center for Opportunity Policy in Education
than that of a new textbook, a typical student’s school supplies for the year, or almost any educational intervention.
Table 2. Per-Pupil, Single-State Cost of Assessment, Per Year
Year Year 0 Year 1 Year 2 Year 3 Average Cost
Single-State Cost
$4.50 $19.01 $17.79 $18.50 $19.93
Note that average cost includes Year 0 expenditures and averages all costs over three years.
Table 2 indicates that there are development costs required for a traditional high-stakes assessment program even before it is administered. This is typically the case. The program is not too costly per pupil because only a limited number of expensive types of items (CR) and no performance assessments are used.
By examining the costs for this assessment model by function, it is possible to see which aspects of the assessment program are most and least costly. The former might provide areas to examine for cost savings. Figure 1 shows the costs for each portion of the assess-ment program.
Figure 1. Cost by Function for Traditional Assessment
Program ManagementReportingCR Scoring
Receiving & Scanning
QA, Psychometrics, Tech Support
Printing & DistributionContent Development
Total Cost by Function = $52,325,199

25The Cost of New Higher Quality Assessments
As can be seen, the most expensive portions of this assessment program are content de-velopment and CR scoring. Other expensive portions of this program include printing, distribution, and scanning.
A final way of looking at cost is by content area and grade, as is indicated in Table 3. This type of costing shows the different costs associated with the English language arts (reading and writing) assessments, as well as the mathematics assessments, at each grade level. Grade-level costs will vary because, for example at third grade, a scannable test booklet is used, while an answer folder (scannable answer sheet) is used at the other grades.
Table 3. Single-State Cost by Content Area and Grade
Grade Mathematics Reading Writing Total
3 $1.37 $1.43 - $2.80
4 $1.10 $1.19 $1.10 $3.40
5 $1.16 $1.23 - $2.39
6 $1.12 $1.24 - $2.36
7 $1.10 $1.14 $1.11 $3.36
8 $1.07 $1.21 - $2.28
10 $1.09 $1.12 $1.13 $3.35
Total $8.02 $8.57 $3.35 $19.93
As can be seen, while there are some differences between grade level and subject area costs, these are not substantial, due in part to the minimal use of written-response items in the conventional assessment program at each grade and subject area.
The model generated costs for a typical current assessment for a moderately large state were mostly as expected, as summarized below:
• Total cost and costs by function are in line and typical with what would be expected in a large- scale assessment.
• Costs for production, manufacturing, and warehousing are a bit lower than normal due to an efficient test design and the exclusion of sci-ence from the subject areas being tested. Adding a science assessment would yield costs for these functions in the $8-per-student range, which is what would be expected in a typical large-scale assessment.
• Development costs are about one-quarter of total costs and consistent with a typical assessment.

26 Stanford Center for Opportunity Policy in Education
• CR scoring is a bit high but in the reasonable range at a bit less than one-third of total costs, which is the result of using all ECR items in the three exams.
• The writing assessment includes 10 MC questions versus 25 for read-ing and mathematics. The lower development cost of the writing exam is offset by the higher-scoring costs associated with the writing CR items.
• As noted earlier, the vendor margin is probably a bit higher than that experienced in the industry today but reflects ASG’s views on the di-rection of future pricing.
2. An innovative HQA program for the same moderately large state The costs of a new HQA program for the same “typical” state, with the same numbers of students assessed, were also estimated for the same four fiscal years—a base year (la-beled Year 0) which is necessary to prepare the needed assessment materials for use—and three additional years of operational testing, labeled Years 1, 2, and 3. For each year, the anticipated cost of operating the high- quality assessment program in the single state was calculated. Costs were also calculated for the following: total cost, cost per student, cost by function, and cost by content area and grade. Each of these is described for this assessment model.
The high-quality model assessment program differed from the conventional one shown above mainly in terms of the number and type of CR items, as well as the addition of PEs and PTs. Also, with the addition of more CR and performance items, fewer MC items were used. Such a program involves considerably more scoring of student re-sponses than in a traditional program, and it is anticipated that such a program will be substantially more expensive than the conventional program. Note that, in this case, it was assumed that all scoring activities were performed by the vendor. In new systems, it is possible that teachers within a state are part of a moderated scoring system, in part to support professional learning. We examine this possibility in later scenarios.
Table 4 summarizes the total yearly cost for the representative comprehensive assess-ment program in the same state of moderate size. These (and other) costs are based on the specifications shown in the previous section.
Table 4. Total Single-State HQA Program Cost by Year
Year Year 0 Year 1 Year 2 Year 3 Total Cost
Cost $7,813,641 $45,562,943 $45,473,513 $47,292,454 $146,142,551
As can be seen, the cost of operating the high-quality comprehensive assessment pro-gram, one with substantial increased use of CR items and performance assessments,

27The Cost of New Higher Quality Assessments
is substantially larger than the conventional program—$146 million over three-plus years versus approximately $52 million (see Table 1) for the same moderately sized state.
This is also reflected in the per-pupil cost, which is shown in Table 5.
Table 5. Per-Pupil, Single-State HQA Cost
Year Year 0 Year 1 Year 2 Year 3 Average Cost
Cost $8.93 $52.07 $51.97 $54.05 $55.67
Table 5 indicates that the HQA program is more costly per pupil because the larger number of expensive types of items (CR and performance assessments) used in it. This is something that assessment-program designers will need to consider as innovative approaches to assess-ment are considered in response to the common core development movement among the states.
Also, something interesting to note is that when the assessment design was changed to the HQA, roughly 12% was saved on development, printing, and warehousing costs because the reduced number of MC items results in less development, less field testing, and a smaller test book.
Another way of looking at the cost for this assessment model is cost by function. Figure 2 shows the costs for each portion of the assessment program. This allows the reader to see which functions are the most expensive in the HQA program. This serves to provide targets for cost-saving measures, as explored in the set of cost-saving options that follow.
Figure 2. Cost by Function for an HQA
Total Cost by Function = $146,142,551
QA, Psychometrics, Tech Support
Program Management
Reporting
CR Admin/Other
PT Scoring
PE Scoring
SCR & ECR Scoring
Receiving & Scanning
Printing & Distribution
Content Development

28 Stanford Center for Opportunity Policy in Education
As can be seen, the single most expensive portion of this assessment program is scoring—of the SCR and ECR items, the PEs, PTs, and administrative costs associated with scoring. The total cost of $110 million for such scoring is more than three quarters of the total cost of this innovative assessment program. This scoring cost is about $95 million more than in the traditional assessment program (shown in Figure 1 above). The other costly portion of this HQA program is content development, representing around 5% of the total cost, although content development is about $1 million less for the HQA model than the conventional one. As mentioned above, this occurs because by moving from 50 MC items to 25 MC items, the number of items to be developed and field-tested is much less. The cost of procuring (not testing) a CR item—although about double an MC item (~$600 vs. ~$300)—does not offset the fewer MC items required to be developed. (Note: It costs $2,500 and $5,000, respective-ly, to develop but not field test the PEs and PTs.)
A final way of looking at cost is by content area and grade, as is indicated in Table 6. This view of the assessment system shows the different costs associated with the English lan-guage arts (reading and writing) assessments, as well as the mathematics assessments, at each grade level.
Table 6. Single-State HQA Cost by Content Area and Grade
Grade Mathematics Reading Writing Total
3 $1.93 $3.04 - $4.97
4 2.98 2.99 2.46 8.43
5 3.97 3.24 - 7.21
6 3.93 3.25 - 7.18
7 3.96 3.18 3.22 10.36
8 3.93 3.24 - 7.17
10 3.93 3.17 3.26 10.36
Total 24.64 22.10 8.94 55.67
As mentioned above, grade-level costs vary because at third grade, a scannable test booklet is used, while an answer folder is used at the other grades. In addition, there is a differential use of the innovative assessment types across the content areas. This will be reflected in the greater differences in costs between the content areas, as seen in Table 6 versus Table 3.
In conclusion, for the HQA for the same state, some interesting things happen when com-paring it to the typical assessment, as summarized here:
• Development costs actually decrease as the fewer MC items offset the ad-ditional cost of developing additional CR and PE/PT items.

29The Cost of New Higher Quality Assessments
• With fewer MC items, it was possible to eliminate a field test form and decrease the number of pages in the test book by 25% to 33%.
• Costs for production, manufacturing, and warehousing costs are 12% lower than in Case 1. These savings are more than offset by the in-crease in CR scoring and the addition of the scoring for the PEs and PTs.
• Costs for scoring of CR and PE/PT items increase substantially and result in a much higher total and per-pupil cost than Case 1, as ex-pected. This is because more CR and performance items are used, and because the performance assessments require substantially more time per student to score them accurately.
3. Cost-Reduction StrategiesAs noted in the previous section, several potential cost-saving strategies were selected to determine if they could reduce the costs of the HQA model, perhaps so much so that it could be more affordable to states. Each cost-reduction strategy was examined separate-ly, so its impact on total costs could be separately ascertained. However, it is anticipated that two or more of these strategies might be employed by states so as to minimize the costs of innovations in assessment design used by them.
3A. Participating in a state assessment consortium of 10, 20, or 30 states to share development and overhead costs. There are a number of costs associated with state assessment programs that are fixed or which do not vary greatly depending on the number of students assessed. The goal of a consortium is to avoid redundant activities so that these fixed costs can be shared among a larger number of states, thereby making the assessment program more efficient. The total cost to any state would be less since these costs would be spread over a larger base—whether this is calculated in terms of number of states or number of students.
Partially offsetting the cost savings will be some cost increases because certain activities for a group of states working together end up being more expensive than the same ac-tivities carried out just in one state. For example, project management meetings called by a group of states in a consortium will involve greater travel costs, and may also in-volve increases in management costs (for administering the multistate project). Hence, it is important to examine how costs would be affected by different sizes of consortia.
For sake of convenience, consortia that involve 10, 20, or 30 states working together were selected. The total number of students used for costing represented 20%, 40%, or 60% of the total number of students enrolled in public schools as reported by the U.S. Department of Education National Center for Education Statistics in 2009.

30 Stanford Center for Opportunity Policy in Education
The data shown in Table 7 are reported in a similar manner as above for consortia of 10, 20, and 30 states with the costs for a single state shown again for convenience.
Table 7. Total HQA Cost by Year and Consortium Size
No. of States
Year 0 Year 1 Year 2 Year 3 Total Cost Average Per State
1 $7,813,641 $45,562,943 $45,473,513 $47,292,454 $146,142,551 $146,142,551
10 $7,255,524 $220,534,504 227,580,504 236,683,724 692,054,256 $69,205,426
20 10,865,234 422,821,426 438,008,219 455,528,548 1,327,223,427 66,361,171
30 14,109,627 605,517,274 628,080,944 653,204,182 1,900,912,027 63,363,734
A couple of things can be noted from this table. First, the per-state cost goes down as more states join the consortium. This is to be expected as fixed costs are spread over more entities. Second, the per-state cost of all three consortia, is substantially lower than the cost of a state operating a comparable program by itself. For example, Table 4 showed (and this table also shows) that a single state would pay $146 million for an HQA program, while states working together can save substantially—between $75 mil-lion to more than $80 million per state over the three-plus years of operation. The costs for the innovative program when states work together come much closer to the cost of the conventional program—$52 million (see Table 1) versus $63-66 million (Table 7). Therefore, states working together in a consortium could save substantial money over working alone and could implement a much more innovative assessment program for not much more money over four years. (Note that some of the narrowing of the cost differential between a single state and a consortium of states implementing an HQA system results from the smaller average state size in the consortium, 540,000 students, versus the moderately large-state size, 875,000 students, modeled for the single-state case.)
The per-pupil costs for each size of consortium are shown in Table 8. This is a more direct method to compare costs, since it is the per-pupil cost that would give an indi-vidual state a better idea of what such an innovative program would cost to operate.
Table 8. Per-Pupil Cost of Assessment, Per Year, by Consortium Size
Size Year 0 Year 1 Year 2 Year 3 Average Per Pupil
1 State $8.93 $52.07 $51.97 $54.05 $55.67
10 States 1.33 40.54 41.83 43.51 42.41
20 States 1.00 38.86 40.26 41.87 40.66
30 States 0.86 37.10 38.49 40.03 38.83

31The Cost of New Higher Quality Assessments
Total Cost = $1,327,223,427
QA, Psychometrics, Tech Support
Program Management
Reporting
CR Admin/Other
PT Scoring
PE Scoring
SCR & ECR Scoring
Receiving & Scanning
Printing & Distribution
Content Development
As can be seen, the net effect of a larger group of states working together is a savings of about $3.50 per student for working in a consortium of 30 states versus 10 states, and substantially greater savings (in the range of $10-$15 per student) than for a state to tackle this work on its own (see Table 6 for comparison purposes).
Costs for the three consortium sizes by function are shown in Figures 3A, 3B, and 3C so that comparisons can be made on the amount of possible savings that can result by working with groups of states.
Figure 3B. Cost by Function for 20-State Consortium
Figure 3A. Cost by Function for 10-State Consortium
QA, Psychometrics, Tech Support
Program Management
Reporting
CR Admin/Other
PT Scoring
PE Scoring
SCR & ECR Scoring
Receiving & Scanning
Printing & Distribution
Content Development
Total Cost = $692,054,256

32 Stanford Center for Opportunity Policy in Education
The pie charts show which functions are fixed or relatively fixed and those that are vari-able based on the number of students assessed. For example, the content development costs are almost flat (actually, go down slightly as the size of the consortium increases). Scoring costs, on the other hand, are directly proportional to the number of students assessed, so states working together in a consortium will have a small impact on the per-pupil or total costs of this function. The impact of a consortium on reducing scoring cost is largely due to pricing as the assumption was made that a consortium of 10 states will get a 5% discount, 20 states get a 7% discount, and 30 states get a 9% discount from the base case. There are some additional costs that, if shared, would result in savings to states, for example, QA, psychometrics, and technical support.
Table 9 shows the cost per student for each content area for the single-state and differ-ent consortium sizes.
Table 9. HQA Cost by Content Area and Consortium Size
Consortium Size
Mathematics Reading Writing Total
1 State 24.64 22.10 8.94 55.67
10 States 18.93 16.58 6.91 42.41
20 States 18.15 15.88 6.63 40.66
30 States 17.34 15.16 6.34 38.83
In conclusion, for the HQA developed and procured by state consortium, a few interest-ing things were noted, including:
Figure 3C. Cost by Function for 30-State Consortium
Total Cost = $1,900,912,027
QA, Psychometrics, Tech Support
Program Management
Reporting
CR Admin/Other
PT Scoring
PE Scoring
SCR & ECR Scoring
Receiving & Scanning
Printing & Distribution
Content Development

33The Cost of New Higher Quality Assessments
• While the student count has increased by a factor of roughly 6.2 times, expense items increased by less than this amount, including those ex-penses that vary with the number of students. This is mostly due to im-proved efficiencies in printing, distribution, and scoring (highly variable cost functions), as well as lower margin assumptions versus the base case as state consortia size increases.
• Significant efficiencies were seen in the scoring of CR and PE/PT items. This is because of three factors: a) margin is lower by 5%+ as a consor-tium of states is able to negotiate better vendor pricing than a single state, b) the same number of students are needed to be field-tested as consortia size increases in order to get valid results on these items, and c) the training component of the scoring is essentially a fixed cost.
• The QA, IT, and psychometrics functions expenses did not increase much with the increase in the number of students.
• In total, per-pupil costs decline from $55.67 to $42.41 in the 10-state consortium, a reduction of roughly 24%. The reduction is 30% for the 30-state consortium.
• Two operational forms and a breach form (that is not printed) of the exam were developed. Our assumption is that states will be comfortable using the same assessment form and will work through the security is-sues involved in such a situation rather than developing separate forms for their individual use. Developing and using more than two opera-tional forms yearly would increase development and production costs significantly.
Overall, it is clear that states working together in developing and implementing a com-mon HQA program can do so at substantial cost savings to each participating state, but by working together, they will not be able to save enough from this action alone to bring the costs of innovative assessments in line with current expenditures on assessment.
Note that in actual operation, states might choose to share fixed costs on a per-state basis (e.g., a consortium of 10 states would divide the fixed costs by 10), while the variable costs might be shared on a per-student basis. This could result in slightly different “per-state” costs than are shown here.
3B. Moving to online delivery of the assessment to reduce production and shipment costs. The next cost option explored was the online delivery of the assessment by computer. The assumption was made that all students in each state participating in a consortium would be assessed in this manner, with the only exception being a few students with disabilities for whom a paper-based assessment would be an appropriate accommodation.

34 Stanford Center for Opportunity Policy in Education
For costing purposes, the same HQA program was used, and the assumption was made that the scoring would be carried out by the vendor using its trained human scorers. Table 10 shows the costs associated with this assessment delivery method.
Table 10. HQA Cost by Delivery Method and Consortium Size
Consortium Size Total Assessment Cost
Online Per-Pupil Cost
Paper Per-Pupil Cost (3A)
10 States $663,287,152 $40.64 $42.41
20 States 1,240,224,116 38.00 40.66
30 States 1,730,018,897 35.34 38.83
As can be seen, the cost of assessing students online is less than paper-based testing, as shown in the comparison of costs between this table and Tables 7 and 8. The net per-pupil savings is about $2.25 to $3.50 per student.
For consortia with online administration, some savings were seen from the move to online assessment, as summarized below:
• The savings are a bit less than expected as moving to the HQA elimi-nated 12% of per student pencil-and-paper costs and, therefore, less potential savings were available when moving to online test administration.
• Online system costs (including a prime contractor management fee) of $3.72 per student in the 10-state consortium, $2.63 in the 20-state consortium, and $1.58 in the 30-state consortium were assumed.
• The savings for moving to online assessment are still significant as a percentage of total non-CR and PE/PT assessment costs.
• Moving to online assessment within the context of an assessment consortium of any size will save states some money, but the savings are not substantial (where an assessment includes vendor scoring of performance items)—certainly, not larger than the cost savings of sim-ply working together. The cost savings are more significant for online assessment administration versus a traditional assessment without performance items.
3C. Using teachers to score PE and PT itemsAnother option is for local educators to score the PEs and PTs. This approach has been used successfully in some testing programs and by a variety of countries. The first table, Table 11, shows the costs when teachers are doing this as a PD activity. For costing pur-

35The Cost of New Higher Quality Assessments
poses, the assumption was made that each PE would take on average three minutes to score and each PT would take on average six minutes to score.
A number of studies have noted the strong learning benefits of teachers’ involvement in scoring, and thus one could argue that this activity could be undertaken as part of state PD budgets. In this case, the costs for teachers’ time in carrying out the scoring tasks are not associated with the assessment contract and not included in the cost of using an assessment vendor.
Table 11. Assessment Costs When Teacher Scoring as PD Activity Is Used
Consortium Size
Total Assessment Cost Teacher PD Scoring Per-Pupil Cost
10 States $305,198,877 $18.70
20 States 520,475,313 15.95
30 States 713,554,967 14.57
This table shows that the cost of the assessment program would be substantially lower if states’ teachers are used for scoring and if the cost of this scoring were associated with the PD budget, not that of the assessment program. These costs decline somewhat in consortia that involve more states.
Table 12 shows what the assessment would cost if teachers were paid a $125 stipend per day for scoring the PEs and PTs. These costs were provided to look at cases where pay-ments to teachers would be necessary for them to participate in scoring the assessments items requiring human scoring.
Table 12. Assessment Costs When Teachers are Paid $125 Stipend Per Day
Consortium Size
Total Assessment Cost Including Teacher Stipend
Per Pupil/Teacher Stipend Cost
10 States $508,635,610 $31.17
30 States $1,258,768,591 $25.71
This table shows that the costs of the assessment programs for consortia of 10 and 30 states are higher than the previous scenario, but much less than the costs for vendor scoring of the performance items (Table 8) if teachers are paid a stipend of $125 per day to score the PEs and PTs.
Because of uncertainty about the length of time for scoring of the PE and PT items, an additional analysis was run (for a 10-state consortium only) to show the per-pupil costs for scoring the same number of PE and PT items but assuming an increase in scoring time. This is shown in Figure 4 (page 36).

36 Stanford Center for Opportunity Policy in Education
Figure 4. PE and PT Scoring Costs Per Student, Varying Scoring Time Per Item
$13.76
$18.33
$22.91
$27.48
$32.06
$36.64
$41.21
$13.56 $15.82
$18.06 $20.32
$22.57 $24.83
$27.08
$-
$5.00
$10.00
$15.00
$20.00
$25.00
$30.00
$35.00
$40.00
$45.00
Base 1 min 2 min 3 min 4 min 5 min 6 min
Cost
per
Stu
dent
Number of Minutes Added
10 State Consortia - PE & PT Scoring Cost per Student - Impact of Increase in Scoring Time
PE Cost per Student PT Cost per Student
Not surprisingly, Figure 4 shows a fairly predictable relationship between added time per PE/PT item and cost. However, this chart will permit states to estimate what such items would cost depending on the complexity of the PE and PT items that they design. More complex items will naturally take more time to score and will cost more when scorers are paid outside of PD time.
In conclusion, for the approach of using teachers to score PE and PT items, significant cost savings were found, as summarized here:
• Using teachers to score PE/PT items as part of their compensation (PD) makes a substantial difference, since the cost of scoring these items is “free,” and reduced costs to $18.70 per student in the 10-state consor-tium and $14.57 in the 30-state consortium.
• Paying teachers a $125/day stipend still saves significant costs and results in an assessment cost of $31.17 per student at the 10-state con-sortium size and $25.71 at the 30-state consortium size.
• Using different assumptions about scoring time directly affects the per-item scoring costs. States will need to factor the complexity of the per-formance assessments used into their planning for design and costs.
• Key assumptions made in the teacher scoring case were: 1) the scoring would be distributed so there are no facilities or management overhead

37The Cost of New Higher Quality Assessments
costs, and 2) the vendor would accept a lower overhead and profit margin on this work (10% overhead and 15% margin) based on the $125 teacher stipend amount.
These analyses show that, if the states are able to have teachers score the assessment items that require it without having to pay them a stipend because the costs are considered to be a PD cost, they can save a considerable amount of money (while giving their teachers the positive experience of learning to score the assessments and thus improving their understanding of student learning). With very large consortia, the $25.71 per-student cost of the assessment (assuming a teacher stipend of $125/day) is at the mid-to-high end of the range of today’s high stakes assessments.
3D. Using distributed scoring for CR items The next potential cost-saving strategy is to use distributed scoring for the CR items. This arrangement is used to minimize costs since scorers are working from home and the assessment contractor does not need to provide a bricks-and-mortar facility with its own computer equipment to score these items. Scorers provide their own equipment and connect to the contractor and score the items digitally online. This scoring is carried out in a secure manner.
Table 13 shows the impact of distributed scoring used in consortia involving 10, 20, or 30 states. It assumes that half of the student responses are contractor-scored in one of its facilities, and the other half are scored through distributed scoring off-site.
Table 13. HQA Cost Using 50-50 Distributed Scoring by Consortium Size
Consortium Size Total 50-50 Assessment Cost
50-50 Assessment Cost (per pupil)
All On-Site Contractor Cost (per pupil) (3A)
10 States $679,802,413 $41.65 $42.41
20 States 1,303,450,391 39.93 40.66
30 States 1,866,192,174 38.12 38.83
It can be noted that there are slight cost savings for using distributed scoring when compared to scoring by contractor staff fully on-site at the contractor site(s), as seen in the final column (taken from Table 10).
In this model, the approach of using distributed scoring at a 50/50 on-site versus distributed mix had less impact on assessment cost than expected due to the rela-tively low percentage of scores and costs represented by the CRs once the PE/PT scoring costs were included. The cost data for this option are summarized on the following page:

38 Stanford Center for Opportunity Policy in Education
• Generally, distributed scoring is expected to be about 25% to 30% less expensive than on-site scoring for those items that are scored using the distributed model.
• Since a 50/50 mix was used, an 11% reduction in the total CR scoring costs was seen.
If a new assessment were to include more CR items (than currently used), distributed scoring can make a strong contribution to reducing costs.
3E. Automated scoring for some CR items The final cost-saving option for the large-scale summative assessments is to use com-puterized AI software to score student responses to CR items (excluding PE/PT items). Such software has been studied extensively in recent years and has been found to pro-duce relatively comparable results to hand scoring by humans. It is more effective with some sorts of student-written work (such as extended CR items or essays) than others. Thus, a mixture of hand scoring and computer scoring was costed. (Note: To make such assessment scoring truly efficient, the essays to be scored should be entered into the computer via online assessment.)
Table 14 shows the financial impact of using computer-based scoring with a consortium of 30 states.
Table 14. Assessment Cost Using a Mixture of Computer and Human Scoring of Written Response Items
Consortium Size Total Assessment Cost Per-Pupil Cost
30 States $1,855,328,550 $37.90
As can be seen above, there is some cost savings from using computer AI software to score a portion of the written-response assessments.
For the use of AI scoring of CR items, the data are summarized below:
• An “engine tuning” or calibration cost of $6,000 per item was assumed to load the responses into and train the scoring engine.
• At $0.50 per response for scoring, which is the bottom end of the per-pupil price range, cost savings were modest. This is due largely to what can be high costs of training the computer to score accurately in some contemporary models. While some vendors state they can achieve cost savings from AI scoring, another AI vendor argued that “it is a myth that current costs for online scoring of CR questions is less expensive than human scoring.” Strong savings from this approach

39The Cost of New Higher Quality Assessments
will rely on developing increasingly cost-effective means for program-ming the scoring function.
• It is worth noting that online scoring is significantly faster than human scoring. Whereas human scoring of a typical state assessment takes several weeks, online scoring can be accomplished in a day or two, once the system has been set up.
• Costs for AI scoring need to decrease further to make this option more beneficial. However, this is a very valuable future potential cost-sav-ings source, and progress in this area needs to be closely monitored.
• At the time of the issuance of this paper, ASG is continuing its research in this area to determine if solutions from other vendors and orga-nizations that have taken different approaches to AI scoring can be implemented in the high-stakes testing arena. In any event, as systems mature and prices come down (particularly the costs of “training” the system), these systems will undoubtedly warrant further investigation.
3A-E. Use of All Cost-Saving Measures TogetherBefore examining the development and use of interim assessments, ASG combined all of the cost options (3A through 3E) to examine the impact of using all of the options together. The use of multiple, cost- reduction strategies could have a significant impact on the overall cost, so it was essential for us to examine all of the potential reductions together. This information is shown in Table 15 for the summative assessment.
Table 15. Assessment Costs Using All-Cost Savings Measures (3A-3E)
Size Year 0 Year 1 Year 2 Year 3 Total Per-Pupil
30 States
$6,266,215 $160,576,640 $161,427,363 $163,969,135 $492,239,352 $10.05
Table 15 shows that if a consortium of states were to adopt all of the cost-reduction strategies described above, the per-pupil cost of the summative assessment would be $10.05 versus $19.93 for a single state’s current summative assessment system (see Table 2) or $55.67 if the same state gave the HQA alone without any of these cost-sav-ing features (see Table 5). This means that it should be possible for consortia of states to create HQA designs and, by working together and adopting a variety of other cost-sav-ing measures, actually deliver an assessment that is of much higher quality at no more than current—or even potentially lower—costs.
We also looked at a case where a large consortium of states (30) adopted all of the cost reduction strategies discussed above but paid teachers a $125/day stipend to score

40 Stanford Center for Opportunity Policy in Education
performance events and performance tasks. In this instance, the price per pupil is $21.19 or only 6% greater than the current price a state pays for the typical high stakes assessment.
3F. Development of a customized interim benchmark-assessment system with similar item types and structure as the high-quality system One additional scenario was examined—that of developing a customized set of assess-ment tasks to be used by local school districts as interim benchmark assessments. The costs shown in Table 16 include only the cost of developing the assessments for consor-tia of different sizes, not the costs of administering, scoring, and reporting them. These functions are not necessary if scoring is locally managed and results are used for class-room information and local instructional development purposes.
Table 16. Interim Benchmark Assessment Development Costs
Consortium Size Total Assessment Cost Per-Pupil Cost
10 States $4,623,736 $0.85
20 States $4,974,680 0.46
30 States $5,329,608 0.33
This table shows that the cost for a consortium of states to develop an interim bench-mark assessment bank of tasks is very inexpensive. Of course, to these costs, the states would need to add any assessment administration, scoring, and reporting costs if the state(s) chose to carry out these activities for local school districts (and absorb the costs).
3F (2). Interim Assessment Administration OptionsThe second portion of the interim system analysis conducted by ASG was to determine the cost to provide an interim benchmark system for use among the states participat-ing in a consortium. When states form consortia to develop and implement large-scale assessments at the state level, they may also wish to consider how they could provide interim benchmark assessments to their local school districts. For cost purposes, con-sortia of 10, 20, and 30 states were used. Four options for interim benchmark assess-ments at the state level were examined. These are:
A. The full consortium buys/leases a complete system (items and online delivery system) from a vendor and this system is provided to local districts to use as they see fit.
B. The consortium purchases/leases an online assessment system from a vendor, but the consortium loads its own assessment (which it has developed) into the system and provides the system for local district use.

41The Cost of New Higher Quality Assessments
C. The consortium develops its own assessments and administers these and the state assessments using the same online system that they have either created or leased.
D. The consortium develops its own assessments and provides these to the local school districts to use as they see fit—to load into any online system that they have and/or to use as paper-based assessments.
In order to assist states working in a consortium to understand the costs of these op-tions, cost estimates were prepared to show what options A-C would cost per student and per state. Each is shown below.
A. Consortium Buys/Leases System and Provides to School DistrictsTable 17 shows the costs for selecting an existing system to deliver interim benchmark assessments, including the use of the vendor’s assessment items.
Table 17. Consortium-Provided Interim Benchmark System Cost
Total Cost Average Per State
10 States $130,559,184 $4,351,973
20 States $220,478,572 $3,807,976
30 States $293,758,164 $3,263,980
This table shows that a state-provided interim benchmark assessment system is not inexpensive. However, offsetting the cost is the speed with which an existing system can be installed and used.
B. Consortium Buys/Leases Online System, But Builds Own AssessmentsThe next scenario shows the costs for an interim benchmark system in which the con-sortium of states leases the online assessment system, but the assessments are provided by the consortium itself, not the vendor. Table 18 shows the costs for this system.
Table 18. Consortium-Leased Online System with Consortium-Developed Items
Total Cost Average Per State
10 States $97,919,388 $3,263,980
20 States $163,198,980 $2,719,983
30 States $195,838,776 $2,175,986
This table shows that, if states created their own assessments, there would be a modest cost savings to the states. Whether the savings are large enough for states to elect this option would be a matter for the consortium to determine.

42 Stanford Center for Opportunity Policy in Education
C. Consortium Builds its Own Assessments and Uses the State Assessment System to Deliver the AssessmentsThis option is for the states to create the interim benchmark assessments on their own, and then to use the same online assessment engine used for the state assessment pro-gram to deliver the interim assessments periodically. These costs are shown in Table 19.
Table 19. Consortium-Developed Assessment Delivered by Online State Assessment System
Total Cost Average Per State
10 States $32,639,796 $1,087,993
20 States $48,959,694 $815,995
30 States $48,959,694 $543,997
As can be seen, the added cost to administer the interim assessments using the same system as used for the state assessment program is not as great as using a separate sys-tem. This is one way that a consortium of states could save money.
D. Consortium Builds Own Assessments and Local Districts Use As They DesireThe fourth and final option is for a consortium to build their own assessments and turn these over to local districts to use whenever and however they desire. The development costs are shown in Table 16. This would mean some districts might choose to use them electronically, some might use them in paper-based systems, and others choose not to use them at all. This is the least expensive of the four options, since no test administra-tion, scoring, and reporting services are provided. However, it is also the most flexible option, since local districts are not obliged to use the interim benchmark assessments at a particular time or manner.
Due to the wide variety of options (state providing camera-ready proofs, state providing digitized data, state providing hard-copy assessments, etc.), we did not price a scenario for this option.
In summary, adding the costs of an interim assessment system to the cost of an HQA system that takes advantage of the cost savings identified in this study, would still allow a consortium of states to offer a rich, performance-based system of assessment for less than most states are spending today for tests that offer much less utility for supporting intellectually challenging learning and information for instruction.

43The Cost of New Higher Quality Assessments
Summary, Conclusions and Discussion, and Recommendations
Overall Summaryn this study, a series of analyses were conducted to model the costs of various as-sessment designs and approaches for implementation. Costs for a typical, traditional state assessment were analyzed, as well as those for an innovative, high-quality state
assessment. Cost models were then analyzed for a variety of cost-reduction strategies to see if an HQA could be developed and administered at or near the cost of a traditional assessment. The following chart shows the total cost per student for the different mod-els that were analyzed.
As can be seen, total costs are almost three times higher for the HQA than for the tra-ditional assessment (approximately $56 compared to $20). This is primarily due to the increased costs for scoring of CR and performance items in the HQA. However, if these items are scored by teachers instead of by the vendor, the total costs can be reduced substantially—to approximately $31 (with stipended teachers) or $19 (teacher time as part of otherwise-covered PD) for a 10-state consortium. Participating in an assess-ment consortium reduces the total costs significantly. Larger-sized consortia are able to achieve more savings than a 10-state consortium, but the savings secured as states increase are not linear. Various online assessment delivery strategies were analyzed and
I
$0
$10.00
$20.00
$30.00
$40.00
$50.00
$60.00 30 State
20 State
10 State
Single State
HQA 50/50 Distributed Scoring on
SCR/ECR
On-Line Testing Teacher Scoring w/Stipend
Teacher Scoring w/o Stipend
HQA - All cost variables applied
w/stipend
HQA - All cost variables applied
w/o stipend
Current MC (Non-HQA Test)
Cost
per
Stu
dent
Figure 5: Diminishing Expenditures per Student for High Quality Assessments

44 Stanford Center for Opportunity Policy in Education
found to have some additional benefit in reducing the cost of the HQA. Combining all cost-reduction strategies in a 30-state consortium can bring the total cost down to only $10 per student—half of what the current traditional assessment costs a typical state. Combining all cost-reduction strategies in a 30-state consortium that pays teach-ers a $125/day stipend to score peformance event and performance task items results in a cost-per-student of only $21—about what is spent by a typical state for its current, largely multiple-choice, assessment.
Another way of looking at the data from the cost models is presented below. The next figure shows the potential cost savings individually for each of the six options that were analyzed.
Figure 6. Cost-Savings Impact of Different Assessment Delivery Options
Of the cost-reduction strategies that were examined, teacher scoring (with and without stipend) and formation of consortia were the two most important means of controlling overall assessment cost. While there are issues to be tackled regarding the implementation of teacher scoring (including determining the opportunity cost of forgone teacher time) and the formation of state consortia, both strategies should be a part of the plans for any future assessment system. Additional cost savings can be obtained by the use of online de-livery, distributed scoring, and AI scoring of CR items, although the potential savings per student for these last three options are nowhere near as large as for the other options.
$0
$5.00
$10.00
$15.00
$20.00
$25.00
$30.00
$35.00
$40.00
AI Scoring of CR Items
Distributed Scoring of CR Items
Online Delivery
Teacher Scoring with $125/day
stipend
Teacher Scoring
Consortia
Pote
ntia
l Sav
ings
per
Stu
dent
Savings Strategy

45The Cost of New Higher Quality Assessments
Conclusions and DiscussionBased on the findings from the analyses presented in Section IV, the following conclu-sions can be made from this study.
Need for Innovative Assessment ApproachesOne of the underlying assumptions of this study is that state assessments need to be improved so that they do a better job of measuring the critical skills students will need in the 21st century, are integrated into the curriculum, help students learn, and provide teachers with opportunities to develop new instructional strategies. An interim assess-ment system is an important part of any balanced assessment system and is estimated here as including the same item types as the summative system.
There are many worthwhile ideas about how new, high-quality, innovative assessment systems might be designed and constructed. This study looked at one such model, as well as possible variations on approaches that could be used by states, and analyzed ways to make that model as cost efficient as possible. As states decide to work together to design and implement new HQAs, these states would be wise to examine the costs for their consortium design, so as to make certain that they have designed the most ef-ficient and cost-effective program possible.
Costs for ImplementationIt was found that the development cost of a new HQA is relatively inexpensive relative to the total cost of the assessment. However, a key factor in the sustainability of new improved assessments and whether or not states can adopt and use them will be the ongoing administration costs that need to be managed.
Current systems exist for interim assessments and the costs of these systems can likely be reduced substantially if procured by a consortium of states with new content already developed (assuming teachers score the performance items). Combining the purchase of an interim assessment system with a summative system provides the largest interim-assessment, cost-savings opportunity.
State ConsortiaIn order to reduce costs across states, it will be important to have states participate in assessment consortium to share the overhead associated with development and manage-ment of assessments. Larger consortia are more cost-effective, although the majority of cost savings relative to a single state case can be seen at the 10-state consortium size.
Implementing an HQA system with performance items is affordable, with teacher scor-ing of performance items at a price comparable to today’s assessments when procured by a consortium of states.
ScoringIn order to implement and afford an HQA system that includes a variety of performance items, it will be essential to have teachers involved in the scoring process. Financially

46 Stanford Center for Opportunity Policy in Education
and logistically, the scoring model currently used in most states (vendor does all scor-ing) could be a challenge for states and/or state consortia in the future. The total amount of money for outside scoring and the sheer number of scorers that would be re-quired to mark all the answers could be difficult, if not impossible, to find and manage. Many countries with high-performing educational systems involve their teachers in the scoring of performance items and integrate that part of the process in the curriculum as a PD activity. State consortia that purchase assessments and pay teachers a stipend to score these responses will be able to develop and administer an assessment at the high end of the range of prices seen today.
Other Cost-Reduction StrategiesThe use of online technology (i.e., online assessments) should be encouraged as it also has the potential to reduce assessment cost and improve quality. The size of the cost reductions that were calculated assuming implementation of an online assessment was not as large as was expected. However, this is somewhat related to the assessment de-sign (only three subject areas, an efficient design, small test books) and would undoubt-edly be larger given different design parameters. The procurement of PCs to improve the student- to-PC ratio should be encouraged at all levels of the educational system.
Ultimately, the use of AI systems to score essay type responses holds tremendous po-tential value for the future affordability of HQAs. Today, AI scoring systems are often too expensive for states and the cost of scoring CR questions by this method is about the same as using human scorers. As systems mature and costs come down, AI scor-ing systems offer tremendous advantages in the delivery of results from performance assessments.
Final Recommendations
Based on the data from the cost models and the conclusions listed above, ASG makes the following recommendations:
• Developing and implementing an HQA will likely cost more than most current state assessments, but it can be affordable for states if they look carefully at the design, find a balance in the number of CR items, PEs, and PTs that are used, and consider various cost-reduction strategies.
• States should strongly consider being part of a large consortium where certain costs can be shared across many states, such as for item devel-opment and project management.
• States should consider using a scoring model that has teachers scor-ing the performance items as part of their PD via a distributed scoring system. Having all scoring done by the testing vendor is likely to be cost-prohibitive for most states. Paying teachers a stipend also helps

47The Cost of New Higher Quality Assessments
reduce costs, but not as much as using a PD approach. In either case, there are benefits for teacher learning and instruction, as well as cost savings, associated with teacher scoring.
• States may want to consider moving to online assessment, as it can be more cost-effective than printing test booklets and shipping them to schools. Although the initial savings may not be as large as thought when implementing an HQA design, in the long run, online assess-ment will save states both money and time. Many states feel that cur-rent PC-to-student ratios of 4 or 5 to 1 make it difficult to implement online administration of assessments. Policies to help states procure additional PCs and bandwidth for schools should be encouraged.
• Ultimately, automated scoring of essay responses should lower scoring costs for these items significantly and further enable the implementa-tion of HQAs at reasonable prices. AI scoring should be encouraged and its progress monitored.
• States should consider examining the costs for their future assessments in more detail and look at different options that make the assessment both higher in quality and more efficient. For example, states may want to design an assessment that has many more CR items, no PTs, and uses an AI scoring engine to score all items. There are many varia-tions on the possible designs that could be used by states, and all have different cost implications.
• State consortia interested in implementing a higher-quality assessment need to make sure they can afford the ongoing administration costs of the assessment. It is recommended that state consortia go about the process of developing and costing a new assessment in a thoughtful manner and use a comprehensive costing model to analyze and deter-mine the price in advance of any new assessment system they would like to implement.
Finally, in our opinion, the RTTT and Common Core Assessments are key initiatives in improving education, and states have an opportunity to receive some much-needed resources and assistance to help them make important improvements to their assess-ment programs. The research conducted for this study and results reported in this paper demonstrate that, under the right conditions, states can dramatically improve their assessment systems at an affordable cost. However, states must be careful to design an efficient assessment system and understand its ongoing administration costs, as well as future state-budget allocations prior to committing to an innovative HQA and imple-menting it in their state. States also will need to think through the various management issues when forming and working with a state consortia as well as using teachers to score performance items. Professional help in all these areas is highly recommended.

48 Stanford Center for Opportunity Policy in Education
Possible Future Research, Additional Analyses, and Other Studies of State Assessment CostsObviously, there are many ways to design an HQA system. The designs selected for this study were based on input from a variety of assessment experts. In some ways, the cost models done for this study are just a beginning, and provide valuable information to be-gin a more in-depth discussion of what potential costs could be for various approaches. It is hoped that additional cost studies will be done based on other ways to design an innovative assessment system. Analyses can include many other kinds of assumptions and variables. These could include variations in the number of CR items, different per-centages of items released each year, and changes in program components and features. Information from these types of analyses can be helpful for a state, or consortium of states, to further reduce their costs while maintaining other core components of the as-sessment system.
In this study, costs were analyzed only for reading/language arts and mathematics as-sessments. These areas were selected because of their relationship to NCLB and the current plans for common core standards and common assessments. In the future, it would be useful to run cost models of other content areas since many states also assess their students in science, social studies, the arts, and other disciplines. In addition, cost analyses of alternate assessments for students with disabilities and English-language proficiency assessments for ELLs would be useful in order to determine how to de-sign these assessments more efficiently, as well as reduce costs. It may well be possible for consortia of states to work together to also create and implement these additional assessments. In addition, some states may also want to analyze costs for their end-of-course tests or other high-school examinations.
Ultimately, the possibilities for productive assessment will be enhanced by these kinds of analyses. As we show here, by taking advantage of collaboration, technologies, and judicious design decisions, states can offer a rich, performance-based system of assess-ment that supports high-quality instruction for less than most states are spending today.

49The Cost of New Higher Quality Assessments
References Assessment Solutions Group. Cost Estimate for the New Kentucky Assessment System. Prepared by ASG for
the Kentucky Department of Education: Author. 2009.
Blumenthal, Richard. Why Connecticut Sued the Federal Government over No Child Left Behind. Harvard Educational Review. Vol. 76, No. 4. Winter 2006
Darling-Hammond, Linda. Developing Assessment Systems that Support High-Quality Learning. Stanford University: Author. 2010.
Education Sector. Margins of Error: The Education Testing Industry in the No Child Left Behind Era. Wash-ington, DC: Author. 2006.
General Accounting Office. Title I—Characteristics of Tests Will Influence Expenses; Information Sharing May Help State Realize Efficiencies. Washington, DC: Author. 2003.
Hardy, Roy A. Examining the Costs of Performance Assessment. Applied Measurement in Education, 8:2, 121-134. 1995.
Hoxby, C. (2002). The Cost of Accountability. Working Paper 8855: National Bureau of Economic Re-search: http://www.nber.org/papers/w8855 .
Jackson, J. Mark and Eric Bassett. The State of the K-12 State Assessment Market. Boston, MA: Eduven-tures. 2005.
Montague, W., Adamson, F., and Owens, M. Determining and Differentiating Expenditures and Costs for Performance Assessments. Draft paper, December 2009.
Picus, Lawrence O. A New Conceptual Framework for Analyzing the Costs of Performance Assessment. White paper produced for the Performance Assessment Advisory Board. 2009.
Stecher, Brian. The Cost of Performance Assessment in Science: The RAND Perspective. Paper presented at the National Council on Measurement in Education, San Francisco, CA. 1995.

50 Stanford Center for Opportunity Policy in Education
Appendix A: About the Assessment Solutions Group
The Assessment Solutions Group (ASG) is a consulting organization that assists state departments of education with assessment costing, assessment program evaluation, procurement and management functions. ASG senior consultants and technical advisors have more than 100 years combined experience in the assessment industry and exper-tise in all areas of the assessment function, including test development, psychometrics, IT, production and manufacturing, quality assurance, scoring operations, and logistics. ASG uses its proprietary costing model to help clients develop cost-effective and ef-ficient assessment program designs, as well as to develop and evaluate proposals for implementing high-quality, affordable systems.
For More Information
For more information about ASG, go to www.assessmentgroup.org
To contact the authors, please send email to:
Barry Topol, [email protected]
John Olson, [email protected]
Ed Roeber, [email protected]


Stanford Center for Opportunity Policy in Education
Barnum Center, 505 Lasuen Mall
Stanford, California 94305
Phone: 650.725.8600
http://edpolicy.stanford.edu
Linda Darling-Hammond, Co-DirectorStanford University Charles E. Ducommun Professor of Education
Prudence Carter, Co-DirectorStanford University Associate Professor of Education and (by courtesy) Sociology
Carol Campbell, Executive Director
oStanford Center for Opportunity Policy in Education
sc e