the cost of racial animus on a black presidential candidate: using google search … · the cost of...
TRANSCRIPT

THE COST OF RACIAL ANIMUS ON A BLACKPRESIDENTIAL CANDIDATE:
USING GOOGLE SEARCH DATA TO FIND WHATSURVEYS MISS
Seth [email protected]∗
March 24, 2013
Abstract
How can we know how much racial animus costs a black candidate if few will ad-mit such socially unacceptable attitudes to surveys? I suggest a new proxy for anarea’s racial animus from a non-survey source: the percent of Google search queriesthat include racially charged language. I compare the proxy to Barack Obama’s 2008and 2012 vote shares, controlling for the vote share of the 2004 Democratic presiden-tial candidate, John Kerry. Previous research using a similar specification but surveyproxies for racial attitudes yielded little evidence that racial attitudes affected Obama.An area’s racially charged search rate, in contrast, is a robust negative predictor ofObama’s vote share. Continuing racial animus in the United States appears to havecost Obama roughly four percentage points of the national popular vote in both 2008and 2012, giving his opponent the equivalent of a home-state advantage nationally.
Keywords: Discrimination, Voting, GoogleFirst Version: November 2011
∗I thank Alberto Alesina, David Cutler, Ed Glaeser, and Lawrence Katz for immensely helpful conver-sations. I also benefited from discussions with James Alt, Joe Altonji, Joshua Angrist, Sam Asher, SusanAthey, Thomas Barrios, Lorenzo Casaburi, Gary Chamberlain, Raj Chetty, Ryan Enos, John Friedman,Roland Fryer, Joshua Gottlieb, Adam Guren, Nathaniel Hilger, Guido Imbens, Gary King, David Laibson,Jacob Leshno, Brendan Nyhan, Aurelie Ouss, Ben Ranish, Matt Resseger, Andrei Shleifer, Greg Sobolski,Lawrence Summers, and Danny Yagan. All remaining errors are my own.

I Introduction
Does racial animus cost a black candidate a substantial number of votes in contemporary
America? The most recent review of the literature is inconclusive: “Despite considerable
effort by numerous researchers over several decades, there is still no widely accepted answer
as to whether or not prejudice against blacks remains a potent factor within American
politics” (Huddy and Feldman, 2009).
There are two main reasons the answer to this question is of interest to scholars: first,
it would help us better understand the extent of contemporary prejudice1; second, it would
increase our understanding of the determinants of voting.2 There is one main reason the
question has proven so difficult: individuals’ tendency to withhold socially unacceptable
attitudes, such as negative feelings towards blacks, from surveys (Tourangeau and Ting,
2007; Berinsky, 1999; Berinsky, 2002; Gilens et al., 1998; Kuklinski et al., 1997).
This paper uses non-survey-based methodology. I suggest a data source not previously
used to study prejudice. I proxy an area’s racial animus based on the percent of Google search
queries that include racially charged language. I compare the proxy to Barack Obama’s 2008
and 2012 presidential vote shares, controlling for John Kerry’s 2004 presidential vote share.
This empirical specification is most similar to that of Mas and Moretti (2009). They use a
survey measure of support for a law banning interracial marriage from the General Social
Survey (GSS) as their state-level proxy for racial attitudes. They do not find evidence that
racial attitudes affected Obama’s 2008 vote share.
Google data, evidence suggests, are unlikely to suffer from major social censoring: Google1Charles and Guryan (2011) surveys some of the voluminous literature studying modern discrimination.
Creative field environments used to study discrimination include NBA referees (Price and Wolfers, 2010);baseball umpires (Parsons et al., 2011); baseball card sales (List, 2004); motor vehicle searches (Knowles etal., 2001); and employers receiving manipulated resumes (Bertrand and Mullainathan, 2004).
2Rational choice theory says that economic impacts of outcomes fully determine voting. A number ofscholars have previously found important deviations from an extreme interpretation of this model (Benjaminand Shapiro, 2009; Alesina and Rosenthal, 1995; Berggren et al., 2010; Wolfers, 2002).
1

searchers are online and likely alone, both of which make it easier to express socially taboo
thoughts (Kreuter et al., 2009). Individuals, indeed, note that they are unusually forthcoming
with Google (Conti and Sobiesk, 2007). The large number of searches for pornography and
sensitive health information adds additional evidence that Google searchers express interests
not easily elicited by other means. Furthermore, aggregating information from millions of
searches, Google can meaningfully reveal social patterns. The percent of Google searches
that include the word “God,” for example, explains more than 60 percent of areas’ variation
in belief in God.
I define an area’s racially charged search rate as the percent of Google searches, from
2004-2007, that included the word “nigger” or “niggers.” I choose the most salient word to
constrain data-mining.3 I do not include data after 2007 to avoid capturing reverse causation,
with dislike for Obama causing individuals to use racially charged language on Google.
The epithet is searched for with some frequency on Google. From 2004-2007, the word
“nigger(s)” was included in roughly the same number of Google searches as words and phrases
such as “migraine(s),” “economist,” “sweater,” “Daily Show,” and “Lakers.” The most com-
mon searches that include the epithet, such as “nigger jokes” and “I hate niggers,” return
websites with derogatory material about African-Americans. From 2004-2007, the searches
were most popular in West Virginia; upstate New York; rural Illinois; eastern Ohio; southern
Mississippi; western Pennsylvania; and southern Oklahoma.
Racially charged search rate is a significant, negative predictor of Obama’s 2008 and
2012 vote shares, controlling for Kerry’s 2004 vote share. The result is robust to controls
for changes in unemployment rates; home-state candidate preference; Census division fixed
effects; demographic controls; and long-term trends in Democratic voting. The estimated
effect is somewhat larger when adding controls for an area’s Google search rates for other3Kennedy (2003, p.22) says this is “the best known of the American language’s many racial insults ...
the paradigmatic slur.”
2
terms that are moderately correlated with search rate for “nigger” but are not evidence for
racial animus. In particular, I control for search rates for “African American,” “nigga,” (the
alternate spelling used in nearly all rap songs that include the word), and profane language.
A non-racial explanation for the results might be that areas with higher racially charged
search rates became less likely, during this time period, to support Democratic candidates,
more generally. This, though, does not fit the evidence. There is not a significant relationship
between an area’s racially charged search rate and changes in either House Democratic vote
shares or measured liberalism over the same time period.
The preferred point estimates imply that, relative to the most racially tolerant areas in
the United States, prejudice cost Obama 4.2 percentage points of the national popular vote
in 2008 and 4.0 percentage points in 2012. These numbers imply that, among white voters
who would have supported a white Democratic presidential candidate in 2008 (2012), 9.1
(9.5) percent did not support a black Democratic presidential candidate.
Obama lost substantially more votes from racial animus, I argue, than he gained from
his race. Back-of-the-envelope calculations suggest Obama gained at most only about one
percentage point of the popular vote from increased African-American support. The effect
was limited by African-Americans constituting less than 13 percent of the population and
overwhelmingly supporting every Democratic candidate. Evidence from other research, as
well as some new analysis in this paper, suggest that few white voters swung in Obama’s
favor in the 2008 or 2012 general elections due to his race.4
This paper builds on and contributes to the large literature, reviewed by Huddy and
Feldman (2009), testing for the effects of racial attitudes on black candidates.5 In addition,4The effect of race on the overall probability of being elected president would also have to consider the
effects of race on primary voting and on fundraising. These questions are beyond the scope of this paper.5More recent papers compare individuals’ self-reported racial attitudes near the time of the election to
self-reported decision to support Obama and various controls (Piston, 2010; Pasek et al., 2010; Schaffner,2011; Lewis-Beck et al., 2010; Kinder and Dale-Riddle, 2012; Tesler and Sears, 2010a). They generally findsmaller effects than the effects found here, suggesting that individual surveys fail to fully capture the effectsof racial attitudes. In addition, these papers may be open to the critique of Schuman (2000) and Feldman
3

the new proxy of area-level prejudice might be useful to literatures in social economics
(Alesina et al., 2001; Alesina and La Ferrara, 2002), labor economics (Charles and Guryan,
2008), and urban economics (Cutler et al., 1999; Card et al., 2008).
More generally, this paper adds further support for a potentially large role for Google data
in the social sciences. Previous papers using the data source have tended to note correlations
between Google searches and other data (Ginsberg et al., 2009; Seifter et al., 2010; Varian
and Choi, 2010; Scheitle, 2011). This paper shows clearly that Google search query data
can do more than correlate with existing measures; on socially sensitive topics, they can give
better data and open new research on old questions. If I am correct that the Google database
contains the best evidence on such a well-examined question, that the Google database might
contain the best evidence on many important questions does not seem such a large leap.
II Google-Search Proxy For an Area’s Racial Animus
II.A. Motivation
Before discussing the proxy for racial animus, I motivate using Google data to proxy a
socially sensitive attitude. In 2007, nearly 70 percent of Americans had access to the internet
at home (CPS, 2007). More than half of searches in 2007 were performed on Google (Burns,
2007). Google searchers are somewhat more likely to be affluent, though large numbers of
all demographics use the service (Hopkins, 2008).
Aggregating millions of searches, Google search data consistently correlate strongly with
demographics of those one might most expect to perform the searches (See Table 1). Search
rate for the word “God” explains 65 percent of the variation in percent of a state’s residents
believing in God. Search rate for “gun” explains 62 percent of the variation in a state’s
and Huddy (2005), discussed in Huddy and Feldman (2009): surveys’ measures of prejudice, such as sayingthat African-Americans would be more successful if they tried harder, may capture omitted conservativeideology. The unambiguous proxy of racial animus and the fact that I control for administrative vote data inthe 2004 presidential election greatly limit this argument. This is discussed in more detail in Section IV.A.
4
gun ownership rate. These high signal-to-noise ratios hold despite some searchers typing
the words for reasons unrelated to religion or firearms and not all religious individuals or
gun owners actually including the term in a Google search (The ‘top search’ for “God” is
“God of War,” a video game. The ‘top search’ for “gun” is “Smoking Gun,” a website that
reveals sensational, crime-related documents.) If a certain group is more likely to use a term
on Google, aggregating millions of searches and dividing by total searches will give a good
proxy for that group’s area-level population.
Furthermore, evidence strongly suggests that Google elicits socially sensitive attitudes.
As mentioned in the Introduction, the conditions under which people search – online, likely
alone, and not participating in an official survey – limit concern of social censoring. The pop-
ularity of search terms related to sensitive topics further supports this use. The word “porn,”
for example, is included in more searches in the United States than the word “weather.”6
II.B. Proxy
I proxy an area’s racial animus as the percentage of its Google searches, from 2004-2007,
that included the word “nigger” or its plural.7 The racial epithet is a fairly common word
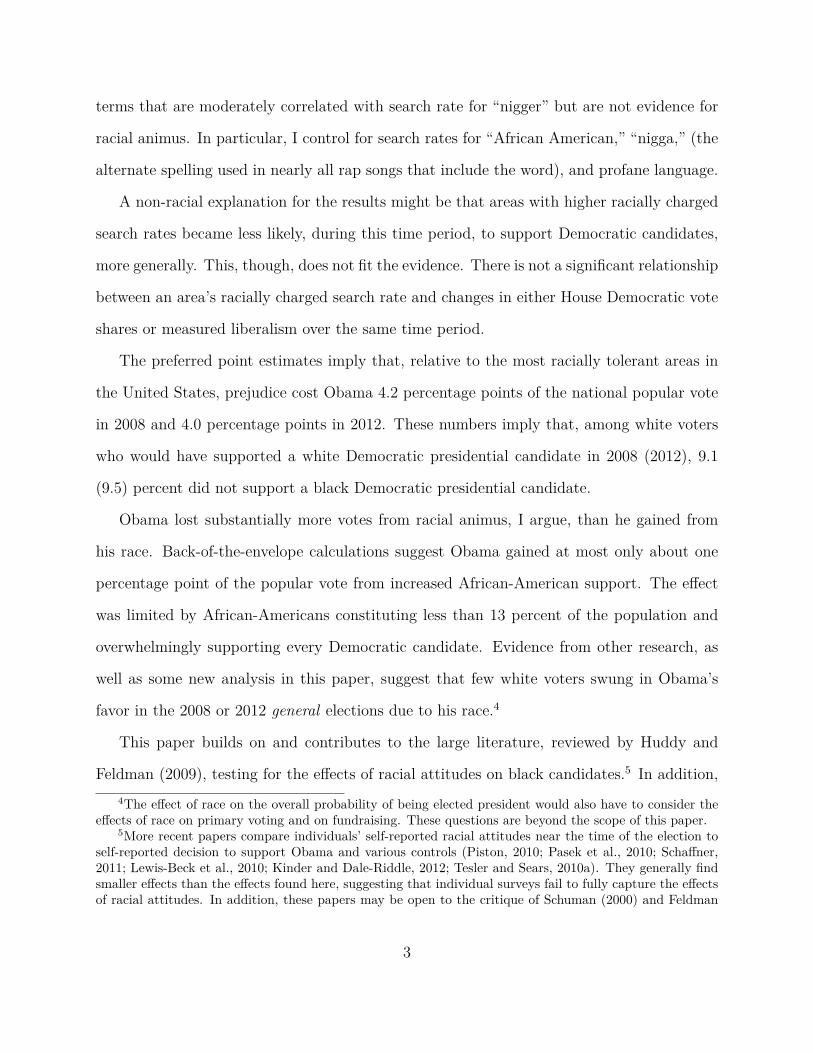
used in Google search queries: It is now included in more than 7 million searches annually.8
Figure 1 shows terms included in a similar number of searches, from 2004-2007, as the racial
epithet.9 The word “migraine” was included in about 30 percent fewer searches. The word6Only about 20 percent of Americans admit to the GSS that they have watched a pornographic movie
within the past year.7As mentioned in the Introduction, data prior to 2008 are used to avoid capturing reverse causation.
About five percent of searches including “nigger” in 2008 also included the word “Obama,” suggesting feelingstowards Obama were a factor in racially charged search in 2008. Search volume including both the epithetand “Obama” was not a large factor in 2007. It is also worth noting that search volume for the racial epithetis highly correlated through time, and any choice of dates will yield roughly similar results. For example,the correlation between 2004-2007 and 2008-present state-level racially charged search rate is 0.94.
8These are approximations calculated using AdWords. It combines searches on ‘Desktop and Laptops’and ‘Mobile devices.’
9The percentage of Google searches including the racial epithet was roughly constant from 2004 through2008. There were, though, notable spikes in the days following Hurricane Katrina and in early November2008, particularly on Election Day. The percentage of Google searches including the racial epithet dropped
5

“Lakers” and the phrase “Daily Show” were each included in about five percent more searches
than the racial epithet.10 While these words and phrases were chosen rather arbitrarily as
benchmarks, the number of searches including the racial epithet can also be compared to
the number of searches including one of the most common terms, “weather.” Search volume
including the racial epithet, from 2004-2007, was within two orders of magnitude of search
volume including “weather.”
For this to meaningfully proxy an area’s racial prejudice does not, of course, require that
every individual using the term harbors racial animus, nor that every individual harboring
racial animus will use this term on Google. The only assumption necessary is racial animus
makes one more likely to use the term. Aggregating millions of searches, areas with more
prejudice will include the epithet in a greater percentage of searches.11
Returns for common searches including the term strongly support the necessary as-
sumption. About one quarter of the searches including the epithet, from 2004-2007, also
included the word “jokes,” searches that yield derogatory entertainment based on harsh
African-American stereotypes. These same joke sites, with derogatory depictions of African-
Americans, are also among the top returns for a Google search of just the epithet or its
plural, representing about 10 percent of total searches that included the epithet.12 More
information on the searches can also be gleaned from the ‘top searches,’ the most common
after the 2008 election and has consistently been about 20 percent lower during Obama’s presidency thanprior to his presidency. An emerging literature is examining how Obama’s presidency has affected racialattitudes (DellaVigna, 2010; Valentino and Brader, 2011; Tesler, 2012; Tesler and Sears, 2010b).
10Google data are case-insensitive. So searches that includes “Lakers” also includes searches that include“lakers.”
11Using just one word or phrase, even one that can be used for different reasons, to proxy an underlyingattitude builds on the work of scholars who have conducted text analysis of newspapers. For example, Saizand Simonsohn (2008) argue that news stories about a city that include the word “corruption” can proxy acity’s corruption. And Gentzkow et al. (2011) show that, historically, Republican (Democratic) newspapersinclude significantly more mentions of Republican (Democratic) presidential candidates.
12I do not know the order of sites prior to my beginning this project, in June 2011. The ordering of sitesfor searches of just the epithet has changed slightly, from June 2011-April 2012 . For example, while jokesites were the second, third, and fourth returns for a search for “niggers” in June 2011, these sites werepassed by an Urban Dictionary discussion of the word by April 2012.
6

searches before or after searches including the word (See Table 2). Searchers are consistently
looking for entertainment featuring derogatory depictions of African-Americans. The top
hits for the top racially charged searches, in fact, are nearly all textbook examples of an-
tilocution, a majority group’s sharing stereotype-based jokes using coarse language outside
a minority group’s presence. This was determined as the first stage of prejudice in Allport’s
(1979) classic treatise.
All data are obtained using Google Trends. Google Trends reports the percentage of
an area’s searches including a word, taken from a random sample of total Google searches,
divided by a common factor such that the top area has a value of 100. In particular, an area
j’s measure of racially charged search rate is approximately equivalent to
Racially Charged Search Ratej = 100 ·
[Google searches including the word “nigger(s)”
Total Google searches
]j[
Google Searches including the word “nigger(s)”Total Google searches
]max
(1)
I obtain data for all 51 states and 196 of 210 media markets, encompassing more than 99
percent of American voters.13 I use media-market-level regressions when other data sources
are available at the media-market level and state data when such data are not available.
It should be noted that some of this data are not easily obtained. If total number
of searches, for a given area and time period, is below an unreported, but clearly high,
threshold, Google does not report the data. In Appendix B, I show what I think is the first
algorithm for obtaining data that does not cross the threshold.
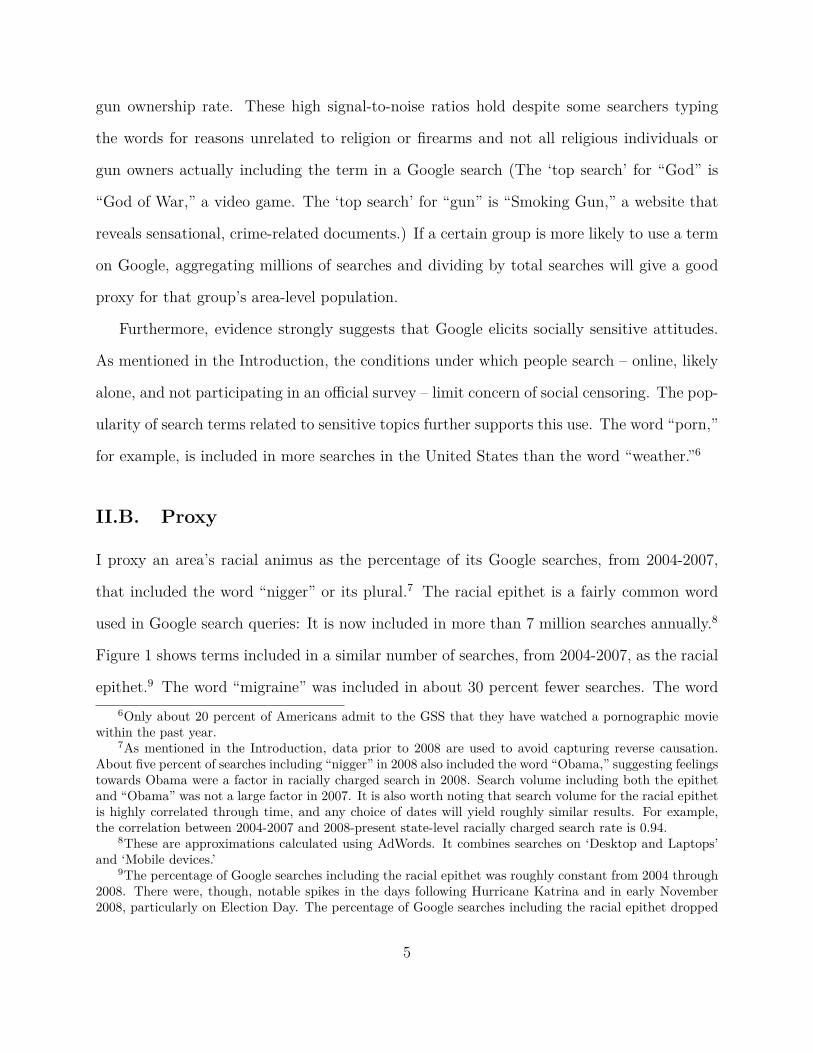
Racially charged search rates, for the 50 states and the District of Columbia, are shown
in Table A.1. Racially charged search rates for media markets are shown in Figure 2. The
search rate was highest in West Virginia; upstate New York; rural Illinois; eastern Ohio;13Google Trends says that the media market data corresponds to measures of Arbitron. I have confirmed
that they actually correspond to designated media markets, as defined by Nielsen. I match other data tothe media markets using Gentzkow and Shapiro (2008).
7

southern Mississippi; western Pennsylvania; and southern Oklahoma. The search rate was
lowest in Laredo, TX – a largely Hispanic media market; Hawaii; parts of California; Utah;
and urban Colorado.
II.C. Predictors of Racially Charged Search Rate
II.C.1. Comparisons with GSS
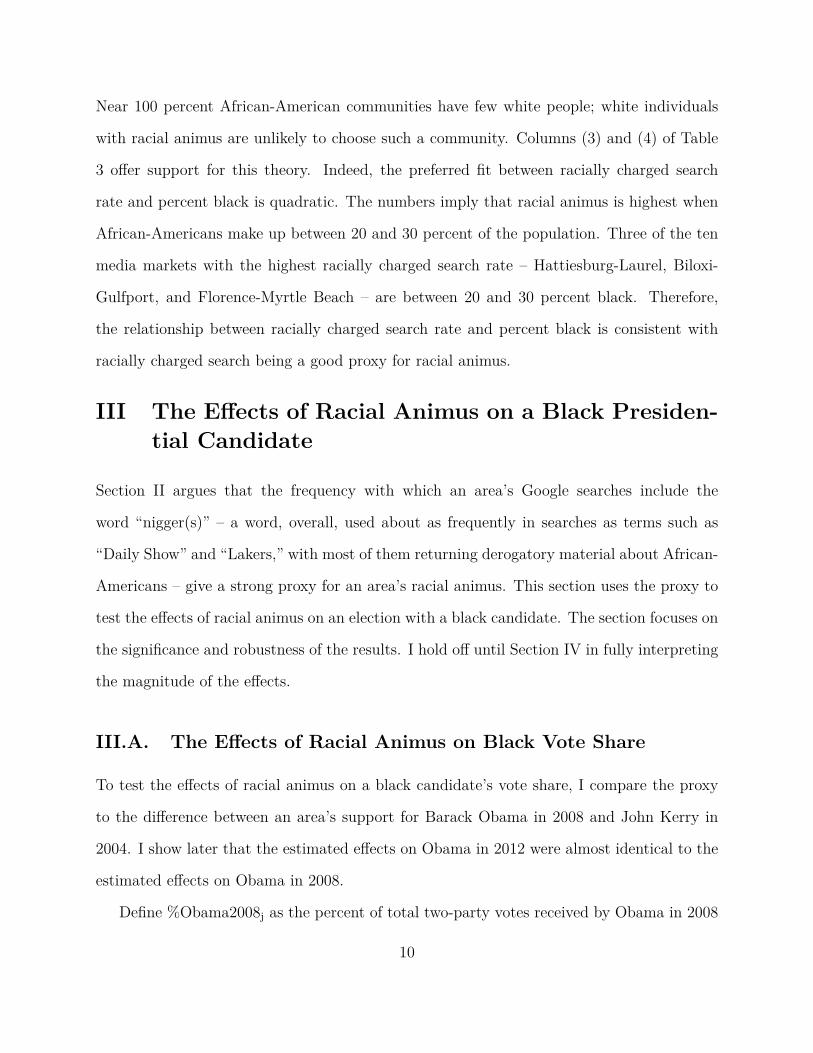
Figure 3 compares the Google-based proxy to the GSS measure of Mas and Moretti (2009).
Since the GSS only includes data for 44 states plus the District of Columbia, the figures and
regressions only include 45 observations. The Google measure has a correlation of 0.6 with
the measure of Mas and Moretti (2009), support for a law banning interracial marriage from
1990 to 2004.14
Some of the outliers are likely due to small samples for some states using GSS data. For
example, Wyoming ranks as significantly more racially prejudiced using the Mas and Moretti
(2009) proxy than the Google proxy. However, only 8 white individuals living in Wyoming
were asked this question by the GSS. (Two, or twenty-five percent, said they supported a
law banning interracial marriage.)
The GSS and Google proxies for racial prejudice noticeably differ in their relationship
with ideology. The GSS supports some popular wisdom that racial prejudice is now a
larger factor among Republicans than Democrats: The higher Kerry’s 2004 vote share in
a state, the lower the percentage of whites admitting opposition to interracial marriage.
In contrast, there is no statistically significantly correlation between Kerry 2004 vote share
and racially charged search rate, at either the state or media market level.15 One potential
reason for this discrepancy is that racial prejudice is more socially unacceptable among14The Google measure has a correlation of 0.66 with the measure of Charles and Guryan (2008), average
prejudice from 1972 to 2004. I thank the authors for providing their data.15The lack of a relationship holds controlling for percent black, as well.
8

Democrats. Thus, underreporting of prejudice in surveys will be more severe in areas with
more Democrats. And surveys, such as the GSS, will falsely find a negative correlation
between percent Democrat and racial prejudice.
II.C.2. Demographics and Use by African-Americans
Table 3 shows the demographic predictors of racially charged search rate at the media market
level. The demographic factor correlating strongest with racially charged search rate is the
percentage of the population with a bachelor’s degree. A 10 percentage point increase in
college graduates is correlated with almost a one standard deviation decrease in racially
charged search rate. Younger and more Hispanic areas are less likely to search the term.
There is a small positive correlation between racially charged search rate and percent
black. Readers may be concerned that this is due to African-Americans searching the term,
limiting the value of the proxy. This is unlikely to be a major factor: the common term used
in African-American culture is “nigga(s),” which Google considers a separate search from
the term ending in “er.” (Rahman, 2011).16 Table 4 shows the top searches for “nigga(s).”
In contrast to the top searches for the term ending in “er,” the top searches for “nigga(s)”
are references to rap songs. Table 4 also shows that, even among the five percent of searches
that include the epithet ending in “er” and also include the word “lyrics,” the ‘top searches’
are for racially charged country music songs.
The positive correlation between racially charged search rate and percent black is better
explained by racial threat, the theory that the presence of an out-group can threaten an
in-group and create racial animosity (Key Jr., 1949; Glaser, 1994; Glaser and Gilens, 1997).
Racial threat predicts a quadratic relationship between the percentage of the population that
is black and racial animus (Blalock, 1967; Taylor, 1998; Huffman and Cohen, 2004; Enos,
2010). Zero African-Americans means race is not salient and racial animus may not form.16Rap songs including the version ending in ‘a’ are roughly 45 times as common as rap songs including
the version ending in ‘er.’ – Author’s calculations based on searches at http://www.rapartists.com/lyrics/.
9
Near 100 percent African-American communities have few white people; white individuals
with racial animus are unlikely to choose such a community. Columns (3) and (4) of Table
3 offer support for this theory. Indeed, the preferred fit between racially charged search
rate and percent black is quadratic. The numbers imply that racial animus is highest when
African-Americans make up between 20 and 30 percent of the population. Three of the ten
media markets with the highest racially charged search rate – Hattiesburg-Laurel, Biloxi-
Gulfport, and Florence-Myrtle Beach – are between 20 and 30 percent black. Therefore,
the relationship between racially charged search rate and percent black is consistent with
racially charged search being a good proxy for racial animus.
III The Effects of Racial Animus on a Black Presiden-tial Candidate
Section II argues that the frequency with which an area’s Google searches include the
word “nigger(s)” – a word, overall, used about as frequently in searches as terms such as
“Daily Show” and “Lakers,” with most of them returning derogatory material about African-
Americans – give a strong proxy for an area’s racial animus. This section uses the proxy to
test the effects of racial animus on an election with a black candidate. The section focuses on
the significance and robustness of the results. I hold off until Section IV in fully interpreting
the magnitude of the effects.
III.A. The Effects of Racial Animus on Black Vote Share
To test the effects of racial animus on a black candidate’s vote share, I compare the proxy
to the difference between an area’s support for Barack Obama in 2008 and John Kerry in
2004. I show later that the estimated effects on Obama in 2012 were almost identical to the
estimated effects on Obama in 2008.
Define %Obama2008j as the percent of total two-party votes received by Obama in 2008
10
and %Kerry2004j as the percent of total two-party votes received by Kerry in 2004. In other
words, %Obama2008j is an area’s total votes for Obama divided by its total votes for Obama
or John McCain. %Kerry2004j is an area’s total votes for Kerry divided by its total votes
for Kerry or George W. Bush. Then (%Obama2008−%Kerry2004)j is meant to capture an
area’s relative preference for a black compared to a white candidate.
The idea is that the different races of the Democratic candidates was a major difference
between the 2004 and 2008 presidential races. The 2004 and 2008 presidential elections were
similar in terms of perceived candidate ideology. In 2004, about 44 percent of Americans
viewed John Kerry as liberal or extremely liberal. In 2008, about 43 percent viewed Barack
Obama as liberal or extremely liberal.17 There were slightly larger differences in perceived
ideology of the Republican candidates. Roughly 59 percent viewed George W. Bush as
conservative or very conservative in 2004; 46 percent viewed John McCain as conservative or
very conservative in 2008. Neither Kerry nor Obama came from a Southern state, important
as Southern states have been shown to prefer Southern Democratic candidates (Campbell,
1992). One major difference between the 2004 and 2008 elections was the popularity of
the incumbent Republican president. In 2004, George W. Bush ran as a fairly popular
incumbent. In 2008, no incumbent was on the ballot, and the Republican president had an
historically low approval rating. We would expect a countrywide positive shock to Obama
relative to Kerry.18
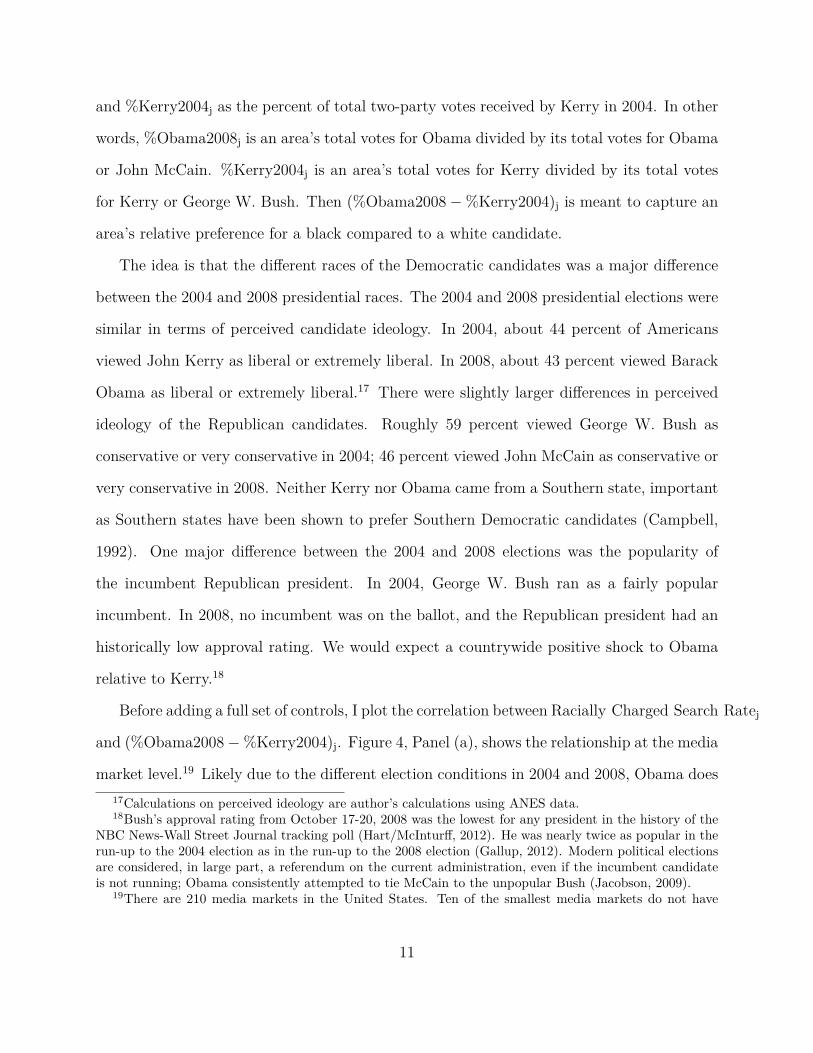
Before adding a full set of controls, I plot the correlation between Racially Charged Search Ratej
and (%Obama2008−%Kerry2004)j. Figure 4, Panel (a), shows the relationship at the media
market level.19 Likely due to the different election conditions in 2004 and 2008, Obama does17Calculations on perceived ideology are author’s calculations using ANES data.18Bush’s approval rating from October 17-20, 2008 was the lowest for any president in the history of the
NBC News-Wall Street Journal tracking poll (Hart/McInturff, 2012). He was nearly twice as popular in therun-up to the 2004 election as in the run-up to the 2008 election (Gallup, 2012). Modern political electionsare considered, in large part, a referendum on the current administration, even if the incumbent candidateis not running; Obama consistently attempted to tie McCain to the unpopular Bush (Jacobson, 2009).
19There are 210 media markets in the United States. Ten of the smallest media markets do not have
11
indeed perform better than Kerry country-wide. (See Table 5 for a set of summary statis-
tics, including Obama and Kerry support.) However, Obama loses votes in media markets
with higher racially charged search rates. The relationship is highly statistically significant
(t = −7.36), with the Google proxy explaining a substantial percentage of the variation in
change in Democratic presidential support (R2 = 0.24).
One non-racial explanation for the correlation between Racially Charged Search Ratej
and (%Obama2008−%Kerry2004)j might be that areas with high racially charged search
rates were trending Republican, from 2004 to 2008, for reasons other than the race of the
candidates. Data using other measures of changing liberalism offer evidence against this
interpretation.
Panel (a) of Figure 5 shows no relationship between states’ racially charged search and
changes in states’ liberalism, from 2004 to 2008, as measured by Berry et al. (1998). Figure
5, panel (b), shows a small, and not significant, negative correlation between media markets’
racially charged search and change in Democratic support in House races from 2004 to 2008.
(In results shown later, I find that racial animus affected turnout, likely explaining the
small relationship with House voting.) Using exit poll data in 2004 and 2008, there is no
relationship between racially charged search rate and change in black self-reported support
for Obama relative to Kerry (R2 = 0.00); the relationship is driven entirely by white voters
(R2 = 0.28).
Furthermore, if the correlation were due to changing partisan preferences correlated
with racially charged search rate, other Democratic presidential candidates would have
large enough search volume for “weather” and thus are not included. Two additional small media markets(Juneau and Twin Falls) search “weather” much more frequently than other media markets. Since they oftenscore 100 on both “weather” and “weather” or the racial epithet, I cannot pick up their racial animus fromthe algorithm. Alaska changed its vote reporting boundaries from 2004 to 2008. I was unable to matchthe media market data with the boundaries for Alaskan media markets. I do not include data from Alaska.Overall, the 196 media markets included represent 99.3 percent of voters in the 2004 election. All of thesummary statistics in Table 5 are virtually identical to summary statistics over the entire population of theUnited States.
12
been equally punished in areas with high racially charged search rates around this time
period. However, I examine data from SurveyUSA, first used by Donovan (2010), on hy-
pothetical presidential match-ups. I can test whether, matched up against the same Re-
publican candidate, Obama does worse than other Democratic candidates, among white
voters, in areas with higher racially charged search. In February 2008, hypothetical match-
ups were performed between Hillary Clinton and McCain and Obama and McCain in 50
states. Among white voters, Obama receives significantly smaller vote shares than Clinton
in states with higher racially charged search rate (t = −9.05; R2 = 0.49). In late Septem-
ber and early October 2007, in 17 states, hypothetical match-ups were performed between
John Edwards and three Republican candidates and Obama and the same three Republi-
can candidates. Among white voters, for all three match-ups, Obama receives significantly
smaller vote shares than Edwards in states with higher racially charged search rate (Fred
Thompson: t = −3.49, R2 = 0.45; Rudy Guiliani: t = −2.20, R2 = 0.24; Mitt Romney:
t = −3.48, R2 = 0.45).
Reported voting data are never ideal. However, the results of the alternate match-ups,
combined with the race-specific exit polls results, combined with the House voting results,
strongly suggest that decreased support for Obama in areas with high racially charged search
rate is caused by white voters supporting Obama less than they would a white Democrat.
I now return to administrative vote data at the media market level and examine the
relationship more systematically using econometric analysis. I add a number of controls for
other potential factors influencing voting. I do not find evidence for an omitted variable
driving the negative correlation between a media market’s racially charged search rate and
its preference for Obama compared to Kerry. The empirical specification is
(%Obama2008−%Kerry2004)j = β0 + β1 · Racially Charged Search Ratej + Xjφ1 + µj (2)
13
where Xj are area-level controls that might otherwise influence change in support for the
Democratic presidential candidate from 2004 to 2008; β0 is a country-wide shock to Demo-
cratic popularity in 2008; and µj is noise.
Racially Charged Search Ratej is as described in Equation 1, normalized to its z-score. Thus,
the coefficient β1 measures the effect of a one standard deviation increase in
Racially Charged Search Ratej on Obama’s vote share. All regressions predicting voting be-
havior, unless otherwise noted, are weighted by 2004 total two-party votes. All standard
errors are clustered at the state level.20
The results are shown in Table 6. All columns include two controls known to consistently
influence Presidential vote choice (Campbell, 1992). I include Home Statej, a variable that
takes the value 1 for states Illinois and Texas; -1 for states Massachusetts and Arizona; 0
otherwise.21 I also include proxies for economic performance in the run-up to both the 2004
and 2008 elections: the unemployment rates in 2003, 2004, 2007, and 2008.
Column (1), including just the standard set of controls, shows that a one standard devia-
tion increase in a media market’s racially charged search rate is associated with 1.5 percentage
points fewer Obama votes. Column (2) adds controls for nine Census divisions. Any omit-
ted variable is likely to be correlated with Census division. Thus, if omitted variable bias
were driving the results, the coefficient should drop substantially upon adding these controls.
The coefficient, instead, remains the same. Column (3) adds a set of demographic controls:
percent Hispanic; black; with Bachelor’s degree; aged 18-34; 65 or older; veteran; and gun
magazine subscriber; as well as changes in percent black and percent Hispanic. Since there
is some measurement error in the Google-based proxy of racial animus, one would expect the
coefficient to move towards zero as these controls are added. It does. However, the change is20For media markets that overlap, I code the media market as being in the state in which the largest
number of people live.21Since I run the regressions at the media market level and some media markets overlap states, I aggregate
Home Statej from the county level, weighting by 2004 turnout. For the Chicago media market, as an example,Home State = 0.92, as some counties in the media market are in Indiana.
14

not particularly large (less than a 10 percent decline in magnitude) considering the number
of controls. The stability of the coefficient to a rich set of observable variables offers strong
evidence for a causal interpretation (Altonji et al., 2005).
III.A.1. Adding Google Controls to Reduce Measurement Error
There is not a one-to-one correspondence between an individual’s propensity to type the
racial epithet into Google and his or her racial animus. Individuals may type the epithet for
a variety of reasons other than animus. Individuals harboring racial animus may express it
in different ways – either on different search engines or offline.
Any motivations of searches of the word unrelated to animus that do not differ at the
area level will not create any bias in the area-level proxy. However, alternative motivations
that differ at the area level will lead to measurement error in the area-level proxy. Classical
area-level measurement error will cause attenuation bias in the estimates in Columns (1)-
(3) of Table 6. In Columns (4)-(6), I reproduce the results from Columns (1)-(3) but add
controls for an area’s search rates for other words correlated with the search term unlikely
to express racial animus. This should reduce measurement error in the proxy.
Row (8) of Table 2 shows that some searchers are looking for information on the word. I
add a control for “African American(s)” search rate to proxy an area’s interest in information
related to African-Americans. Since a small percentage of searches for the word ending in
“er” are looking for particular cultural references, I add a control for “nigga(s)” search rate.
Finally, as some areas may be more prone to use profane language on Google, I add a control
for an area’s search rate for profane language.22 Columns (4)-(6) show that the coefficient
is more negative in each specification when adding the Google controls.22Following my general strategy of selecting the most salient word if possible, I use the word “fuck.”
15

III.A.2. The Cost of Racial Animus on an Incumbent Black Presidential Can-didate: Evidence from 2012
Previously, it was found that racially charged search rate significantly predicts Barack
Obama’s 2008 vote share, controlling for John Kerry’s 2004 control. The robustness of
the result is evidence for a causal effect of racial animus on Obama.
Was there a similar effect of racial animus on Obama in his second run for president, in
2012? Figure 4, Panel (b), shows graphical evidence that the answer is yes. It compares
an area’s racially charged search rate to the change in Obama’s two-party vote share, from
2008 to 2012. If racial animus played a bigger (smaller) role in 2012 than in 2008, we would
expect the relationship to be negative (positive). Instead, racially charged search rate shows
no correlation with the change in Obama’s 2008 and 2012 vote shares. This suggests race
played a similar role in 2008 and 2012.
Note, too, that the result in Panel (b), the null relationship between racially charged
search rate and change in Obama support, from 2008 to 2012, further supports the causal
explanation of Panel (a), the negative relationship between racially charged search rate and
change in Kerry 2004 to Obama 2008 support. In particular, the null relationship argues
against two alternative explanations. If the negative correlation between racially charged
search rate and change in Democratic support from 2004 to 2008 were picking up a trend
away from Democratic support in places with high racially charged search rates, one would
expect this trend to continue and there to again be a negative correlation in Panel (b).
Another, non-causal explanation for the result in Panel (a) is that, by chance, racially
charged search rate correlated with random noise in 2008 vote shares. Bias towards finding,
and reporting, significant results led to this relationship being found. If this were the case,
there should be regression to the mean and a positive correlation in Panel (b). The lack of
a significant relationship, instead, adds additional evidence that the correlation in Panel (a)
is due to areas with high racially charged search rate punishing Obama.
16

Table 7 examines 2012 data more systematically. Panel (a) reproduces the six regression
results from Table 6, presenting the identical coefficient on racially charged search rate as
shown in the corresponding column in Table 6. Panels (b) and (c) of Table 7 introduce differ-
ent dependent variables. In Panel (b), the dependent variable is %Obama2012−%Obama2008.
This, thus, expands the exercise performed in Figure 4, Panel (b). In Panel (c) of Table 7,
the dependent variable is %Obama2012−%Kerry2004. Comparing coefficients in Panel (c)
and Panel (a), thus, can be thought of as comparing the size of the effect of racial prejudice
in 2008 and 2012.
The regressions in Panel (b) and Panel (c) use the same demographic and Google controls
as in Panel (a). However, I use different standard controls to reflect the different election
conditions. The standard controls for Panel (b) are: a dummy variable Home State that
takes the value 1 for Arizona and -1 for Massachusetts; and the unemployment rates in 2007,
2008, and 2011. In Panel (c), the standard controls are a dummy variable Home State that
takes the value 1 for Illinois and Texas and -2 for Massachusetts; and the unemployment
rates in 2003, 2004, and 2011.
Panel (b) of Table 7 shows that, upon adding the controls, there still is not a significant
relationship between racially charged search rate and change in Obama support, from 2008
to 2012. This confirms the robustness of the null result of Figure 4, Panel (b). The null
result in Panel (b) suggests that racial prejudice played a similar role in 2008 and 2012.
Indeed, the coefficients in Panel (c) are roughly similar to the corresponding coefficients in
Panel (a).
To summarize, racially charged search rate is a similar predictor of Obama’s performance
in both 2008 and 2012. In addition, the flat relationship between racially charged search
rate and change in Democratic support, from 2008 to 2012, further supports a causal in-
terpretation of the negative relationship between racially charged search rate and change in
Democratic support, from 2004 to 2008.
17

III.A.3. Robustness Checks
Table 8 presents a number of robustness checks. Obama received about 20 percentage points
more of the two-party vote share in Hawaii than Kerry did. Obama was born in Hawaii.
Excluding Hawaii, though, changes the coefficient towards zero by less than 5 percent. The
coefficient is of a similar magnitude including changes in House Democratic support from
2004 to 2008 and swing state status.23
The main specification requires a somewhat restrictive relationship between Obama and
Kerry’s vote share. This, though, is not driving the result. The results are of similar mag-
nitudes instead using %Obamaj as the dependent variable and including %Kerry2004j as an
independent variable. And they are of similar magnitudes using %Obamaj as the depen-
dent variable and including a 4th-order polynomial for %Kerryj as independent variables.
Including this polynomial allows for liberal areas to differ from conservative areas in their
relative support for Obama and Kerry. The fact that the coefficient on racially charged
search rate is unchanged (perhaps not surprising since racially charged search rate is not sig-
nificantly correlated with liberalness and voters perceived the candidates as having similar
ideologies) offers additional evidence that racial attitudes, not ideology, explains the results.
The coefficients are also very similar including trends in presidential Democratic support.
III.B. The Effects of Racial Animus on Turnout in a Biracial Elec-tion
The robust cost of racial animus on Obama’s vote share is the main result of the paper. I
can also use the area-level proxy for racial animus to test the effects of racial attitudes on
turnout. This both helps us understand the mechanism through which racial prejudice hurt
Obama and will also prove useful in interpreting the size of the effects, which I do in the
next section.23I do not include these controls in the main specifications as they could be affected by Obama support
and thus not exogenous.
18
The effect of racial animus on turnout is theoretically ambiguous. The effect of racial
prejudice on Obama’s vote share could be driven by any of three reasons, each with different
implications for turnout: Individuals who would have voted for a white Democrat instead
stayed home (decreasing turnout); individuals who would have voted for a white Democrat
instead voted for the Republican (not affecting turnout); individuals who would have stayed
home instead voted for the Republican (increasing turnout).
I first use the area-level proxy of racial animus to test the average effect of prejudice on
turnout. I regress
(ln(Turnout2008)− ln(Turnout2004))j = δ0 + δ1 · Racially Charged Search Ratej + Zjφ2 + ψj
(3)
where (ln(Turnout2008)− ln(Turnout2004))j is the change in the natural log of the total
Democratic and Republican votes from 2004 to 2008; Zj is a set of controls for other fac-
tors that might have changed turnout and Racially Charged Search Ratej is as described in
Equation 1, normalized to its z-score.
The results are shown in Columns (1) through (3) of Table 9. In all specifications,
I include percent black and change in the natural log of an area’s population from 2000
to 2010. Column (2) adds Census fixed effects. Column (3) adds the same demographic
controls used in the vote share regressions in Table 6. In none of the specifications is there a
significant relationship between racially charged search and turnout. I can always reject that
a one standard deviation increase in racially charged search rate – which lowers Obama’s
vote share by 1.5 to 2 percentage points – changes turnout by 1 percent in either direction.24
24Washington (2006) finds a 2-3 percentage point increase in turnout in biracial Senate, House, andGubernatorial elections. Perhaps these results can be reconciled as follows: Obama won a close primary.An average black general election candidate would be expected to have won his or her primary by a largermargin than Obama won his by. We would thus expect that the average black candidate would have facedlower racial animus in his or her primary than Obama did in a country-wide Democratic primary. Thus,racial animus among Democrats is lower for the average black candidate in Washington’s (2006) sample than
19
The null effect of racial attitudes on turnout is consistent with animus not affecting
any individuals’ decision to turnout (but convincing many who would have supported a
Democrat to instead vote for McCain). It is also consistent with racial prejudice driving an
equal number of individuals who would have voted for a white Democrat to stay home as it
convinced individuals who would have stayed home to vote for McCain.
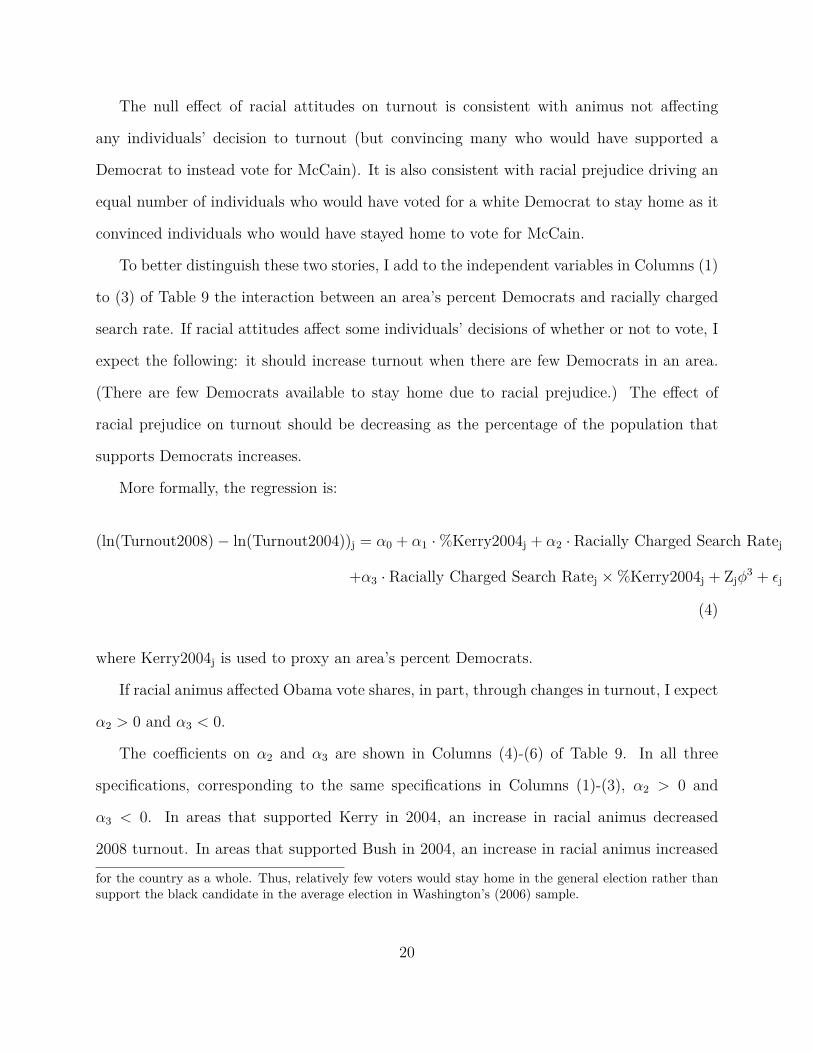
To better distinguish these two stories, I add to the independent variables in Columns (1)
to (3) of Table 9 the interaction between an area’s percent Democrats and racially charged
search rate. If racial attitudes affect some individuals’ decisions of whether or not to vote, I
expect the following: it should increase turnout when there are few Democrats in an area.
(There are few Democrats available to stay home due to racial prejudice.) The effect of
racial prejudice on turnout should be decreasing as the percentage of the population that
supports Democrats increases.
More formally, the regression is:
(ln(Turnout2008)− ln(Turnout2004))j = α0 + α1 ·%Kerry2004j + α2 · Racially Charged Search Ratej
+α3 · Racially Charged Search Ratej ×%Kerry2004j + Zjφ3 + εj
(4)
where Kerry2004j is used to proxy an area’s percent Democrats.
If racial animus affected Obama vote shares, in part, through changes in turnout, I expect
α2 > 0 and α3 < 0.
The coefficients on α2 and α3 are shown in Columns (4)-(6) of Table 9. In all three
specifications, corresponding to the same specifications in Columns (1)-(3), α2 > 0 and
α3 < 0. In areas that supported Kerry in 2004, an increase in racial animus decreased
2008 turnout. In areas that supported Bush in 2004, an increase in racial animus increased
for the country as a whole. Thus, relatively few voters would stay home in the general election rather thansupport the black candidate in the average election in Washington’s (2006) sample.
20

2008 turnout. The coefficients tend to be marginally significant, and the standard errors are
always too large to say anything precise.
In results not shown, I reproduce the results replacing ln(Turnout2012)− ln(Turnout2004),
as the dependent variable. County-level population data near or after the 2012 election are
not as-of-yet available, complicating interpretation. However, preliminary results are simi-
lar, with no relationship between racially charged search rate and turnout, on average, but
a positive (negative) relationship in highly Republican (Democratic) areas.
In sum, the evidence on the effects of racial animus on turnout is as follows: Some
Democrats stayed home rather than vote for Obama due to his race; a similar number
of individuals who would not have otherwise voted turned out for the Republican due to
Obama’s race. There is not enough statistical power, though, to determine this number.
IV Interpretation
Section III compares Google racially charged search rate to changing voting patterns from
the 2004 all-white presidential election to the 2008 and 2012 biracial presidential elections
and finds that racial animus played a significant role in the 2008 and 2012 elections. Section
III.A. shows the main result of this paper: racially charged search rate is a robust negative
predictor of Obama’s vote share. Section III.B. shows that higher racially charged search
rate predicts increased turnout in Republican parts of the country; decreased turnout in
Democratic parts of the country; and, on average, no change in turnout. This section aims
to give some intuition to the magnitude of the effects of racial attitudes on presidential
voting.
How many additional votes would Obama have received if the whole country had the
racial attitudes of the most tolerant areas? Media markets’ mean racially charged search
rate is 2.34 standard deviations higher than the minimum racially charged search rate. Table
21
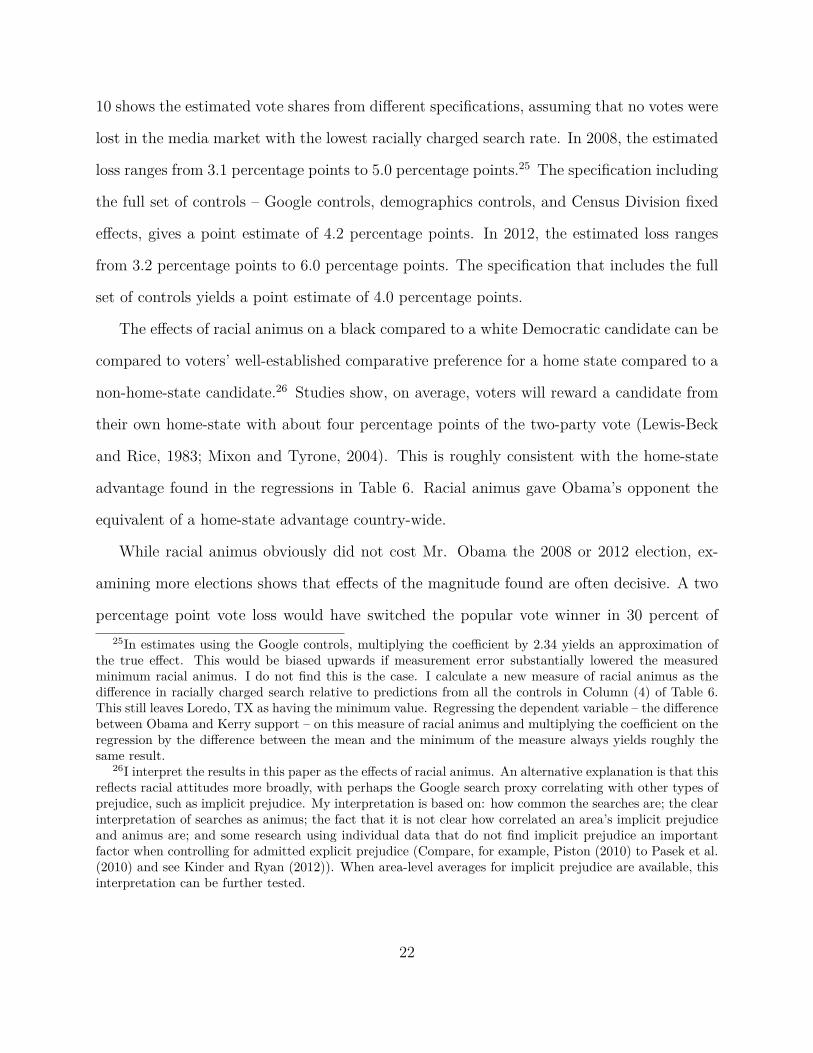
10 shows the estimated vote shares from different specifications, assuming that no votes were
lost in the media market with the lowest racially charged search rate. In 2008, the estimated
loss ranges from 3.1 percentage points to 5.0 percentage points.25 The specification including
the full set of controls – Google controls, demographics controls, and Census Division fixed
effects, gives a point estimate of 4.2 percentage points. In 2012, the estimated loss ranges
from 3.2 percentage points to 6.0 percentage points. The specification that includes the full
set of controls yields a point estimate of 4.0 percentage points.
The effects of racial animus on a black compared to a white Democratic candidate can be
compared to voters’ well-established comparative preference for a home state compared to a
non-home-state candidate.26 Studies show, on average, voters will reward a candidate from
their own home-state with about four percentage points of the two-party vote (Lewis-Beck
and Rice, 1983; Mixon and Tyrone, 2004). This is roughly consistent with the home-state
advantage found in the regressions in Table 6. Racial animus gave Obama’s opponent the
equivalent of a home-state advantage country-wide.
While racial animus obviously did not cost Mr. Obama the 2008 or 2012 election, ex-
amining more elections shows that effects of the magnitude found are often decisive. A two
percentage point vote loss would have switched the popular vote winner in 30 percent of25In estimates using the Google controls, multiplying the coefficient by 2.34 yields an approximation of
the true effect. This would be biased upwards if measurement error substantially lowered the measuredminimum racial animus. I do not find this is the case. I calculate a new measure of racial animus as thedifference in racially charged search relative to predictions from all the controls in Column (4) of Table 6.This still leaves Loredo, TX as having the minimum value. Regressing the dependent variable – the differencebetween Obama and Kerry support – on this measure of racial animus and multiplying the coefficient on theregression by the difference between the mean and the minimum of the measure always yields roughly thesame result.
26I interpret the results in this paper as the effects of racial animus. An alternative explanation is that thisreflects racial attitudes more broadly, with perhaps the Google search proxy correlating with other types ofprejudice, such as implicit prejudice. My interpretation is based on: how common the searches are; the clearinterpretation of searches as animus; the fact that it is not clear how correlated an area’s implicit prejudiceand animus are; and some research using individual data that do not find implicit prejudice an importantfactor when controlling for admitted explicit prejudice (Compare, for example, Piston (2010) to Pasek et al.(2010) and see Kinder and Ryan (2012)). When area-level averages for implicit prejudice are available, thisinterpretation can be further tested.
22

post-War presidential elections. A four percentage point loss would have changed more than
50 percent of such elections.
IV.A. Comparison with Other Methodologies
The effect of racial prejudice found by the methodology of this paper can also be compared to
estimates obtained using different data sources and methodology. I find that the effects using
Google data are larger than effects found using other methodologies. The specification used in
this paper is slightly different from the one used in Mas and Moretti (2009). Mas and Moretti
(2009) predict a county’s Democratic vote share in 2004 and 2008 House and presidential
elections from a set of dummy variables (Year=2008; Election Type=presidential; Election
Type=presidential & Year=2008) and an interaction between a state’s GSS racial attitudes
and the dummy variables. This specification makes it difficult to pick up the effects of racial
attitudes on voting for Obama since House elections are high-variance (sometimes, one of the
two major parties does not field a candidate, dramatically shifting the Democratic proportion
of vote share). A large swing in House voting can falsely suggest a large trend in Democratic
voting.27
Nonetheless, I do confirm that effects using the GSS measures and the specification of
this paper yields a smaller effect and are less robust. Table 10 compares the estimates
obtained using the Google measure and the specification of this paper to estimates using
GSS measures and the specification of this paper. Using either the measure from Mas and27For example, in Mas and Moretti’s (2009) Figure 4, the authors compare the difference between the
change in Obama and Kerry’s vote shares and the change in House voting to their measure of racial prejudice.The difficulty with this comparison is that House elections in which one party does not field a candidatewill create enormous noise in the voting metric, swamping any other changes. In 2004 in Vermont, BernieSanders won as a highly popular left-wing independent. In 2008 in Vermont, Democrat Peter Welch wonwith no Republican challenger. Thus, there was a huge gain in Vermont Democratic House support from2004 to 2008. And the difference between the change in Democratic presidential support and change inDemocratic House support, from 2004 to 2008 in Vermont, is -70 percentage points. Adding this kind ofnoise to the Obama and Kerry difference, and having only 45 state-level GSS observations, it is unlikelythat, even if the GSS measure of racial attitudes did predict opposition to Obama, this methodology couldpick it up.
23

Moretti (2009) or Charles and Guryan (2008) always yields smaller estimates of the country-
wide effect. The effect picked up using the GSS data is largely due to a few Southern states
which measure high on racial prejudice and also voted for Obama significantly less than they
voted for Kerry. In contrast to regressions using the Google measure, where the effect is
robust to including Census division fixed effects, regressions using the GSS measures tend
to lose significance when including the Census division fixed effects.28 Furthermore, I find
that the preferred fit with the GSS measures is quadratic. The fit suggests no effect in just
about all parts of the country but an effect in a few southern states. The GSS is ineffective
at capturing racial prejudice in all but a few Southern states. Google is also advantageous
relative to the GSS in testing for causality: observations from large samples from 196 media
markets allows for a rich set of controls and robustness checks, as shown in Tables 6, 7 and
8; this is not possible with 45 state-level observations.
The final row of Table 10 includes the estimates from Piston (2010), Schaffner (2011),
and Pasek et al. (2010).29 Each uses individual data and obtains a smaller preferred point
estimate. This suggests individual surveys underestimate the true effect of racial attitudes.
There are additional advantages to the empirical specification of this paper relative to
studies using individual-level surveys in testing for causality, besides the likely improved
measure of racial animus. Individual survey studies rely exclusively on self-reported voting;
vote misreporting may be a substantial issue with survey data (Atkeson, 1999; Wright, 1993;
Ansolabehere and Hersh, 2011). Further, their measures of racial attitudes are taken from28Highton (2011) located an alternative data source for racial attitudes from The Pew Research Center
Values Study. Pew has asked for 20 years individuals whether they approve of blacks dating whites. Ag-gregating 20 years of data among whites, Highton (2011) constructs a measure available for 51 states andtests the effects of racial animus on voting in the Obama election. While standard errors are still large andthe point estimate is always smaller than using Google data, the Pew data source does lead to more robustestimates than the GSS data source, in part due to the six additional observations.
29A recent paper by Kam and Kinder (2012) finds that ethnocentrism was a factor against Obama.Tesler and Sears (2010a) also finds an important role of anti-Muslim sentiment in evaluating Obama. UsingGoogle data (such as searches for “Obama Muslim” or “Obama birth certificate”) to further investigate thisphenomenon is a promising area for future research.
24

near the election. They thus could potentially pick up reverse causation. Finally, studies
testing the effects of racial attitudes on political attitudes have been criticized for omitted
variable bias from unmeasured conservative ideology (Schuman, 2000; Feldman and Huddy,
2005; Huddy and Feldman, 2009). This is both because the measures of prejudice, such as
whether African-Americans should overcome prejudice “without any special favors,” might
be connected to conservative ideology and self-reported vote choices in previous elections are
even more unreliable than self-reported vote choices in current elections. Thus, individual-
level, non-panel studies can only control for self-reported ideology and political beliefs. The
empirical specification of this paper, using the unambiguous measure of racial animus and,
most importantly, controlling for administrative vote data from a similar election four years
earlier, does not seem open to this critique.
IV.B. Pro-Black Effect
I find that, relative to the attitudes of the most racially tolerant area, racial animus cost
Obama between 3 to 5 percentage points of the national popular vote. Obama, though, also
gained some votes due to his race. Was this factor comparatively large?
A ballpark estimate from increased support from African-Americans can be obtained
from exit poll data. In 2004, 60.0 percent of African-Americans reported turning out, 89.0
percent of whom reported voting for John Kerry. In 2008, 64.7 percent of African-Americans
reported turning out, 96.2 percent of whom reported supporting Barack Obama. Assuming
these estimates are correct and, with a white Democrat, black support would have been the
same as in 2004, increased African-American support added about 1.2 percentage points to
Obama’s national popular vote total in 2008.30 Reported turnout data are not yet available30Assume 65 percent of whites turned out in 2008 and 47.6 percent of white voters supported
Obama. If African-Americans had voted as they did in 2004, Obama would have instead received0.126×0.6×0.89+0.874×0.65×0.476
0.126×0.65+0.874×0.65 = 52.5 percent of the two-party vote. This is likely an upper-bound, as anyDemocrat likely would have seen some improvement in black support due to Bush’s high disapproval ratingamong African-Americans.
25

for 2012, though exit polls suggest African-Americans turned out at similar rates in 2012 as
they did in 2008. The pro-black effect was limited by African-Americans constituting only
12.6 percent of Americans and overwhelmingly supporting any Democratic candidate.
A variety of evidence suggest that few white voters swung, in the general election, for
Obama due to his race. Only one percent of whites said that race made them much more
likely to support Obama in 2008 (Fretland, 2008). In exit polls, 3.4 percent of whites did re-
port both voting for Obama and that race was an important factor in their decision. But the
overwhelming majority of these voters were liberal, repeat voters likely to have voted for a
comparable white Democratic presidential candidate.31 Furthermore, Piston (2010) finds no
statistically significant relationship, among white voters, between pro-black sentiment and
Obama support, when controlling for ideology. Although social scientists strongly suspect
that individuals may underreport racial animus, there is little reason to suspect underre-
porting of pro-black sentiment. Finally, in unreported results, I add an area’s search rate for
“civil rights” to the regressions in Table 6. The coefficient on Racially Charged Search Rate
is never meaningfully changed, and the coefficient on Civil Rights Search Rate is never sta-
tistically significant.
IV.C. Estimated Cost of Race Compared to Actual Performance
This paper suggests a far larger vote loss from racial animus than vote gains from race. This
means that Obama would have gotten significantly more votes if race were not a consid-
eration. Is this plausible? Forecasting how many votes a president should receive, based
on economic and political fundamentals, lead to a large variance of estimates. In addition,
these forecasts tend not to include candidate charisma, or candidate quality more generally,
which may be important (Levitt, 1994; Benjamin and Shapiro, 2009). And such forecasts31Among the 3.4 percent, 87 percent both reported voting for the Democratic candidate in the House
race and disapproving of Bush. Among this subset, only 25 percent reported voting for the first time. And,among such first-time voters, 60 percent were 18-24, possibly ineligible to vote in any prior elections.
26

do not adjust for changing composition of the electorate (Judis and Teixeira, 2004). The
highly Democratic Hispanic population has grown rapidly, consistently rising from 2 percent
of the electorate in 1992 to 10 percent in 2008. This makes every modern election cycle
meaningfully more favorable towards Democrats than the previous one. In 2012, had the
racial composition of the electorate been the same as it was in 2008, Obama would have lost
both Ohio and Florida.
Of the nine 2008 forecasts in Campbell (2008), three predicted that the Democratic presi-
dential candidate candidate would perform at least two percentage points better than Obama
did (Lewis-Beck and Tien, 2008; Lockerbie, 2008; Holbrook, 2008). Of the nine 2012 forecasts
in Campbell (2012), only Lockerbie (2012) showed a substantial Obama underperformance
(1.8 percentage points).
Jackman and Vavreck (2011), using polling data with hypothetical 2008 match-ups, find
an “average” white Democrat would have received about 3 percentage points more votes
than Obama did. Table 5 shows that House Democratic candidates received a 2.3 percentage
point larger gain in 2008 relative to 2004 than Obama received relative to Kerry; the results
in Section III.B. suggest the House Democratic swing would have been even larger absent
turnout effects due to Obama’s race.
IV.D. White Voters Swung by Racial Animus
As another way of giving intuition for the magnitude of the effect, I combine the vote share
results in Section III.A. with the turnout results in Section III.B.. I can then estimate the
percent of white voters who would have voted for a white Democrat in 2008 but did not
support a black one.
The percent motivated by animus is the number of votes lost due to animus divided by
the total number of whites who would have supported a Democrat absent prejudice. Section
III.B. finds that turnout was unaffected, on average, by prejudice. Thus, the denominator
27
(the percent of whites who would have supported a Democrat, absent prejudice) is the
number of whites who supported Obama plus the number of votes lost due to prejudice.
Exit polls suggest 41.7 percent of 2008 voters and 38.1 percent of 2012 voters were white
Obama supporters. The percent motivated by animus is estimated between 3.144.8 = 6.9 and
546.7 = 10.7 percent in the 2008 election and between 3.2
41.3 = 7.7 and 6.044.1 = 13.6 percent in
the 2012 election. Regressions using the full set of controls imply that, among whites who
would have otherwise supported a white Democratic presidential candidate, 9.1 percent in
2008 and 9.5 percent in 2012 did not support a black Democratic presidential candidate.
How do these numbers compare to what whites tell surveys? Among whites who told
the GSS in 2008 and 2010 that they voted for Kerry in 2004, 2.6 percent said they would
not vote for a black president. Three percent of whites told Gallup Obama’s race made
them much less likely to support him (Fretland, 2008). Approximately 4.8 percent of whites
told exit pollsters they voted for McCain and race was an important factor in their vote.
Evidence strongly suggests that many whites voted against Obama due to his race but did
not admit that to surveys. The numbers can also be compared to other self-reported racial
attitudes. In 2002, the last year the question was asked by the GSS, 11.9 percent of white
Democrats admitted that they favored a law banning interracial marriage.
For additional intuition on the size of the effect, the numbers can be compared to per-
suasion rates as calculated by media scholars. Gerber et al. (2009) find that The Washington
Post persuades 20 percent of readers to vote for a Democrat. Gentzkow et al. (2011) re-
port that, historically, partisan newspapers persuaded fewer than 3.4 percent of readers.
DellaVigna and Kaplan (2007) find that Fox News persuades 11.6 percent of viewers to vote
Republican. Thus, the proportion of white Democrats who will not vote for a black Demo-
cratic Presidential candidate is roughly equivalent to the proportion of Democrats who can
be persuaded by Fox News to not vote for a white Democratic Presidential candidate.
28
V Conclusion
Whether many white Americans will not vote for a black presidential candidate is perhaps
the most famous problem complicated by social desirability bias. Scholars have long doubted
the accuracy of survey results on this sensitive question. I argue that Google search query
data offer clear evidence that continuing racial animus in the United States cost a black
candidate substantial votes.
There are many important questions on sensitive topics that may similarly be helped by
Google data. In a study of measurement error in surveys, Bound et al. (2001) include the
following sensitive behaviors as difficult to measure for surveyors due to social censoring:
“the use of pugnacious terms with respect to racial or ethnic groups;” voting; use of illicit
drugs; sexual practices; income; and embarrassing health conditions. Words related to all
these topics are searched often on Google.
29

Figure 1Selected Words and Phrases Included in Google Searches Roughly as
Frequently as “nigger(s),” 2004-2007
Notes: This figure shows selected words and phrases included in a similar number of searches, from 2004-2007, as “nigger(s).” The number corresponds to the ratio of total Google searches that include that wordto total Google searches that include the racial epithet. “Daily Show,” for example, was included in about6 % more searches than the racial epithet. “Economist” was included in about 20 % fewer searches. It isworth emphasizing again that this counts any searches including the word or phrase. So searches such as“The Daily Show” and “Daily Show clips” will be counted in the search total for “Daily Show.” And Googleconsiders searches case-insensitive. So “daily show” and “daily show clips” would also count. While the wordsincluded were rather arbitrarily selected, another benchmark to use is “weather.” “Weather” was includedin only about 81 times more searches than “nigger(s)” during this time period. All numbers presented wereestimated using Google Trends.
30

Figure 2Racially Charged Search Rate, Media Market
Notes: This maps search volume for “nigger(s),” from 2004-2007, at the media market level. Darker areas signify higher search volume. Whiteareas signify media markets without data. Alaska and Hawaii, for which data are available, are not shown.
31

Figure 3Google Racially Charged Search Compared to GSS Opposition to Interracial Marriage
(a) Absolute (b) Rank
AL
ARNCGA
MS KY
WV
TN
SC
LA
FL
MO
INDE
OH
OK
PA
TXVA
IL
ND
SD
KS
MI
NY
MD
MN
VT
IA
NJ
MT
AZ
WI
WYAK
CA
CT
MA
CO
RI
UT
NH
OR
WA
DC
25
50
75
100
Racia
lly C
harg
ed S
earc
h R
ate
0 10 20 30 40 50% Against Interracial Marriage (GSS)
t = 4.83UT
CODC
MNOR
MTWY
AKSD
WAAZ
MAIA
NDNH
CAVT
VATX
KSWI
INMD
OKDE
ILMO
CTGA
NCAR
RINY
FLTN
NJAL
SCOH
MIKY
MSPA
LAWV
123
45
Rank
1 23 45GSS Rank
t = 6.16
Notes: The x-axis in panels (a) is the measure of racial attitudes used in Mas and Moretti (2009): percent of whites, from 1990-2004, supportinga law banning interracial marriage. The x-axis in panel (b) is the rank of the 45 states for this measure, with higher numbers correspondingto higher measures of racial prejudice. Thus, the value 45 in Panel (b) means that state (Kentucky) had the highest percentage of whitestelling the GSS they supported a law banning interracial marriage. The y-axis for panel (a) uses the unrounded number in Table A.1 for the45 states for which GSS data are available; The-y axis panel (b) is the rank of racially charged search for these 45 states, with higher numberscorresponding to higher racially charged search rates.
32

Figure 4Racially Charged Search Rate and Black Candidate Support
(a) Obama−Kerry (b) Obama−Obama
−10
−5
05
10
15
20
%O
bam
a2008 −
%K
err
y2004
20 40 60 80 100Racially Charged Search Rate
R2 = 0.24
−15
−10
−5
05
10
15
%O
bam
a2012 −
%O
bam
a2008
20 40 60 80 100Racially Charged Search Rate
R2 = 0.00
Notes: The x-axis in both panels is a media market’s Racially Charged Search Rate, as defined in Equation 1, obtained by the algorithmdescribed in Appendix B. The y-axis in Panel (a) is Kerry’s 2004 percentage points of the two-party vote subtracted from Obama’s 2008percentage points of the two-party vote. The y-axis in Panel (b) is Obama’s 2008 percentage points of the two-party vote subtracted fromObama’s 2012 percentage points of the two-party vote.
33
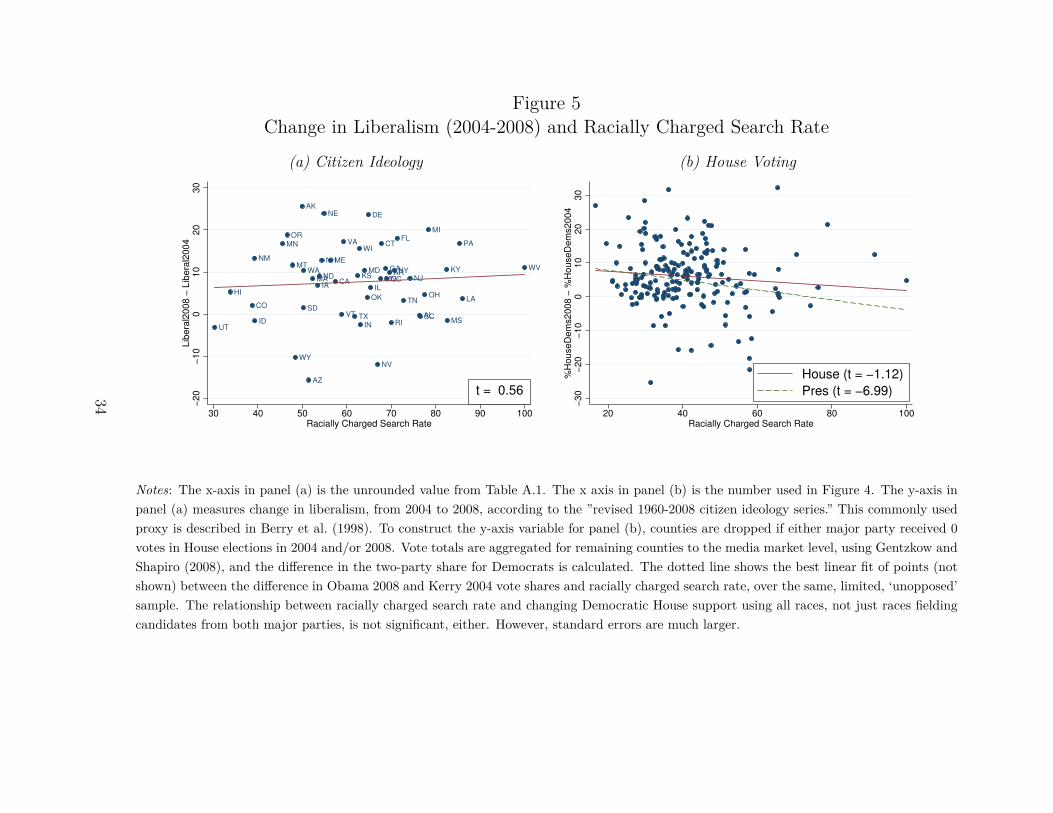
Figure 5Change in Liberalism (2004-2008) and Racially Charged Search Rate
(a) Citizen Ideology (b) House Voting
AL
AK
AZ
AR
CA
CO
CT
DE
FL
GA
HI
ID
IL
IN
IA
KSKY
LA
ME
MDMA
MI
MN
MS
MO
MT
NE
NV
NH
NJ
NM
NYNCND
OHOK
ORPA
RISC
SDTN
TX
UT
VT
VA
WA WV
WI
WY
−20
−10
010
20
30
Lib
era
l2008 −
Lib
era
l2004
30 40 50 60 70 80 90 100Racially Charged Search Rate
t = 0.56
−30
−20
−10
010
20
30
%H
ouseD
em
s2008 −
%H
ouseD
em
s2004
20 40 60 80 100Racially Charged Search Rate
House (t = −1.12)
Pres (t = −6.99)
Notes: The x-axis in panel (a) is the unrounded value from Table A.1. The x axis in panel (b) is the number used in Figure 4. The y-axis inpanel (a) measures change in liberalism, from 2004 to 2008, according to the ”revised 1960-2008 citizen ideology series.” This commonly usedproxy is described in Berry et al. (1998). To construct the y-axis variable for panel (b), counties are dropped if either major party received 0votes in House elections in 2004 and/or 2008. Vote totals are aggregated for remaining counties to the media market level, using Gentzkow andShapiro (2008), and the difference in the two-party share for Democrats is calculated. The dotted line shows the best linear fit of points (notshown) between the difference in Obama 2008 and Kerry 2004 vote shares and racially charged search rate, over the same, limited, ‘unopposed’sample. The relationship between racially charged search rate and changing Democratic House support using all races, not just races fieldingcandidates from both major parties, is not significant, either. However, standard errors are much larger.
34

Table 1Signal-to-Noise Ratio in Google Search Terms
Term Underlying Variable t-stat R2
God Percent Believe in God 8.45 0.65Gun Percent Own Gun 8.94 0.62
African American(s) Percent Black 13.15 0.78Hispanic Percent Hispanic 8.71 0.61Jewish Percent Jewish 17.08 0.86
Notes: The t-stat and R2 are from a regression with the normalized search volume of the word(s) in the firstcolumn as the independent variable and measures of the value in the second column as the dependent vari-able. The normalized search volume for all terms are from 2004-2007. All data are at the state level. PercentBlack are Percent Hispanic are from the American Community Survey, for 2008; the Jewish population isfrom 2002, gun ownership from 2001, and belief in God from 2007. Jewish data are missing one observation(South Dakota); belief in God data are missing for 10 states. The data for belief in God, percent Jew-ish, and percent owning guns can be found at http://pewforum.org/how-religious-is-your-state-.aspx, http://www.jewishvirtuallibrary.org/jsource/US-Israel/usjewpop.html, and http://www.washingtonpost.com/wp-srv/health/interactives/guns/ownership.html, respectively.
35

Table 2Top Searches for “nigger(s)”
’04-’07 Search ’08-’11 SearchRank DATA USED DATA NOT USED
1. jokes jokes2. nigger jokes nigger jokes3. white nigger obama nigger4. nigga nigga5. hate niggers black nigger6. i hate niggers funny nigger7. black jokes nigger song8. the word nigger the word nigger9. racist jokes nas nigger10. kkk i hate niggers
Notes: This table shows the ‘top searches’ for “nigger(s).” 2004-2007 is the time period for the search volumeused in the regressions and figures to limit reverse causation. Results would be similar regardless of timeperiod selected, as the state-level correlation between the two periods is 0.94. Depending on the draw, the‘top searches’ might be slightly different. Top searches, according to Google, ‘are related to the term,’ asdetermined ‘by examining searches that have been conducted by a large group of users preceding the searchterm you’ve entered, as well as after,’ as well as by automatic categorization.
36

Table 3Predictors of an Area’s Racially Charged Search Rate
Dependent Variable: Racially Charged Search Rate(1) (2) (3) (4)
Percent Age 65 or Older 6.884* 3.341 6.492* 3.757(3.650) (3.447) (3.668) (3.495)
Percent w/ Bachelor’s Degree -9.309*** -8.532*** -10.104*** -9.459***(2.105) (2.147) (2.004) (2.129)
Percent Hispanic -2.620*** -2.298*** -2.659*** -2.297***(0.462) (0.554) (0.454) (0.486)
Percent Black 2.556*** 0.283 11.245*** 6.734**(0.826) (1.268) (2.158) (3.172)
(Percent Black)-squared -24.731*** -16.517***(5.613) (6.070)
Observations 196 196 196 196R-squared 0.36 0.49 0.41 0.50Census Div. FE X X
* p < 0.1; ** p < 0.05; *** p < 0.01
Notes: Standard errors, clustered at the state level, are in parentheses. Racially Charged Search Rate isas defined in Equation 1, obtained by the algorithm described in Appendix B, normalized to its z-score.The demographic variables are individuals in the group divided by total individuals; thus a one-unit changerepresents a change from 0 to 100 percent. The demographics variables are from the American CommunitySurvey ’05-’09. All county-level variables are aggregated to the media market level using Gentzkow andShapiro (2008).
37

Table 4Music, “nigger,” and “nigga,” 2004-2007
Rank Top searches for ‘nigger lyrics’ Top searches for ‘nigga(s)’1. nigger song nigga lyrics2. nigger song lyrics my nigga3. nigger jokes niggas lyrics4. white nigger hood nigga5. nigger hatin me my niggas6. white nigger lyrics lyrics hood nigga7. johnny rebel lyrics nigga stole8. johnny rebel nigga stole my9. david allen coe my nigga lyrics10. lyrics alabama nigger nigga what
Notes: The second column shows the ‘top searches’ reported for searches including both “nigger” and “lyrics.”The third column shows the ‘top searches’ reported for searches including either “nigga” or “niggas.” Themethod for calculating ‘top searches’ is discussed in Table 2. Also noted there, depending on the particulardraw, the ranks and terms might differ somewhat.
38

Table 5Summary Statistics
mean sd min maxRacially Charged Search Rate 39.78 9.21 16.62 100.00%Kerry2004 48.83 9.57 19.89 70.06%Obama2008 53.76 10.18 22.16 75.05%Obama2012 52.04 11.03 19.66 76.87%Obama2008 - %Kerry2004 4.93 3.18 -10.98 18.60%Obama2012 - %Obama2008 -1.72 2.03 -10.61 5.27%HouseDems2008 - %HouseDems2004 7.26 8.74 -39.16 72.59ln(Turnout2008) - ln(Turnout2004) 0.07 0.06 -0.10 0.25
Notes: All summary statistics are reported for the 196 media markets for which data on Racially ChargedSearch Rate and voting data are available. All summary statistics reported are weighted by 2004 two-partyturnout, the weighting used in Tables 6 and 9. Racially Charged Search Rate is as defined in Equation 1,obtained by the algorithm described in Appendix B, normalized to its z-score. All candidate variables arethat candidate’s percentage points of two-party votes in a given year. Turnout is total two-party presidentialvotes in a given year. All political variables were downloaded at the county level and aggregated to themedia market level using Gentzkow and Shapiro (2008).
39

Table 6The Effect of Racial Animus on Black Candidate Vote Share
Dependent Variable: %Obama2008 - %Kerry2004(1) (2) (3) (4) (5) (6)
Racially Charged Search Rate -1.490*** -1.486*** -1.341*** -2.124*** -2.002*** -1.776***(0.305) (0.258) (0.260) (0.435) (0.259) (0.304)
Home State 2.616*** 4.234*** 3.556*** 2.481*** 4.070*** 3.636***(0.804) (1.118) (1.107) (0.854) (1.141) (0.996)
Observations 196 196 196 196 196 196R-squared 0.26 0.51 0.62 0.30 0.52 0.62Standard Controls X X X X X XCensus Div. FE X X X XDemographic Controls X XGoogle Controls X X X
* p < 0.1; ** p < 0.05; *** p < 0.01
Notes: Standard errors, clustered at the state level, are in parentheses. OLS regressions are weighted by total two-party presidential votes inthe 2004 election. Racially Charged Search Rate is as defined in Equation 1, obtained by the algorithm described in Appendix B, normalizedto its z-score. Home State takes the value 1 for Illinois and Texas; -1 for Massachusetts and Arizona; 0 otherwise. Standard controls are HomeState and unemployment rates in years 2003, 2004, 2007, and 2008 (from Local Area Unemployment Statistics). Demographic controls arepercent African-American, percent Hispanic, percent with bachelor’s degree, percent 18-34, percent 65+, and percent veteran (from AmericanCommunity Survey ’05-’09); change from 2000 to 2010 in percent African-American and percent Hispanic (from the Census); and gun magazinesubscriptions per capita (from Duggan (2001)). All county-level variables are aggregated to the media market level using Gentzkow and Shapiro(2008). Google controls are normalized search volume for “African-American(s);” “nigga(s);” and “fuck.”
40

41
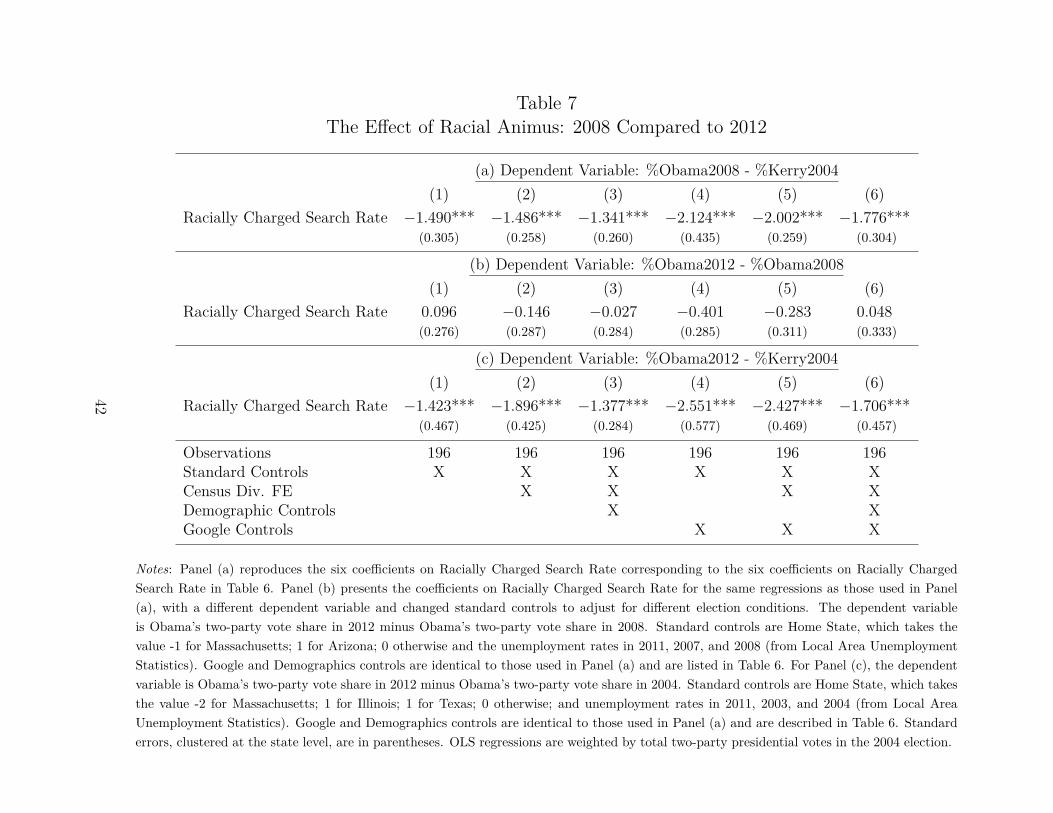
Table 7The Effect of Racial Animus: 2008 Compared to 2012
(a) Dependent Variable: %Obama2008 - %Kerry2004(1) (2) (3) (4) (5) (6)
Racially Charged Search Rate −1.490*** −1.486*** −1.341*** −2.124*** −2.002*** −1.776***(0.305) (0.258) (0.260) (0.435) (0.259) (0.304)
(b) Dependent Variable: %Obama2012 - %Obama2008(1) (2) (3) (4) (5) (6)
Racially Charged Search Rate 0.096 −0.146 −0.027 −0.401 −0.283 0.048(0.276) (0.287) (0.284) (0.285) (0.311) (0.333)
(c) Dependent Variable: %Obama2012 - %Kerry2004(1) (2) (3) (4) (5) (6)
Racially Charged Search Rate −1.423*** −1.896*** −1.377*** −2.551*** −2.427*** −1.706***(0.467) (0.425) (0.284) (0.577) (0.469) (0.457)
Observations 196 196 196 196 196 196Standard Controls X X X X X XCensus Div. FE X X X XDemographic Controls X XGoogle Controls X X X
Notes: Panel (a) reproduces the six coefficients on Racially Charged Search Rate corresponding to the six coefficients on Racially ChargedSearch Rate in Table 6. Panel (b) presents the coefficients on Racially Charged Search Rate for the same regressions as those used in Panel(a), with a different dependent variable and changed standard controls to adjust for different election conditions. The dependent variableis Obama’s two-party vote share in 2012 minus Obama’s two-party vote share in 2008. Standard controls are Home State, which takes thevalue -1 for Massachusetts; 1 for Arizona; 0 otherwise and the unemployment rates in 2011, 2007, and 2008 (from Local Area UnemploymentStatistics). Google and Demographics controls are identical to those used in Panel (a) and are listed in Table 6. For Panel (c), the dependentvariable is Obama’s two-party vote share in 2012 minus Obama’s two-party vote share in 2004. Standard controls are Home State, which takesthe value -2 for Massachusetts; 1 for Illinois; 1 for Texas; 0 otherwise; and unemployment rates in 2011, 2003, and 2004 (from Local AreaUnemployment Statistics). Google and Demographics controls are identical to those used in Panel (a) and are described in Table 6. Standarderrors, clustered at the state level, are in parentheses. OLS regressions are weighted by total two-party presidential votes in the 2004 election.
42

Table 8Robustness Checks
Specification 2008 Coefficient 2012 CoefficientBaseline (All Controls; Table 7, Column (6)) −1.776 −1.706
(0.304) (0.304)
Exclude Hawaii −1.553 −1.463(0.230) (0.411)
Add Control for Change in House Voting −1.699 −1.610(0.284) (0.452)
Add Control for Swing State −1.779 −1.647(0.317) (0.442)
Use %Obama as Dependent Variable and Include Control for %Kerry2004 −1.682 −1.661(0.285) (0.460)
Use %Obama as Dependent Variable and Include 4th-Order Polynomial %Kerry2004 −1.648 −1.628(0.293) (0.478)
Add Control for %Kerry2004-%Gore2000 −1.775 −1.694(0.312) (0.439)
Add Controls for %Kerry2004-%Gore2000 and %Gore2000-%Clinton1996 −1.731 −1.642(0.329) (0.453)
Use %Obama as Dependent Variable and Include %Kerry2004, %Gore2000, %Clinton1996 −1.577 −1.547(0.326) (0.459)
Notes: Standard errors, clustered at the state level, are in parentheses. Results in this table are variations on Column (6), Panels (a)and (c), reported in Table 7. Swing State status are Battleground States, as defined by The Washington Post, available at http://www.washingtonpost.com/wp-dyn/content/graphic/2008/06/08/GR2008060800566.html.
43
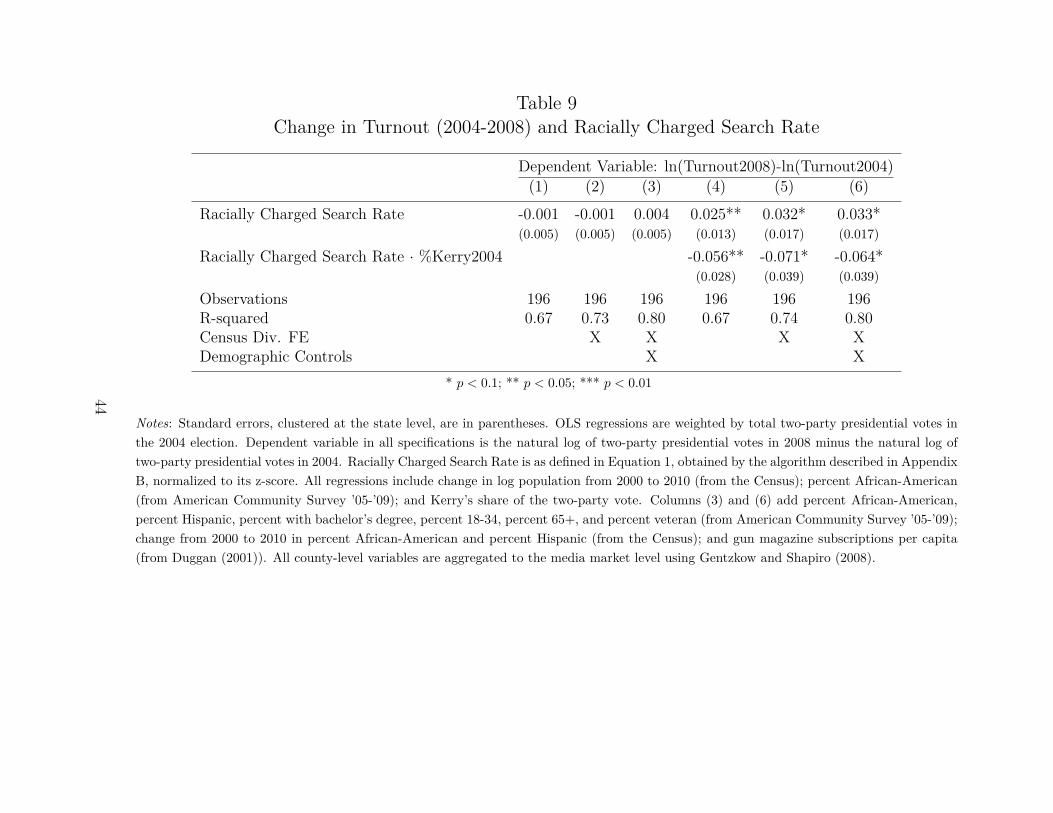
Table 9Change in Turnout (2004-2008) and Racially Charged Search Rate
Dependent Variable: ln(Turnout2008)-ln(Turnout2004)(1) (2) (3) (4) (5) (6)
Racially Charged Search Rate -0.001 -0.001 0.004 0.025** 0.032* 0.033*(0.005) (0.005) (0.005) (0.013) (0.017) (0.017)
Racially Charged Search Rate · %Kerry2004 -0.056** -0.071* -0.064*(0.028) (0.039) (0.039)
Observations 196 196 196 196 196 196R-squared 0.67 0.73 0.80 0.67 0.74 0.80Census Div. FE X X X XDemographic Controls X X
* p < 0.1; ** p < 0.05; *** p < 0.01
Notes: Standard errors, clustered at the state level, are in parentheses. OLS regressions are weighted by total two-party presidential votes inthe 2004 election. Dependent variable in all specifications is the natural log of two-party presidential votes in 2008 minus the natural log oftwo-party presidential votes in 2004. Racially Charged Search Rate is as defined in Equation 1, obtained by the algorithm described in AppendixB, normalized to its z-score. All regressions include change in log population from 2000 to 2010 (from the Census); percent African-American(from American Community Survey ’05-’09); and Kerry’s share of the two-party vote. Columns (3) and (6) add percent African-American,percent Hispanic, percent with bachelor’s degree, percent 18-34, percent 65+, and percent veteran (from American Community Survey ’05-’09);change from 2000 to 2010 in percent African-American and percent Hispanic (from the Census); and gun magazine subscriptions per capita(from Duggan (2001)). All county-level variables are aggregated to the media market level using Gentzkow and Shapiro (2008).
44
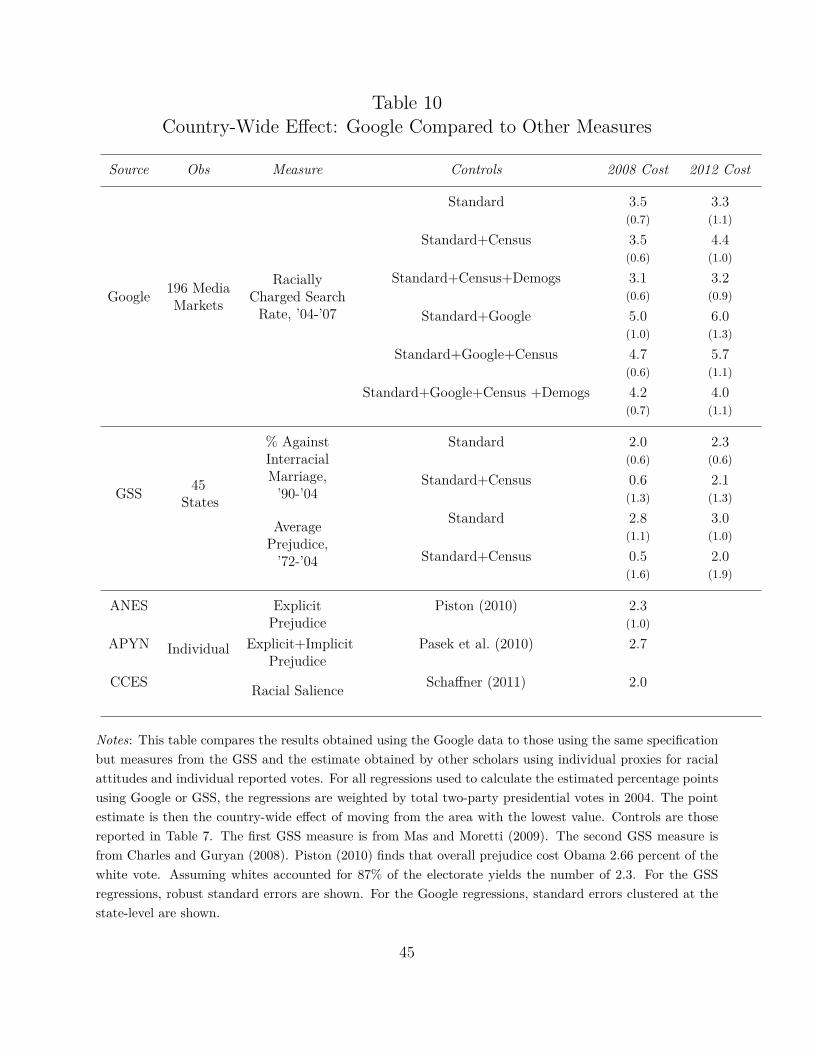
Table 10Country-Wide Effect: Google Compared to Other Measures
Source Obs Measure Controls 2008 Cost 2012 Cost
Google 196 MediaMarkets
RaciallyCharged Search
Rate, ’04-’07
Standard 3.5 3.3(0.7) (1.1)
Standard+Census 3.5 4.4(0.6) (1.0)
Standard+Census+Demogs 3.1 3.2(0.6) (0.9)
Standard+Google 5.0 6.0(1.0) (1.3)
Standard+Google+Census 4.7 5.7(0.6) (1.1)
Standard+Google+Census +Demogs 4.2 4.0(0.7) (1.1)
GSS 45States
% AgainstInterracialMarriage,
’90-’04
Standard 2.0 2.3(0.6) (0.6)
Standard+Census 0.6 2.1(1.3) (1.3)
AveragePrejudice,
’72-’04
Standard 2.8 3.0(1.1) (1.0)
Standard+Census 0.5 2.0(1.6) (1.9)
ANES
Individual
ExplicitPrejudice
Piston (2010) 2.3(1.0)
APYN Explicit+ImplicitPrejudice
Pasek et al. (2010) 2.7
CCES Racial Salience Schaffner (2011) 2.0
Notes: This table compares the results obtained using the Google data to those using the same specificationbut measures from the GSS and the estimate obtained by other scholars using individual proxies for racialattitudes and individual reported votes. For all regressions used to calculate the estimated percentage pointsusing Google or GSS, the regressions are weighted by total two-party presidential votes in 2004. The pointestimate is then the country-wide effect of moving from the area with the lowest value. Controls are thosereported in Table 7. The first GSS measure is from Mas and Moretti (2009). The second GSS measure isfrom Charles and Guryan (2008). Piston (2010) finds that overall prejudice cost Obama 2.66 percent of thewhite vote. Assuming whites accounted for 87% of the electorate yields the number of 2.3. For the GSSregressions, robust standard errors are shown. For the Google regressions, standard errors clustered at thestate-level are shown.
45
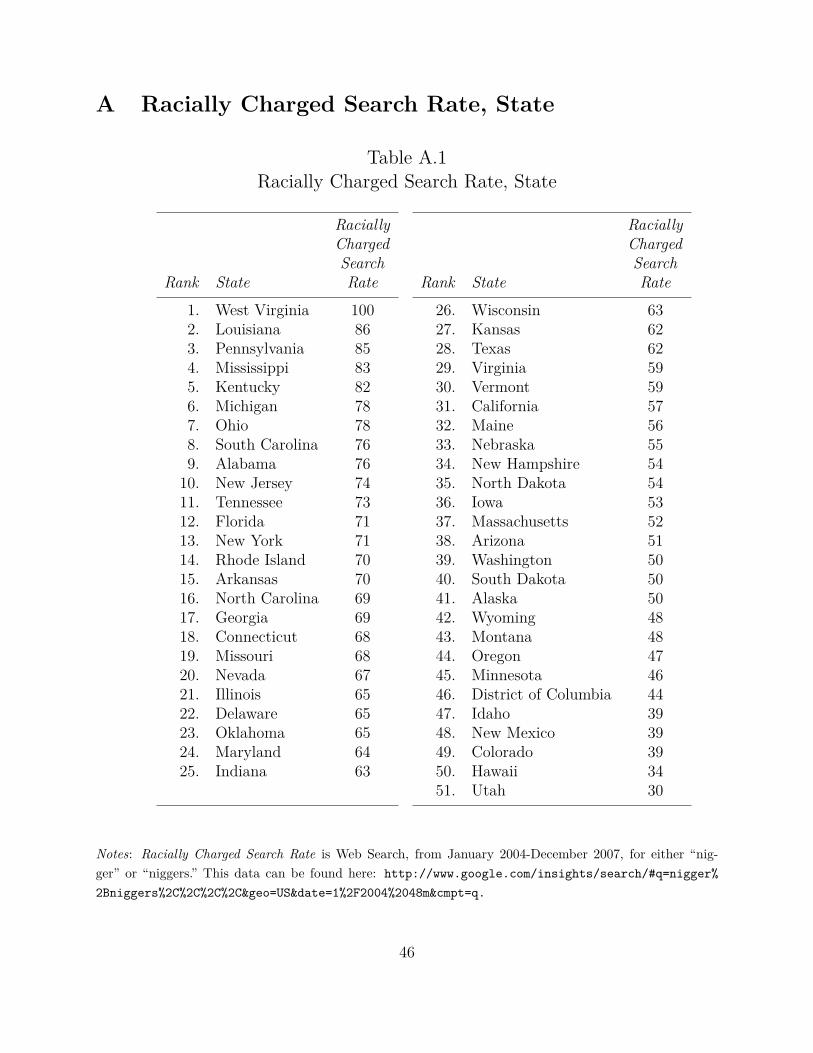
A Racially Charged Search Rate, State
Table A.1Racially Charged Search Rate, State
RaciallyChargedSearch
Rank State Rate1. West Virginia 1002. Louisiana 863. Pennsylvania 854. Mississippi 835. Kentucky 826. Michigan 787. Ohio 788. South Carolina 769. Alabama 76
10. New Jersey 7411. Tennessee 7312. Florida 7113. New York 7114. Rhode Island 7015. Arkansas 7016. North Carolina 6917. Georgia 6918. Connecticut 6819. Missouri 6820. Nevada 6721. Illinois 6522. Delaware 6523. Oklahoma 6524. Maryland 6425. Indiana 63
RaciallyChargedSearch
Rank State Rate26. Wisconsin 6327. Kansas 6228. Texas 6229. Virginia 5930. Vermont 5931. California 5732. Maine 5633. Nebraska 5534. New Hampshire 5435. North Dakota 5436. Iowa 5337. Massachusetts 5238. Arizona 5139. Washington 5040. South Dakota 5041. Alaska 5042. Wyoming 4843. Montana 4844. Oregon 4745. Minnesota 4646. District of Columbia 4447. Idaho 3948. New Mexico 3949. Colorado 3950. Hawaii 3451. Utah 30
Notes: Racially Charged Search Rate is Web Search, from January 2004-December 2007, for either “nig-ger” or “niggers.” This data can be found here: http://www.google.com/insights/search/#q=nigger%2Bniggers%2C%2C%2C%2C&geo=US&date=1%2F2004%2048m&cmpt=q.
46

B Algorithm to Determine Search Volume at MediaMarket Level
Google Trends does not report data if the absolute level of search is below an unreportedthreshold. The threshold is clearly high, such that only the most common searches are avail-able at the media market level. And search volume for “nigger(s)” is only available for asmall number of media markets. To get around this, I use the following strategy: Get searchvolume for the word “weather.” (This gets above the threshold for roughly 200 of 210 mediamarkets, since “weather” is a fairly common term used on Google.) Get search volume for“weather+nigger(s),” searches that include either “weather” or “nigger(s).” (This, by defi-nition, gets over the threshold for the same 200 media markets, since it captures a largernumber of searches. Subtracting search volume from “weather” from search volume from“weather+nigger(s)” will give approximate search volume for “nigger(s)” for the 200 mediamarkets. Complications arise from rounding, normalizing, and sampling.
Here is the algorithm:
Take a sample s in Google.Let X be a set of possible searches. Denote Xj,s as the value that Google Trends gives.This is Xj,s = xj,s/xmax,s where xj,s is the fraction of Google searches in area j in sample sthat are in X. (See Equation 1).Take two words N and W . And let C = N∪W and B = N∩W . Then nj,s = cj,s−wj,s +bj,s.Denoting xj as the expected value of x in area j, then nj = cj −wj + bj Assume we have anarea for which, for x ∈ {c, w, n, b}, xj,s is independent of xmax,s. Then Xj = xj/xmax. Then
Nj = cmax
nmax
Cj −wmax
nmax
Wj + bmax
nmax
Bj (5)
Assume Bj is negligible, a reasonable assumption for words used in this paper. The issueis that Nj, the word of interest, is only reported for about 30 media markets, whereas Cj
and Wj are reported for about 200 media markets. Since Nj depends linearly on Wj andCj I can find cmax
nmax
and wmax
nmax
using data for any media market that reports all 3 values. Ican then use these numbers to find Nj for all 200 that report Wj and Cj. If Cj, Wj, andNj were reported with no error for media markets, I could find exact numbers. Even with5,000 downloads, I do not get perfect estimates of Cj, Wj, and Nj. I thus back out thecoefficients by regressing the averages for 30 media markets that have all data available. TheR2 on this regression is 0.86, meaning there is minor remaining error. After 5,000 downloads,regressing halves of the samples suggest this strategy has captured about 80 percent of thevariation in the actual number. To deal with the minor remaining error, I use the first halfsample estimate as an instrument for the second half sample when racially charged search isan independent variable in regressions.
47

Algorithm in Practice:1. Download 5,000 samples for “weather,” from 2004-2007.2. Download 5,000 samples for “nigger+niggers,” from 2004-2007. (A “+” signifies an “or.”)3. Download 5,000 samples for “nigger+niggers+weather,” from 2004-2007.4. Eliminate any media market that ever scores 0 or 100 for “weather.” (A 0 means absolutesearch volume is too small. A 100 means it scores the maximum.)(12 of the smallest media markets in the country are eliminated, 10 that never show up and2 that compete for the top “weather” search spot.)5. Calculate a media market’s average score for “weather,” “nigger+niggers,” and “nig-ger+niggers+weather.”6. Regress “nigger+niggers” average score on “weather” average score and “weather+nigger+niggers”average score for the markets that never score a 0 or 100 on “nigger+niggers.”7. Use coefficients from regression to back out “nigger+niggers” for remaining markets, usingtheir average search volume for “weather” and “nigger+niggers+weather.”
48

ReferencesAlesina, Alberto and Eliana La Ferrara, “Who Trusts Others?,” Journal of Public
Economics, 2002, 85 (2), 207 – 234.
and Howard Rosenthal, Partisan Politics, Divided Government, and the Economy,New York: Cambridge University Press, 1995.
, Ed Glaeser, and Bruce Sacerdote, “Why Doesn’t the US Have a European-StyleWelfare System?,” Brookings Papers on Economic Activity, August 2001, 2001 (2),187–254.
Allport, Gordon Willard, The Nature of Prejudice, New York: Addison-Wesley, 1979.
Altonji, Joseph G., Todd E. Elder, and Christopher R. Taber, “Selection on Ob-served and Unobserved Variables: Assessing the Effectiveness of Catholic Schools,”Journal of Political Economy, 2005, 113 (1), 151 – 184.
Ansolabehere, Stephen and Eitan Hersh, “Pants on Fire: Misreporting, Sample Selec-tion, and Participation,” Working Paper, 2011.
Atkeson, Lonna Rae, “‘Sure, I Voted for the Winner!’ Overreport of the Primary Votefor the Party Nominee in the National Election Studies,” Political Behavior, 1999, 21(3), 19.
Benjamin, Daniel J. and Jesse M. Shapiro, “Thin-Slice Forecasts of GubernatorialElections,” The Review of Economics and Statistics, August 2009, 91 (33), 523–536.
Berggren, Niclas, Henrik Jordahl, and Panu Poutvaara, “The Looks of a Winner:Beauty and Electoral Success,” Journal of Public Economics, 2010, 94 (1-2), 8–15.
Berinsky, Adam J., “The Two Faces of Public Opinion,” American Journal of PoliticalScience, 1999, 43 (5), 1209 – 1230.
, “Political Context and the Survey Response: The Dynamics of Racial Policy Opinion,”The Journal of Politics, July 2002, 64 (02).
Berry, William D., Evan J. Ringquist, Richard C. Fording, and Russell L. Han-son, “Measuring Citizen and Government Ideology in the American States, 1960-93,”American Journal of Political Science, 1998, 42 (1), 327–348.
Bertrand, Marianne and Sendhil Mullainathan, “Are Emily and Greg More Employ-able Than Lakisha and Jamal? A Field Experiment on Labor Market Discrimination,”American Economic Review, 2004, 94 (4), 991 – 1013.
Blalock, Hubert, Toward a Theory of Minority-Group Relations, New York: Wiley, 1967.
49

Bound, John, Charles Brown, and Nancy Mathiowetz, “Measurement Error in SurveyData,” Handbook of Econometrics, 2001, 5, 3705 – 3843.
Burns, Enid, “U.S. Search Engine Rankings, April 2007,” searchenginewatch.com, May2007.
Campbell, James E., “Forecasting the Presidential Vote in the States,” American Journalof Political Science, 1992, 36 (2), 386–407.
, “Editor’s Introduction: Forecasting the 2008 National Elections,” PS: Political Science& Politics, October 2008, 41 (04), 679–682.
, “Forecasting the 2012 American National Elections,” PS: Political Science & Politics,October 2012, 45 (04), 610–613.
Card, David, Alexandre Mas, and Jesse Rothstein, “Tipping and the Dynamics ofSegregation,” The Quarterly Journal of Economics, 2008, 123 (1), 177 – 218.
Charles, Kerwin Kofi and Jonathan Guryan, “Prejudice and Wages: An Empirical As-sessment of Becker’s The Economics of Discrimination,” Journal of Political Economy,2008, 116 (5), 773–809.
and , “Studying Discrimination: Fundamental Challenges and Recent Progress,”2011.
Conti, Gregory and Edward Sobiesk, “An Honest Man Has Nothing to Fear,” in “Pro-ceedings of the 3rd Symposium on Usable Privacy and Security - SOUPS ’07” ACMPress New York, New York, USA July 2007, p. 112.
CPS, “Computer and Internet Use in the United States: October 2007,” 2007.
Cutler, David M., Edward L. Glaeser, and Jacob L. Vigdor, “The Rise and Declineof the American Ghetto,” Journal of Political Economy, 1999, 107 (3), 455 – 506.
DellaVigna, Stefano, “The Obama Effect on Economic Outcomes: Evidence from EventStudies,” 2010.
and Ethan Kaplan, “The Fox News Effect: Media Bias and Voting,” The QuarterlyJournal of Economics, August 2007, 122 (3), 1187–1234.
Donovan, Todd, “Obama and the White Vote,” Political Research Quarterly, August 2010,63 (4), 863–874.
Duggan, Mark, “More Guns, More Crime,” Journal of Political Economy, 2001, 109 (5),1086 – 1114.
Enos, Ryan D., “The Persistence of Racial Threat: Evidence from the 2008 Election,”American Political Science Association Annual Meeting, 2010.
50

Feldman, Stanley and Leonie Huddy, “Racial Resentment and White Opposition toRace-Conscious Programs: Principles or Prejudice?,” American Journal of PoliticalScience, 2005, 49 (1), 16.
Fretland, Katie, “Gallup: Race Not Important to Voters,” The Chicago Tribune’s TheSwamp, June 2008.
Gallup, “Presidential Approval Ratings: George W. Bush,” 2012.
Gentzkow, Matthew and Jesse Shapiro, Introduction of Television to the United StatesMedia Market, 1946-1960; Dataset 22720, Ann Arbor, MI: ICPSR, 2008.
, , and Michael Sinkinson, “The Effect of Newspaper Entry and Exit on Elec-toral Politics,” American Economic Review, 2011, 101 (7), 2980–3018.
Gerber, Alan S., Dean Karlan, and Daniel Bergan, “Does the Media Matter? AField Experiment Measuring the Effect of Newspapers on Voting Behavior and PoliticalOpinions,” American Economic Journal: Applied Economics, 2009, 1 (2), 18.
Gilens, Martin, Paul M. Sniderman, and James H. Kuklinski, “Affirmative Actionand the Politics of Realignment,” British Journal of Political Science, January 1998, 28(01), 159–183.
Ginsberg, Jeremy, Matthew H. Mohebbi, Rajan S. Patel, Lynnette Brammer,Mark S. Smolinski, and Larry Brilliant, “Detecting Influenza Epidemics UsingSearch Engine Query Data.,” Nature, February 2009, 457 (7232), 1012–4.
Glaser, James, “Back to the Black Belt: Racial Environment and White Racial Attitudesin the South,” The Journal of Politics, 1994, 56, 21 – 41.
and Martin Gilens, “Interregional Migration and Political Resocialization: A Studyof Racial Attitudes Under Pressure,” Public Opinion Quarterly, 1997, 61 (1), 72–86.
Hart/McInturff, “Study 12062,” NBC News/Wall Street Journal, January 2012.
Highton, Benjamin, “Prejudice Rivals Partisanship and Ideology When Explaining the2008 Presidential Vote Across the States,” PS: Political Science & Politics, July 2011,44 (03), 530–535.
Holbrook, Thomas, “Incumbency, National Conditions, and the 2008 Presidential Elec-tion,” PS: Political Science & Politics, 2008, 41 (04), 709 – 712.
Hopkins, Heather, “Yahoo! Draws Younger Audience; Google Users Big Spenders Online,”Hitwise Intelligence, February 2008.
Huddy, Leonie and Stanley Feldman, “On Assessing the Political Effects of RacialPrejudice,” Annual Review of Political Science, June 2009, 12 (1), 423–447.
51
Huffman, Matt L. and Philip N. Cohen, “Racial Wage Inequality: Job Segregation andDevaluation Across U.S. Labor Markets,” American Journal of Sociology, 2004, 109 (4),902–936.
Jackman, Simon and Lynn Vavreck, “How Does Obama Match-Up? Counterfactuals& the Role of Obama’s Race in 2008,” 2011.
Jacobson, Gary C., “The 2008 Presidential and Congressional Elections: Anti-Bush Ref-erendum and Prospects for the Democratic Majority,” Political Science Quarterly, 2009,124 (1), 30.
Judis, John B. and Ruy Teixeira, The Emerging Democratic Majority, Scribner, 2004.
Kam, Cindy D. and Donald R. Kinder, “Ethnocentrism as a Short-Term Force in the2008 American Presidential Election,” American Journal of Political Science, February2012, 56 (2), 326–340.
Kennedy, Randall, Nigger: The Strange Career of a Troublesome Word, New York: Vin-tage Books, 2003.
Key Jr., Valdimer O., Southern Politics in State and Nation, New York: A.A. Knopf,1949.
Kinder, Donald R and Allison Dale-Riddle, The End of Race?, Yale University Press,2012.
Kinder, Donald R. and Timothy J. Ryan, “Prejudice and Politics Re-Examined: ThePolitical Significance of Implicit Racial Bias,” APSA 2012 Annual Meeting Paper, July2012.
Knowles, John, Nicola Persico, and Petra Todd, “Racial Bias in Motor VehicleSearches: Theory and Evidence,” Journal of Political Economy, 2001, 109 (1), 203– 232.
Kreuter, Frauke, Stanley Presser, and Roger Tourangeau, “Social Desirability Biasin CATI, IVR, and Web Surveys: The Effects of Mode and Question Sensitivity,” PublicOpinion Quarterly, January 2009, 72 (5), 847–865.
Kuklinski, James H., Michael D. Cobb, and Martin Gilens, “Racial Attitudes andthe ‘New South’,” The Journal of Politics, May 1997, 59 (02), 323–349.
Levitt, Steven D, “Using Repeat Challengers to Estimate the Effect of Campaign Spendingon Election Outcomes in the U.S. House,” Journal of Political Economy, 1994, 102 (4),777 – 98.
Lewis-Beck, Michael S. and Charles Tien, “The Job of President and the Jobs ModelForecast: Obama for ’08?,” PS: Political Science & Politics, October 2008, 41 (04),687–690.
52

and Tom W. Rice, “Localism in Presidential Elections: The Home State Advantage,”American Journal of Political Science, 1983, 27 (3), 548–556.
, Charles Tien, and Richard Nadeau, “Obama’s Missed Landslide: A RacialCost?,” PS: Political Science & Politics, January 2010, 43 (01), 69–76.
List, John A., “The Nature and Extent of Discrimination in the Marketplace: Evidencefrom the Field,” The Quarterly Journal of Economics, 2004, 119 (1), 49 – 89.
Lockerbie, Brad, “Election Forecasting: The Future of the Presidency and the House,”PS: Political Science & Politics, 2008, 41 (04), 713 – 716.
, “Economic Expectations and Election Outcomes: The Presidency and the House in2012,” PS: Political Science & Politics, October 2012, 45 (04), 644–647.
Mas, Alexandre and Enrico Moretti, “Racial Bias in the 2008 Presidential Election,”American Economic Review, 2009, 99 (2), 323 – 29.
Mixon, Franklin and J. Matthew Tyrone, “The ‘Home Grown’ Presidency: EmpiricalEvidence on Localism in Presidential Voting, 1972-2000,” Applied Economics, 2004, 36(16), 1745–1749.
Parsons, Christopher A., Johan Sulaeman, Michael C. Yates, and Daniel Hamer-mesh, “Strike Three: Discrimination, Incentives, and Evaluation,” American EconomicReview, 2011, 101 (4), 1410–35.
Pasek, Josh, Alexander Tahk, Yphtach Lelkes, Jon A. Krosnick, B. Keith Payne,Omair Akhtar, and T. Tompson, “Determinants of Turnout and Candidate Choicein the 2008 U.S. Presidential Election: Illuminating the Impact of Racial Prejudice andOther Considerations,” Public Opinion Quarterly, January 2010, 73 (5), 943–994.
Piston, Spencer, “How Explicit Racial Prejudice Hurt Obama in the 2008 Election,” Po-litical Behavior, 2010, 32 (4), 431–451.
Price, Joseph and Justin Wolfers, “Racial Discrimination Among NBA Referees,” TheQuarterly Journal of Economics, 2010, 125 (4), 1859–1887.
Rahman, Jacquelyn, “The N Word: Its History and Use in the African American Com-munity,” Journal of English Linguistics, July 2011.
Saiz, Albert and Uri Simonsohn, “Downloading Wisdom from Online Crowds,” October2008.
Schaffner, Brian F., “Racial Salience and the Obama Vote,” 2011.
Scheitle, Christopher P., “Google’s Insights for Search: A Note Evaluating the Use ofSearch Engine Data in Social Research,” Social Science Quarterly, 2011, 92 (1), 285 –295.
53
Schuman, Howard, “The Perils of Correlation, The Lure of Labels, and the Beauty ofNegative Results,” in David O. Sears, Jim Sidanius, and Lawrence Bobo, eds., RacializedPolitics: The Debate About Racism in America, University of Chicago Press, 2000,pp. 302–316.
Seifter, Ari, Alison Schwarzwalder, Kate Geis, and John Aucott, “The Utility of‘Google Trends’ for Epidemiological Research: Lyme Disease as an Example,” Geospa-tial Health, May 2010, 4 (2), 135–137.
Taylor, Marylee C., “How White Attitudes Vary with the Racial Composition of LocalPopulations: Numbers Count,” American Sociological Review, 1998, 63 (4), 512–535.
Tesler, Michael, “The Spillover of Racialization into Health Care: How President ObamaPolarized Public Opinion by Racial Attitudes and Race,” American Journal of PoliticalScience, 2012, 56 (3), 15.
and David O. Sears, Obama’s Race: The 2008 Election and the Dream of a Post-Racial America, Vol. 2010, Chicago: University of Chicago Press, 2010.
and , “President Obama and the Growing Polarization of Partisan Attachmentsby Racial Attitudes and Race,” APSA 2010 Annual Meeting Paper, July 2010.
Tourangeau, Roger and Yan Ting, “Sensitive Questions in Surveys,” Psychological Bul-letin, 2007, 133 (5), 859–883.
Valentino, Nicholas A. and Ted Brader, “The Sword’s Other Edge: Perceptions ofDiscrimination and Racial Policy Opinion after Obama,” Public Opinion Quarterly,May 2011, 75 (2), 201–226.
Varian, Hal R. and Hyunyoung Choi, “Predicting the Present with Google Trends,”SSRN Electronic Journal, August 2010.
Washington, Ebonya, “How Black Candidates Affect Voter Turnout,” Quarterly Journalof Economics, August 2006, 121 (3), 973–998.
Wolfers, Justin, “Are Voters Rational? Evidence from Gubernatorial Elections,” TechnicalReport March 2002.
Wright, Gerald C., “Errors in Measuring Vote Choice in the National Election Studies,1952-88,” American Journal of Political Science, 1993, 37 (1), 291–316.
54