the costs and benefits of geographic …...the costs and benefits of geographic labour mobility: a...
TRANSCRIPT
THE COSTS AND BENEFITS OF GEOGRAPHIC LABOUR
MOBILITY: A REGIONAL PERSPECTIVE
Submission to Productivity Commission Inquiry into Geographic Labour Mobility
29 August 2013

Geographic Labour Mobility, RAI PC Submission - August 2013 P A G E | 1
Preface Independent and informed by both research and ongoing dialogue with the community, the Regional Australia Institute (RAI)
develops policy and advocates for change to build a stronger economy and better quality of life in regional Australia – for
the benefit of all Australians. The RAI was specifically formed to help bridge the gap between knowledge, debate and
decision-making for the potential and future pathways of regional Australia. It exists to ensure local, state and federal
policy makers, researchers and members of the community have access to the information they need to make informed
choices about the future of regional Australia.
Geographic labour mobility is an essential component of the labour market and national efficiency. It is a mechanism for
matching supply and demand of labour in circumstances of acute and long term economic change. Yet, the reasons people
live and move where they do extends beyond labour opportunity to a myriad of decision making factors. The motivators,
enablers and impediments to mobility envelop the assessment of geographic labour mobility and efficiency with a complex
and diverse set of costs and benefits which have particular pertinence to regional Australia. Between 2006 and 2011,
population turnover rates were dominated by regional areas, far outnumbering their capital city counterparts. Advances in
travel and technology suggest that geographic labour mobility will continue to be important in both regions and national
labour trends.
RAI believes geographic labour mobility is crucial to regional economics and has a strong interest in ensuring that regional
areas are able to optimise their participation in the wider economy for the benefit of their citizens, the citizens of other
regions as well as Australia as a whole. The effects of mobility, both positive and negative, recur as central themes in much
of the research we have undertaken and in the conversations we have had with regional Australia. Realising the extent to
which geographic labour mobility contributes to efficiency in some regions and conversely how it creates inefficiencies in the
same or disparate regions is central to both regional and national productivity. It is with this strong interest and belief in
labour mobility as a core theme of regional, and subsequently national, efficiency that RAI has made this submission.
RAI welcomes the opportunity to make a submission to the Productivity Commission inquiry into Geographic Labour Mobility
and looks forward to an opportunity for further discussion with the Commission.

Geographic Labour Mobility, RAI PC Submission - August 2013 P A G E | 2
Executive Summary
Geographic labour mobility enables the demand for labour to be met. Flexible labour markets are critical for
allowing an efficient allocation of resources, particularly in non-metropolitan regions of Australia where
resources are scarce.
As such, labour market efficiency is reflective of how effectively a region shifts workers from one economic
activity to another in a timely manner, at a low cost and with little social disruption. Labour market efficiency
allows regions to adapt to and withstand external shocks, which is particularly important during times of greater
economic uncertainty.
In regional areas, where there are lower concentrations of labour resources, the mobility of labour is essential to
allowing resources to be allocated where needed. Large and small movements of labour into and out of
localities can have a large impact on regional areas as they have smaller economies and are therefore more
sensitive to fluctuations and change.
Yet it is unlikely, due to the many determinants of migration decision making, that the spatial supply of labour
will equal the demand for labour. This results in imbalances in the spatial distribution of labour supply and
labour demand and ultimately inefficiencies in economic activity.
As Australia’s regions vary significantly in their natural, human and labour capital it is inevitable that some will
be more sensitive to the effects of labour mobility than others. A locality’s ability to retain and retract labour,
particularly in more remote areas, is often not aligned with other determinants in the migration decision making
process such as lifestyle and educational opportunity. Therefore, incentives in the form of salary are often
needed in order to mobilise labour to that locality.
Over the last decade the mining boom has seen a huge demand for labour in localities with generally small
labour markets. The enhanced mobility of labour has enabled the development of these markets and has
brought many benefits to the local as well as the national economies.
KEY POINTS
• Labour mobility in regional Australia is essential to optimising the social and economic benefits for all of
Australia.
• The movement of people and labour is determined by many social, economic and structural factors - not
just jobs.
• Regional Australia has some of the highest population turnover in Australia and is more sensitive to labour
mobility than metropolitan areas.
• Each region is diverse and will have different sensitivities and house different opportunities in response to
labour mobility and will reap diverse costs and benefits.
• One size does not fit all - Estimating the full costs and benefits of labour mobility requires consideration
on who can and can’t be mobilised and which regions can and can’t participating the effects on those who
can’t be mobilised as much as those who can.

Geographic Labour Mobility, RAI PC Submission - August 2013 P A G E | 3
RAI recognises, apart from general movements, that there are three mobility events in current Australian society;
Those in response to booming markets;
Those in response to structural adjustment; and
Those related to natural disasters (often more acute events).
All of these events necessitate constant shift and adjustment of labour across the nation and within and between
regions. In theory, labour mobility would result in a perfect matching of labour supply to demand and the most
efficient market. Yet efficiency concerns not just pure equilibrium of markets but also whole of society costs.
For example while the mining boom has undoubtedly brought many benefits, whether these have provided the
highest allocative efficiency for the well-being of all the community is questionable.
The clear winners of labour mobility are those that have the capital and skills which are in demand while those
who suffer the biggest loss are those with small amounts of capital and skill sets of low demand. Ironically, these
groups also carry the largest risk in migration decision making. Eliminating this risk is key to improving
participation and improving the equitable distribution of benefits and therefore improving national efficiency
through mobile labour.
Australia’s regions suffer a similar fate; those with poor resources and labour markets are unable to attract or
retain higher skilled workers and those with better resources are able to attract more.
To ensure each sector of the economy operates as efficiently and effectively as possible it is necessary to ensure
that the right resources are available at the right time, at the right place and price and that the collective
wellbeing of the community is maximised. This involves assessing the costs and benefits of labour mobility to the
efficiency of all types of Australia’s regions and holistically as a nation.
To gain an understanding of these costs and benefits we need to appreciate the demand and supply of the
labour market now and in the future, the population, economic and market trends across Australia and
internationally, as well as understand why people chose to live where they do, their migration determinants and
drivers and those tools which enable and impede people to move and partake in the economy.

Geographic Labour Mobility, RAI PC Submission - August 2013 P A G E | 4
Introduction
The RAI has completed a number of research and policy papers exploring the topics of labour mobility and
regional issues in a regional context. These papers offer generous insight into the role of regions in Australia,
their future and the issues and opportunities facing them. They provide extensive background into labour
mobility and the considerations for national policy making and in examining the costs and benefits to regional
communities in attaining overall national efficiency.
To understand labour mobility issues in regional Australia and the associated policy considerations this submission
provides information on:
Why people move and relative motivations in regional Australia;
Impediments and enablers of mobility for regions and for different population groups;
Labour market efficiency and the role of mobility in achieving efficiency;
The trends in population movements;
Trends in normative, temporal and acute mobility events within Australia;
The implication of these trends on achieving labour mobility and its efficiency;
Assessing the efficiency of labour mobility through spatial sensitivity and regional types; and
The future policy discussions and points of further investigation.
Why people move
While the Productivity Commission is charged with examining the economic
outcomes from geographic labour mobility, it is essential to recognise that
people move for many and varied reasons including employment but also
lifestyle, family and education. The movement of people for any reason
takes with it the labour resources and capital of those people, providing the
new location with additional resources and the former location with fewer
resources to support economic growth and development over time.
Migration decision-making is strongly influenced by factors such as lack of
employment opportunities, drought, policies, education, better living
conditions, climate and family. Migration determinants are commonly divided
into two groups of factors: push and pull. Push factors are things that are
unfavourable about the area that one lives in, and pull factors are things
that attract one to another area (F.De Jong 2000).
The RAI recently completed regression analysis modelling to determine the
relationship between services, social outcomes and people’s intention to
leave the existing place of residence by different types of regions utilising
the Household Income and Labour Dynamics in Australia (HILDA) survey data.
The graph in Figure 1 plots the level of significance being unemployed and
having a low life satisfaction have on a persons’ preference to leave an
area in each type of region. To measure the significance the graph also
shows the average response of people with a desire to leave an area.
DRIVERS OF MOBILITY
• Employment opportunities
• Life Satisfaction
• Education levels
• Expectations to achieve
valued goals
• Income levels
• Lifestyle aspirations
• Health and education services
• Family connections
• Cultural migration behaviours
• Access to education
• Access to housing
• Drought
• Climatic conditions
• Access to health services
• Age – Stage of life
• Natural disasters
• Low confidence for future

Geographic Labour Mobility, RAI PC Submission - August 2013 P A G E | 5
It is clear that having low life satisfaction is of much greater significance to determining whether someone has a
desire to leave and that being unemployed is only marginally more significant than the average controlled score
for each type of region. The graph also shows that people in remote areas have a much higher preference to
move than any other region type, while those in very remote are less likely to have such a desire.
It is clear that migration choices are not made on employment alone. In fact, this analysis suggests that mobility is
primarily driven by an individual’s life satisfaction and as a result, decisions to move are bound to sense of
place, social well-being and the balance of financial, costs and gains from relocating (F De Long, 2000).
Figure 1. Probability of leaving by location
Source: RAI, 2013
Major impediments
Labour mobility is the “fluid” that allows the labour market to operate efficiently. Regional employment growth
disparities which create pockets of unemployment may be partly resolved by the improved job matching that
migration engenders. Yet mobility can only play this role if barriers to migration are low and inter-regional
migration (and commuting patterns) reflect changing spatial labour market conditions (Mitchell 2008).
Impediments to the free movement of labour exist in the decision making process of individuals and market
characteristics as well as the structural barriers presented through income, education and regulations.
Individuals may be negatively influenced by poor access to information regarding the availability of
employment, the employment conditions, low levels of confidence in the longevity of markets as well as personal
drivers such as access to health and education services, connectivity to the wider community and net incomes
gains.
0
10
20
30
40
50
60
Major City Inner Regional Outer regional Remote Very Remote
Pro
ba
bility b
y %
Probability of Leaving by location and indicator
Average* Unemployed Low Life Satisfaction
*Probability of leaving by region

Geographic Labour Mobility, RAI PC Submission - August 2013 P A G E | 6
Other impediments arise from licensing mandates, which preclude some people from participating across
administrative boundaries, the lack of transport links to provide incentives for workers to commute and the poor
dissemination of market signals which create lag times in the supply of markets, results in persistent pockets of
high unemployment in localities with low demand and poor connectivity to markets.
While access to services plays an important role in the migration decision making process, larger impediments
face the task of physically mobilising people. The largest differentials for those who participate in labour
mobility and those who don’t can be stratified by income and education levels. Therefore the major impediments
to labour mobility for individuals are education levels, skill levels, incomes and proximity to labour demand
(Reichlova 2005).
Those on low incomes are less likely to have the capital to enable them to move and seek other work and
because of lower skill sets, the outlay of relocating is less likely to be compensated by wage gains. These groups
are also less likely to commute to work because of the low wage compensation for the costs of daily travel.
The provision of welfare payments to lower socio-economic groups can also act as a disincentive to relocate for
employment as higher costs of living in locations with greater labour demand may not outweigh the gains made
through paid employment. People on lower incomes and with lower educational attainment often have extensive
networks on which they rely for social interaction, childcare and other communal types of cost sharing; benefits
which may not be readily available to them in new locations (Mitchell 2008). In contrast, those with higher
disposable incomes and educational attainment were more likely to engage others to perform these roles in new
localities because of their higher disposable incomes.
In regional Australia, the costs of transport to labour markets can be very high while the cost of living, such as
housing, childcare and schooling can be substantially less than in larger centres. Regional Australia therefore is
less likely to argue for net gains through labour mobility unless there are significant gains in income, particularly
those at the lower end of the socio economic spectrum. Rebalancing the
cost-benefit ratio for these groups in favour of moving would alleviate the
bindings of these barriers (Partridge and Rickman 2006 in Mitchell 2008).
Furthermore, some regions attract unemployed migrants because of a
combination of lower living costs and lifestyle advantages. These moves
are rational decisions but serve to take unemployed people away from
opportunities to be employed, building regional disadvantage and
reducing overall labour market efficiency.
Excluding these regions and their inhabitants as well as persons of lower
socio-economic status from participating in the labour mobility process
through structural impediments is likely to continue the divide between them
and the more upwardly mobile sectors of the community, leading to
cyclical disparity for those groups and therefore reduced overall
efficiency.
BARRIERS & IMPEDIMENTS
• High cost vs risk
• Education
• Lack of transport networks
• Lack of information
• High market elasticity
• Licensing mandates
• Market restrictions
• Welfare disincentives
• Lack of services
Geographic Labour Mobility, RAI PC Submission - August 2013 P A G E | 7
What enables labour mobility?
Enablers counter the impediments facing the movement of labour. These
include advances in technology which provide improved connectivity with
friends and family, good transport links which enable commuting patterns
and contraction of long distances which is essential in Australia, and a low
wage cost ratio so that the capital outlay of mobility is outweighed by the
gains in wage and salary.
Policy and government strategy can also play a large role in overcoming
impediments and reducing the risks involved with relocation and the
mobility of labour. Examples include relocation incentives, removalist costs,
better transport links, and improved job security.
Government policy can act to improve labour market efficiency by
providing networking opportunities, penalising welfare recipients who move to areas of high unemployment and
ensuring that such payments do not act as a disincentives to active labour force participation.
Disseminating information with respect to market signals to the wider population is also an important task of both
the private and public sectors. The fast dissemination of information allows faster reaction to trends, more
efficient allocation of labour resources and hence improved productivity outcomes. Importantly, in the more
remote areas of Australia, even with the current speed of communications, the adequate provision of information
is essential to keeping people in Australia’s outer regions engaged and able to make decisions in the here and
now.
Labour market efficiency in regional Australia
In considering the role of labour mobility in promoting labour market efficiency, economic growth and well-being
in Australia it is important to understand regional and local patterns of labour market efficiency.
[In]Sight – Australia’s Regional Competitiveness Index includes a theme identifying the relative labour market
efficiency across each of the 560 Local Government Areas (LGA’s) and 55 Regional Development Australia
(RDA) regions in Australia. The index includes four (4) indicators derived from the 2011 ABS Census and Social
Health Atlas of Australia – unemployment, youth unemployment, skilled labour, welfare dependence and
participation.
Analysis of this data, as seen in Table 1, shows that there is significant heterogeneity across labour markets of
Australia. These differences are minimised as the geographic area becomes larger. The greatest inequity across
regions occurs in the indicator of unemployment, with some regions experiencing almost no unemployment while
in other regions more than 50% of the labour force is searching for work.
ENABLERS
• Technology
• Policy – strategy
• Incentives
• Disseminating market
signals
• Low wage /cost ratio
• Transport links

Geographic Labour Mobility, RAI PC Submission - August 2013 P A G E | 8
Table 1: Spread across labour market efficiency indicators
Unemployment Youth unemployment
Participation rate
Skilled labour
Welfare dependence
LGA Min. 0.0% (Sandstone)
0.0% (Urana)
28% (Maralinga
Tjarutja)
8% (Cherbourg)
7% (Whitsunday)
Max. 61.6% 77.5% 93% 71% 83% (Yarrabah) (Yarrabah) (Mukinbudin) (Kent) (Weipa)
Range 62 pp 78 pp 65 pp 63 pp 76 pp
C.V. 0.73 0.62 0.12 0.31 0.29
RDA Min. 2.5% 5.4% 62% 21% 12% (Pilbara) (Pilbara) (Kimberley) (Pilbara) (Mackay Isaac
Whitsunday)
Max. 8.8% 17.3% 79% 46% 26% (Wide Bay
Burnett) (Wide Bay Burnett)
(Limestone Coast)
(ACT) (Gold Coast)
Range 6 pp 12 pp 17 pp 25 pp 14 pp
C.V. 0.23 0.20 0.05 0.16 0.16 Note: pp percentage points, C.V. coefficient of variation, LGA Local Government Area, RDA Regional Development
Australia (area) Source: RAI, 2013
Within these variations, regions can be differentiated into four categories:
1. Healthy labour market – regions with unemployment below the median across regions and labour force
participation above the median. All else being equal, these regions have highly efficient labour markets
but may also be experiencing shortages and stress.
2. High unemployment – regions with unemployment above the median, but have high labour force
participation. These regions may need to invest in policies that encourage up-skilling to reduce the
mismatch between labour supply and demand.
3. Low labour force participation – regions with unemployment below the median, but have low labour
force participation. A skew towards a very old or very young population suggests a need to attract
more people of working age. These regions may have problems with potential workers who have left
the labour market due to a lack of employment opportunities.
4. The unhealthy labour market – regions with both high unemployment and low participation.

Geographic Labour Mobility, RAI PC Submission - August 2013 P A G E | 9
Figure 2 maps these regions by Local Government Area for Australia as a whole.
Figure 2: Labour market efficiency in regional Australia
Source: RAI, 2013
This map shows that generally, regions with similar labour market outcomes are generally clustered together,
with large areas of healthy and unhealthy labour markets clearly visible. It also shows that while there are
spatial trends in labour market efficiency outcomes at the LGA level, these are not necessarily uniform within
RDA regions.
Understanding this pattern of labour market efficiency in Australia is essential in considering the role of
geographic labour mobility and associated policies in supporting increased efficiency of the national and
regional labour markets over time. Mobility will have different impacts depending on where it occurs (source
and destination regions) as well as the type of labour that moves.
RAI notes that opportunities are likely to exist for underperforming regions to benefit from close proximity to
regions with healthy labour markets but only if labour mobility (temporal or permanent) is facilitated within the
region. In contrast, loss of skilled labour and associated capital in regions with unhealthy markets or migration of
unemployed, low skilled workers to these regions may exacerbate inefficiencies.

Geographic Labour Mobility, RAI PC Submission - August 2013 P A G E | 10
Mobility trends
Over the top of this knowledge of the drivers of labour mobility and labour market situation at the regional
level, it is important to understand mobility trends - where people have actually been moving in Australia in
recent years.
The Regional Australia Institute has undertaken a significant analysis of population mobility information derived
from the ABS Census 2011 in association with the Australian Population
and Migration Research Centre at the University of Adelaide.
This analysis shows that overall, Australia has one of the most mobile
populations with more than a third of people changing their place of
residence between 2006 and 2011. As a result, we have the potential,
culturally, to have high labour movements and as such greater ability to
spatially match supply and demand than in many other countries where
people are less likely to move.
The following provides a list of key trends in general population
mobility (RAI, 2013);
• Young adults are the most mobile age group.
• There continues to be a net outflow of young people from
regional areas to either larger regional or capital cities.
• There is an increasing temporality in migration movements
because of the advance in travel and technology.
• Areas in the wheat belt of Australia have some of the highest
proportions of origin of temporal migrants.
• Western Australia and Queensland had the largest percentage
of people living in a different region from the 2006 to the
2011 ABS Census.
• The Murray Darling basin regions had the least population
movement between these same dates.
• The majority of coastal areas in Northern and Western
Australia are experiencing growth in the over 65 year age
group.
• Many coastal regions in South East Australia are experiencing
low growth in this age group.
POPULATION TRENDS IN AUSTRALIA
Between 2006 and 2011, 37.7% of
people changed their place of
residence. Of these, approximately
70% moved within their region.
Population turnover further
demonstrates high population mobility.
In Australia, the median population
turnover per 1000 residents, was
441.9.
Demographic trends
In the next two decades, the
number of people aged 65+ will
double.
27% of the Australian population
was born overseas. This is the
highest proportion for any middle-
sized or large country.
Between the 2006 and 2011 ABS
Census, the number of people
away from their place of residence
increased by 10.8%. This means
that more than 1 million people
are temporary migrants.
The combination of these trends, along
with a number of others, are presenting
Australia with a number of unique
opportunities and challenges.
Geographic Labour Mobility, RAI PC Submission - August 2013 P A G E | 11
• Western Australia and Central and North Queensland had the highest population growth as well as
population turnover (apart from capital cities).
• The tree and sea change migration continues to be a trend, though not as pronounced as in previous
years.
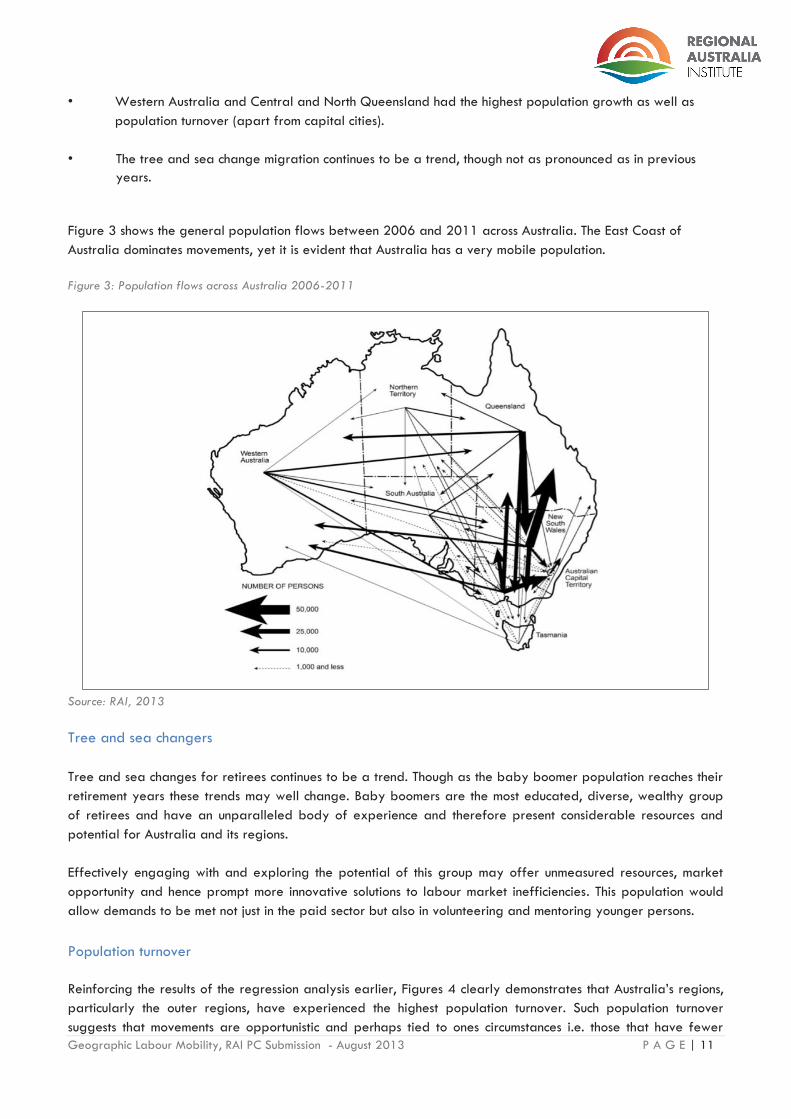
Figure 3 shows the general population flows between 2006 and 2011 across Australia. The East Coast of
Australia dominates movements, yet it is evident that Australia has a very mobile population.
Figure 3: Population flows across Australia 2006-2011
Source: RAI, 2013
Tree and sea changers
Tree and sea changes for retirees continues to be a trend. Though as the baby boomer population reaches their
retirement years these trends may well change. Baby boomers are the most educated, diverse, wealthy group
of retirees and have an unparalleled body of experience and therefore present considerable resources and
potential for Australia and its regions.
Effectively engaging with and exploring the potential of this group may offer unmeasured resources, market
opportunity and hence prompt more innovative solutions to labour market inefficiencies. This population would
allow demands to be met not just in the paid sector but also in volunteering and mentoring younger persons.
Population turnover
Reinforcing the results of the regression analysis earlier, Figures 4 clearly demonstrates that Australia’s regions,
particularly the outer regions, have experienced the highest population turnover. Such population turnover
suggests that movements are opportunistic and perhaps tied to ones circumstances i.e. those that have fewer

Geographic Labour Mobility, RAI PC Submission - August 2013 P A G E | 12
commitments and are in higher demand for their skills are more willing to resettle in these circumstances – as are
those whose opportunities are limited where they normally reside.
Figure 4: Population Turnover
Source: ABS, 2011, Article 1380.0.55.007 - Perspectives on Regional Australia: Population Growth and Turnover in Local
Government Areas (LGAs), 2006-2011 http://www.abs.gov.au/ausstats/[email protected]/mf/1380.0.55.007
Highest rates of mobility
The following groups have a higher proportion of people who moved residence between 2006 and 2011.
Importantly though, this does not indicate the distance of the move and does not distinguish between mobility of
the population as a choice as opposed to stability of housing options.
• Indigenous Australia;
• Unemployed persons;
• Separated or divorced persons;
• People living in group households, flats and rented dwellings are more mobile;
• People with higher levels of education; and
• People employed in agriculture have the lowest levels of mobility.
It is of particular note that not all groups follow the same mobility trend. Those who are mobile through
capability i.e. those with higher education levels and those who are younger and in group households are more
likely be able to move for personal and financial reasons. Labour mobility for these groups therefore may be
beneficial as they are more likely to have the human and financial capital to move to where the demand for
labour might be; benefitting the recipient regions or communities. Conversely, this also means that these people,
such as doctors and professionals, are difficult to retain in areas with fewer opportunities. This then has negative

Geographic Labour Mobility, RAI PC Submission - August 2013 P A G E | 13
flow on effects to the community and has the potential to initiate a downward spiral of reduced population,
services and opportunity.
Similarly, those who are perhaps more mobile because of housing options or lack thereof, such as separated or
divorced persons and unemployed persons, are less likely to benefit from labour mobility as they may not have
the resources to move to where labour demand is highest or do not have the skills. So while these groups have
high mobility rates there is more likely to be negative associations with them having to move.
Mobilising these lower socio-economic groups so that mobility is a positive experience and so they can in effect
be a ‘labour resource’ is essential to enabling them to participate in the labour market more freely. This is a
highly significant measure to reduce the disparity between the have and the have nots and can lead to
improved overall national and regional efficiency.
Mobility events
It is important to note that as well as understanding the general nature of geographic labour mobility in the
economy, there are a series of specific labour market events linked to rapid economic changes and disruptions
which involve concentrated movements of labour. These events include very large and geographically
concentrated economic expansions (most recently the ‘resources boom’), large and geographically concentrated
economic contractions (structural adjustment) and natural disasters. Each of these events have significant
implications for regions where they occur and the economy as a whole. They also often bring dedicated policy
responses that may act to facilitate or mitigate labour movements.
The Resources boom
The expansion of the mining industry has seen a rapid increase in both permanent and temporary migration. The
impacts of these on the efficiency of the labour market and productivity of the economy are myriad.
While on the one hand temporal labour movements including Fly In Fly Out (FIFO) and Drive In Drive Out (DIDO)
has enabled labour supply to meet a rapid increase in local labour demand, on the other hand, the temporal
nature of this supply has meant large influxes of people in remote locations with inadequate infrastructure and
service provision. Figure 5 shows the concentration of high growth and high turnover population movements
across Australia in these remote localities, suggesting these populations are highly fluctuating. Where mobile
labour is able to outcompete locals for new employment opportunities or employers prefer mobile labour,
mobility exacerbates the leakage of economic benefits from the local community. Simultaneously, these
communities are placed under significant pressure to provide services for people whose primary residence is in
another town or state and whose longevity is finite, whilst tackling the inflationary costs of living for existing
residents due to the large increase in housing and service demand (RAI, 2013 – unpublished).

Geographic Labour Mobility, RAI PC Submission - August 2013 P A G E | 14
Figure 5: High growth and high turnover trends across Australia
Source: ABS 2011, Article 1380.0.55.007 - Perspectives on Regional Australia: Population Growth and Turnover in
Local Government Areas (LGAs), 2006-2011 http://www.abs.gov.au/ausstats/[email protected]/mf/1380.0.55.007
There is no question that labour mobility during the resources boom has been essential for the nation to meet
soaring demand for resources and has also allowed wealth to be more widely distributed throughout Australia,
particularly in those regions where the local economy did not offer similar job remuneration.
Whether this culminated in allocative efficiency however is unlikely. The ability of labour FIFO/DIDO of a
locality allows a matching within the labour market but in terms of overall national efficiency and productivity
the end result is much more complex. Whether labour mobility providing workers for roles with lower skill
thresholds that could reasonably be met by local under-utilised labour creates further disparities by both
entrenching local unemployment and reducing the availability of labour in other regions is an important
consideration for policy in the aftermath of the boom.
Understanding too, that the location of physical economic activity may not indicate the location of labour
demand is also essential, as in the case of the mining sector for every ten jobs created only two will be in the
host community. Such a figure assists with understanding the complexity of labour market distribution.
Overall, FIFO/DIDO movements highlight the extent to which labour mobility can affect local efficiency and the
policies which relate to the supply of labour can impact on national and regional productivity and the longevity
of regional prosperity. There are as yet no clear solutions to this conundrum but it is an important consideration
for the inquiry given Australia’s recent experience.
Geographic Labour Mobility, RAI PC Submission - August 2013 P A G E | 15
Structural adjustment
Significant and often rapid economic change is a permanent feature of regional economies in Australia. The
combination of an open national economy and small, less diverse often natural resource based regional
economies and the long term transition to a services focused knowledge economy in the developed world
ensures that change will continue to be a challenge and opportunity for regional Australia.
The size, composition and characteristics of industries will continue to shift as individuals and businesses seek to
respond to changing market conditions. This is referred to as structural adjustment in economics and policy.
This process brings about changes to the economy and spatial distribution of its population. Workers employed
in a closing firm often need to move to other regions where there is demand for their labour if the local labour
market cannot absorb the newly available labour. If mobility does not occur then this can lead to or exacerbate
local and regional unemployment.
There is a long term record of policy interventions in this space including the provision of relocation incentives to
encourage movement where local job opportunities are limited. The role, availability and outcomes of these
policy approaches are an important consideration in any review of labour mobility.
Natural disasters
The frequency and intensity of natural disasters have caused severe social, physical and economic devastation in
recent years - a trend which is expected to continue. Population displacement within these communities has a far
reaching effect on the economic and community recovery process of the community. Case studies undertaken by
the RAI in the severely impacted regional communities of Cardwell (QLD) and Marysville (VIC) showed the
extent of population change that can occur following a disaster.
In 2006, the estimated resident population of Marysville was 517. Yet according to 2011 ABS Census, the
population had dropped by over 50% to 233 residents. In addition to the reduction in population since the
Black Saturday fires, the age profile has changed dramatically. In 2006, Marysville’s age profile showed 36%
aged 55 years and over compared to 24% for Australia. By 2011, nearly 47% were aged 55 years and
older. The median age in 2006 of 46 years had increased to 52 in 2011.
The data reflects of the loss on business and employment opportunities and the need for younger workers to
move away in search of employment. Older Australians also tend to spend less which also has an impact on the
local economy.
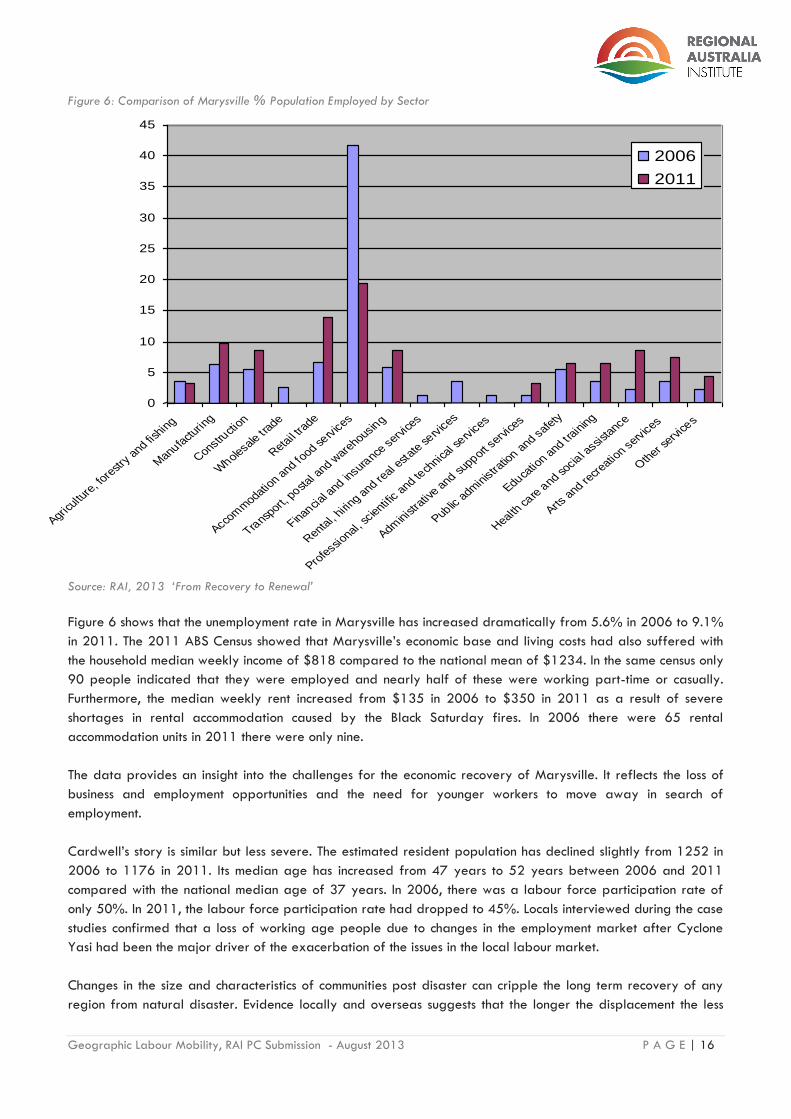
Figure 6 below displays the change in the nature of employment in Marysville from 2006 to 2011. The
dominance of the “Accommodation and food services” sector, an indicator of the importance of tourism, is
apparent from the table as is its significant decline by 2011.
Geographic Labour Mobility, RAI PC Submission - August 2013 P A G E | 16
% Employment by Sector 2006 vs 2011
0
5
10
15
20
25
30
35
40
45
Agricultu
re, f
orestr
y and fi
shin
g
Manufa
cturin
g
Constructi
on
Wholesale tr
ade
Retail t
rade
Accom
modatio
n and fo
od serv
ices
Transp
ort, p
ostal a
nd ware
housing
Financial a
nd insura
nce s
ervice
s
Rental,
hiring a
nd real e
state
serv
ices
Profe
ssional,
scientif
ic and te
chnica
l serv
ices
Administ
rativ
e and su
pport serv
ices
Public a
dmin
istratio
n and s
afety
Educatio
n and tr
aining
Health ca
re a
nd socia
l assis
tance
Arts a
nd recr
eation s
ervices
Oth
er serv
ices
2006
2011
Figure 6: Comparison of Marysville % Population Employed by Sector
Source: RAI, 2013 ‘From Recovery to Renewal’
Figure 6 shows that the unemployment rate in Marysville has increased dramatically from 5.6% in 2006 to 9.1%
in 2011. The 2011 ABS Census showed that Marysville’s economic base and living costs had also suffered with
the household median weekly income of $818 compared to the national mean of $1234. In the same census only
90 people indicated that they were employed and nearly half of these were working part-time or casually.
Furthermore, the median weekly rent increased from $135 in 2006 to $350 in 2011 as a result of severe
shortages in rental accommodation caused by the Black Saturday fires. In 2006 there were 65 rental
accommodation units in 2011 there were only nine.
The data provides an insight into the challenges for the economic recovery of Marysville. It reflects the loss of
business and employment opportunities and the need for younger workers to move away in search of
employment.
Cardwell’s story is similar but less severe. The estimated resident population has declined slightly from 1252 in
2006 to 1176 in 2011. Its median age has increased from 47 years to 52 years between 2006 and 2011
compared with the national median age of 37 years. In 2006, there was a labour force participation rate of
only 50%. In 2011, the labour force participation rate had dropped to 45%. Locals interviewed during the case
studies confirmed that a loss of working age people due to changes in the employment market after Cyclone
Yasi had been the major driver of the exacerbation of the issues in the local labour market.
Changes in the size and characteristics of communities post disaster can cripple the long term recovery of any
region from natural disaster. Evidence locally and overseas suggests that the longer the displacement the less

Geographic Labour Mobility, RAI PC Submission - August 2013 P A G E | 17
people are likely to move back to their community. People with skills sets which are in higher demand i.e.
doctors, engineers etc. are also generally the first to relocate when the local economy begins to struggle.
Furthermore, post disaster reconstruction efforts bolster the local economy in the short term but often lead to
decline in the long term by undermining the local economy. Labour mobility can have a large negative impact on
the local economy particularly in the long term. The loss of higher skilled workers and the influx of construction
workers for short periods create further downward pressure on the local economy. Areas with greater exposure
to natural disasters are therefore likely to have a heightened sensitivity to the impacts of labour mobility,
particularly those localities with already fragile economies.
While this event may seem ancillary to a discussion of the economic issues associated with labour mobility, the
consequences for these regions in the long term are severe and potentially avoidable with good policy and
implementation of recovery efforts.
Soon to be released RAI research recommends that a focus on provision of temporary housing in or near the
community, supporting businesses to resume trading as soon as possible (thereby restoring jobs), directing
recovery resources where possible and appropriate through local supplier and reducing competition for local
businesses from charitable donations of goods and services can all serve to reduce the population displacement
effect of a disaster and support more rapid re-establishment of a self-sustaining local economy in impacted
communities.
What this means for labour mobility efficiency?
Evidently, there are a wide range of factors involved in determining where labour will be demanded in the
future and where labour supply may exist.
Labour supply and demand cannot in the real world operate in equilibrium as the movement of people is driven
by a multitude of factors other than employment. Furthermore, simply matching supply with demand with the
most easily obtained solution will not in itself automatically ensure efficiency and maximising of social benefits at
the National, State or regional level.
This is because the benefits of matching individual resources can often come at the costs of other groups and
localities that are not able to participate or are not in high demand by the market.
Given the ability to stratify the differing profiles of regions through characteristics such as human capital, labour
demand, future markets and existing supply, a regional sensitivity model may be a useful tool to examine
labour mobility efficiency. (For more information see the below section on spatial sensitivity modelling)

Geographic Labour Mobility, RAI PC Submission - August 2013 P A G E | 18
The three types of regions
[In]Sight demonstrates that regions across Australia are very diverse and should be treated as such in policy and
decision making as well as in labour mobility. Three distinct types of regions emerge in RAI research. These
include:
Inner regional – usually in close proximity to larger metropolises with strong endogenous growth
potential, great lifestyle opportunities but a need to be physically connected to the city through good
roads, rail and communications infrastructure to attract mobile workers and be able to provide the
services these workers will demand;
Outer regions with resources of high demand - these are localities who have high labour demand
because of the comparative advantages presented by the natural and business environment and
suitable conditions to capitalise on these advantages; and
Outer regions with resources of low demand – these are localities whose comparative advantage has
been in less demand due to, for example structural adjustments, where there is limited resources.
Each of these are considered to have different responses to labour mobility resulting in varied costs and benefits
which require consideration in measuring efficiency. Further analysis of [In]Sight data would enable these regions
to be identified and their needs and opportunities in relation to labour mobility further understood.
What needs to be considered in assessing overall
efficiency of labour mobility?
Optimising efficiency through labour mobility requires, in the first
instance, a strong framework. To appreciate the efficiencies, RAI has
developed a cost benefit framework with regard to Australia’s regions.
The framework outlines some of the considerations necessary in
exploring overall national efficiency in the derivation of a cost benefit
analysis for labour mobility. The suggestions in this list consider the
three distinct regions, the benefits and impacts of labour mobility
patterns and trends on these areas.
In exploring the benefits and costs associated with labour mobility,
stratification of regional types is useful in determining a set of
efficiency measures at a regional scale for national level efficiency.
Whilst such a model for an analysis would require extensive input, RAI
offers the following themes (see text box) and considerations (Table 2)
that could be adopted in calculating costs and benefits to efficiency.
SUGGESTED COST BENEFIT ANALYSIS
THEMES FOR LABOUR MOBILITY
• Labour force composition
• Market connectivity
• Population composition
• Human Capital
• Business confidence
• Access to service
• Natural resources
• Housing costs
• Tech readiness
• Innovation
• Temporality of market
• Education levels
• Access to education
• Educational attainment
• Cultural behaviours to mobility
• Economic fundamentals
• Access to transport

Geographic Labour Mobility, RAI PC Submission - August 2013 P A G E | 19
Table 2: Considerations for understanding the costs and benefits of labour mobility in different types of regions
Inner regional Outer egional
(high resource demand)
Outer regional
(low resource demand)
Labour
mobility
impacts
Growth in population due to
ability to commute & improved
connectivity
Influx of workers to meet
demand and potential for
further influx
Outflow of workers to meet
demand elsewhere and low
retention rates
Benefits
Improved connections to city More skilled labour Call to rethink comparative
advantages
New local market opportunities
Demand for improved services
(though unlikely to be met in
short term)
Less competition for job
seekers
Increased social capital Increased wealth Cheaper housing
Increase in wealth New local market opportunities Impetus for more innovative
solutions to service delivery
Improved business confidence
and entrepreneurialism
Improved business confidence
and entrepreneurialism
Costs
Strain on local resources and
services
Strain on local resources and
services Loss of skilled workers
Increased housing costs Increased housing costs Decreased average wealth
Increased congestion Boom-bust potential Loss of services
Divergence between rich and
poor
Divergence between rich and
poor Loss of business confidence
Pressure on lower income
households
Loss of employment
opportunities
Temporary workers Outflow of families

Geographic Labour Mobility, RAI PC Submission - August 2013 P A G E | 20
Spatial sensitivity modeling
Examining geographic labour mobility efficiency is about meeting the demand for labour in a way that
maximises benefits for the local community, the individual and the nation as a whole.
The development of a regional sensitivity model offers the dual advantage of increasing the capability to
identify regions that will need to increase their workforce, as well as those regions that would offer suitable
sources of labour to meet these needs. This would allow for the development and implementation of suitable
strategies to achieve greater labour force efficiency.
RAI’s [In]Sight tool offers a unique look into the make-up of Australia’s regions. The provision of raw data allows
its application in a number of new ways. For the purposes of labour mobility, this data could be utilised to build
a regional sensitivity model to better understand the spatial patterns of labour mobility to understand who is
most vulnerable and where mechanisms to improve efficiency should be focused.
[In]Sight has the dual benefit of providing information to better understand the current labour force, their skill
sets and how they are currently being utilised, as well as providing information that (when coupled with market
projections) would allow for an assessment of a region’s future potential. Relevant information would include the
current business environment, the business sophistication of communities and their connectivity with export
markets, the human capital of regions, the educational attainment of residents and their access to education as
well as a host of other factors regarding industry strengths and natural resources that would allow an expansive
framework for identifying and assessing future trends, implications and the relative sensitivity to labour mobility
for every corner of Australia.
Conclusion and policy imperatives Labour mobility is essential for maximising both national and regional productivity. In Australia’s regions the
availability of labour and a strong labour market where supply meets demand is vital to economic development.
Yet employment is not the only factor in the decision to move and the mobility of labour and people to meet
economic opportunity is impeded by social, economic and structural issues.
Estimating the full costs and benefits of labour mobility requires considering the impacts of those who can’t be
mobilised as much as those who can. It also requires considering the costs of regions that are likely to benefit
and those that are more likely to see mobility further entrench existing regional labour market issues.
The relative mobility of different components of the labour force and existing regional disparities therefore
creates a complex context for analysis and policy action. From the information available to RAI it seems
imperative that:
Policy works to reduce the proportion of the regional workforce that is mobility limited and the
concentrations of this workforce in particular regions.
o This requires the inquiry to facilitate a better understanding of the complex issues that underpin
participation and the impediments to mobility for key groups, as well as regional push and pull
factors that explain the current conditions.

Geographic Labour Mobility, RAI PC Submission - August 2013 P A G E | 21
The likely labour dynamics in regional Australia in response to economic conditions are assessed,
focusing on the geographical based prediction of skills shortages of the future. This will facilitate local,
state and national policy settings that:
o Enable regions to mobilise the potential local workforce to compete with mobile labour during
periods of economic expansion. This would involve proactively equipping those lower skilled
workers and workers from sectors experiencing decline, with skills which will likely be of high
demand now and in the future.
o Ensure the negative experiences of the recent mining boom are not repeated by enabling
regions to minimise the social and economic impact of significant labour inflows while realising
economic opportunity.
Policy initiatives for the management of structural adjustment and natural disasters in regions account for
the role of labour mobility in facilitating positive and negative outcomes and respond accordingly.
Policy recognises that people move for reasons other than employment and employment is often not
enough for someone to move.
o Labour deficits should be addressed through a holistic approach which considers migration
determinants, impediments and enablers.
o This includes transparent, accessible and timely dissemination of information regarding
employment, conditions, housing, social networks, infrastructure and services to potential labour
sources for regional areas.
There is support for the greater migration of a skilled workforce to inner regional lifestyle areas through
continuing to improve their connections to nearby capital cities through enhanced physical and
communications infrastructure and that these initiatives are integrated into Australia’s urban
development strategies.

Geographic Labour Mobility, RAI PC Submission - August 2013 P A G E | 22
References
ABS 2011, Article 1380.0.55.007 – ‘Perspectives on Regional Australia: Population Growth and Turnover in Local Government
Areas (LGAs)’, 2006-2011 http://www.abs.gov.au/ausstats/[email protected]/mf/1380.0.55.007
F. De Jong, G, 2000. ‘Expectations, gender, and norms in migration decision-making’ Population Studies, Vol 54. No. 3
pp307-319
Hutson, P et. al. 2007. ‘Human settlements: Population and settlement patterns’ Department of Local Government,
Planning, Sport and Recreation, Queensland
Mitchell, W. 2008. ‘Labour Mobility and Low-paid Workers’ Centre of Full Employment And Equity, Report commissioned by
the Australian Fair Pay Commission
Reichlova N, 2005. ‘Can the theory of motivation explain migration decisions’ Working paper UK FSV – IES.
Regional Australia Institute, 2013. ‘Population Dynamics in Regional Australia’ (forthcoming)
Regional Australia Institute, 2013. ‘[In]Sight – Australia’s Regional Competitiveness Index’
Productivity Commission Australia, 2013 ‘On efficiency and effectiveness: some definitions’ Productivity Commission - Staff
Research Note

Geographic Labour Mobility, RAI PC Submission - August 2013 P A G E | 23
Contacts and further information
To discuss this submission please contact;
Jack Archer
General Manager - Policy & Research
Or
Vanessa Barnett
Manager – Policy
Tel: (02) 6260 3733
Further information can be found at www.regionalaustralia.org.au