the costs and benefits of international trade in illinois · the costs and benefits of...
TRANSCRIPT
THE COSTS AND BENEFITS OF
INTERNATIONAL TRADE IN ILLINOIS
Estimating Impacts on Manufacturing and the Economy
July 20, 2016
Frank Manzo IV, MPP Policy Director, Illinois Economic Policy Institute
Robert Bruno, PhD Director, Project for Middle Class Renewal School of Labor and Employment Relations University of Illinois at Urbana-Champaign
Jill Manzo Midwest Researcher, Midwest Economic Policy Institute
THE COSTS AND BENEFITS OF INTERNATIONAL TRADE IN ILLINOIS
i
Executive Summary
There has been a general consensus among economists that international free trade is an important
source of economic growth for countries. International trade allows nations to specialize, promotes innovation, and has led to higher income growth and longer life expectancy. However, recent evidence finds that trade hurts local jobs and worsens income inequality. Mass job displacement can have significant effects on the national economy and public budget.
International trade supports many American jobs, especially high-skilled service occupations. In fact, international trade supported 1.8 million more jobs in 2014 than in 2009. Sectors such as energy, transportation, retail trade, wholesale trade, financial services, and professional services have continued to grow, in part, because of trade.
However, international trade has negatively affected the number of manufacturing jobs in the United States. The United States has lost about 4.5 million manufacturing jobs since the ratification of NAFTA in January
1994. Abetting the country’s growing trade imbalance is the prevalence of currency manipulation by more than 20 countries. U.S. trade with China alone has accounted for between 1.5 million and 2.4 million American manufacturing jobs lost.
As the 5th-largest exporter state and the 6th-largest importer state in the nation, Illinois is particularly exposed to international trade. Imports and exports help make Illinois the transportation hub of America. In 2010, 707 million tons of commodities were transported throughout Illinois. While the
vast majority of commodity tonnage originated in or was destined for other U.S. states, approximately 17.5 percent was traded internationally. Illinois’ largest international trade partner by commodity flow is Canada (6.7 percent). Countries in Asia and Oceania (6.0 percent) are also major trade partners of Illinois.
Illinois, however, has lost more than 100,000 total manufacturing jobs over the past decade. While the aggregated “trade, transportation, and utilities” industry has offered possibilities for some blue-collar
workers to find work in another sector of the Illinois economy, the 17,000 jobs gained in this industry have
not nearly been enough to cover the loss of manufacturing jobs.
Due to both trade and automation, the number of factories in Illinois has increased and manufacturing output in Illinois has increased, even though over 100,000 total manufacturing jobs have been lost. While manufacturing employment has declined by 15 percent since January 2006, the number of manufacturing
establishments has increased by 6 percent and real manufacturing output has grown by 2 percent over the same time. New factories are opening in Illinois, but they are using automated technologies that require less human labor.
The result has been mass displacement of manufacturing production workers in Illinois. From 2010 to 2015, more than 270,000 Illinois workers in manufacturing production occupations were separated from their jobs, including those who voluntarily left their jobs and those who were fired.1
• 43 percent became employed in other occupations in Illinois – especially in transportation and moving materials careers, food preparation and food service jobs, office administration and support
jobs, and construction occupations; • 13 percent left to become students and upgrade their skillsets for new careers; • 18 percent were unemployed; and • 27 percent retired or otherwise dropped out of the labor force entirely.
1 Note that production worker displacement is different than total manufacturing employment. Displacement is only one side of the turnover equation. There were new hires and other job ascensions during this period which offset some of the losses. This is why number of workers displaced from 2010 to 2015 is greater (more than 270,000) than the total number of jobs lost from 2006 to 2015.
THE COSTS AND BENEFITS OF INTERNATIONAL TRADE IN ILLINOIS
ii
The vast majority of displaced blue-collar production workers suffered a pay cut. The average annual
income of displaced production workers in these new jobs is $36,300 per year, or $7,673 (17 percent) less than the earnings of current blue-collar production workers in Illinois.
This drop in average annual income translated into a $3.65 billion total income loss among former blue-collar production workers in Illinois from 2010 to 2015, or a $608.3 million annual decrease.
The combined impact of production worker displacement and increased manufacturing output is a net 1,510-job drop in total employment every year in Illinois. Most of the 47,000 workers that are displaced every year find other jobs, even though most are lower paying. This makes the jobs impact of production worker displacement appear smaller in the economic data. Meanwhile, the added productivity of manufacturing companies helps to create new jobs and offset the effect of mass displacement. Still, the displacement of production workers causes a drop in consumer demand that results in more jobs lost than gained. However, the two trends cause a net $1.16 billion increase in Illinois’ economy every year.
This is the paradox of international free trade: While trends in manufacturing have caused total employment losses in Illinois, they have expanded the state’s economy. The gains from trade have become concentrated amongst the wealthy. Workers displaced from jobs that once paid a living wage have been forced to find employment in other, mostly low-paying, sectors of the economy. The overall impact has been to widen the income gap between the rich and the poor in Illinois.
Illinois must prepare its workforce for the future. Manufacturing is a critically important industry to
develop. Manufacturing employment is typically higher paid, generates increased economic value, and triggers additional employment to support manufactures. At the state-level, Illinois can take at least five steps to re-develop its manufacturing sector. Illinois needs to foster a better-educated and trained
workforce, promote increased research and development, significantly improve transportation infrastructure, base energy decisions on Illinois’ natural competitive advantages, capitalize on increasing demand for clean energy, and develop a consultative capacity in “reshoring” expertise. These recommendations would improve manufacturing competitiveness in the state.
Where displacement of production workers does occur, protecting the state’s prevailing wage law in the construction industry, making college more affordable and accessible, and increasing investment in worker retraining programs would help lift up workers who transition to other occupations. Raising the minimum wage would also help many displaced manufacturing workers who are forced to find work in food service,
food preparation, and building and grounds crew occupations.
International free trade and technological advancements provide substantial benefits to the Illinois
economy. Mitigating the losses of these positive forces, especially on the manufacturing industry, is crucial to the future success of Illinois.
THE COSTS AND BENEFITS OF INTERNATIONAL TRADE IN ILLINOIS
iii
Table of Contents
Executive Summary i
Table of Contents About the Authors
iii
iii
Introduction
1
International Trade and the U.S. Economy The Decline of Good-Paying Manufacturing Jobs in America
1
3 International Trade, Manufacturing, and Transportation in Illinois
5
The Economic Impact of Production Worker Displacement in Illinois
8
Implications on Income Inequality Potential Recommendations for Illinois
10
11
Conclusions
12
Sources
14
About the Authors
FRANK MANZO IV, MPP is the Policy Director of the Illinois Economic Policy Institute (ILEPI). He earned a Master of Public Policy from the University of Chicago Harris School of Public Policy and a Bachelor of Arts in Economics and Political Science from the University of Illinois at Urbana-Champaign. He can be contacted at [email protected]. ROBERT BRUNO, PHD is a Professor at the University of Illinois at Urbana-Champaign School of Labor and Employment Relations and the Director of the School’s Labor Education Program. He is also Director of the Project for Middle Class Renewal at the University of Illinois at Urbana-Champaign. He earned his Doctor of Philosophy in Political Theory from New York University and his Master of Arts in Political Science from Bowling Green State University. He can be contacted at [email protected]. JILL MANZO is the Midwest Researcher at the Midwest Economic Policy Institute (MEPI). She earned a Bachelor of Arts in Political Science and International Studies from Iowa State University. She can be contacted at [email protected].
THE COSTS AND BENEFITS OF INTERNATIONAL TRADE IN ILLINOIS
1
Introduction
The advantages and disadvantages of international trade are often debated by economists, politicians, and
think tanks. International trade has both positive and negative implications on countries, populations, and economies. Historically, there has been a general consensus among economists that international trade allows countries to specialize in industries that they have a comparative advantage in and is essential for economic growth in the presence of globalization. Recent evidence, however, has suggested that trade hurts local jobs and worsens income inequality. Mass job displacement can have significant effects on the national economy and public budget.
The arguments for international free trade are compelling. Increased international trade means more consumers are available to purchase American goods and services, which is good for American businesses and workers. Implementing free trade agreements with both wealthy countries and developing countries provides citizens with access to quality goods at cheaper prices. The fact that trade amounts to one-sixth of
the total economic activity in the world– and 10 times as much as all military spending– illustrates that trade is profitable (Goldstein & Pevehouse, 2008).
Trade is an important source of wealth generation for countries (OECD, 1999). Developing countries that become more integrated into the global economy tend to have higher income growth, better schooling, and longer life expectancy (Soubbotina & Sheram, 2000; Goldstein & Pevehouse, 2008). Trade also promotes
innovation in an economy, as productivity improvements are advanced in response to global competition. Additionally, while hundreds of thousands of workers are negatively impacted by free trade as jobs are shifted overseas, the gains from comparative advantage tend to improve overall economic wellbeing. In
theory, if the total benefits of trade exceed the costs, the “winners” can compensate the “losers.”
It is possible to redistribute income such that the winners are better off and the losers are no worse-off than they were prior to trade. Take an example with one CEO and ten workers. Suppose that, prior to international trade, the CEO earns $250,000 and the ten workers all earn $50,000. Assume further that the CEO takes home $500,000 and the ten workers each suffer a $10,000 loss after trade. Economists argue
that, in principle, $100,000 could be redistributed from the CEO to the ten workers so that they all once again earn $50,000, while the CEO’s pay increases from $250,000 to $400,000. The workers are compensated so that they do not “lose” from trade, the CEO “wins,” and the economy expands in this simplified example.
However, critics of international trade agreements have a valid argument in claiming that this redistribution rarely happens in practice and is highly unlikely to occur in non-union workplaces or without government policies that encourage gain sharing with employees. Income inequality has reached levels not seen since the Great Depression. CEO pay has skyrocketed relative to the average worker (Mishel & Davis, 2015). The income losses experienced by American manufacturing workers have largely been due to
international trade. Once employing one-third of all workers in Illinois in the 1950s, the manufacturing sector now employs just one out of every ten workers in the state (Manzo, 2016). Today, U.S. consumers
buy international products that are manufactured at a lower price by lower-paid workers abroad, limiting production jobs in America.
International Trade and the U.S. Economy
In 2015, the United States had an annual GDP of $17.9 trillion (BEA, 2016a). The United States produces and consumes millions of products each day. International trade allows the country to import cheaper-priced goods while also exporting specialized goods to global customers. China, Canada, and Mexico are the
THE COSTS AND BENEFITS OF INTERNATIONAL TRADE IN ILLINOIS
2
United States’ three largest trading partners, accounting for $1.7 trillion in U.S. exports and imports in 2015
(Census, 2015).
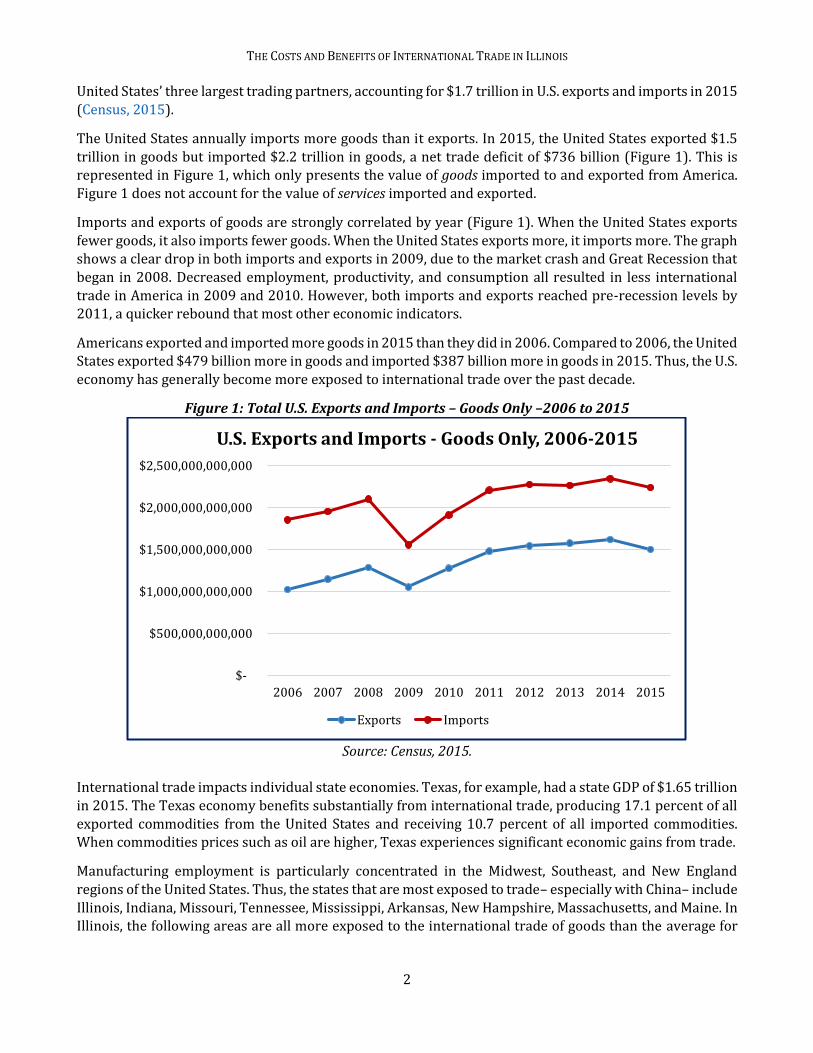
The United States annually imports more goods than it exports. In 2015, the United States exported $1.5 trillion in goods but imported $2.2 trillion in goods, a net trade deficit of $736 billion (Figure 1). This is represented in Figure 1, which only presents the value of goods imported to and exported from America. Figure 1 does not account for the value of services imported and exported.
Imports and exports of goods are strongly correlated by year (Figure 1). When the United States exports fewer goods, it also imports fewer goods. When the United States exports more, it imports more. The graph shows a clear drop in both imports and exports in 2009, due to the market crash and Great Recession that began in 2008. Decreased employment, productivity, and consumption all resulted in less international trade in America in 2009 and 2010. However, both imports and exports reached pre-recession levels by 2011, a quicker rebound that most other economic indicators.
Americans exported and imported more goods in 2015 than they did in 2006. Compared to 2006, the United States exported $479 billion more in goods and imported $387 billion more in goods in 2015. Thus, the U.S. economy has generally become more exposed to international trade over the past decade.
Figure 1: Total U.S. Exports and Imports – Goods Only –2006 to 2015
Source: Census, 2015.
International trade impacts individual state economies. Texas, for example, had a state GDP of $1.65 trillion in 2015. The Texas economy benefits substantially from international trade, producing 17.1 percent of all exported commodities from the United States and receiving 10.7 percent of all imported commodities. When commodities prices such as oil are higher, Texas experiences significant economic gains from trade.
Manufacturing employment is particularly concentrated in the Midwest, Southeast, and New England regions of the United States. Thus, the states that are most exposed to trade– especially with China– include Illinois, Indiana, Missouri, Tennessee, Mississippi, Arkansas, New Hampshire, Massachusetts, and Maine. In Illinois, the following areas are all more exposed to the international trade of goods than the average for
$-
$500,000,000,000
$1,000,000,000,000
$1,500,000,000,000
$2,000,000,000,000
$2,500,000,000,000
2006 2007 2008 2009 2010 2011 2012 2013 2014 2015
U.S. Exports and Imports - Goods Only, 2006-2015
Exports Imports
THE COSTS AND BENEFITS OF INTERNATIONAL TRADE IN ILLINOIS
3
the rest of the nation: Rockford, the Quad Cities, Decatur, the Chicago region, and southeastern counties
(Autor et al., 2016).
Even though trade has negatively impacted certain jobs, international trade and exports support many American jobs, especially high-skilled service jobs (Autor, 2010). The United States exports $2.23 trillion in goods and services combined, supporting 11.7 million U.S. jobs. In fact, trade supported an additional 1.8 million jobs in 2014 compared to 2009 (International Trade Administration, 2016). Though manufacturing sectors have declined due to competition in world markets, other sectors such as energy, transportation, retail trade, wholesale trade, financial services, and professional services have continued to grow, in part,
because of international trade.
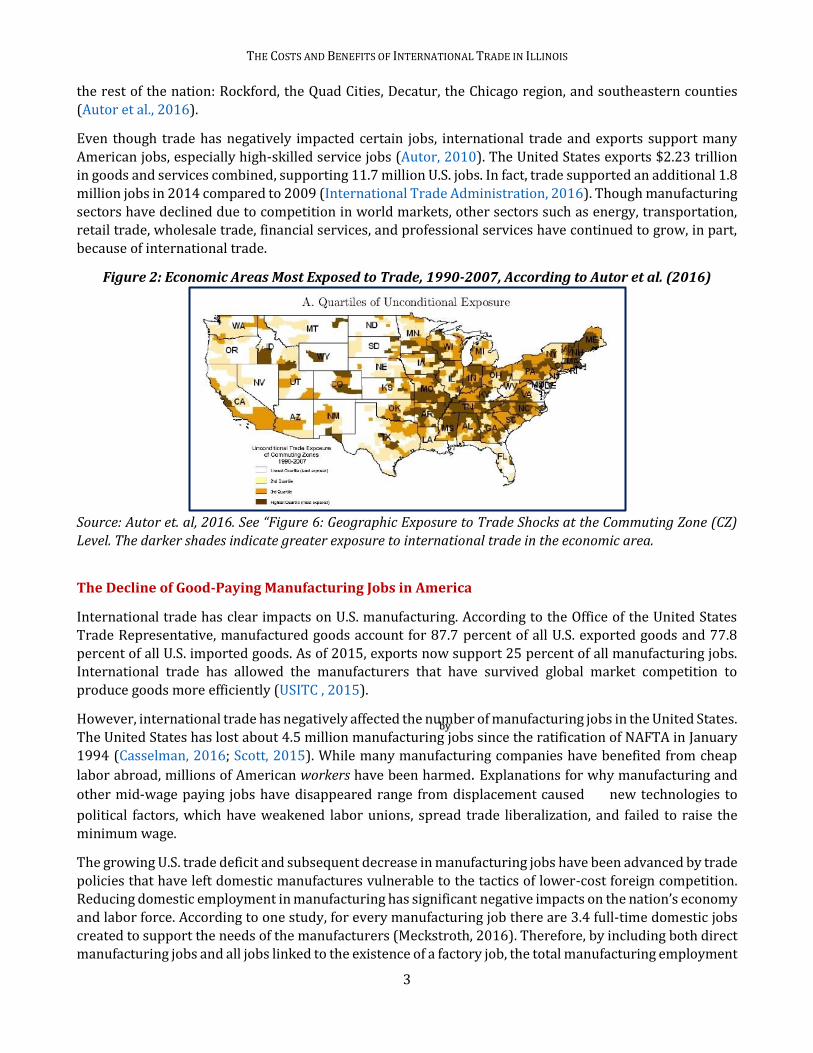
Figure 2: Economic Areas Most Exposed to Trade, 1990-2007, According to Autor et al. (2016)
Source: Autor et. al, 2016. See “Figure 6: Geographic Exposure to Trade Shocks at the Commuting Zone (CZ) Level. The darker shades indicate greater exposure to international trade in the economic area.
The Decline of Good-Paying Manufacturing Jobs in America
International trade has clear impacts on U.S. manufacturing. According to the Office of the United States Trade Representative, manufactured goods account for 87.7 percent of all U.S. exported goods and 77.8
percent of all U.S. imported goods. As of 2015, exports now support 25 percent of all manufacturing jobs. International trade has allowed the manufacturers that have survived global market competition to produce goods more efficiently (USITC , 2015).
However, international trade has negatively affected the number of manufacturing jobs in the United States. The United States has lost about 4.5 million manufacturing jobs since the ratification of NAFTA in January 1994 (Casselman, 2016; Scott, 2015). While many manufacturing companies have benefited from cheap
labor abroad, millions of American workers have been harmed.
Explanations for why manufacturing and
other mid-wage paying jobs have disappeared
range from
displacement caused
by
new technologies to
political factors, which have weakened labor unions, spread trade liberalization, and failed to raise the minimum wage.
The growing U.S. trade deficit and subsequent decrease in manufacturing jobs have been advanced by trade policies that have left domestic manufactures vulnerable to the tactics of lower-cost foreign competition. Reducing domestic employment in manufacturing has significant negative impacts on the nation’s economy and labor force. According to one study, for every manufacturing job there are 3.4 full-time domestic jobs created to support the needs of the manufacturers (Meckstroth, 2016). Therefore, by including both direct manufacturing jobs and all jobs linked to the existence of a factory job, the total manufacturing employment
THE COSTS AND BENEFITS OF INTERNATIONAL TRADE IN ILLINOIS
4
“footprint” is 32 percent of the national workforce. Consequently, reducing manufacturing jobs has the
effect of undermining the base upon which additional employment depends.
Each year, the United States exports less than it imports, translating into a net outflow of dollars to foreign markets. Trade deficits are not inherently bad for a country. In economics, a trade deficit means that foreigners are willing to invest more in the United States than Americans are willing to invest in other countries, which results in a surplus of capital. That capital could be invested in ways that promote economic growth for all Americans, such as business startups or public and private infrastructure investment. In reality, that capital is often captured by CEOs and shareholders, leading to increased
economic inequality.
However, a trade deficit also means that Americans are purchasing more goods from abroad, which they previously were making domestically. As a result, U.S. manufacturers demand fewer workers to produce labor-intensive goods. The trade deficit thus results in job outsourcing, and domestic companies decline in
size while foreign competitors hire new workers to produce less expensive goods.
The trade deficit has been aggravated by the currency manipulation of more than 20 countries (Scott, 2015). Despite raises in recent years, China has kept its domestic currency undervalued relative to the dollar in order to give its manufacturing products a price advantage when sold in the United States. Led by China, other countries have also been buying foreign assets to artificially devalue their currencies (Bergsten
& Gagnon, 2012). Economists estimate that U.S. trade with China has accounted for between 1.53 million (Autor et al., 2012) and 2.39 million (Kimball & Scott, 2014) American manufacturing jobs lost. The reported impact on the entire economy is a net loss of between 2.4 million (Autor et al., 2016) and 3.2
million total jobs (Kimball & Scott, 2014). Ending currency manipulation entirely would recoup these losses, creating between 2.3 million and 5.8 million jobs in the American economy – including between 107,500 and 266,400 jobs in Illinois (Scott, 2014).
Automation is another cause of job loss in U.S. manufacturing. In recent decades, automated machinery has replaced human labor as new technologies have become available. Most economists do not expect
American manufacturing jobs that were lost due to globalization and technology to return. In fact, the Bureau of Labor Statistics projects that the manufacturing sector will lose 814,100 total jobs over the next decade as new technologies are invented that can carry out tasks once performed by human labor (BLS, 2015). In addition, while many manufacturing factories have relocated back to the United States over recent
years, they “are heavily automated, employing a small fraction of the workers they would have a generation
ago” (Casselman, 2016). Roughly 249,000 manufacturing jobs have been “reshored” between 2010-2015 (Reshoring Initiative, 2016). Most importantly, too many of the new industrial jobs that are being
insourced are not middle-class jobs. According to one report, 34 percent of the families of frontline manufacturing production workers are now enrolled in one or more public safety net program (Jacobs et al., 2016).
The below-middle-class wages of these new industrial jobs reflect the changing social relations of
production. Between 2010 and 2015 U.S. manufacturers added over 500,000 non-supervisory production workers; yet importantly, there are 4 percent fewer union factory workers in 2015 than there were in 2005. Consequently, the typical full-time non-union factory worker earned less in 2015 than he or she did in 2009,
and 9 percent lower than similar workers who are represented by a union.
Another perspective on the weakening bargaining power of U.S. manufacturing employees after the liberalization of trade rules is that
there were 6 million fewer unionized manufacturing workers in 2012 than in 1977. Barely one in 10 U.S. manufacturing workers now belong to a union or are represented by one. Thirty years ago, that number was one in three (BLS, 2016).
THE COSTS AND BENEFITS OF INTERNATIONAL TRADE IN ILLINOIS
5
Despite an industry unemployment rate that has fallen since 2005, too many manufacturing employees
remain unemployed or have vacated the labor market. Employers have often claimed a skills shortage to explain job vacancies. But a 2014 study found that only
16.1 percent of surveyed manufacturing company officials responded affirmatively that a “lack of access to skilled workers is a major obstacle to increasing
financial success” (Osterman & Weaver, 2014).
As manufacturing has declined, jobs in the health care, information technology, and transportation industries, along with many service sector occupations, have grown in the U.S. labor market. Some of these jobs are better-paying than manufacturing, such as those in information technology and the medical field,
but most are lower-paying and contribute to a shrinking middle class. The downward shift in incomes for workers with less than a college degree has contributed to a potentially dangerous level of income inequality. For the last 40 years, income inequality has been climbing. Darren Lubotsky, Associate Professor of Economics at the University of Illinois at Chicago, warns that “the gap between the rich and the poor is growing so much that I think we don’t have a good understanding of what it would mean for our society,
for politics and for other aspects of society, if that continued to get worse for a long time” (Caputo, 2016). Trade deficits driven by U.S.-based and corporate multilateral trade policies have created an economy of low wages and uncertainty.
These domestic economic trends have presented serious policy challenges for the United States. In order for workers without a college degree to achieve a high standard of living, the nation needs a robust U.S. manufacturing sector. Additionally, as technology will undoubtedly continue to automate manufacturing jobs, investments in large-scale infrastructure projects, higher education, and apprenticeship programs and a raise in the federal minimum wage are needed to support displaced manufacturing workers.
International Trade, Manufacturing, and Transportation in Illinois
Illinois exports over $68.2 billion in goods and services, accounting for 9.3 percent of the state’s economic
output. Illinois’ consumers and businesses also import over $126.4 million in goods and services (BEA, 2016b). As the 5th-largest exporter state and the 6th-largest importer state in the nation, Illinois is particularly exposed to international trade (Census, 2016).
On the export side is Illinois’ manufacturing industry. The Chicago metropolitan area, in particular,
specializes in 10 manufacturing sectors. Compared to the national average, proportionately more workers in Chicago and surrounding suburbs produce primary metals, pharmaceuticals, electrical appliances, fabricated metal products, plastics and rubber products, paper, non-pharmaceutical chemicals, petroleum
and coal products, and machinery (Wial, 2013).
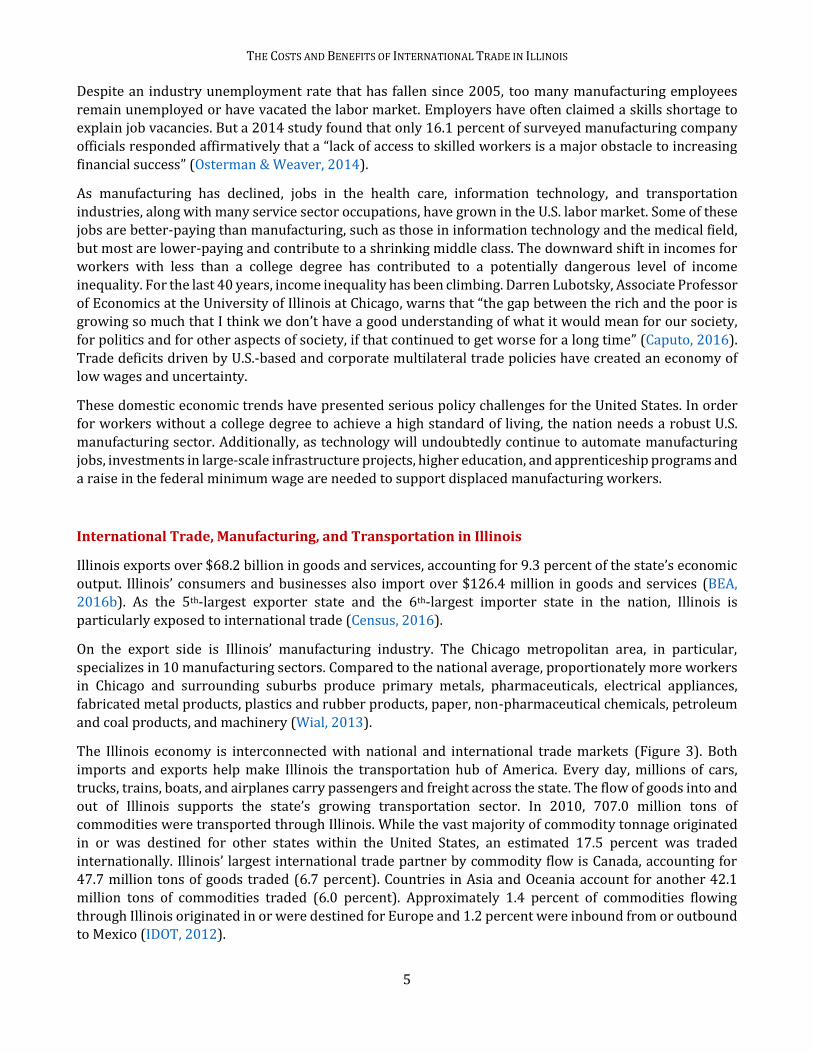
The Illinois economy is interconnected with national and international trade markets (Figure 3). Both imports and exports help make Illinois the transportation hub of America. Every day, millions of cars, trucks, trains, boats, and airplanes carry passengers and freight across the state. The flow of goods into and out of Illinois supports the state’s growing transportation sector. In 2010, 707.0 million tons of commodities were transported through Illinois. While the vast majority of commodity tonnage originated in or was destined for other states within the United States, an estimated 17.5 percent was traded internationally. Illinois’ largest international trade partner by commodity flow is Canada, accounting for 47.7 million tons of goods traded (6.7 percent). Countries in Asia and Oceania account for another 42.1 million tons of commodities traded (6.0 percent). Approximately 1.4 percent of commodities flowing through Illinois originated in or were destined for Europe and 1.2 percent were inbound from or outbound to Mexico (IDOT, 2012).
THE COSTS AND BENEFITS OF INTERNATIONAL TRADE IN ILLINOIS
6
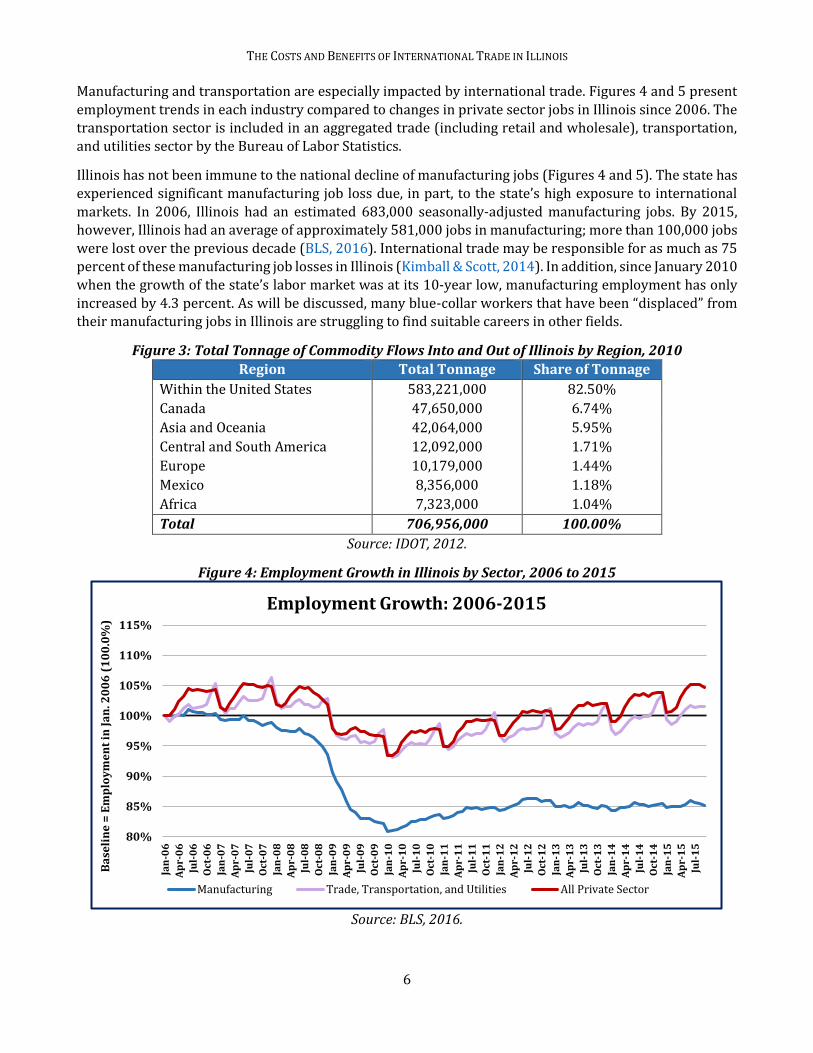
Manufacturing and transportation are especially impacted by international trade. Figures 4 and 5 present
employment trends in each industry compared to changes in private sector jobs in Illinois since 2006. The transportation sector is included in an aggregated trade (including retail and wholesale), transportation, and utilities sector by the Bureau of Labor Statistics.
Illinois has not been immune to the national decline of manufacturing jobs (Figures 4 and 5). The state has experienced significant manufacturing job loss due, in part, to the state’s high exposure to international markets. In 2006, Illinois had an estimated 683,000 seasonally-adjusted manufacturing jobs. By 2015, however, Illinois had an average of approximately 581,000 jobs in manufacturing; more than 100,000 jobs
were lost over the previous decade (BLS, 2016). International trade may be responsible for as much as 75 percent of these manufacturing job losses in Illinois (Kimball & Scott, 2014). In addition, since January 2010 when the growth of the state’s labor market was at its 10-year low, manufacturing employment has only increased by 4.3 percent. As will be discussed, many blue-collar workers that have been “displaced” from their manufacturing jobs in Illinois are struggling to find suitable careers in other fields.
Figure 3: Total Tonnage of Commodity Flows Into and Out of Illinois by Region, 2010
Region Total Tonnage Share of Tonnage
Within the United States 583,221,000 82.50%
Canada 47,650,000 6.74%
Asia and Oceania 42,064,000 5.95%
Central and South America 12,092,000 1.71%
Europe 10,179,000 1.44%
Mexico 8,356,000 1.18%
Africa 7,323,000 1.04%
Total 706,956,000 100.00%
Source: IDOT, 2012.
Figure 4: Employment Growth in Illinois by Sector, 2006 to 2015
Source: BLS, 2016.
80%
85%
90%
95%
100%
105%
110%
115%
Jan
-06
Ap
r-0
6
Jul-
06
Oct
-06
Jan
-07
Ap
r-0
7
Jul-
07
Oct
-07
Jan
-08
Ap
r-0
8
Jul-
08
Oct
-08
Jan
-09
Ap
r-0
9
Jul-
09
Oct
-09
Jan
-10
Ap
r-1
0
Jul-
10
Oct
-10
Jan
-11
Ap
r-1
1
Jul-
11
Oct
-11
Jan
-12
Ap
r-1
2
Jul-
12
Oct
-12
Jan
-13
Ap
r-1
3
Jul-
13
Oct
-13
Jan
-14
Ap
r-1
4
Jul-
14
Oct
-14
Jan
-15
Ap
r-1
5
Jul-
15
Ba
seli
ne
= E
mp
loy
me
nt
in J
an
. 20
06
(1
00
.0%
)
Employment Growth: 2006-2015
Manufacturing Trade, Transportation, and Utilities All Private Sector
THE COSTS AND BENEFITS OF INTERNATIONAL TRADE IN ILLINOIS
7
While manufacturing jobs are stagnant or decreasing in number, other Illinois jobs have been created or saved due to U.S. integration in the global economy. In 2014, an estimated 345,000 Illinois jobs were supported by the $68.2 billion of exported state goods. A total of 22,770 companies in Illinois were international exporting companies. Of these companies, fully 89.9 percent were classified as small or medium-sized businesses. Soybeans, machinery, and transportation equipment are among the popular products that are exported from Illinois into world markets (Department of Commerce, 2016).
Both the private sector and the trade, transportation, and utilities sector have grown since January 2006. Growth has been particularly positive since January 2010, the “rock bottom” month for the state’s labor market (Figure 4). Total private sector jobs have grown by 4.8 percent since 2006 and 11.3 percent since 2010. The aggregated trade sector has grown by 1.4 percent since 2006 and 7.6 percent since 2010 in Illinois. Supported by international trade, these positions have offered possibilities for some blue-collar workers to find work in another sector. However, while there has been a 16,821-job increase in trade, transportation, and utilities positions since 2006, it is not nearly enough to cover the loss of 101,145 manufacturing jobs (Figure 5).
Figure 5: Employment Growth in Illinois by Sector, Since January 2006 and Since January 2010
Timeline
Private Sector
Jobs
Manufacturing Jobs
Trade, Transportation,
and Utilities Jobs
Private Sector
Growth
Manufacturing Growth
Trade, Transportation, and
Utilities Growth
Since January
2006 +230,937
-101,145
+16,821
+4.75%
-14.86%
+1.44%
Since
January 2010
+550,298
+29,097
+87,984
+11.31%
+4.28%
+7.55%
Source: BLS, 2016.
Figure 6: Establishment Growth in Illinois by Sector, 2006 to 2015
Source: BLS, 2016.
80%
85%
90%
95%
100%
105%
110%
115%
120%
125%
130%
20
06
Q1
20
06
Q2
20
06
Q3
20
06
Q4
20
07
Q1
20
07
Q2
20
07
Q3
20
07
Q4
20
08
Q1
20
08
Q2
20
08
Q3
20
08
Q4
20
09
Q1
20
09
Q2
20
09
Q3
20
09
Q4
20
10
Q1
20
10
Q2
20
10
Q3
20
10
Q4
20
11
Q1
20
11
Q2
20
11
Q3
20
11
Q4
20
12
Q1
20
12
Q2
20
12
Q3
20
12
Q4
20
13
Q1
20
13
Q2
20
13
Q3
20
13
Q4
20
14
Q1
20
14
Q2
20
14
Q3
20
14
Q4
20
15
Q1
20
15
Q2
20
15
Q3
Ba
seli
ne
= E
sta
bli
shm
en
ts i
n 2
00
6Q
1 (
10
0.0
%)
Establishment Growth: 2006-2015
Manufacturing Trade, Transportation, and Utilities All Private Sector
THE COSTS AND BENEFITS OF INTERNATIONAL TRADE IN ILLINOIS
8
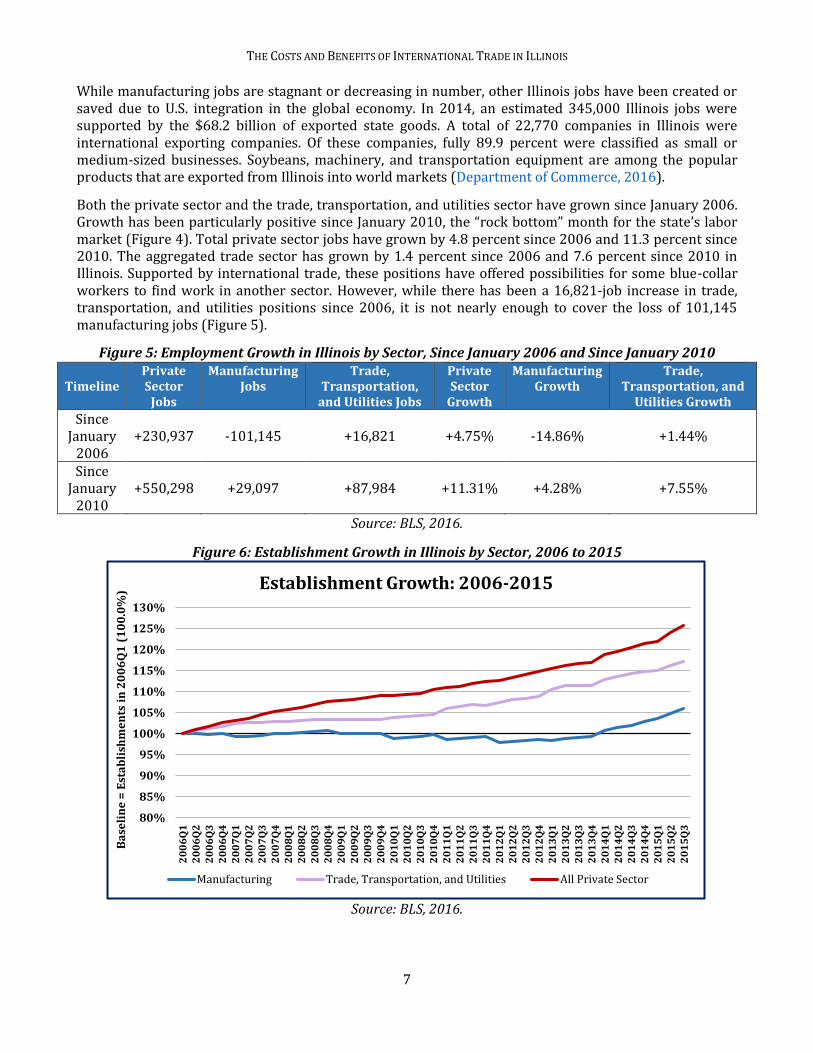
Despite considerable manufacturing job losses in Illinois, the number of manufacturing “establishments”
has increased since January 2006 (Figures 6 and 7). An establishment is a single location where business is conducted, such as a factory, an office, or a store. Manufacturing establishments did not undergo a decline on par with manufacturing jobs. While manufacturing employment has declined by 14.9 percent since
January 2006, the number of manufacturing establishments has increased by 6.0 percent over that same time. In addition, since January 2010, the number of factories and other places of manufacturing business has grown by 7.1 percent in Illinois compared to a job growth rate of just 4.3 percent in the sector.
This disparity is the result of both trade and automation. In 2014, Illinois’ manufacturing industry
accounted for $98.95 billion in economic activity (BEA, 2016a). Manufacturing output was $2.35 billion more in 2014 than the $96.60 billion inflation-adjusted contribution of manufacturing to Illinois’ economy in 2006. While the number of manufacturing jobs has declined by 14.9 percent, total output had grown by 2.4 percent as of 2014. Productivity per worker thus increased substantially, mainly due to new technologies and automation (Scott, 2015). New factories are opening in Illinois, but they are using
automated technologies that require less human labor.
Figure 7: Establishment Growth in Illinois by Sector, Since January 2006 and Since January 2010
Timeline
Private Sector Establishments
Manufacturing Establishments
Trade, Transportation,
and Utilities Establishments
Private Sector
Growth
Manufacturing Growth
Trade, Transportation,
and Utilities Growth
Since January
2006 +86,223
+1,143
+13,429
+25.61%
+5.99%
+17.18%
Since
January 2010
+55,446
+1,344
+10,433
+16.47%
+7.05%
+13.35%
Source: BLS, 2016.
This reveals that manufacturers as a whole are a beneficiary of free trade and automation. Manufacturing establishments in Illinois benefit from increased output per worker. They also benefit from purchasing
cheaper intermediate goods to use in their production processes.
The number of companies in all sectors are growing in Illinois. Since 2006, private sector establishments in Illinois have increased by 25.6 percent. Trade, transportation, and utilities have experienced a 17.2 percent growth in business openings since 2006 as well. Demand for transportation, trucking, freight, and related establishments has risen in Illinois as the U.S. economy has increasingly relied on international trade,
especially since the state is particularly exposed to world markets.
The Economic Impact of Production Worker Displacement in Illinois
This section will focus on those who are most negatively impacted by international trade: production
workers. From 2010 to 2015, the number of Illinois workers who were displaced from their production occupations in manufacturing totaled more than 270,000 (Figure 8). On average each year, over 46,000 workers were separated from their production jobs. This number includes both those who voluntarily left their manufacturing jobs and those who were fired from their manufacturing jobs. Note, however, that this is only one side of the turnover equation. There were also new hires and other job ascensions during this period, which why the number of workers displaced from 2010 to 2015 is greater (more than 270,000) than the total number of jobs lost from 2006 to 2015 (slightly above 100,000).
THE COSTS AND BENEFITS OF INTERNATIONAL TRADE IN ILLINOIS
9
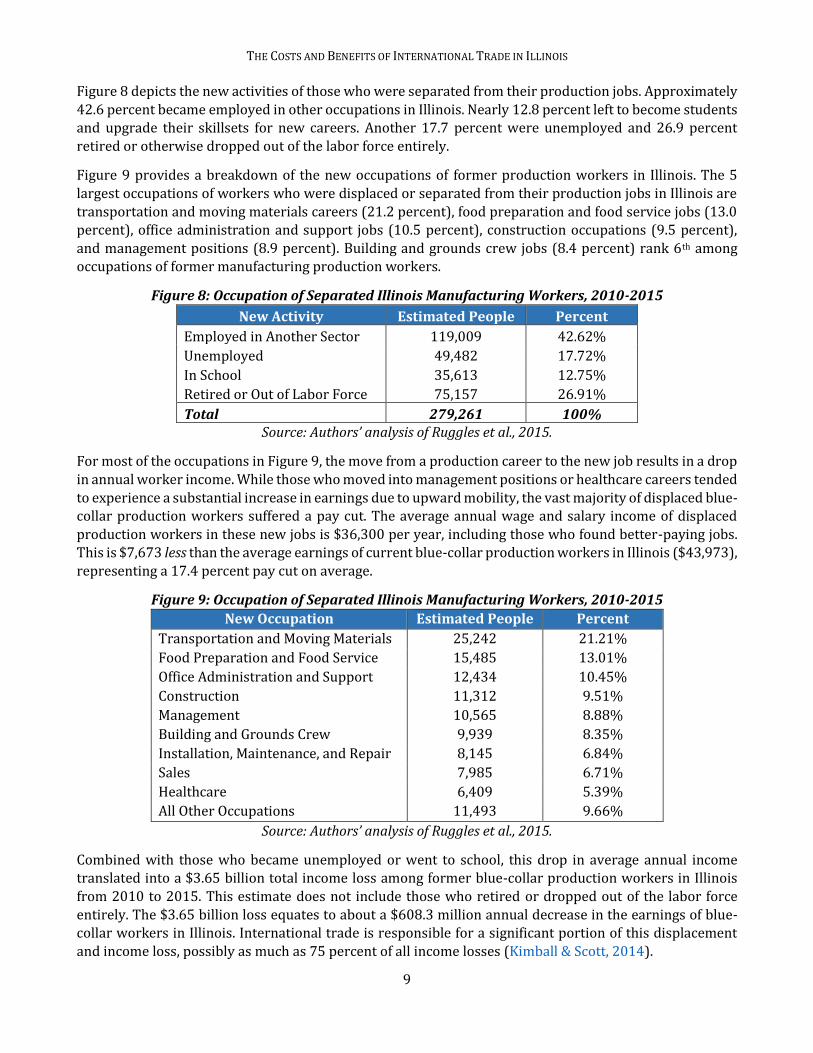
Figure 8 depicts the new activities of those who were separated from their production jobs. Approximately
42.6 percent became employed in other occupations in Illinois. Nearly 12.8 percent left to become students and upgrade their skillsets for new careers. Another 17.7 percent were unemployed and 26.9 percent retired or otherwise dropped out of the labor force entirely.
Figure 9 provides a breakdown of the new occupations of former production workers in Illinois. The 5 largest occupations of workers who were displaced or separated from their production jobs in Illinois are transportation and moving materials careers (21.2 percent), food preparation and food service jobs (13.0 percent), office administration and support jobs (10.5 percent), construction occupations (9.5 percent),
and management positions (8.9 percent). Building and grounds crew jobs (8.4 percent) rank 6th among occupations of former manufacturing production workers.
Figure 8: Occupation of Separated Illinois Manufacturing Workers, 2010-2015
New Activity Estimated People Percent
Employed in Another Sector 119,009 42.62%
Unemployed 49,482 17.72%
In School 35,613 12.75%
Retired or Out of Labor Force 75,157 26.91%
Total 279,261 100% Source: Authors’ analysis of Ruggles et al., 2015.
For most of the occupations in Figure 9, the move from a production career to the new job results in a drop in annual worker income. While those who moved into management positions or healthcare careers tended to experience a substantial increase in earnings due to upward mobility, the vast majority of displaced blue-collar production workers suffered a pay cut. The average annual wage and salary income of displaced production workers in these new jobs is $36,300 per year, including those who found better-paying jobs. This is $7,673 less than the average earnings of current blue-collar production workers in Illinois ($43,973), representing a 17.4 percent pay cut on average.
Figure 9: Occupation of Separated Illinois Manufacturing Workers, 2010-2015
New Occupation Estimated People Percent
Transportation and Moving Materials 25,242 21.21%
Food Preparation and Food Service 15,485 13.01%
Office Administration and Support 12,434 10.45%
Construction 11,312 9.51%
Management 10,565 8.88%
Building and Grounds Crew 9,939 8.35%
Installation, Maintenance, and Repair 8,145 6.84%
Sales 7,985 6.71%
Healthcare 6,409 5.39%
All Other Occupations 11,493 9.66%
Source: Authors’ analysis of Ruggles et al., 2015.
Combined with those who became unemployed or went to school, this drop in average annual income translated into a $3.65 billion total income loss among former blue-collar production workers in Illinois from 2010 to 2015. This estimate does not include those who retired or dropped out of the labor force entirely. The $3.65 billion loss equates to about a $608.3 million annual decrease in the earnings of blue-collar workers in Illinois. International trade is responsible for a significant portion of this displacement and income loss, possibly as much as 75 percent of all income losses (Kimball & Scott, 2014).
THE COSTS AND BENEFITS OF INTERNATIONAL TRADE IN ILLINOIS
10
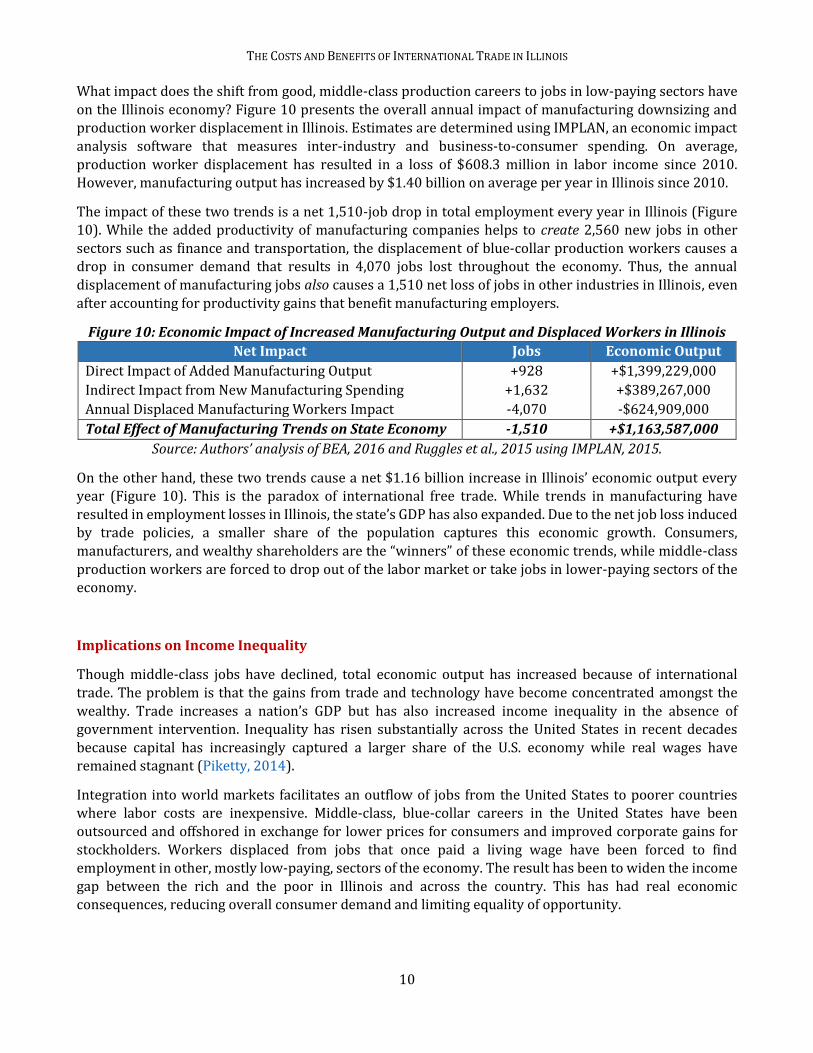
What impact does the shift from good, middle-class production careers to jobs in low-paying sectors have
on the Illinois economy? Figure 10 presents the overall annual impact of manufacturing downsizing and production worker displacement in Illinois. Estimates are determined using IMPLAN, an economic impact analysis software that measures inter-industry and business-to-consumer spending. On average,
production worker displacement has resulted in a loss of $608.3 million in labor income since 2010. However, manufacturing output has increased by $1.40 billion on average per year in Illinois since 2010.
The impact of these two trends is a net 1,510-job drop in total employment every year in Illinois (Figure 10). While the added productivity of manufacturing companies helps to create 2,560 new jobs in other
sectors such as finance and transportation, the displacement of blue-collar production workers causes a drop in consumer demand that results in 4,070 jobs lost throughout the economy. Thus, the annual displacement of manufacturing jobs also causes a 1,510 net loss of jobs in other industries in Illinois, even after accounting for productivity gains that benefit manufacturing employers.
Figure 10: Economic Impact of Increased Manufacturing Output and Displaced Workers in Illinois
Net Impact Jobs Economic Output
Direct Impact of Added Manufacturing Output +928 +$1,399,229,000
Indirect Impact from New Manufacturing Spending +1,632 +$389,267,000
Annual Displaced Manufacturing Workers Impact -4,070 -$624,909,000
Total Effect of Manufacturing Trends on State Economy -1,510 +$1,163,587,000
Source: Authors’ analysis of BEA, 2016 and Ruggles et al., 2015 using IMPLAN, 2015.
On the other hand, these two trends cause a net $1.16 billion increase in Illinois’ economic output every year (Figure 10). This is the paradox of international free trade. While trends in manufacturing have resulted in employment losses in Illinois, the state’s GDP has also expanded. Due to the net job loss induced by trade policies, a smaller share of the population captures this economic growth. Consumers,
manufacturers, and wealthy shareholders are the “winners” of these economic trends, while middle-class
production workers are forced to drop out of the labor market or take jobs in lower-paying sectors of the economy.
Implications on Income Inequality
Though middle-class jobs have declined, total economic output has increased because of international trade. The problem is that the gains from trade and technology have become concentrated amongst the
wealthy. Trade increases a nation’s GDP but has also increased income inequality in the absence of government intervention. Inequality has risen substantially across the United States in recent decades because capital has increasingly captured a larger share of the U.S. economy while real wages have remained stagnant (Piketty, 2014).
Integration into world markets facilitates an outflow of jobs from the United States to poorer countries where labor costs are inexpensive. Middle-class, blue-collar careers in the United States have been
outsourced and offshored in exchange for lower prices for consumers and improved corporate gains for stockholders. Workers displaced from jobs that once paid a living wage have been forced to find employment in other, mostly low-paying, sectors of the economy. The result has been to widen the income gap between the rich and the poor in Illinois and across the country. This has had real economic consequences, reducing overall consumer demand and limiting equality of opportunity.
THE COSTS AND BENEFITS OF INTERNATIONAL TRADE IN ILLINOIS
11
Potential Recommendations for Illinois
Economic data show that international trade improves the American economy and the Illinois economy.
However, international trade can cause significant job losses if countries are not on a level playing field. China, and at least 20 other trade partners, have been manipulating currency to artificially increase their competitiveness against the U.S. dollar. Ending currency manipulation would recoup past job losses associated with international trade, creating between 2.3 million and 5.8 million jobs in the American economy – including between 107,500 and 266,400 jobs in Illinois (Scott, 2014).
The federal government could address currency manipulation by taxing or offsetting the acquisition of foreign assets by culpable countries. For instance, through “countervailing currency interventions,” the U.S. government and the Federal Reserve could work with G-20 trading partners to buy amounts of currencies “equal to the amounts being bought by currency manipulating governments,” which would offset the manipulation. This “countervailing currency intervention” campaign would keep the beneficial aspects of
trade with China and similar countries intact, while mitigating the negative consequences (Scott, 2014; Bergsten & Gagnon, 2012).
At the state-level, Illinois can also take six steps to build a stronger manufacturing base.
1. Foster a better-educated and trained workforce. This policy solution essentially has universal support (Waldman, 2016; Moavenzadeh et al., 2013; Manyika et al., 2012; Brummel, 2012). An increase in the number of workers with a bachelor’s degree or higher “correlates to fast labor
productivity growth” in manufacturing sectors (Waldman, 2016). The State of Illinois needs to boost human capital investment in science, technology, engineering, and math (STEM) programs in public elementary, secondary, and postsecondary schools (Moavenzadeh et al., 2013). Austin
Polytechnical Academy in Chicago is an example of a public high school dedicated to educating the next generation of advanced manufacturing workers. Developing a future manufacturing base requires a highly-educated populace with innovative thinkers and skilled workers who can keep Illinois globally competitive.
2. Promote increased research and development. Illinois is home to outstanding research institutions and boasts 8 of the Top 150 universities in the United States (Manzo, 2014). Without interfering directly into the market, governments in Illinois can enable manufacturing growth by
supporting additional basic research and development (Manyika et al., 2012). At the very least, elected officials in Illinois must avoid budget cuts to public universities that will result in talented professors and researchers leaving for positions in other states, reduced investment in research, and poorer educational outcomes for students.
3. Significantly improve transportation infrastructure. A globally-competitive Illinois economy depends on effective and efficient transportation infrastructure. Highway accessibility has consistently been ranked as the most important or second-most important site selection factor by corporate executives in America (Area Development, 2016). Meanwhile, years of declining investment have left Illinois’ roads, bridges, and rail lines in poor shape. Illinois has a transportation deficit that requires an investment of $43 billion over the next 10 years. The state needs sustainable, reliable funding based on user fees to promote long-term economic development (MPC, 2016).
4. Base energy decisions on Illinois’ competitive advantages. Manufacturing is an energy-intensive industry, and Illinois becomes more attractive to manufacturers when energy prices are
low. Fortunately, industrial electricity prices in Illinois are 1.7 percent lower than the national
THE COSTS AND BENEFITS OF INTERNATIONAL TRADE IN ILLINOIS
12
average (Craighead, 2016). This is due, in part, because Illinois currently leads the nation in nuclear
electric power production. To reduce energy costs even further, the state should invest in natural gas, which is a “cleaner” source of energy than coal or oil. For example, a $1 billion natural gas-powered electric generating facility has been proposed for Grundy County that will create jobs and
result in lower energy prices in Illinois. Illinois also has the potential to drill for natural gas at the New Albany shale formation in southeast Illinois (Craighead, 2016).
5. Embrace and capitalize on increasing demand for clean energy. Illinois has the 5th-highest solar energy resource potential in the nation and currently ranks 5th in installed wind capacity (Craighead, 2016). Clean energy innovation and new wind, solar, biofuels, fuel cells, and energy storage technologies are a market opportunity for Illinois manufacturers. The State of Illinois should support manufacturers that both produce green products and make machinery for the green energy sector (Yakimov & Woolsey, 2012).
6. Develop a state educational and consultative capacity in “reshoring” expertise. Domestic manufacturers throughout Illinois and the Midwest too readily assume that offshoring lowers their production cost. However, non-profit groups like the Illinois-based Reshoring Initiative have
engaged in consultative business strategies to help bring well-paying manufacturing jobs back to the United States. According to a Reshoring report, in 2015, 537 manufacturing jobs returned to Illinois. The state ranked 28th in manufacturing jobs brought back to the United States, and the
Midwest was the second highest region for reshoring employment. The State of Illinois should consider utilizing its public university system to form an entity invested with the requisite resources to assist companies to “more accurately assess their total cost of offshoring, and shift
collective thinking from offshoring is cheaper to local reduces the total cost of ownership” (Reshoring Initiative, 2016).
Without a stable budgetary environment, none of these six recommendations would immediately bring back the manufacturing jobs lost in Illinois over the past decade. However each step would improve manufacturing competitiveness and development in the state.
Conclusions
There has been a general consensus among economists that international free trade is an important source of economic growth for countries. International trade allows nations to specialize, promotes innovation,
and has led to higher income growth and longer life expectancy. However, recent evidence finds that trade hurts local jobs and worsens income inequality. Mass job displacement can have significant effects on the national economy and public budget.
International trade supports many American jobs, especially in financial and professional service
occupations. In fact, international trade supported 1.8 million more jobs in 2014 than in 2009. Sectors such as energy, transportation, retail trade, wholesale trade, financial services, and professional services have continued to grow, in part, because of trade.
However, international trade has negatively affected the number of manufacturing jobs in the United States. The United States has lost about 4.5 million manufacturing jobs since the ratification of NAFTA in January 1994. In Illinois, the following areas are all more exposed to international trade than the rest of the nation: Rockford, the Quad Cities, Decatur, the Chicago region, and southeastern counties.
THE COSTS AND BENEFITS OF INTERNATIONAL TRADE IN ILLINOIS
13
The growing trade deficit is the major culprit for this decrease in manufacturing jobs. U.S. trade with China
alone has accounted for between 1.5 million and 2.4 million American manufacturing jobs lost.
As the 5th-largest exporter state and the 6th-largest importer state in the nation, Illinois is particularly exposed to international trade. Imports and exports help make Illinois the transportation hub of America. In 2010, 707 million tons of commodities were transported throughout Illinois. While the vast majority of commodity tonnage originated in or was destined for other U.S. states, approximately 17.5 percent was traded internationally. Illinois’ largest international trade partner by commodity flow is Canada (6.7 percent). Countries in Asia and Oceania (6.0 percent) are also major trade partners of Illinois.
Illinois, however, has lost more than 100,000 total manufacturing jobs over the past decade. While the aggregated “trade, transportation, and utilities” industry has offered possibilities for some blue-collar workers to find work in another sector of the Illinois economy, the 17,000 jobs gained in this industry have not nearly been enough to cover the loss of manufacturing jobs.
Due to both trade and automation, the number of factories in Illinois and manufacturing output in Illinois have both increased, even though over 100,000 manufacturing jobs have been lost. While manufacturing employment has declined by 15 percent since January 2006, the number of manufacturing establishments has increased by 6 percent and real manufacturing output has grown by 2 percent over the same time. New factories are opening in Illinois, but they are using automated technologies that require less human labor.
The result has been mass displacement of manufacturing production workers in Illinois. From 2010 to
2015, more than 270,000 Illinois workers in manufacturing production occupations were separated from their jobs, including those who voluntarily left their jobs and those who were fired. Note that this figure only includes individuals who were separated from their manufacturing jobs and is not offset by those who
were hired as production workers.
Among the displaced:
• 43 percent became employed in other occupations in Illinois – especially in transportation and moving materials careers, food preparation and food service jobs, office administration and support
jobs, and construction occupations; • 13 percent left to become students and upgrade their skillsets for new careers; • 18 percent were unemployed; and
• 27 percent retired or otherwise dropped out of the labor force entirely.
The vast majority of displaced blue-collar production workers suffered a pay cut. The average annual
income of displaced production workers in these new jobs is $36,300 per year, or $7,673 (17 percent) less than the earnings of blue-collar production workers in Illinois.
This drop in average annual income translated into a $3.65 billion total income loss among former blue-collar production workers in Illinois from 2010 to 2015, or a $608.3 million annual decrease.
The combined impact of production worker displacement and increased manufacturing output is a net 1,510-job drop in total employment every year in Illinois. Most of the 47,000 workers that are displaced every year find other jobs, even though most are lower paying. This makes the jobs impact of production worker displacement appear smaller in the economic data. Meanwhile, the added productivity of manufacturing companies helps to create new jobs and offset the effect of mass displacement. Still, the displacement of production workers causes a drop in consumer demand that results in more jobs lost than gained. However, the two trends cause a net $1.16 billion increase in Illinois’ economy every year.
THE COSTS AND BENEFITS OF INTERNATIONAL TRADE IN ILLINOIS
14
This is the paradox of international free trade: While trends in manufacturing have caused employment
losses in Illinois, the state’s GDP has expanded. The gains from trade have become concentrated amongst the wealthy. Workers displaced from jobs that once paid a living wage have been forced to find employment in other, mostly low-paying, sectors of the economy. The overall impact has been to widen the income gap
between the rich and the poor in Illinois.
Illinois must prepare its workforce for the future. Manufacturing employment that pays a living wage needs to be a career option for workers without a college degree. At the state-level, Illinois can take steps to re-develop its manufacturing sector. Illinois needs to foster a better-educated and trained workforce, promote
increased research and development, significantly improve transportation infrastructure, base energy decisions on Illinois’ natural competitive advantages, capitalize on increasing demand for clean energy, and develop a consultative capacity in “reshoring” expertise. These recommendations would improve manufacturing competitiveness in the state.
Where displacement of production workers does occur, protecting the state’s prevailing wage law in the construction industry, making college more affordable and accessible, and increasing investment in worker retraining programs would help lift up workers who transition to other occupations. Raising the minimum wage would also help many displaced manufacturing workers who are forced to find work in food service,
food preparation, and building and grounds crew occupations.
International free trade and technological advancements provide substantial benefits to the Illinois economy. Mitigating the losses of these positive forces, especially on the manufacturing industry, is crucial to the future success of Illinois.
Sources
Area Development. (2016). “30th Annual Survey of Corporate Executives: Cautious Optimism Reflected.”
Written by Geraldine Gambale. Area Development Magazine. Available at http://www.areadevelopment.com/Corporate-Consultants-Survey-Results/Q1-2016/corporate-executive-site-selection-facility-plans-441729.shtml.
Autor, David. (2010). The Polarization of Job Opportunities in the U.S. Labor Market: Implications for Employment and Earnings. The Hamilton Project at The Brookings Institution; Center for American Progress. Available
at http://www.brookings.edu/research/papers/2010/04/jobs-autor.
Autor, David; David Dorn; and Gordon Hanson. (2016). The China Shock: Learning from Labor Market Adjustment
to Large Changes in Trade. National Bureau of Economic Research. Available at
http://www.nber.org/papers/w21906.
Autor, David; David Dorn; and Gordon Hanson. (2012). The China Syndrome: Local Labor Market Effects of Import
Competition in the United States. National Bureau of Economic Research. Available at
http://www.nber.org/papers/w18054.
Bergsten, C. Fred and Joseph Gagnon. (2012). Currency Manipulation, the U.S. Economy, and the Global Economic
Order. Peter Institute for International Economics. Available at https://piie.com/publications/policy-briefs/currency-manipulation-us-economy-and-global-economic-order.
THE COSTS AND BENEFITS OF INTERNATIONAL TRADE IN ILLINOIS
15
Brummel, Jack. (2012). Options for Supporting Manufacturing in Washington. State of Washington Senate
Economic Development, Trade and Innovation Committee. Available at http://leg.wa.gov/Senate/Committees/TRED/Documents/SupportingManufacturing.pdf.
Bureau of Economic Analysis. (2016) (a). “Interactive Data.” U.S. Department of Commerce. Available at
http://www.bea.gov/newsreleases/national/gdp/2016/gdp4q15_3rd.htm.
Bureau of Economic Analysis. (2016) (b). “Gross Domestic Product: Fourth Quarter and Annual 2015.” U.S.
Department of Commerce. Available at
http://www.bea.gov/newsreleases/national/gdp/2016/gdp4q15_3rd.htm.
Bureau of Labor Statistics (BLS). (2016). “Manufacturing, Seasonally Adjusted.” Databases, Tables, & Calculators by Subject. U.S. Department of Labor. Available at http://www.bls.gov/data/.
Bureau of Labor Statistics (BLS). (2015). “Employment Projections – 2014-24.” U.S. Department of Labor.
Available at http://www.bls.gov/news.release/pdf/ecopro.pdf.
Caputo, Angela; Angie Leventis Lourgos; and Grace Wong. (2016). Chicago Areas’ Middle Class Shrinks Report
Finds.” Chicago Tribune. Available at http://www.chicagotribune.com/news/local/breaking/ct-pew-
declining-middle-class-met-20160511-story.html.
Casselman, Ben. (2016). “Manufacturing Jobs are Never Coming Back.” FiveThirtyEight.com. Available at http://fivethirtyeight.com/features/manufacturing-jobs-are-never-coming-back/.
Census. (2016). “State Exports from Illinois” and “State Imports from Illinois.” Foreign Trade. U.S. Census Bureau.
Available at https://www.census.gov/foreign-trade/statistics/state/data/il.html.
Census. (2015). “Top Trading Partners.” Foreign Trade. U.S. Census Bureau. Available at http://www.census.gov/foreign-trade/statistics/highlights/top/index.html.
Craighead, Mary. (2016). The Energy Sector in Illinois: Getting Down and Dirty on Clean Energy Opportunities in Illinois. Illinois Economic Policy Institute. Available at http://illinoisepi.org/policy-briefs/.
Department of Commerce. (2016). “United States of Trade: Illinois Profile.” U.S. Department of Commerce.
Available at https://ustr.gov/sites/default/files/United%20States%20of%20Trade.pdf.
Goldstein, Joshua and Jon Pevehouse. (2008). International Relations. (Eight Edition). New York: Pearson
Longman, p.p. 276–315.
Illinois Department of Transportation (IDOT). (2012). Illinois State Transportation Plan 2012: Freight Mobility
Plan. Available at
http://www.illinoistransportationplan.org/pdfs/final_report/05_freight_mobility_plan.pdf.
IMPLAN Group LLC. (2015). IMPLAN System (data and software), Available at www.IMPLAN.com.
International Trade Administration. (2016). “Illinois Exports, Jobs, and Foreign Investment.” Office of Trade and Economic Analysis at the International Trade Administration of the U.S. Department of Commerce.
Available at http://www.trade.gov/mas/ian/statereports/states/il.pdf.
Jacobs, Ken; Zohar Perla; Ian Perry; and Dave Graham-Squire. (2016). Producing Poverty: The Public Cost of Low-
Wage Production Jobs in Manufacturing. Available at http://laborcenter.berkeley.edu.
Kimball, Will and Robert Scott. (2014). China Trade, Outsourcing and Jobs. Economic Policy Institute. Available
at http://www.epi.org/publication/china-trade-outsourcing-and-jobs/.
THE COSTS AND BENEFITS OF INTERNATIONAL TRADE IN ILLINOIS
16
Manzo IV, Frank. (2016). The History of Economic Inequality in Illinois: 1850 – 2014. Illinois Economic Policy
Institute. Available at http://illinoisepi.org/countrysidenonprofit/wp-content/uploads/2013/10/The-
History-of-Economic-Inequality-in-Illinois-FINAL.pdf.
Manyika, James; Jeff Sinclair; Richard Dobbs; Gernot Strube; Louis Rassey; Jan Mischke; Jaana Remes; Charles Roxburgh; Katy George; David O’Halloran; and Sreeniva Ramaswamy. (2012). Manufacturing the Future: The Next Era of Global Growth and Innovation. McKinsey Global Institute; McKinsey & Company. Available at http://www.nist.gov/mep/data/upload/Manufacturing-the-Future.pdf.
Manzo IV, Frank. (2014). The Benefits of Doing Business in Illinois. Illinois Economic Policy Institute. Available at http://illinoisepi.org/countrysidenonprofit/wp-content/uploads/2013/10/ILEPI-Policy-Brief-The-Benefits-of-Doing-Business-in-Illinois2.pdf.
Meckstroth, Daniel J. (2016). The Manufacturing Value Chain Is Much Bigger Than You Think! MAPI Foundation.
Available at https://www.mapi.net/forecasts-data/manufacturing-value-chain-much-bigger-you-think.
Mishel, Lawrence and Alyssa Davis. (2015). Top CEOs Make 300 Times More than Typical Workers. Economic Policy Institute. Available at http://www.epi.org/publication/top-ceos-make-300-times-more-than-workers-pay-growth-surpasses-market-gains-and-the-rest-of-the-0-1-percent/.
Moavenzadeh, John; Maxime Bernard; Craig Giffi; and Dorothy Powers. (2013). Manufacturing for Growth: Strategies for Driving Growth and Employment. [Volume 1: Globally Competitive Policy]. World
Economic Forum. Available at http://www2.deloitte.com/content/dam/Deloitte/global/Documents/Manufacturing/gx_Mfg_Manufacturing_Growth_Volume01_05022013.pdf.
MPC. (2016). Illinois Has a $43 Billion Transportation Deficit. Metropolitan Planning Council. Available at
https://www.metroplanning.org/uploads/cms/documents/mpc_tranportation_crisis_fact_sheet_2016_04_01.pdf.
Organization for Economic Co-operation and Development (OECD). (1999). Open Markets Matter: The Benefits
of Trade and Investment Liberalisation. Available at http://www.oecd.org/trade/benefitlib/1948792.pdf.
Osterman, Paul and Andrew Weaver. (2014). Why Claims of Skills Shortages in Manufacturing Are Overblown. Available at http://www.epi.org/publication/claims-skills-shortages-manufacturing-overblown/.
Piketty, Thomas. (2014). Capital in the Twenty-First Century. Cambridge: Harvard University Press.
Reshoring Initiative: Bringing Manufacturing Back Home. (2016). Reshoring Initiative Data Report: Reshoring
and FDI Boost US Manufacturing in 2015 at http://www.reshorenow.org/recent-data.
Ruggles, Steven; Katie Genadek; Ronald Goeken; Josiah Grover; and Matthew Sobek. (2015). Integrated Public
Use Microdata Series: Version 6.0 [Machine-readable database]. Minneapolis: University of Minnesota.
Scott, Robert. (2015). Manufacturing Job Loss: Trade, Not Productivity, Is the Culprit. Economic Policy Institute. Available at http://www.epi.org/publication/manufacturing-job-loss-trade-not-productivity-is-the-culprit/.
Scott, Robert. (2014). Stop Currency Manipulation and Create Millions of Jobs. Economic Policy Institute. Available at http://www.epi.org/publication/stop-currency-manipulation-and-create-millions-of-jobs/.
Soubbotina, Tatyana and Katherine Sheram. (2000). Beyond Economic Growth: Meeting the Challenges of Global Development. The World Bank. Available at http://www.worldbank.org/depweb/beyond/beyondco/beg_all.pdf.
THE COSTS AND BENEFITS OF INTERNATIONAL TRADE IN ILLINOIS
17
U.S. International Trade Commission (USITC). (2015). “USITC Interactive Tariff and Trade DataWeb.”Available
at https://dataweb.usitc.gov/.
Waldman, Cliff. (2016). Productivity Dynamics in U.S. Manufacturing. MAPI. Available at https://www.mapi.net/forecasts-data/productivity-dynamics-us-manufacturing.
Wial, Howard. (2013). Location Chicago Manufacturing: The Geography of Production in Metropolitan Chicago.
Center for Urban Economic Development at the College of Urban Planning & Public Affairs at the University
of Illinois at Chicago. Available at http://cuppa.uic.edu/data/cued_manufacturing_brief_022113.pdf.
Yakimov, Gary and Lindsey Woolsey. (2010). Innovation and Product Development in the 21st Century. Manufacturing Extension Partnership; Corporation for a Skilled Workforce. Available at http://www.nist.gov/mep/upload/MEP_advisory_report_4_24l.pdf.