the covid-19 crisis and banking system resilience
TRANSCRIPT
The COVID-19 crisis and banking system resilienceSimulation of losses on non-performing loans and policy implications


1
THE COVID-19 CRISIS AND BANKING SYSTEM RESILIENCE © OECD 2021
The COVID-19 crisis and banking system resilience
Simulation of losses on non-performing loans and policy implications
PUBE

2
THE COVID-19 CRISIS AND BANKING SYSTEM RESILIENCE © OECD 2021
Please cite this report as:
OECD (2021), “The COVID-19 crisis and banking system resilience: Simulation of losses on non-performing loans and policy implications”, OECD Paris.
This work is published under the responsibility of the Secretary-General of the OECD. The opinions expressed and
arguments employed herein do not necessarily reflect the official views of OECD member countries. This document,
as well as any data and map included herein, are without prejudice to the status of or sovereignty over any territory,
to the delimitation of international frontiers and boundaries and to the name of any territory, city or area.
© OECD 2021
3
THE COVID-19 CRISIS AND BANKING SYSTEM RESILIENCE © OECD 2021
Foreword
Over the previous twelve months the world has worked to contain the unprecedented health and economic
crises brought on by the COVID-19 pandemic. At the time of this report’s release, the outlook for the
pandemic and the path to economic recovery remain highly uncertain.
In this context, the ongoing health of the banking sector remains a primary concern for economic policy
makers. Banks’ lending is critical to see businesses and households through the crisis, and
finance investment as we move into economic recovery.
However, COVID-19’s economic impacts have contributed to a sharp rise in defaults of corporate and
household debt that is eroding the asset quality of banks across OECD countries. As the pandemic
continues into 2021, banks could face a substantial increase in non-performing loans (NPLs) due to the
rise in household and company defaults and will be forced to increase their loan loss provisions and
allowances. Such a deterioration in bank asset quality and earning performance could limit banks’
capacities to absorb higher loan losses over time, flowing through to their ability to intermediate credit and
support the recovery.
It is thus critical for banking supervisors and monetary and fiscal authorities, in planning ongoing response
and the eventual unwinding of support, to have a clear picture of bank asset performance under different
scenarios. This paper supports these considerations with a simulation analysis that assesses the extent of
the potential rise in bank NPLs, under different assumptions: a scenario of extensive monetary and fiscal
support; versus a scenario without continued support measures, in line with conditions that prevailed in
2008-2009 Global Financial Crisis. The paper also investigates the subsequent implications for bank
capital and discusses whether policy responses may be needed to address the declining asset quality and
reduced capital buffers.
At the first glance, this analysis suggests that aggregate capital ratios would remain above regulatory
minimums – however, a modest number of banks are likely to see respective capital adequacies being
challenged, especially if existing stimulus policies are abruptly diminished. At the same time, a weaker
than expected economic recovery or premature end to monetary and fiscal support measures, coupled
with growing vulnerabilities in the non-financial private sector may give rise to higher bank NPLs. Therefore,
financial authorities in several countries should consider additional policy steps to enhance supervisory
assessments of loan quality and improve resolution and recovery regimes to address the potential
challenges associated with elevated NPLs.
Strengthening bank resilience requires international cooperation to limit regulatory arbitrage and
harmonise regulatory standards. The OECD will continue to pursue this goal through its financial policy
communities, and its wider work supporting an international policy environment to provide relevant policy
recommendations for banking institutions and markets.
Greg Medcraft
Director, OECD Directorate for Financial and Enterprise Affairs

4
THE COVID-19 CRISIS AND BANKING SYSTEM RESILIENCE © OECD 2021
Acknowledgements
The paper has been prepared by Caroline Roulet under the supervision of Robert Patalano from the
Division of Financial Markets of the OECD Directorate for Financial and Enterprise Affairs. It has benefited
from input and guidance by the Committee on Financial Markets, where it was discussed in October 2020.
The author gratefully acknowledges constructive feedback provided by Giuseppe Grande and Giuseppe
Cascarino (Banca d’Italia), Inês Drumond, Paula Antão, Nuno Ribeiro and Gabriel Zsurkis (Banco de
Portugal), Elefetheria Kostika (Bank of Greece), Emmanuel Bétry (Direction générale du Trésor, French
Treasury) and Vanessa Redak (Oesterreichische Nationalbank).
This paper contributes to the work of the OECD Committee on Financial Markets which seeks to promote
the contribution of financial institutions, including institutional investors, and capital markets to savings and
investment, to finance sustainable and inclusive economic growth. It contributes to the enhancement of
policy approaches in the financial sector; such as the promotion of efficient and transparent public debt
markets. For more information, visit www.oecd.org/finance/financial-markets/.

5
THE COVID-19 CRISIS AND BANKING SYSTEM RESILIENCE © OECD 2021
Table of contents
Foreword 3
Acknowledgements 4
Executive summary 7
1 Introduction 9
2 Assessment of bank non-performing loans following the COVID-19 crisis 11
2.1. Stylised facts: banking sector strengths and vulnerabilities prior to the COVID-19 crisis 11
2.2. Methodology and simulation results of bank non-performing loans throughout the COVID-
19 crisis 14
2.3. Consequences of rising non-performing loans and subsequent loan loss provisions for bank
earnings and valuations 18
3 Implications of rising bank loan losses for bank resilience and solvency 21
3.1. Impact of simulated bank loan losses on capital levels 21
3.2. Results 22
4 Potential impact of rising bank loan losses for the conversion of contingent convertible bonds 26
4.1. Background and historical trends in bank contingent convertible bond issuance 26
4.2. Assessment of contingent convertible bonds that may be triggered due to the deterioration
in bank asset quality 26
4.3. Results of the analysis 28
5 Assessment and high level policy considerations 30
References 32
Annex A. Non-performing loan projection model following the COVID-19 crisis 36
OECD single-hit and double-hit scenarios 36
The model 37
6
THE COVID-19 CRISIS AND BANKING SYSTEM RESILIENCE © OECD 2021
Annex B. Simulation analysis of non-performing loans and impact on banks’ ability to absorb loan losses 40
Annex C. How bank loan losses may trigger the conversion of contingent convertible bonds? 42
Notes 43
Tables
Table 1. Actual versus average non-performing loan ratios and other explanatory macroeconomic variables
under the OECD single-hit scenario with policy mitigation 17 Table 2. Actual versus average non-performing loan ratio and other explanatory macroeconomic variables
under the OECD single-hit scenario without policy mitigation 18 Table A A.1. Descriptive statistics of variables included in the model, 2005–2020 38 Table A A.2. Determinants of a bank’s NPL ratio, 2005–2020 39
Figures
Figure 1. Average bank total regulatory capital and liquidity coverage ratios by region, 2007 versus 2019 12 Figure 2. Average bank return on equity and non-performing loan ratio by region, 2007 versus 2019 13 Figure 3. Average bank price-to-book value ratio by region, 2007 versus 2019 13 Figure 4. Average historical and projected non-performing loan ratios by region, calculated under OECD
single-hit versus double-hit scenario 16 Figure 5. Average increase in non-performing loans and loan loss provisions for banks that experienced a rise
in non-performing loans, 2019-2020 19 Figure 6. Evolution of bank price-to-book ratio in 2020 20 Figure 7. CET1 capital ratio under single-hit and double-hit scenarios and policy mitigation 22 Figure 8. Non-performing loans and loan loss reserves under single-hit and double-hit scenarios as a share of
actual CET1 capital without government loan guarantees 23 Figure 9. Reduction in CET1 capital under single-hit and double-hit scenarios and policy mitigation 24 Figure 10. Contingent convertible bond issuance of banks in OECD economies, 2009-2020 27 Figure 11. Share of contingent convertible bonds converted into loss absorbing equity following the
deterioration in bank capital in total outstanding under single-hit and double-hit scenarios 28 Figure 12. Distribution of banks according to the state of deteriorated capital base and the conversion of
contingent convertible bonds 29

7
THE COVID-19 CRISIS AND BANKING SYSTEM RESILIENCE © OECD 2021
Executive summary
The impact of the COVID-19 pandemic has already brought major economic disruptions globally, which in
turn have contributed to weaken credit conditions and certain asset valuations in the financial system.
Delinquency rates of home and commercial mortgages have risen substantially in certain jurisdictions with
potentially detrimental implications for the asset quality of bank loan portfolios. As the situation persists in
2021, banks could face a substantial increase in non-performing loans (NPLs) due to the rise in household
and company defaults and will be forced to increase their loan loss provisions (LLPs) and allowances.
Nevertheless, the continued deterioration in bank asset quality and earning performance could limit banks’
capacities to absorb higher loan losses over time, which could undermine their ability to intermediate credit
and support an economic recovery.
This paper outlines the findings of a simulation analysis aimed at assessing the extent of the potential rise
in NPLs depending on the severity of the COVID-19 crisis on the global economic environment, and taking
into consideration assumptions under extensive monetary and fiscal support versus a scenario without
continued support measures in keeping with conditions that prevailed in the past crisis. The paper also
investigates the subsequent implications for bank capital and discusses whether policy responses may be
needed to clean balance sheets.
Results of the analysis indicate that:
Bank NPL ratios would increase under a single-hit scenario in both advanced and emerging market
economies, and culminate under a double-hit scenario. Nevertheless, extensive monetary and fiscal
support measures would reduce the severity of the impact of the COVID-19 crisis on bank NPL ratio in all
regions. Notably, projected peaks would stand below previous crises levels in most jurisdictions. In
contrast, without monetary and fiscal support measures, the increase in NPL ratios would be more
substantial under the two scenarios and projected peaks would surpass previous crises levels in a number
of jurisdictions.
Banks would face reductions in their common equity Tier 1 (CET1) capital ratios in both advanced and
emerging market economies despite extensive monetary and fiscal support measures that have been
implemented to address the crisis resulting from the COVID-19 pandemic. Nevertheless, government loan
guarantees would help reduce the decline in CET1 capital for banks in all regions. Notably, the capital
reduction due to the deterioration in bank asset quality is particularly concerning for the higher number of
banks that face a capital shortfall under the double-hit scenario.
The likelihood that CET1 capital deterioration could trigger contingent convertible bond (CoCo) conversion
into loss absorbing equity largely depends on a bank’s starting CET1 capital buffer. Therefore, CET1
capital deterioration is expected to be limited, which would cause the Cocos of only a small portion of
banks to be triggered to help them strengthening their capital during crisis. If conditions further deteriorate,
the increased capital depletion across a higher number of banks would lead more CoCos to be converted
into loss absorbing equity.
Policies adopted by governments and central banks have undoubtedly helped to ease challenges faced
by banks’ as a result of the COVID-19 crisis and induced stress, in turn reducing the impact on bank asset
8
THE COVID-19 CRISIS AND BANKING SYSTEM RESILIENCE © OECD 2021
quality. Nevertheless, while aggregate capital ratios remain above regulatory minimums within each region,
there is a weak tail of banks that could see their capital adequacy challenged should existing stimulus
policies be abruptly diminished. The banks that are the most at risk include those that entered the crisis
with existing idiosyncratic problems or those heavily exposed to the sectors most affected by the COVID-
19 crisis, and whose capital ratios might not suffice to weather the upcoming challenges. In this respect, a
weaker than expected economic recovery or premature end to monetary and fiscal support measures to
mitigate the negative consequences of the pandemic waves, coupled with growing vulnerabilities in the
non-financial private sector may give rise to higher bank NPLs. In certain jurisdictions, financial authorities
would have to address NPL problems and implement or revive NPL disposal schemes to ensure that banks
continue to intermediate credit and support economic recovery.

9
THE COVID-19 CRISIS AND BANKING SYSTEM RESILIENCE © OECD 2021
The COVID-19 pandemic has caused an unprecedented health and economic crisis. According to the
OECD 2020 Economic Outlook, both the outlook for the pandemic and the path to economic recovery
remain highly uncertain. The OECD warns that the global recession is expected to be the deepest since
the Great Depression with some differences across countries depending on the measures taken to limit
contagion, prevent second or further waves of the virus and support the national economy (OECD, 2020c).
Persisting uncertainty surrounding the severity of the crisis and prospects for an economic recovery raise
questions on the potential consequences for the banking sector.
Banking systems entered into the COVID-19 crisis with stronger capitalisation and liquidity than in prior
crises (EBA, 2020b; FED, 2020a). However, vulnerabilities are evident in several areas. A number of
banks, particularly in some parts of the world, still suffer from low valuations, low profitability, and high
levels of non-performing assets (IMF, 2020a; ECB, 2020a). Irrespective of the crisis, weaknesses such as
low interest margins might be exacerbated by the low interest rate environment and flat yield curves
(Patalano and Roulet, 2020), which will likely now continue in many jurisdictions. Furthermore, a prolonged
and severe disruption could bring about a substantial increase in non-performing loans (NPLs) due to a
rise in household and company defaults, with banks being forced to increase their loan loss provisions
(LLPs) and allowances. Notably, the deterioration in bank asset quality and earning prospects may impact
banks’ capacities to absorb higher loan losses.
NPL build-ups are a recurrent feature of financial crises and financial stress episodes. Recent examples
include several European countries, as well as the United States (EBA, 2016; IMF, 2015; ECB, 2017),
following the Global Financial Crisis. Earlier examples include several Asian economies in the late 1990s,
(Fung et al, 2004), the Nordic countries in the 1990s (Borio et al., 2010), and the US savings and loan
(S&L) crisis in the 1980s (FDIC, 1997). The potential of a vicious circle of low asset quality, low bank
profitability, pressure on capital levels and constrained lending, with negative effects on growth can worsen
the initial NPL problem, thus pointing to the macroeconomic and financial stability significance of NPLs. In
many instances significant realised losses by banks on NPLs, coupled with high leverage and weak
economic conditions could precipitate the need for resolution instruments and possibly government-backed
solutions. Notably, solutions to repair balance sheets related to high levels of NPLs have been
implemented in several European jurisdictions following the Global Financial crisis. In Europe, EUR 700
billion of NPLs have been sold over the period 2014-2019 to a host of major distressed asset managers
and investment banks (Deloitte, 2019). For these reasons, understanding the potential losses from NPLs
under different economic and policy stimulus scenarios would be important.
Therefore, this paper seeks to assess the extent of the potential rise in NPLs following the COVID-19
pandemic, subsequent implications for bank capital, and whether policy responses may be needed to
repair balance sheets. Concerns have emerged that as banks accumulate higher levels of non-performing
loans on their balance sheets, this will undermine their ability to intermediate credit and support economic
recovery. These concerns may urge financial authorities in at least some OECD jurisdictions to address
NPL problems in the banking sector and have them take actions to restore banks’ financial soundness and
strengthen their resilience.
The second section proceeds to analyse how the increase in NPLs may vary depending on the severity of
the COVID-19 crisis on the global economic environment. The section outlines simulation analysis of bank
1 Introduction

10
THE COVID-19 CRISIS AND BANKING SYSTEM RESILIENCE © OECD 2021
NPL ratios under a single-hit versus a double-hit scenario informed by the OECD 2020 Economic Outlook
forecast, and taking into consideration assumptions under extensive monetary and fiscal support versus a
scenario without continued support measures in keeping with conditions that prevailed in the past crisis.
The purpose of this analysis is to evaluate the extent to which banking systems may be impacted across
OECD economies.
The third section focuses on the deterioration in bank asset quality that is likely to impact banks’ capacity
to absorb higher loan losses. A simulation analysis is performed to consider how much capital banks would
need to absorb higher levels of loan losses and estimate regulatory capital erosion (and even potential
shortfalls) due to remaining loan losses that may not be covered by loan loss reserves.
The fourth section analyses the possible consequences of the erosion of bank regulatory capital due to
the deterioration in asset quality. Further analysis is intended to assess the amount of contingent
convertible bonds (CoCos) that may be triggered due to substantial loan losses not covered by reserves.
The objective is to investigate whether CoCos may be an additional source of bank equity to absorb losses
on NPL write-offs.
Section five includes an assessment of the key findings and high level policy considerations.

11
THE COVID-19 CRISIS AND BANKING SYSTEM RESILIENCE © OECD 2021
2.1. Stylised facts: banking sector strengths and vulnerabilities prior to the
COVID-19 crisis
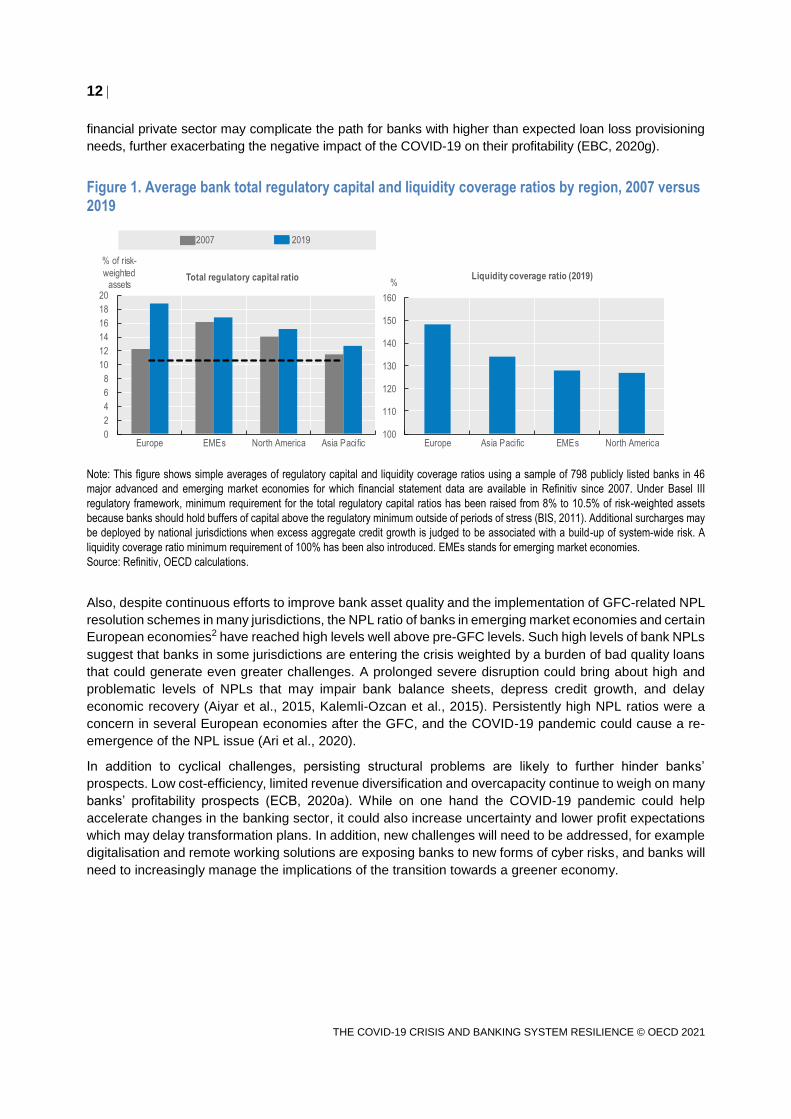
The resilience of banking systems in many OECD countries has been strengthened following the
implementation of the Basel III accords with higher minimum capital and liquidity requirements.1 In contrast
to the situation prior to the Global Financial Crisis (GFC) in 2008-2009, banks’ regulatory capital and
liquidity ratios stood at historically high levels globally at the end of 2019 (Figure 1). The total regulatory
capital ratio in 2019 ranged from 2 to 8 percentage points above the minimum regulatory requirement. The
highest increase has been recorded by European banks with a rise in the total regulatory capital ratio to
nearly 19% in 2019. Also, the liquidity coverage ratio in 2019 exceeded 100% in all banking systems
assessed. This suggests that banks may rely on their strong loss-absorbing capacities to face increased
credit provisions and draws on committed credit lines to corporate borrowers associated with the onset of
the COVID-19 pandemic (FED, 2020a and 2020d; IMF, 2020a and 2020b).
Nevertheless, the COVID-19 crisis raises challenges to the capital of certain banks, even though they
entered the crisis with higher capital ratios than before the GFC and despite the large monetary and fiscal
policy interventions aimed at containing the economic fallout from the current crisis (IMF, 2020b). In
particular, for the banks with a regulatory capital ratio that is slightly above the minimum regulatory
requirement, the erosion of the capital base due to rising loan losses not covered by reserves may require
the capital buffer to be replenished. For the banks with remaining capital buffers available, it is crucial to
address any impediments for using such buffers in order to avoid the risk of bank deleveraging which could
constrain credit intermediation to the real economy during the recovery (ECB, 2020g).
Vulnerabilities remain in several areas. Profitability has deteriorated substantially since the GFC and remains
subdued (Figure 2). Banks in Europe, emerging market economies and the Asia Pacific region have recorded
the sharpest decline of their return on equity (ROE) in 2019 compared to 2007. Furthermore, the ROE of
banks in the Asia Pacific is the lowest in 2019, standing at about half the ratio of banks in other advanced
economies. Such low levels of bank profitability suggests that banks have entered into the crisis with less
income available to offset losses than in the past (IMF, 2020a). Low interest margins may also be
exacerbated by the low interest rate environment, which is likely to persist following the unprecedented
monetary policy actions by major central banks since the beginning of 2020 (EBA, 2020b). In addition, income
generation from new businesses is likely to be impaired, and credit losses are set to increase, as banks are
increasingly confronted with delayed or missed payments on mortgages and a growing number of corporate
defaults (ECB, 2020a and 2020g; IMF, 2020a and 2020b). A weaker than expected economic recovery or
premature end to monetary and fiscal support measures, coupled with growing vulnerabilities in the non-
2 Assessment of bank non-
performing loans following the
COVID-19 crisis
12
THE COVID-19 CRISIS AND BANKING SYSTEM RESILIENCE © OECD 2021
financial private sector may complicate the path for banks with higher than expected loan loss provisioning
needs, further exacerbating the negative impact of the COVID-19 on their profitability (EBC, 2020g).
Figure 1. Average bank total regulatory capital and liquidity coverage ratios by region, 2007 versus 2019
Note: This figure shows simple averages of regulatory capital and liquidity coverage ratios using a sample of 798 publicly listed banks in 46
major advanced and emerging market economies for which financial statement data are available in Refinitiv since 2007. Under Basel III
regulatory framework, minimum requirement for the total regulatory capital ratios has been raised from 8% to 10.5% of risk-weighted assets
because banks should hold buffers of capital above the regulatory minimum outside of periods of stress (BIS, 2011). Additional surcharges may
be deployed by national jurisdictions when excess aggregate credit growth is judged to be associated with a build-up of system-wide risk. A
liquidity coverage ratio minimum requirement of 100% has been also introduced. EMEs stands for emerging market economies.
Source: Refinitiv, OECD calculations.
Also, despite continuous efforts to improve bank asset quality and the implementation of GFC-related NPL
resolution schemes in many jurisdictions, the NPL ratio of banks in emerging market economies and certain
European economies2 have reached high levels well above pre-GFC levels. Such high levels of bank NPLs
suggest that banks in some jurisdictions are entering the crisis weighted by a burden of bad quality loans
that could generate even greater challenges. A prolonged severe disruption could bring about high and
problematic levels of NPLs that may impair bank balance sheets, depress credit growth, and delay
economic recovery (Aiyar et al., 2015, Kalemli-Ozcan et al., 2015). Persistently high NPL ratios were a
concern in several European economies after the GFC, and the COVID-19 pandemic could cause a re-
emergence of the NPL issue (Ari et al., 2020).
In addition to cyclical challenges, persisting structural problems are likely to further hinder banks’
prospects. Low cost-efficiency, limited revenue diversification and overcapacity continue to weigh on many
banks’ profitability prospects (ECB, 2020a). While on one hand the COVID-19 pandemic could help
accelerate changes in the banking sector, it could also increase uncertainty and lower profit expectations
which may delay transformation plans. In addition, new challenges will need to be addressed, for example
digitalisation and remote working solutions are exposing banks to new forms of cyber risks, and banks will
need to increasingly manage the implications of the transition towards a greener economy.
0
2
4
6
8
10
12
14
16
18
20
Europe EMEs North America Asia Pacific
% of risk-
weighted assets
Total regulatory capital ratio
2007 2019
100
110
120
130
140
150
160
Europe Asia Pacific EMEs North America
% Liquidity coverage ratio (2019)

13
THE COVID-19 CRISIS AND BANKING SYSTEM RESILIENCE © OECD 2021
Figure 2. Average bank return on equity and non-performing loan ratio by region, 2007 versus 2019
Note: This figure shows simple averages of return on equity and non-performing loan ratio using a sample of 798 publicly listed banks in 46
major advanced and emerging market economies for which financial statement data are available in Refinitiv since 2007. EMEs stands for
emerging market economies.
Source: Refinitiv, OECD calculations.
Poor profitability and high levels of NPLs in certain jurisdictions have also driven down banks’ valuations
over the last decade (Detriagache et al., 2018; ECB, 2020g). While banks’ price-to-book value ratios have
recovered from a sharp fall during the GFC, they have flattened to low levels (Figure 3). This suggests that
rising vulnerabilities in a number of real sectors, potential legacy structural problems and the increasing
need to address climate risk could test some banks in the future (ECB, 2020g). Depending on the severity
of the impact of the COVID-19 crisis on asset quality and stock prices, some banks are likely to face more
adverse conditions to raise external capital and a substantial increase in their cost of equity (IMF, 2020a).
Figure 3. Average bank price-to-book value ratio by region, 2007 versus 2019
Note: This figure shows price-to-book value index calculated using Refinitiv bank regional indices. EMEs stands for emerging market economies.
Source: Refinitiv, OECD calculations.
0
5
10
15
20
25
Asia Pacific Europe North America EMEs
% of total
equity
Return on equity
0
1
2
3
4
5
6
7
8
EMEs Europe Asia Pacific North America
% of total
loans
Non-performing loan ratio
2007 2019
0
0.5
1
1.5
2
2.5
3
North America EMEs Asia Pacific Europe
Ratio
2007 2019
14
THE COVID-19 CRISIS AND BANKING SYSTEM RESILIENCE © OECD 2021
2.2. Methodology and simulation results of bank non-performing loans
throughout the COVID-19 crisis
This subsection will assess the impact of the COVID-19 pandemic on bank asset quality. For this purpose,
a simulation analysis of bank NPL ratio has been performed under a single-hit versus a double-hit scenario
informed by the OECD 2020 Economic Outlook and assuming extensive monetary and fiscal support
versus no support measures consistent with conditions that prevailed during the past crisis. This
subsection will explain the empirical methodology of the simulation analysis and discuss the results
obtained. The main objective of this is to evaluate the extent to which OECD member countries’ banking
systems may be impacted.
2.2.1. Empirical methodology of the non-performing loan simulation analysis following
the COVID-19 pandemic
The OECD warns that the potential global recession would be the deepest since the Great Depression
with some differences across countries, and would have material consequences for credit conditions. To
elaborate on this, the OECD 2020 Economic Outlook focused on two equally probable scenarios to reflect
the possible evolution of the global economy.3 These macro scenarios implicitly incorporate the effects of
broad macroeconomic and monetary policy measures that have been implemented in many jurisdictions
since the onset of the COVID-19 pandemic in 2020. By improving the liquidity of borrowers, these policies
indirectly affect the conditions of banks. As such, these two scenarios provide useful guideposts of the
potential paths of the pandemic and its impact on the real economy.
Under the single-hit scenario, it is assumed that containment measures successfully overcome the
outbreak with no expected resurgence in infections. Global economic activity is expected to fall by 6% in
2020 and OECD unemployment is expected to climb to 9.2%. This scenario has already proven to be
optimistic for some economies. While prospects for an eventual path out of the crisis have improved, with
encouraging news about progress in vaccine deployment, renewed virus outbreaks in many economies,
and the reintroduction of containment measures are slowing the pace of the rebound from the output
collapse in the first half of 2020, with renewed output declines in some economies.
Under the double-hit scenario, an easing of containment measures is assumed to be followed by a second,
but less intensive, virus outbreak taking place in late 2020. World economic output is expected to plummet
7.6% in 2020, before climbing back 2.8% in 2021. The OECD unemployment rate is expected to nearly
double to 10% with little recovery in jobs by 2021. These assumptions are supported by economic
developments as the aggregate economic impact of renewed restrictions appears lower than during the
first wave of the virus, but job-rich service activities with high levels of social interactions are being hard-
hit once again, raising risks of bankruptcies, higher unemployment in the absence of extended policy
support (OECD, 2020d). Already, given that numerous OECD countries have experienced a second wave
of infections since October 2020, the consideration of further deterioration of credit conditions is warranted.
Downside risks to bank asset quality arise from the detrimental impact of such a massive economic shock
on corporate and household insolvencies. The non-financial corporate sector was the first to be impacted,
with credit quality deteriorating sharply and suddenly as the global economy ground to a halt (OECD,
2020a). According to the S&P baseline scenario (S&P Global Ratings, 2021), speculative-grade corporate
default rates for the trailing 12 months are expected to rise to 9% by September 2021 from 6.3% in
September 2020 in the United States and to 8% by September 2021 from 4.3% in September 2020 in
Europe.4 Unprecedented monetary actions by major central banks and extensive fiscal support in many
advanced and emerging market economies could temper defaults in the near term. However, the surge in
corporate debt issuance in 2020 is adding to already-high leverage (Patalano and Roulet, 2020) at a time
when revenues are shrinking, costs are rising, and a recovery is uncertain which could lead to a prolonged
period of high defaults, rather than to a more typical turn in the credit cycle.5 Faced with these shortfalls,

15
THE COVID-19 CRISIS AND BANKING SYSTEM RESILIENCE © OECD 2021
businesses have little choice but to reduce costs and employment to withstand insolvency pressures.
Consequently, rising unemployment rates are affecting household revenues with negative consequences
on consumption and loan repayment capacity. According to Core Logic’s loan performance insights report
(2020), the overall delinquency rate of US home mortgages rose to 6.3% in September 2020, marking its
highest level since January 2016. Extensive public support measures in many countries, like payment
holidays, may dampen and delay the impact of the economic shock on the increase in unemployment and
on households’ fall in revenues. Nevertheless, rising defaults on household and business debt will
inevitably trigger substantial increase in bank NPLs.
In light on these dynamics, it is relevant to assess the potential rise in bank NPLs depending on the possible
evolution of the global economy following the COVID-19 crisis. The empirical framework underpinning the
analysis is inspired by several papers in the recent literature (IMF, 2014; Staehr and Uusküla, 2017;
Bonaccorsi di Patti and Cascarino, 2020; Heppe, 2020). A macroeconomic panel data for 37 major
advanced and emerging market economies is used to estimate a parsimonious projection model. The bank
NPL ratio is regressed against a set of indicators that capture the impact of macroeconomic and
macrofinancial conditions that may influence the ability of borrowers from the private sector (i.e. corporates
and households) to repay their loans and respond to economic shocks. Projected NPL ratios are calculated
using OECD forecasts under a single-hit versus a double-hit scenario for these macroeconomic variables.6
In quantifying the impact of monetary and fiscal support measures, average OECD projected rates on 2020
and 2021 are used to reflect the effectiveness of extensive monetary and fiscal support measures
implemented to mitigate the impact of the COVID-19 crisis on economic conditions. Alternately, expected
minimum or maximum rates in 2020 or 2021 depending on the indicator considered are used to reflect the
overall negative impact of the COVID-19 pandemic for corporates and households, i.e. both facing lower
earnings prospects due to deteriorated economic conditions and rising unemployment. The measure of
bank NPL ratio used in this analysis encompasses the credit risk of different sectors, namely corporates,
households and other sectors. Nevertheless, the COVID-19 pandemic is exerting abrupt effects with major
disruptions that may differ in nature and intensity across the several real sectors.7 In fact, the extensive
direct fiscal support provided to households would help to mitigate the negative consequences of the
COVID-19 crisis on their revenues. By contrast, corporates do not benefit from the same direct government
support, therefore the impact of deteriorating economic conditions tends to materialise in a shorter period
and leads actual earnings to reduce. Therefore, the credit risk profile of each sector may be explained by
different macroeconomic and financial variables. To assess these different effects, considering a
breakdown of NPLs by loan type would also be relevant. Unfortunately, these data are not publicly available
for many countries included in this study.
The main purpose of this simulation analysis is to compare the predicted NPL ratios with those observed
at the end of 2019 and also during the GFC to identify the regions which are likely to be most severely
impacted. Given the unprecedented nature of the shock and persisting uncertainty surrounding the severity
of the crisis and the prospects of an economic recovery, this analysis is designed to assess the magnitude
of the potential rise in bad quality assets based on hypothetical scenarios rather than forecast estimates.
Also, banks in many countries benefit from direct government support such as moratoria and credit
guarantees that may also help to avoid defaults on a select amount of performing and non-performing loan
exposures, or at least delay loan defaults. Nevertheless, downside risks are rising for banks given the
uncertainty surrounding the performance of these loans once these temporary measures would expire.
2.2.2. Results of the analysis
Projected NPL ratios by region under a single-hit versus a double-hit scenario, along with the latest NPL
ratios, are shown in Figure 4. Results also take into consideration the assumption of extensive monetary
and fiscal support versus no support measures in keeping with conditions that prevailed in the past crisis.

16
THE COVID-19 CRISIS AND BANKING SYSTEM RESILIENCE © OECD 2021
The simulation results suggest that bank NPL ratios would increase under a single-hit scenario in both
advanced and emerging market economies, and culminate under a double-hit scenario. Nevertheless,
extensive monetary and fiscal support measures help to mitigate the increase in bank NPLs in all regions
due to the massive economic shock following the COVID-19 outbreak. Notably, with this assumption
projected peaks would still stand below previous crises levels in most jurisdictions. Whereas, without
monetary and fiscal support measures, the increase in NPLs ratios would be more substantial under the
two scenarios and projected peaks would surpass previous crises levels in certain jurisdictions.
Figure 4. Average historical and projected non-performing loan ratios by region, calculated under OECD single-hit versus double-hit scenario
Note: This figure shows latest (i.e., as of end 2019), peak NPL ratios during the GFC or the European sovereign debt crisis and projected non-
performing loan ratios for banks in selected advanced and emerging market economies. Simple average ratios are calculated under single-hit
versus double-hit scenario informed by the OECD 2020 Economic Outlook. Non-performing loan projection model and data used to perform this
analysis are detailed in Annex A. EMEs and NPL stand for emerging market economies and non-performing loans respectively.
Source: IMF Financial Soundness Indicators Database, BIS Credit to the non-financial sector database, OECD National Account Database,
Refinitiv, OECD calculations.
With monetary and fiscal support measures, estimates suggest that projected NPL ratios would still
increase in all regions; and at least double for banks in Asia Pacific and North America. Nevertheless,
there is a high heterogeneity across countries as reflected by ranging NPL ratios between 0.6% and 37%
in selected advanced and emerging market economies under the most adverse scenario. Also, banks in
North America and emerging market economies would face the highest increase in NPL ratios under both
the single-hit and double-hit scenarios. In these regions, expected increases in NPL ratios range between
0.7 and 1.6 percentage points depending on the scenario considered. The increase in NPL ratios under
the single-hit scenario for banks in emerging market economies is mainly driven by two factors, elevated
long-term interest rates and leverage of non-financial firms relative to other regions (Table 1). Under the
double-hit scenario, the fall in the real GDP growth rate and remaining elevated interest rates would drive
the further increase in bank NPL ratios. Besides, the substantial gap between projected and actual NPL
0
1
2
3
4
5
6
7
8
9
Asia Pacific Europe North America EMEs
%
Without monetary and fiscal support measures
Historical maximum NPL ratio 2019 Single-hit scenario Double-hit scenario
0
1
2
3
4
5
6
7
8
9
Asia Pacific Europe North America EMEs
%
With monetary and fiscal support measures
17
THE COVID-19 CRISIS AND BANKING SYSTEM RESILIENCE © OECD 2021
ratios recorded under the single-hit scenario for banks in North America is largely driven by high bank
credit growth, moderate household disposable income growth and relatively high long-term interest rates
compared to other regions. Under the double-hit scenario, the additional increase in bank NPL ratios in
North America mainly relates to the sharpest deterioration in real GDP growth and household disposable
income growth compared to other regions. In the Asia Pacific region, high leverage of non-financial firms
and low growth in household disposable income compared to other regions are the dominant factors that
determine the magnitude of the gap between projected and actual NPL ratios. Under the double-hit
scenario, the fall in the real GDP growth rate and remaining high interest rates drive the increase in bank
NPL ratios. European banks mainly face a combination of relatively high leverage among non-financial
firms, high long-term interest rates and moderate household disposable income growth. Under the double-
hit scenario, the increase in NPL ratios is largely driven by the deterioration in real GDP growth and to a
lesser extent by the decline in household disposable income growth compared to North American banks.
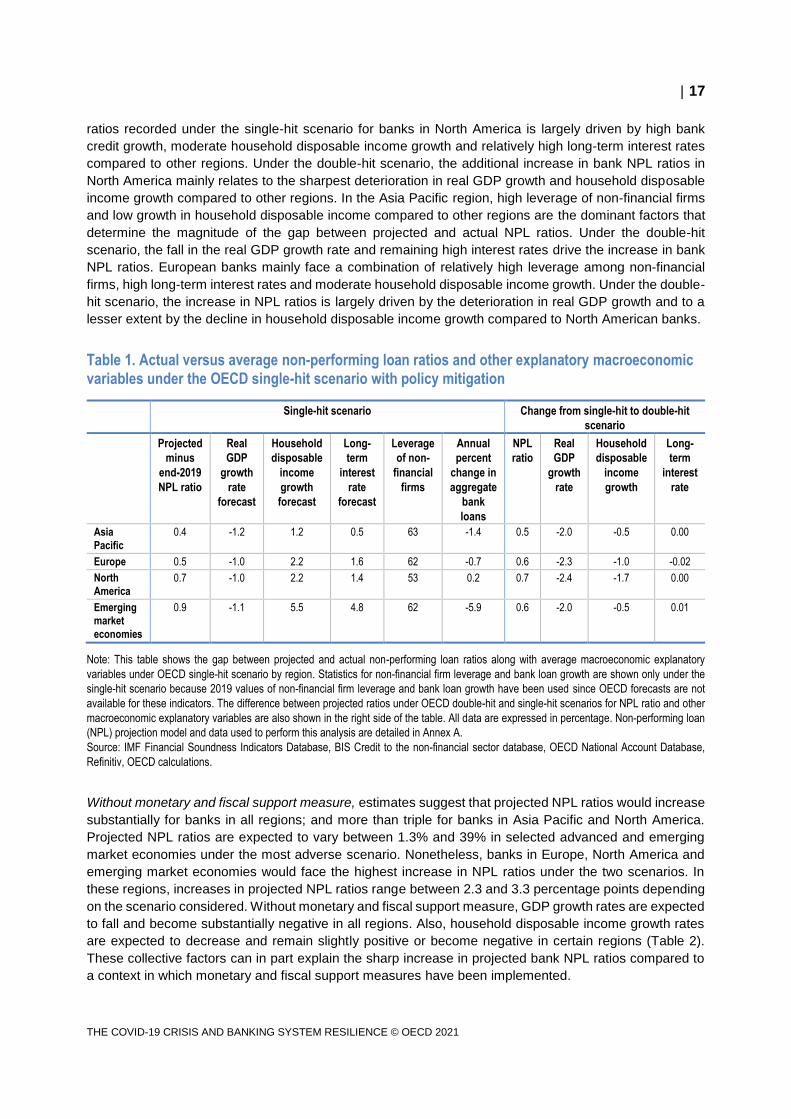
Table 1. Actual versus average non-performing loan ratios and other explanatory macroeconomic
variables under the OECD single-hit scenario with policy mitigation
Single-hit scenario Change from single-hit to double-hit
scenario
Projected
minus
end-2019
NPL ratio
Real
GDP
growth
rate
forecast
Household
disposable
income
growth
forecast
Long-
term
interest
rate
forecast
Leverage
of non-
financial
firms
Annual
percent
change in
aggregate
bank
loans
NPL
ratio
Real
GDP
growth
rate
Household
disposable
income
growth
Long-
term
interest
rate
Asia
Pacific
0.4 -1.2 1.2 0.5 63 -1.4 0.5 -2.0 -0.5 0.00
Europe 0.5 -1.0 2.2 1.6 62 -0.7 0.6 -2.3 -1.0 -0.02
North
America 0.7 -1.0 2.2 1.4 53 0.2 0.7 -2.4 -1.7 0.00
Emerging market
economies
0.9 -1.1 5.5 4.8 62 -5.9 0.6 -2.0 -0.5 0.01
Note: This table shows the gap between projected and actual non-performing loan ratios along with average macroeconomic explanatory
variables under OECD single-hit scenario by region. Statistics for non-financial firm leverage and bank loan growth are shown only under the
single-hit scenario because 2019 values of non-financial firm leverage and bank loan growth have been used since OECD forecasts are not
available for these indicators. The difference between projected ratios under OECD double-hit and single-hit scenarios for NPL ratio and other
macroeconomic explanatory variables are also shown in the right side of the table. All data are expressed in percentage. Non-performing loan
(NPL) projection model and data used to perform this analysis are detailed in Annex A.
Source: IMF Financial Soundness Indicators Database, BIS Credit to the non-financial sector database, OECD National Account Database,
Refinitiv, OECD calculations.
Without monetary and fiscal support measure, estimates suggest that projected NPL ratios would increase
substantially for banks in all regions; and more than triple for banks in Asia Pacific and North America.
Projected NPL ratios are expected to vary between 1.3% and 39% in selected advanced and emerging
market economies under the most adverse scenario. Nonetheless, banks in Europe, North America and
emerging market economies would face the highest increase in NPL ratios under the two scenarios. In
these regions, increases in projected NPL ratios range between 2.3 and 3.3 percentage points depending
on the scenario considered. Without monetary and fiscal support measure, GDP growth rates are expected
to fall and become substantially negative in all regions. Also, household disposable income growth rates
are expected to decrease and remain slightly positive or become negative in certain regions (Table 2).
These collective factors can in part explain the sharp increase in projected bank NPL ratios compared to
a context in which monetary and fiscal support measures have been implemented.

18
THE COVID-19 CRISIS AND BANKING SYSTEM RESILIENCE © OECD 2021
Table 2. Actual versus average non-performing loan ratio and other explanatory macroeconomic variables under the OECD single-hit scenario without policy mitigation
Single-hit scenario Change from single-hit to double-hit scenario
Projected
minus end-
2019 NPL
ratio
Real GDP
growth rate
forecast
Change in
disposable
income of
households
forecast
Long-term
rates
forecast
NPL
ratio
Real
GDP
growth
rate
Change in
disposable
income of
households
Long-
term
rates
Asia Pacific 2.0 -7.0 -1.4 0.5 0.4 -1.6 0.2 0.00
Europe 2.3 -7.1 -0.6 1.6 0.5 -1.8 -1.0 -0.01
North
America
2.3 -6.7 0.8 1.5 0.5 -1.8 -1.4 0.00
Emerging market
economies
2.8 -7.4 0.8 4.9 0.6 -2.0 -0.4 0.02
Note: This table shows the gap between projected and actual non-performing loan ratios along with average macroeconomic explanatory
variables under OECD single-hit scenario by region. The difference between projected ratios under OECD double-hit and single-hit scenarios
for NPL ratio and other macroeconomic explanatory variables are also shown in the right side of the table. All data are expressed in percentage.
Non-performing loan (NPL) projection model and data used to perform this analysis are detailed in Annex A.
Source: IMF Financial Soundness Indicators Database, OECD National Account Database, OECD calculations
Overall, the results of the simulation analysis suggest that policies adopted by governments and central
banks have helped ease banks’ challenges amid the COVID-19 crisis and mitigate the increase in bank
NPLs in both advanced and emerging market economies. Nevertheless, high heterogeneous projected
NPL ratios across countries reflect that some economies are expected to be more negatively impacted
than others. In these jurisdictions, banks are likely to be hit particularly hard, reflected in the strong
expected rise in their NPL ratios. These results indicate the potential for material tail risk (ECB, 2020e).
With or without widespread second outbreaks (which are already materialising in a number of jurisdictions),
the consequences will be severe for many banking sectors across the globe and bank NPL ratios are likely
to increase substantially in certain jurisdictions. A weaker than expected economic recovery, premature
end or insufficient monetary and fiscal support measures to mitigate negative consequences of the several
waves of the pandemic along with growing vulnerabilities in the non-financial private sector may entail
higher bank NPLs. Importantly, guarantees and moratoria appear to have lengthened the time it takes for
weak economic performance to translate into credit losses and NPLs for banks (ECB, 2020g). Despite this,
following the COVID-19 crisis, financial authorities in many countries will need to address NPL problems
in the banking sector and implement or revive NPL resolution schemes. Therefore, proactively identifying
distressed borrowers and managing deteriorating assets at an early stage could help contain the potential
impact of the COVID-19 crisis on bank NPL ratios (ECB, 2020f).
2.3. Consequences of rising non-performing loans and subsequent loan loss
provisions for bank earnings and valuations
The combination of credit losses, increase in LLPs and weaker revenues could gradually reduce bank
earnings and weaken bank ability to increase capital stock using profits generated internally.8 These
challenges could prevail in particular for the banks located in countries with the highest expected rise in
NPLs that are likely to face the most acute deterioration in their asset quality. Therefore, bank capital ratios
are susceptible to deterioration unless banks take steps to reduce risk-weighted assets through
deleveraging9 or strengthening their capital base using profits generated internally or by issuing equity
shares, which would be challenging under current conditions in which bank equity valuations are
historically low. The Federal Reserve (2020b and 2020d), the European Banking Authority (2020), the
19
THE COVID-19 CRISIS AND BANKING SYSTEM RESILIENCE © OECD 2021
European Central Bank (2020c and 2020h) and the IMF (2020b) have performed stress tests, including
credit losses, provisions, pre-tax net income, to assess the sensitivity of bank capital ratios under adverse
conditions. Findings from stress test analyses suggests that the banks that are the most at risk include
those that entered the crisis with existing idiosyncratic problems or those heavily exposed to the sectors
most affected by the COVID-19 crisis, and whose capital ratios might not suffice to weather the upcoming
challenges. The deterioration in asset quality and rising loan losses following the COVID-19 pandemic is
therefore likely to further weaken banks’ capabilities to absorb higher loan losses and possibly their lending
supply.
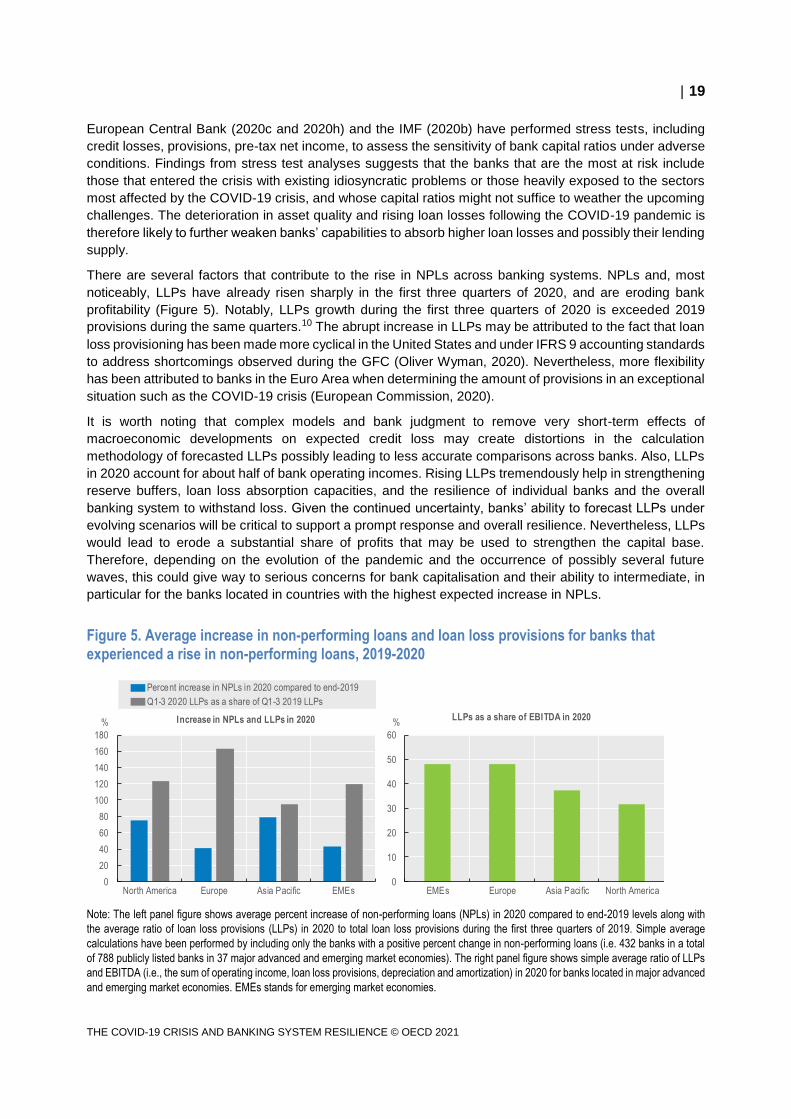
There are several factors that contribute to the rise in NPLs across banking systems. NPLs and, most
noticeably, LLPs have already risen sharply in the first three quarters of 2020, and are eroding bank
profitability (Figure 5). Notably, LLPs growth during the first three quarters of 2020 is exceeded 2019
provisions during the same quarters.10 The abrupt increase in LLPs may be attributed to the fact that loan
loss provisioning has been made more cyclical in the United States and under IFRS 9 accounting standards
to address shortcomings observed during the GFC (Oliver Wyman, 2020). Nevertheless, more flexibility
has been attributed to banks in the Euro Area when determining the amount of provisions in an exceptional
situation such as the COVID-19 crisis (European Commission, 2020).
It is worth noting that complex models and bank judgment to remove very short-term effects of
macroeconomic developments on expected credit loss may create distortions in the calculation
methodology of forecasted LLPs possibly leading to less accurate comparisons across banks. Also, LLPs
in 2020 account for about half of bank operating incomes. Rising LLPs tremendously help in strengthening
reserve buffers, loan loss absorption capacities, and the resilience of individual banks and the overall
banking system to withstand loss. Given the continued uncertainty, banks’ ability to forecast LLPs under
evolving scenarios will be critical to support a prompt response and overall resilience. Nevertheless, LLPs
would lead to erode a substantial share of profits that may be used to strengthen the capital base.
Therefore, depending on the evolution of the pandemic and the occurrence of possibly several future
waves, this could give way to serious concerns for bank capitalisation and their ability to intermediate, in
particular for the banks located in countries with the highest expected increase in NPLs.
Figure 5. Average increase in non-performing loans and loan loss provisions for banks that experienced a rise in non-performing loans, 2019-2020
Note: The left panel figure shows average percent increase of non-performing loans (NPLs) in 2020 compared to end-2019 levels along with
the average ratio of loan loss provisions (LLPs) in 2020 to total loan loss provisions during the first three quarters of 2019. Simple average
calculations have been performed by including only the banks with a positive percent change in non-performing loans (i.e. 432 banks in a total
of 788 publicly listed banks in 37 major advanced and emerging market economies). The right panel figure shows simple average ratio of LLPs
and EBITDA (i.e., the sum of operating income, loan loss provisions, depreciation and amortization) in 2020 for banks located in major advanced
and emerging market economies. EMEs stands for emerging market economies.
0
20
40
60
80
100
120
140
160
180
North America Europe Asia Pacific EMEs
% Increase in NPLs and LLPs in 2020
Percent increase in NPLs in 2020 compared to end-2019
Q1-3 2020 LLPs as a share of Q1-3 2019 LLPs
0
10
20
30
40
50
60
EMEs Europe Asia Pacific North America
%LLPs as a share of EBITDA in 2020

20
THE COVID-19 CRISIS AND BANKING SYSTEM RESILIENCE © OECD 2021
Source: Refinitiv, OECD calculations.
Despite depressed bank valuations due to profitability concerns, asset quality and resilience, the positive
news on the COVID-19 vaccine in November 2020 and more optimistic economic outlook for 2021 are
beginning to restore bank valuations from very low levels (Figure 6). These trends reflect global investors’
positive sentiment about the effect of an expected rebound in economic activity in 2021 to mitigate defaults
in the non-financial sector and further deterioration of bank asset quality (IMF, 2020b). Therefore, some
banks could be expected to accumulate lower than anticipated levels of non-performing loans on their
balance sheet and would be more able to support an economic recovery, in particular in economies largely
dependent on bank financing and with a large share of small and medium-size enterprises (SMEs) that are
not sufficiently able to tap capital markets. Also, expected additional fiscal stimulus in 2021 following the
Biden Administration’s plans to pursue a substantial stimulus plan, and growing inflation expectations upon
recovery. In the near term, long-term interest rates are expected to rise, which may boost banks’ profitability
in the United States.
Figure 6. Evolution of bank price-to-book ratio in 2020
Note: This figure shows price-to-book value index calculated using Refinitiv bank regional indices. EMEs stands for emerging market economies.
Source: Refinitiv, OECD calculations.
50
60
70
80
90
100
110
Jan-20 Feb-20 Mar-20 Apr-20 May-20 Jun-20 Jul-20 Aug-20 Sep-20 Oct-20 Nov-20 Dec-20
Index (100=Jan-2020)
Asia Pacific North America Europe EMEs

21
THE COVID-19 CRISIS AND BANKING SYSTEM RESILIENCE © OECD 2021
This section will assess the extent to which the potential deterioration in bank asset quality could impact
banks’ capacities to absorb higher loan losses. It identifies the banks that are the most exposed to credit
default risk from their loan portfolio, the extent of their safety buffer that helps strengthen their resilience,
and conditions in which additional policy responses may be needed.
3.1. Impact of simulated bank loan losses on capital levels
To examine the sensitivity of banks’ capacity to absorb higher loan losses due the deterioration in their
asset quality and a substantial rise in NPLs, analysis is performed to simulate the shock of the COVID-19
crisis. In doing this, this section assesses how much bank capital would be needed to absorb higher loan
losses and the subsequent erosion of banks’ regulatory capital ratios should risks in the scenario
materialise.
The magnitude of potential capital erosion due to a rise in non-performing loans is assessed under a single-
hit versus double-hit scenario informed by the OECD 2020 Economic Outlook, which reflects the extensive
monetary and fiscal supports that has been implemented in most jurisdictions to combat the effects of the
COVID-19 crisis. In this manner, the analysis identifies the banks that face the highest reduction in
regulatory capital from the credit default risk exposure of their loan portfolio relative to their safety buffer
that strengthens their resilience. The amount of bank losses that can be absorbed by loan loss reserves is
compared to the actual common equity Tier 1 (CET1) capital. Since the onset of the COVID-19 crisis,
government loan guarantees have been implemented in many jurisdictions. Therefore, the effect of bank-
specific policies is considered in this analysis in addition to extensive monetary and fiscal support
measures. Simulations under each scenario are first performed adjusting for how the bank-specific
mitigation policies may reduce the potential losses that a bank may face from assets exposed at potential
risk of losses. Estimates have also been generated to reflect a scenario without government loan
guarantees consistent with the conditions that prevailed during the past crisis. The purpose of this exercise
is to assess the amount of CET1 capital buffers that may be eroded by loan losses not covered by reserves
and the extent of a potential CET1 capital shortfall depending on the gradual severity in adverse scenarios,
including the consequences of extensive monetary and fiscal support measures and the possible
implementation of bank-specific mitigation policies.11
Overall, this analysis is intended to support a greater understanding of how bank asset quality would
deteriorate under hypothetical adverse economic conditions and the impact on bank resilience.12 Under
the Basel III regulatory framework, the Tier 1 capital ratio should be at least 4.5% of CET1 capital. CET1
capital represents the bank’s core capital and is a measure of a bank’s ability to withstand financial distress.
Under prolonged severe disruption, the CET1 capital ratio may deteriorate and banks may enter in what
may be called “caution” and “danger” zones (McKinsey, 2020a). In this analysis, banks may enter a
3 Implications of rising bank loan
losses for bank resilience and
solvency

22
THE COVID-19 CRISIS AND BANKING SYSTEM RESILIENCE © OECD 2021
“caution” zone if the CET1 capital ratio falls between 7% to 5.5%. In fact, such decline would imply that
banks must start to rebuild their capital cushions and comply with minimum capital conservation ratios.
Also, banks may enter a “danger” zone if their CET1 capital ratio falls to 5.5% or below.13
3.2. Results
The results of the simulation under a single-hit and double-hit scenarios show a decline in CET1 capital
ratios in all regions (Figure 7) despite the extensive monetary and fiscal support measures implemented
to combat the effects of the COVID-19 crisis. The magnitude of the deterioration in CET1 capital ratios
indicated significant heterogeneity across regions and scenarios. Nevertheless, government loan
guarantees could be expected to help reduce the decline of CET1 for banks in all regions.
Under the single-hit scenario, CET1 capital ratios could be expected to decrease by 0.7 to 1.1 percentage
points depending on the region adjusting for bank-specific mitigation policies. Without government loan
guarantees, the fall in CET1 capital ratios could be more substantial with declines ranging between 1 and
1.5 percentage points depending on the region. Nevertheless, CET1 capital ratio of banks in all regions
would remain above the “caution” zone limit.
Under the double-hit scenario, CET1 capital ratios could be expected to decrease by 1.2 to 1.8 percentage
points depending on the region adjusting for bank-specific mitigation policies. Under the most severe
adverse scenario, CET1 capital ratios could fall by 1.6 to 2.7 percentage points depending on the region.
CET1 capital ratios of banks in the Asia Pacific region in the simulation could be the lowest standing at
7.6%, a level that is slightly above the “caution” zone limit. CET1 capital ratios of banks in Europe or North
America would remain more elevated at 9.3% and 8.2% respectively.
Figure 7. CET1 capital ratio under single-hit and double-hit scenarios and policy mitigation
Note: This figure shows actual versus CET1 ratios calculated including loan losses not covered by reserves under single-hit versus double-hit
scenario informed by the OECD 2020 Economic Outlook reflecting extensive monetary and fiscal supports that have been implemented following
the COVID-19 crisis. Simulations under each scenario are performed with and without adjusting for the impact government loan guarantees.
Further details about the methodology and underlying bank sample are provided in Annex B.
Source: Refinitiv, OECD calculations.
0
2
4
6
8
10
12
14
Asia Pacific Europe North America
% of risk-weighted assets of banks with loan losses not
covered by reserves
Actual CET1 capital ratio Single-hit scenario with government loan guaranteesDouble-hit scenario with government loan guarantees Single-hit scenario without government loan guaranteesDouble-hit scenario without government loan guarantees Caution zone limitDanger zone limit

23
THE COVID-19 CRISIS AND BANKING SYSTEM RESILIENCE © OECD 2021
These results may be further complemented by examining the simulated NPLs in each region relative to
existing loan loss reserves (Figure 8). For example, while banks in the Asia Pacific region hold similar
levels of CET1 capital buffers to North American banks, the increase in NPLs would be offset to a lesser
extent by actual loan loss reserves for banks in Asia Pacific compared to North American banks. While
European banks are facing a substantial increase of their projected NPLs under the two scenarios, they
benefit from higher CET1 capital buffers and loan loss reserves to mitigate the effect of deteriorating asset
quality on their CET1 capital ratios.
Figure 8. Non-performing loans and loan loss reserves under single-hit and double-hit scenarios as a share of actual CET1 capital without government loan guarantees
Note: This figure shows bank non-performing loans (NPLs) as a share of CET1 capital. NPL simulation analysis is performed considering single-
hit versus double-hit scenario informed by the OECD 2020 Economic Outlook reflecting extensive monetary and fiscal supports that have been
implemented following the COVID-19 crisis but not government loan guarantees. LLRs stand for loan loss reserves. Further details about the
methodology and underlying bank sample are provided in Annex B.
Source: Refinitiv, OECD calculations.
Asset quality deterioration of banks in all regions would mostly result in CET1 capital buffer erosion under
the two scenarios (Figure 9). Nevertheless, some banks would face substantial CET1 capital shortfalls.14
Estimates further show that government loan guarantees are effective to mitigate the negative impact of
loan losses on capital for banks in all regions.15
These results suggest that among the banks that would face a capital reduction, for most banks their capital
ratios would remain above regulatory minimums. However, within each region there would be a number of
banks that could see their capital adequacy challenged. While the size of this tail depends on the severity
of the crisis, and despite the policies that have been adopted by governments and central banks to dampen
the negative impact of the COVID-19 crisis on real sectors, bank-specific policies in the form of loan
guarantees have provided a second line of defence to ease pressure. The capital reduction due to the
deterioration in bank asset quality is particularly concerning for the higher number of banks that are facing
a capital shortfalls under the double-hit scenario.16 The banks that could get uncomfortably close to
minimum capital levels in scenarios is tied to the effect COVID-19 pandemic on asset quality, therefore
indicating a need to improve their financial soundness, starting with rebuilding at least part of their capital
cushion (McKinsey, 2020a and 2020b).
0
5
10
15
20
25
30
35
40
45
Asia Pacific Europe North America
% of all banks CET1 capital
End-2019 NPLs NPLs under single-hit scenario NPLs under double-hit scenario End 2019 LLRs

24
THE COVID-19 CRISIS AND BANKING SYSTEM RESILIENCE © OECD 2021
Figure 9. Reduction in CET1 capital under single-hit and double-hit scenarios and policy mitigation
Note: This figure shows reduction in CET1 capital related to the erosion of the capital buffer versus the capital shortfall, expressed as a share
of CET1 capital of all banks included in the sample by region. Calculations have been performed under single-hit versus double-hit scenario
informed by the OECD 2020 Economic Outlook reflecting extensive monetary and fiscal supports that have been implemented following the
COVID-19 crisis. Simulations under each scenario are performed with and without adjusting for the impact government loan guarantees. Further
details about the methodology and underlying bank sample are provided in Annex B.
Source: Refinitiv, OECD calculations.
A strong capitalisation base is particularly important as markets have become increasingly aware of the
importance of a capital cushion to withstand external shocks following the GFC. Banks are likely to struggle
with capital formation due to falling revenues and profits following the COVID-19 crisis (ECB, 2020g). Given
the scarcity of available capital, banks will most likely need to reduce their dividend payouts and stock
buybacks and introduce compensation caps. After stress tests found that several banks could get
uncomfortably close to minimum capital levels in scenarios tied to the COVID-19 pandemic, the Federal
Reserve has put restrictions on US banks regarding share buybacks and dividend payments in 2020 (FED,
2020c and 2020d). The ECB has called banks not to pay dividends and to suspend share buy backs until
January 2021. In addition, the ECB expects banks to exercise extreme moderation on variable
remuneration to conserve capital in crisis (ECB, 2020d).17 Higher solvency risk may also complicate equity
issuance to restore regulatory capital ratios. Therefore, financial authorities may need to help the most
vulnerable banks in strengthening their capital base to mitigate a potential increase in systemic risk
triggered by the financial distress of a single or a couple of vulnerable banks. This could prevail in banking
systems already facing high NPLs before the COVID-19 crisis and that are likely to be severely impacted
by the economic shock with a high expected increase in NPLs.
Overall, these simulations show that aggregate capital ratios of the banking systems analysed would
remain above regulatory minimums even if the capital buffers accumulated as a result of the regulatory
reforms introduced after the GFC may be substantially eroded due to the deterioration in bank asset quality.
Nonetheless, results vary considerably across individual banks. In fact, while aggregate capital ratios
0
2
4
6
8
10
12
14
16
18
20
22
Asia Pacific Europe North America
% of all
banks CET1 capital Without government loan guarantees
0
2
4
6
8
10
12
14
16
18
20
22
Asia Pacific Europe North America
% of all
banks CET1 capital With government loan guarantees

25
THE COVID-19 CRISIS AND BANKING SYSTEM RESILIENCE © OECD 2021
remain above regulatory minimums within regions, there is a weak tail of banks that could see their capital
adequacy challenged. The results of this analysis suggest that bank-specific measures in the form of
government loan guarantees combined with monetary and fiscal support measures help ease banks’
challenges amid the COVID-19 crisis. Therefore, the extent to which the announced guarantee programs
are used could be an important driver of bank solvency positions and resilience, in particular for the higher
number of banks that are facing a capital shortfall under adverse conditions. Looking ahead, the benefits
of monetary and fiscal support measures and government loan guarantees in easing banks’ capital
constraints to maintain the flow of credit to the real economy should be carefully balanced against their
potential medium-term risks (IMF, 2020b). In fact, phasing out support measures, including government
loan guarantees too quickly would lead to a delay in economic recovery. However, phasing it out too late
could also risk damaging public finances and unduly support credit conditions for already distressed highly
leveraged borrowers. These decisions that will need to be taken by policy makers will have major
implications for bank asset quality and resilience. It is thus important that some of these measures be
carefully phased out as the economy recovers.
Policy makers should pay particular attention to their communication strategy and the quality of the
information released to strengthen confidence in the banking system and ensure overall stability (FSB,
2020). The banking sector would benefit from clarity and stability on the time horizon afforded to them by
authorities to make use of temporary monetary and fiscal support measures and government loan
guarantees. For example, this would enable banks to carry out better capital planning that may also
improve in turn buffer usability at the current juncture.

26
THE COVID-19 CRISIS AND BANKING SYSTEM RESILIENCE © OECD 2021
This section will assess to which the erosion of bank CET1 capital due to the deterioration in asset quality
may lead to the conversion of contingent convertible bonds (CoCos). This analysis is intended to assess
the amount of CoCos that may be triggered due to substantial loan losses not covered by reserves. The
objective is to investigate the effectiveness of CoCos to provide banks an additional source of equity
following the deterioration of the capital base due rising NPLs.
4.1. Background and historical trends in bank contingent convertible bond
issuance
During the GFC, many banks experienced capital shortfalls to the extent that regulators had to accept
bailout resolutions as the only possible stabilizing form of intervention.18 In addition to more stringent bank
capital and liquidity requirements, regulators have also created new instruments to facilitate the write-down
of the debt of distressed institutions.19 One tool to achieve this objective is through the issuance of
contingent convertible capital securities (CoCos) to meet part of their regulatory capital requirements.
CoCos are similar to equity capital in that they can strengthen banks’ capital positions under stressed
conditions,20 i.e. when issuing equity may be difficult.21 The Basel III regulatory framework includes specific
contingent capital elements that have brought some homogeneity in CoCo design across jurisdictions.
Following gradual implementation of the Basel III accords, banks in a number of jurisdictions responded
by raising a substantial amount of capital in the form of CoCo issuance. Between 2009 and second quarter
of 2020, banks in OECD economies issued a total of USD 450 billion in CoCos (Figure 10), with European
banks representing nearly 60% of total issuance. Also, 60% of CoCos issued could qualify as Additional
Tier 1. Therefore, CoCo conversion would help strengthening bank’s ability to withstand financial distress
by increasing the core capitalisation base that is formed of Tier 1 capital. Besides, 63% of CoCos issued
allow banks to raise equity by incurring a write-down instead of converting into equity.22 In fact, loss
absorption mechanisms of CoCos are made up of two types. A conversion to equity CoCo increases CET1
capital by converting into equity at a pre-defined conversion rate. By contrast, a principal writedown CoCo
raises equity by incurring a write-down.
4.2. Assessment of contingent convertible bonds that may be triggered due to
the deterioration in bank asset quality
The capacity of banks to absorb higher loan losses is likely to deteriorate depending on the severity of the
COVID-19 crisis and the magnitude of the rise in NPLs. Therefore, regulatory capital ratios may be eroded
by loan losses not covered by reserves and may cause the conversion of CoCos into loss-absorbing equity.
4 Potential impact of rising bank loan
losses for the conversion of
contingent convertible bonds

27
THE COVID-19 CRISIS AND BANKING SYSTEM RESILIENCE © OECD 2021
Figure 10. Contingent convertible bond issuance of banks in OECD economies, 2009-2020
Note: The top panel figure shows contingent convertible bond (CoCo) issuance by banks in OECD economies since January 2009 until the end
of second quarter 2020. Assessment of bank Coco issuance has been performed using Coco bond data issued by individual banks in OECD
countries since 2009 from Refinitiv. CoCos qualified as either Additional Tier 1 or Tier 2 capital are included regardless of their loss absorption
mechanism (i.e., conversion to equity or principal write-downs). However, CoCos that are classified as preferred shares are excluded. Detailed
about the data and the methodology are provided in Annex C.
Source: Refinitiv, OECD calculations.
To assess the effectiveness of CoCos in providing banks an additional source of equity following the
deterioration of the capital base due to rising non-performing assets, an analysis is performed to determine
the extent of CoCos that would be triggered under stressed conditions. This analysis questions, among
the banks that are issuing CoCos, what extent of CoCos would likely be converted into loss absorbing
equity.23 To assess the maximum amount of CoCos that may be converted into equity, estimates are
performed under most adverse conditions in the absence of government loan guarantees. Overall, this
analysis is intended to provide a greater understanding of how banks facing an erosion of their capital base
may rely on their CoCos to strengthen their resilience and potentially address capital adequacy issues. It
should be noted that CoCos are not the only instrument that help addressing bank capital depletion.
Notably, the European resolution framework introduced by the Bank Recovery and Resolution Directive
(Official Journal of the European Union, 2014) allows the conversion of a much larger class of liabilities
Europe
59%Japan
17%
Australia
9%
Other
OECD15%
Country distribution
Tier 1
60%
Tier 2
40%
Tier capital distribution
Write-
down65%
Conver
sion35%
Loss absorption type
0
10
20
30
40
50
60
70
80
90
100
2009 2010 2011 2012 2013 2014 2015 2016 2017 2018 2019 Q1-2 2020
USD, bn

28
THE COVID-19 CRISIS AND BANKING SYSTEM RESILIENCE © OECD 2021
than additional Tier 1 and Tier 2 capital (including non-preferred senior debt and even uninsured deposits)
under conditions (i.e., “likely to fail”) which could be triggered prior to the CoCos conversion threshold.
4.3. Results of the analysis
Figure 11 offers an overview of the extent of CoCos conversion under a single-hit versus double-hit
scenario. The share of CoCos converted into loss absorbing equity in total outstanding would be lower for
European banks than for banks in other OECD economies. Notably, the amount of CoCos converted into
loss absorbing equity for European banks ranges between 6% and 25% of total CoCos outstanding under
a single-hit versus double-hit scenario while it varies between 33% and 51% for banks in other OECD
economies. These findings suggest that European banks benefit from their substantial CET1 capital buffer
in line with the discussion in the previous sections. Therefore, the reduction in their CET1 capital due to
the deterioration of their asset quality leads to a limited number of CoCos to be converted into loss
absorbing equity. Also, the capital depletion of banks in other OECD economies would result in a higher
number of CoCos converted into equity that could help them strengthening their capital base as their actual
CET1 capital buffers are lower than those of European banks.
Figure 11. Share of contingent convertible bonds converted into loss absorbing equity following the deterioration in bank capital in total outstanding under single-hit and double-hit scenarios
Note: This figure shows the amount of CoCos that maybe triggered following a deterioration of CET1 capital ratio due to the rise in NPLs under
single-hit versus double-hit scenario informed by the OECD 2020 Economic Outlook. Only the banks in OECD economies (excluding the United
States) are included in this sub-sample (i.e., 130 banks). Asset quality simulation analysis framework is detailed in Annex B. Assessment of
bank Coco outstanding has been performed using Coco bond data issued by individual banks in OECD countries since 2009 from Refinitiv.
Detailed about the data and the methodology are provided in Annex C.
Source: Refinitiv, OECD calculations.
Deeper investigation shows that only a small portion of banks that face a CET1 capital shortfall in OECD
economies would be able to trigger their CoCos (Figure 12). Also, a large portion of European banks facing
reduction in their CET1 capital would not need to convert their CoCos into loss absorbing equity compared
to banks in other OECD economies. These results may be explained by the fact that European banks hold
0
10
20
30
40
50
60
70
80
Single-hit scenario Double-hit scenario
% of total bank CoCo outstanding
OECD Europe Other OECD economies
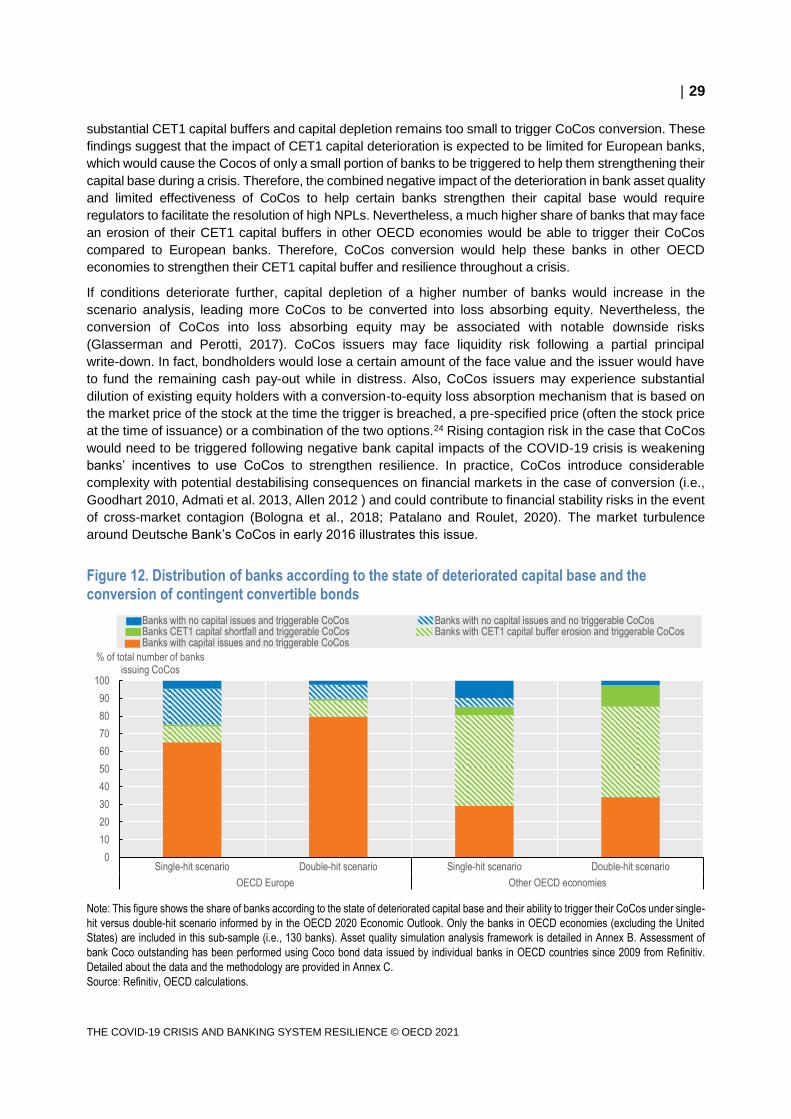
29
THE COVID-19 CRISIS AND BANKING SYSTEM RESILIENCE © OECD 2021
substantial CET1 capital buffers and capital depletion remains too small to trigger CoCos conversion. These
findings suggest that the impact of CET1 capital deterioration is expected to be limited for European banks,
which would cause the Cocos of only a small portion of banks to be triggered to help them strengthening their
capital base during a crisis. Therefore, the combined negative impact of the deterioration in bank asset quality
and limited effectiveness of CoCos to help certain banks strengthen their capital base would require
regulators to facilitate the resolution of high NPLs. Nevertheless, a much higher share of banks that may face
an erosion of their CET1 capital buffers in other OECD economies would be able to trigger their CoCos
compared to European banks. Therefore, CoCos conversion would help these banks in other OECD
economies to strengthen their CET1 capital buffer and resilience throughout a crisis.
If conditions deteriorate further, capital depletion of a higher number of banks would increase in the
scenario analysis, leading more CoCos to be converted into loss absorbing equity. Nevertheless, the
conversion of CoCos into loss absorbing equity may be associated with notable downside risks
(Glasserman and Perotti, 2017). CoCos issuers may face liquidity risk following a partial principal
write-down. In fact, bondholders would lose a certain amount of the face value and the issuer would have
to fund the remaining cash pay-out while in distress. Also, CoCos issuers may experience substantial
dilution of existing equity holders with a conversion-to-equity loss absorption mechanism that is based on
the market price of the stock at the time the trigger is breached, a pre-specified price (often the stock price
at the time of issuance) or a combination of the two options.24 Rising contagion risk in the case that CoCos
would need to be triggered following negative bank capital impacts of the COVID-19 crisis is weakening
banks’ incentives to use CoCos to strengthen resilience. In practice, CoCos introduce considerable
complexity with potential destabilising consequences on financial markets in the case of conversion (i.e.,
Goodhart 2010, Admati et al. 2013, Allen 2012 ) and could contribute to financial stability risks in the event
of cross-market contagion (Bologna et al., 2018; Patalano and Roulet, 2020). The market turbulence
around Deutsche Bank’s CoCos in early 2016 illustrates this issue.
Figure 12. Distribution of banks according to the state of deteriorated capital base and the conversion of contingent convertible bonds
Note: This figure shows the share of banks according to the state of deteriorated capital base and their ability to trigger their CoCos under single-
hit versus double-hit scenario informed by in the OECD 2020 Economic Outlook. Only the banks in OECD economies (excluding the United
States) are included in this sub-sample (i.e., 130 banks). Asset quality simulation analysis framework is detailed in Annex B. Assessment of
bank Coco outstanding has been performed using Coco bond data issued by individual banks in OECD countries since 2009 from Refinitiv.
Detailed about the data and the methodology are provided in Annex C.
Source: Refinitiv, OECD calculations.
0
10
20
30
40
50
60
70
80
90
100
Single-hit scenario Double-hit scenario Single-hit scenario Double-hit scenario
OECD Europe Other OECD economies
% of total number of banks issuing CoCos
Banks with no capital issues and triggerable CoCos Banks with no capital issues and no triggerable CoCosBanks CET1 capital shortfall and triggerable CoCos Banks with CET1 capital buffer erosion and triggerable CoCosBanks with capital issues and no triggerable CoCos

30
THE COVID-19 CRISIS AND BANKING SYSTEM RESILIENCE © OECD 2021
The impact of the COVID-19 pandemic has already brought major economic disruptions globally and the
economic consequences are now having unprecedented effects. If this situation persists, solvency risk of
corporates and households would rise substantially with detrimental effects on bank NPLs. Empirical
evidence suggests that policies adopted by governments and central banks have helped ease banks’
challenges amid the COVID-19 crisis and mitigate the increase in bank NPLs in both advanced and
emerging market economies. Nevertheless, high heterogeneous projected NPL ratios across countries
reflect that some economies are expected to be more negatively impacted than others. A weaker than
expected economic recovery, premature end or insufficient monetary and fiscal support measures to
mitigate negative consequences of the several waves of the pandemic along with growing vulnerabilities
in the non-financial private sector may also entail higher bank NPLs.
Guarantees and moratoria appear to have lengthened the time it takes for weak economic performance to
translate into credit losses and NPLs for banks (ECB, 2020g). Notably, loan forbearance measures aimed
at easing financial constraints on debtors and banks have been implemented in the United States under
the Coronavirus Aid, Relief, and Economic Security (CARES) Act and in the European Union (EBA, 2020c)
following the COVID-19 crisis. 25 In some jurisdictions, mortgage payments have completely paused for a
period of time or even the terms and conditions of the loan contract may be modified (i.e. loan restructuring)
to avoid the debtor to default. 26 Nevertheless, under the new terms of the loan contract or at the end of
the loan payment suspension period, the debtor would not be able to meet his commitments and the
exposure will be considered as non-performing resulting in loan losses for the lender. These measures will
help to avoid defaults on certain amounts of performing and non-performing loan exposures, or at least
delay loan defaults. More defaults are likely to be avoided if loans under forbearance are performing
exposure. The effectiveness of these measures would depend on the evolution of economic conditions
and the extent to which future waves materialise eroding further the credit quality of debtors.
The combination of worsening economic conditions and rising NPLs are likely to weaken banks’ loss
absorption capacities. Despite the mitigating effect of government policies, the capital reduction due to the
deterioration in bank asset quality would be particularly concerning for the larger number of banks that are
facing a capital shortfall under the double-hit scenario. Measures taken by financial authorities would help
the most vulnerable banks strengthen their capitalisation to mitigate a potential increase in systemic risk
triggered by the financial distress of a single or a couple of vulnerable banks. Particularly, in banking
systems already facing high NPLs before the COVID-19 crisis and that are likely to be severely impacted
by the economic shock with high expected increase in NPLs.
In the aftermath of the GFC, NPLs have been a major concern for supervisors, policymakers and market
participants particularly in the European Union (EBA, 2019). In July 2017 the Council of the European
Union published a comprehensive action plan to address legacy assets in the region (European Council,
2019). Several approaches may be considered for bank NPL resolution (ECB, 2017; BIS, 2017a, 2020a)
that consist either of internal recovery options (i.e., loan write-offs, decentralised asset management
company, asset protection schemes) or market-based solutions (i.e., direct sales, securitisation,
centralised asset management companies). Despite substantial improvements, legacy assets remain
5 Assessment and high level policy
considerations

31
THE COVID-19 CRISIS AND BANKING SYSTEM RESILIENCE © OECD 2021
material in a few countries (EBA, 2019). In light of weakening economic conditions following the COVID-
19 pandemic, the problem of bank NPLs is likely to worsen in countries that were already facing high NPLs
before the COVID-19 crisis and to become more acute otherwise. In this context, banks should closely
monitor their asset quality to identify any possible deterioration, especially in riskier segments, and to
continue to actively manage NPLs from their balance sheets. Ultimately, efficient solutions for dealing with
NPLs would help originating banks to focus on supporting the future productive output of the real economy.
Banks appear to have started to address some challenges as a result of the COVID-19 pandemic. Notably,
many banks have strengthened their cost-cutting efforts further reducing the number of staff and branches,
but low profitability may hinder the meeting of digital transformation needs (ECB, 2020g). Consolidation
via mergers and acquisitions could be one potential avenue for reducing overcapacity in the sector.
Planned domestic and across border mergers in addition to a number of already completed deals in some
countries in 2020 provide an encouraging sign (Financial Times, 2020). In parallel, banks face increasing
urgency to manage the implications of environmental challenges and the transition to a greener economy.
Therefore, in this case medium-term risks may arise particularly for the banks heavily exposed to sectors
with high carbon emissions.
The lack of efficient solutions to deal with the erosion of bank capital may trigger balance sheet adjustments
due to deleveraging with negative consequences for the real economy. Banks experiencing capital
shortfalls are likely to decrease lending relatively more (ECB, 2019; BIS, 2020b). Substantial contraction
in credit supply may lead to a lack of funding sources in particular for corporates and low credit quality
households, which typically represent the riskiest segment of a bank’s loan portfolio. All this may contribute
to depress consumption, investment and economic growth. It may also boost alternative sources of lending
that are subject to less regulatory scrutiny possibly resulting in higher financial stability risk. Lastly, many
of the COVID-19 programmes supported by the government rely on banks to grant the loans (OECD,
2020b). If banks are facing greater challenges and become risk adverse, reducing their credit supply, it
could further constrain government efforts to channel crisis lending to the real economy.
Looking ahead, the benefits of monetary and fiscal support measures and government loan guarantees in
easing banks’ challenges amid the COVID-19 crisis should be carefully balanced against their potential
medium-term risks. Establishing effective exit strategies from COVID-19 financing support programmes is
an imperative for policymakers and will be important to ensure that when borrowing conditions normalise
it does not result in a significant increase in NPLs. Including through loan foreclosure incentives for banks
as the termination of guarantees approach, which would reduce collateral values for loans, thus increasing
banks’ risk of holding NPLs. Therefore governments may want to closely monitor measures to support
insolvent but viable companies that benefited from direct lending from the government (or from guaranteed
lending) in restructuring their debt going forward. In addition measures such as implementing extensions
to repayment, or thresholds for debt repayment depending on the annual turnover and growth of
companies, allowing them to repay debt at a lesser burden, and strengthen corporate solvency and mitigate
a significant increase in bank NPLs (OECD, 2020e). The decisions that will need be taken by policy makers
will have major implications for bank asset quality and resilience. Therefore, policy makers should pay
particular attention to their communication strategy and the quality of the information released to strengthen
confidence in the banking system and ensure overall stability.

32
THE COVID-19 CRISIS AND BANKING SYSTEM RESILIENCE © OECD 2021
Admati, A. R., DeMarzo, P. M., Hellwig, M. F. and P. C. Pfleiderer (2013), “Fallacies, irrelevant facts, and
myths in the discussion of capital regulation: Why bank equity is not socially expensive,” Max Planck
Institute for Research on Collective Goods 2013/23, Rock Center for Corporate Governance at
Stanford University Working Paper No. 161, Stanford University Graduate School of Business
Research Paper No. 13-7, October.
Aiyar, S., Bergthaler, W., Garrido, J. M., Ilyina, A., Jobst, A., Kang, K., Kovtun, D., Liu, Y., Monaghan, D.
and M. Moretti (2015), “A strategy for resolving Europe’s problem loans”, IMF Staff Discussion Note
15/19, September.
Allen, H. J. (2012), “Cocos can drive markets cuckoo,” Lewis & Clark Law Review, Vol. 16, Issue 1
(Spring 2012), pp. 125-168.
Altman, E. I., Resti, A. and A. Sironi (2006), “Default recovery rates: A review of the literature and recent
empirical evidence,” Journal of Finance Literature, Winter, 21-45.
Angelini, P. (2018), “Do high levels of NPLs impair banks’ credit allocation?” Bank of Italy, Notes on
financial stability and supervision No 11, April.
Ari, A., Chen, S. and M. L. Ratnovski (2020), “The dynamics of non-performing loans during banking
crises: a new database”, ECB Working Paper 2395, April.
BIS (2020a), “Bad bank resolutions and bank lending”, BIS Working Papers No 837, January.
BIS (2020b), “Releasing bank buffers to cushion the crisis: a quantitative assessment”, BIS Bulletin No.
11, May.
BIS (2020c), “Countercyclical capital buffer (CCyB)”, May.
BIS (2019), “Risk-based capital requirements: Buffers above the regulatory minimum”, RBC30,
December.
BIS (2017a), “Resolution of non-performing loans: Policy options”, Financial Stability Institute, insights on
policy implementation No 3, October.
BIS (2017b), “CoCo issuance and bank fragility”, BIS Working Papers No 678, November.
BIS (2017c), “High-level summary of Basel III reforms”, December.
BIS (2016), “Prudential treatment of problem assets: Definitions of non-performing exposures and
forbearance”, Guidelines”, BIS Quarterly Review, September.
BIS (2013), “CoCos: A primer”, BIS Quarterly Review, September.
BIS (2011), “Basel III: A global regulatory framework for more resilient banks and banking systems”,
revised version June.
Boermans, M., Petrescu, S. and R. Vlahu (2014), “The future for CoCos”, CEPR Policy Portal,
November.
Bologna, P., Miglietta, A. and A. Segura (2018), “Contagion in the CoCos market? A case study of two
stress events”, Economic working papers 1201, Bank of Italy, Economic Research and International
Relations Area.
Bonaccorsi di Patti, E. and G. Cascarino (2020), “Modelling the dynamics of nonperforming loans in
Italy”, Banca D’Italia, Notes on Financial Stability and Supervision, No. 44, February.
References

33
THE COVID-19 CRISIS AND BANKING SYSTEM RESILIENCE © OECD 2021
Borio, C., Vale, B. and G. Von Peter (2010), “Resolving the financial crisis: are we heeding the lessons
from the Nordics?“, Bank for International Settlements, Working Paper No 311, June.
Chavan, P. and L. Gambacorta (2016), “Bank lending and loan quality: the case of India”, BIS Working
Papers 595, Bank for International Settlements.
Core Logic (2020), “Loan performance insights report”, September.
Dagher, J., Dell’Ariccia, G., Laeven, L., Ratnovski, M. L. and M. H. Tong (2020), “Bank capital: A seawall
approach”, International Journal of Central Banking, International Journal of Central Banking, Vol.
16(2), pp. 249-291, March.
Deloitte (2019), “Deleveraging Europe”, October.
Detragiache, E., Tressel, T. and R. Turk-Ariss (2018), “Where have all the profits gone? European bank
profitability over the financial cycle”, IMF Working Paper, WP/18/99, April.
EBA (2020a), “Risk dashboard: Data as of Q4 2019”, April.
EBA (2020b), “The EU banking sector: first insights into the COVID-19 impacts”, Thematic note,
EBA/REP/2020/17, May.
EBA (2020c), “Guidelines on legislative and non-legislative moratoria on loan repayments applied in the
light of the COVID-19 crisis”, June.
EBA (2019), “EBA Report on NPLs: Progress made and challenges ahead”, November.
EBA (2016), “The dynamics and drivers of non-performing exposures in the EU banking sector“, July.
ECB (2020a), “Financial Stability Review”, May.
ECB (2020b), “Do non-performing loans matter for bank lending and the business cycle in euro area
countries?”, ECB Working Paper Series No 2411, May.
ECB (2020c), “COVID-19 Vulnerability Analysis”, July.
ECB (2020d), “ECB extends recommendation not to pay dividends until January 2021 and clarifies
timeline to restore buffers”, Press Release, July.
ECB (2020e), “An evolving supervisory response to the pandemic”, Speech by Andrea Enria, Chair of the
Supervisory Board of the ECB, at the European Banking Federation high-level public dialogue,
October.
ECB (2020f), “Bank asset quality: this time we need to do better”, Opinion piece by Andrea Enria, Chair
of the Supervisory Board of the ECB, a short version was published in the Financial Times on 27
October 2020 October.
ECB (2020g), “Financial Stability Review”, November.
ECB (2020h), “ECB publishes supervisory banking statistics for the second quarter 2020”, October.
ECB (2019), “Macroprudential stress test of the euro area banking system”, ECB Occasional Paper
Series No 226, July.
ECB (2017), “Resolving non-performing loans in Europe”, July.
European Commission (2020), “Commission Interpretative Communication on the application of the
accounting and prudential frameworks to facilitate EU bank lending: Supporting businesses and
households amid COVID-19”, Communication from the commission to the European parliament and
the Council, Brussels, April.
European Council (2019), “Council conclusions on action plan to tackle non-performing loans in Europe”,
Press releases, Brussels, July.
ESRB (2020), “Countercyclical capital buffer”, September.
FDIC (1997), “History of the 80s“, in Lessons for the Future, Vol. 1, Washington D.C., December.
Federal Reserve (2020a), “Financial Stability Report”, Federal Board of Governors of the Federal
Reserve System, Washington D.C, May.

34
THE COVID-19 CRISIS AND BANKING SYSTEM RESILIENCE © OECD 2021
Federal Reserve (2020b), “Dodd-Frank Act Stress Test 2020: Supervisory Stress Test Results”, Federal
Board of Governors of the Federal Reserve System, Washington D.C, June.
Federal Reserve (2020c), “Federal Reserve Board releases results of stress tests for 2020 and additional
sensitivity analyses conducted in light of the coronavirus event”, Press Release, Federal Board of
Governors of the Federal Reserve System, Washington D.C, June.
Federal Reserve (2020d), “December 2020 Stress Test Results”, Federal Board of Governors of the
Federal Reserve System, Washington D.C, December.
Financial Stability Oversight Council (2012), “Report to Congress on a study of a contingent capital
requirement for non-bank financial companies and bank holding companies”, Completed pursuant to
Section 115(c) of the Dodd-Frank Wall Street Reform and Consumer Protection Act, July.
Financial Times (2021), “Investors warm to US bank stocks in 2021”, January.
Financial Times (2020), “Spanish banks seek firmer footing with round of mergers”, November.
FSB (2020), “COVID-19 pandemic: Financial stability implications and policy measures taken”, Report
submitted to the G20 Finance Ministers and Governors, July.
Fung, B.,George, J., Hohl, S. and G. Ma (2004), “Public asset management companies in East Asia: A
comparative study”, Bank for International Settlements, Financial Stability Institute, Occasional Paper,
No 3, Basel, February.
Glasserman, P. and E. Perotti (2017), “The unconvertible CoCo bonds”, Chapter 23, in Achieving
financial stability: Challenges to prudential regulation, 2017, pp. 317-329.
Goncharenko, R., Ongena, S. and A. Rauf (2019), “The agency of CoCos: Why contingent convertible
bonds aren’t for everyone”, CEPR Policy Portal, March.
Goodhart, C. (2010), “Are CoCos from cloud cuckoo-land?” Central Banking, No 21, pp. 29–33.
Heppe, B. (2020), “Forecasting NPL ratios after COVID-19”, NPL Markets, May.
IMF (2020a), “Global Financial Stability Report”, Washington D.C., April.
IMF (2020b), “Global Financial Stability Report”, Washington D.C., October.
IMF (2017), “Greece selected issues”, IMF Staff country report, No 17/41, Washington D.C., February.
IMF (2014), “A practical example of the non-performing loans projection approach to stress testing”,
Chapter 30, A Guide to IMF Stress Testing : Methods and Models, Washington D.C., December.
Jiménez, G. and J. Saurina (2006), “Credit cycles, credit risk, and prudential regulation”, International
Journal of Central Banking, No 2, pp. 65–98.
Johnston Ross, E. B. and L. Shibut (2015), “What drives Loss Given Default? Evidence from commercial
real estate loans at failed banks”, Working Paper No. 2015-03, FDIC Center for Financial Research,
March.
Kalemli-Ozcan, S., Laeven, L. and D. Moreno (2015), “Debt overhang, rollover risk and investment in
Europe”, Mimeo, University of Maryland.
Kleinnijenhuis, A., Kodres, L. and T. Wetzer (2020), “Unusable bank capital”, CEPR Policy Portal, June.
Laeven, L. and F. Valencia (2018), “Systemic Banking Crises Revisited”, IMF Working Paper No. 18/206,
Washington D.C, September.
Mc Kinsey (2020a), “Banking system resilience in the time of COVID-19”, July.
Mc Kinsey (2020b), “A test of resilience: Banking through the crisis and beyond”, Mc Kinsey Global
Banking Annual Review 2020, December.
OECD (2020a), “Global financial markets policy responses to COVID-19”, OECD Publishing, Paris,
March, https://www.oecd.org/coronavirus/policy-responses/global-financial-markets-policy-responses-
to-covid-19-2d98c7e0/.
OECD (2020b), “Issue Note 3: Assessment of government crisis programmes to support businesses”, in

35
THE COVID-19 CRISIS AND BANKING SYSTEM RESILIENCE © OECD 2021
Issues notes on macroeconomic and structural policy issues related to the COVID-19 outbreak,
OECD Publishing, Paris, July, https://doi.org/10.1787/bfdc91e0-en.
OECD (2020c), “OECD Economic Outlook”, Volume 2020 Issue 1, No. 107, OECD Publishing, Paris,
June, https://doi.org/10.1787/0d1d1e2e-en.
OECD (2020d), “OECD Economic Outlook”, Volume 2020 Issue 2, No. 108, OECD Publishing, Paris,
December, https://doi.org/10.1787/39a88ab1-en.
OECD (2020e), “COVID-19 Government Financing Support Programmes for Businesses”, OECD
Publishing, Paris, www.oecd.org/finance/COVID-19-Government-Financing-Support-Programmes-for-
Businesses.pdf.
Official Journal of the European Union (2014), “Directive 2014/59/EU of the European Parliament and of
the Council”, May.
Oliver Wyman (2020), “Steering banks through the crisis”, June.
Patalano, R. and C. Roulet (2020), “Structural developments in global financial intermediation: The rise
of debt and non-bank credit intermediation”, OECD Working Papers on Finance, Insurance and
Private Pensions, No. 44, OECD Publishing, Paris, March, https://doi.org/10.1787/daa87f13-en.
Reserve Bank of Australia (2020), “Different Approaches to Implementing a Countercyclical Capital
Buffer”, RBA Bulletin, September.
Schuermann, T. (2004), “What do we know about Loss Given Default?”, Mimeo, Federal Reserve Bank
of New York, New York, March.
Shibut, L. and R. Singer (2014), “Loss Given Default for commercial loans at failed banks.” Mimeo,
Federal Deposit Insurance Corporation, Washington D.C. June.
S&P Global Ratings (2020), “COVID-19 heat map: Post-crisis credit recovery could take to 2022 and
beyond for some sectors”, June.
S&P Global Ratings (2021), “Global credit outlook: Back on track?”, January.
Sarin, N. and L. H. Summers (2016), “Understanding bank risk through market measures”, Brookings
Papers on Economic Activity, Fall 2016.
Staehr, K. and L. Uusküla (2017), “Forecasting models for non-performing loans in the EU countries”,
Eesti Pank, Working Paper Series 9/2017.

36
THE COVID-19 CRISIS AND BANKING SYSTEM RESILIENCE © OECD 2021
Annex A. Non-performing loan projection model
following the COVID-19 crisis
The COVID-19 pandemic has caused an unprecedented health and humanitarian crisis and the outlook is
uncertain (OECD, 2020c; OECD, 2020d). A prolonged severe disruption, characterised by a continuation
of weaker earnings and poorer corporate and household debt performance, could negatively affect bank
asset quality. Therefore, banks are likely to face a substantial increase in non-performing loans due to the
rise in household and corporate defaults.
Predicting NPL ratios under a single-hit versus a double-hit scenario informed by the OECD 2020
Economic Outlook (OECD, 2020c) would be relevant to evaluate the extent to which banks will be
impacted, and how this may impact banking systems across OECD economies. Macro scenarios implicitly
incorporate the effects of broad macroeconomic and monetary policy interventions that have been
implemented in many jurisdictions since the onset of the pandemic in 2020, including interest rate cuts,
unconventional monetary policies, fiscal measures, social safety net packages, and other policies that
support the real economy. By improving the liquidity of borrowers, these policies indirectly affect the
condition of banks. While these two scenarios provide a broad assessment of the potential paths of the
pandemic and its impact on the real economy, uncertainty remains given the unprecedented nature of the
shock.
Considering major advanced and emerging market economies, the projected NPL ratio is compared to
latest NPL ratio (i.e., at end-2019) and observed ratios during the GFC or the European sovereign debt
crisis. This annex will describe the OECD single-hit versus double-hit scenarios and outline the empirical
simulation model.
OECD single-hit and double-hit scenarios
Given such level of uncertainty, two scenarios have been postulated in the OECD 2020 Economic Outlook
for 2020 and 2021:
Under the single-hit scenario, containment measures are assumed to successfully overcome the outbreak
with no expected resurgence in infections and intensive cases later in 2020 (and until a vaccine becomes
available). This scenario has already proven to be optimistic for some economies as the resurgence of
COVID-19 cases and renewed lockdowns occurred since October 2020 in some parts of the world.
Under the double-hit scenario, easing of containment measures is assumed to be followed by a second,
but less intensive, virus outbreak taking place in October or November 2020. Further outbreaks in 2021
are assumed to be avoided due to pharmaceutical breakthroughs, but these remain a significant downside
risk. These assumptions are supported by economic developments as the aggregate economic impact of
renewed restrictions appears lower than during the first wave of the virus, but job-rich service activities
with high levels of social interactions are being hard-hit once again, raising risks of bankruptcies, higher
unemployment in the absence of extended policy support (OECD, 2020d).
In June 2020, the OECD warned that the global recession would be the deepest since the Great
Depression with some differences across countries.27

37
THE COVID-19 CRISIS AND BANKING SYSTEM RESILIENCE © OECD 2021
Under the single-hit scenario, average declines of 8% and 6% in real GDP growth are expected in 2020 in
major advanced and emerging market economies respectively. Also, unemployment is expected to reach
8.5% and 11% on average in 2021.
Under the double-hit scenario, average declines of 10% and 8% are expected in 2020 in major advanced
and emerging market economies respectively. Also, unemployment is expected to reach 9.1% and 13%
on average in 2021.
The model
Using macroeconomic panel data for a global sample of 37 countries,28 a parsimonious model has been
used including indicators that capture the impact of macroeconomic and macrofinancial conditions that
may influence the ability of borrowers from the private sector (i.e. corporates and households) to repay
their loans and respond to economic shocks (IMF, 2014; Staehr and Uusküla, 2017; Bonaccorsi di Patti
and Cascarino, 2020; Heppe, 2020). The dependent variable is the ratio of non-performing loans to total
loans.29 Equation (1) shows the estimated linear panel regression model:
𝑁𝑃𝐿𝑖,𝑡 = 𝑣𝑖 + 𝛽1 𝑅𝐺𝐷𝑃𝑖,𝑡 + 𝛽2 𝐷𝑖𝑠𝑝𝐼𝑛𝑐𝑜𝑚𝑒𝑖,𝑡−1 + 𝛽3 𝐿𝑒𝑣𝑒𝑟𝑎𝑔𝑒𝑖,𝑡−1 + 𝛽4 𝐿𝑜𝑎𝑛𝑠𝐺𝑟𝑜𝑤𝑡ℎ𝑖,𝑡−1
+ 𝛽5 𝐼𝑛𝑡𝑒𝑟𝑒𝑠𝑡𝑅𝑎𝑡𝑒𝑖,𝑡−1 + 𝜀𝑖,𝑡
(1)
NPL is the ratio of non-performing loans to total loans. The change in the ratio is used in the regressions
to revolve non-stationarity of the dependent variable. In fact, the dynamics of the NPL ratio is affected by
NPL flows and by the time required for loans to exit the NPLs stock following a shock (Bonaccorsi di Patti
and Cascarino, 2020). The NPL ratio tends therefore to still be relatively low at the beginning of a crisis,
while remaining high for some time after the economy starts to recover. Country-level annual data for NPL
ratios are from the IMF Financial Soundness Database. For most countries included, NPL ratios series
start in 2005. Therefore, estimations are run over the period of 2005-2019 for the panel to be balanced to
provide estimates based on historical information related to an extensive sample of countries.
RGDP is the annual growth rate of real GDP. GDP growth depicts the dynamics of borrowers’ income and
is expected to be negatively related to default rates and bank NPL ratio. In the context of the COVID-19
crisis, it is expected to be a good proxy for corporate income growth as corporates do not benefit from
direct government support and the impact of deteriorating economic conditions tends to materialise shortly
on their actual earnings.
The one year lagged value of household disposable income growth (DispIncome)30 is used because
unemployment benefit programmes and crisis measures (i.e., like payment holidays) are delaying the
impact of deteriorating earnings of households on banks’ reported NPLs. This indicator is calculated as
the annual percent change in household disposable income and should anticipate the NPL ratio with a
negative coefficient.
The one year lagged values of non-financial firms’ leverage, the annual percent change in aggregate bank
lending and long-term interest rate, reflect the impact of past firm’s financial fragilities and credit conditions
on banks’ reported NPLs. The aggregate leverage of non-financial firms (Leverage) is the ratio of total debt
to total assets calculated using Refinitiv country equity benchmarks including non-financial listed firms only.
A highly leveraged corporate sector implies that corporates are more vulnerable to macroeconomic shocks
that could precipitate defaults, aggravating the bad loan problem in banks. Therefore, a positive sign is
expected for the related coefficient of this variable in the determination of bank NPL ratio.
The annual percent change in aggregate bank loans (LoansGrowth) is calculated using aggregate country
data of bank credit to the private non-financial sector (i.e., including corporates and households) from the
Bank for International Settlements. As shown by several studies focusing on credit cycles (Chavan and

38
THE COVID-19 CRISIS AND BANKING SYSTEM RESILIENCE © OECD 2021
Gambacorta, 2016; Jiménez and Saurina 2006), fast credit growth may lead to an adverse selection and
be associated with an increase in credit risk. Therefore, a positive sign is expected for the related coefficient
of this variable in the determination of bank NPL ratio.
The impact of long-term interest rate (InterestRate)31 is introduced in the model. In fact, banks adjust rates
in response to changes in credit risk and an increase in interest rates on new loans could anticipate future
changes in loan defaults. Also, interest rates incorporate bank funding conditions; to the extent that rising
rates capture tightening credit supply, they could be anticipating a negative credit supply shock, which in
turn increases the insolvency of borrowers that need to refinance their loans. Therefore, a positive sign is
expected for the related coefficient of the long-term interest rate in the determination of bank NPL ratio.
Real GDP, household disposable income and long-term interest rate data are from the OECD National
Account Database.
A pooled model is estimated for advanced and emerging market economies including country fixed effects.
vi are country-specific fixed effects (i.e., intercepts). The β are regression coefficients, t indicates the year,
i the country and ε is the error term. Therefore, estimates provide the average effect of macroeconomic
factors on NPLs by country. The introduction of a broad set of macroeconomic indicators helps to mitigate
possible omitted variable biases when estimating a common relationship across countries, and better
control for country specificities.32 In addition, the variety of macroeconomic indicators helps to account for
the fact that the response to economic shocks is not constant over time and better control for the impact
of structural shocks over the period 2005-2019. A static panel model is used to account for the fact that
economic shocks are felt sooner and stronger compared to a dynamic panel model. Staehr and Uusküla
(2017) reference a number of other studies of the NPL ratio which are more focused on inference than
forecasting.
Descriptive statistics of the variables included in the model and regression results are shown in tables A1.1
and A1.2. Regression results are consistent with findings from previous literature. All indicators are
significant and the sign of their related coefficients are as expected.
Table A A.1. Descriptive statistics of variables included in the model, 2005–2020
Mean Median Maximum Minimum Standard deviation
NPL 3.94 2.68 45.57 0.08 5.35
RGDP 2.65 2.32 15.12 -3.76 2.59
DispIncome 6.00 4.75 38.49 -8.56 6.02
Leverage 60.49 60.45 82.29 31.71 9.05
LoansGrowth 6.46 4.48 62.04 -33.76 14.61
InterestRate 4.68 4.09 16.81 -0.36 3.23
Note: All variables are computed using aggregate country data and are expressed in percentage. NPL: bank non-performing loan ratio; RGDP:
annual real GDP growth rate; DispIncome: annual growth rate of household disposable income; Leverage: non-financial firms’ debt to total
assets ratio; LoansGrowth: annual percent change in bank loans to the private non-financial sector.
Source: IMF Financial Soundness Indicators Database, BIS Credit to the non-financial sector database, OECD National Account Database,
Refinitiv, OECD calculations.

39
THE COVID-19 CRISIS AND BANKING SYSTEM RESILIENCE © OECD 2021
Table A A.2. Determinants of a bank’s NPL ratio, 2005–2020
[1]
RGDP -0.26***
(-8.39)
DispIncome -0.05***
(-2.75)
Leverage 0.03*
(1.86)
LoansGrowth 0.003*
(1.77)
InterestRate 0.22***
(5.84)
C -1.63*
(-1.83)
N 440
R-square 0.33
F-statistic 4.80
Prob(F-statistic) 0.00
Note: This table shows the results of estimating Equation (1) using standard OLS global sample of 37 countries over the period 2005–2020.
Country-specific fixed effects are included in the regression and the one-year lagged value of all explanatory variables is used, except for the
annual real GDP growth rate. See Table A1.1 for the definitions of the variables included in the regression framework. Standard errors are robust
from heteroskedasticity. * Indicate statistical significance at the 10 percent level. ** Indicate statistical significance at the 5 percent level. ***
Indicate statistical significance at the 1 percent level. Student-t statistics are reported in parentheses.
Source: OECD calculations.
The objective of this analysis is to perform a simulation analysis of bank NPL ratio applying the shock of
the COVID-19 crisis to assess the potential rise in bank NPLs depending on the possible evolution of the
global economy. Simulations are performed under the single-hit versus double-hit scenario informed by
the OECD 2020 Economic Outlook assuming extensive monetary and fiscal support measures that have
been implemented following the COVID-19 crisis versus without support measures consistently with
conditions that prevailed during past crisis. Projections of NPL ratios are calculated using OECD forecasts
for real GDP, household disposable income growth and long-term interest rate under the single-hit versus
double-hit scenario. Also, 2019 values of non-financial firm leverage and bank loan growth have been used
because OECD forecasts are not available for these indicators.33 Without extensive monetary and fiscal
support, expected minimum rates in 2020 or 2021 of real GDP growth, household disposable income
growth and maximum long-term rate are considered to reflect the overall negative impact of the COVID-
19 pandemic for corporates and households, i.e. both facing lower earnings prospects due to deteriorated
economic conditions and rising unemployment. Alternately, average OECD projected rates on 2020 and
2021 are used to reflect the effectiveness of extensive monetary and fiscal support measures implemented
to mitigate the impact of the COVID-19 crisis on economic conditions.
At a time of great uncertainty, achieving accurate macroeconomic forecasts and models is even more
challenging than usual (Heppe, 2020). In any scenario, several factors could influence the impact (Mc
Kinsey, 2020a). In fact, economic conditions and the effective default rates of companies could be worse
than those currently expected, given the unprecedented nature of this crisis. Also, banks in many countries
benefit from direct government support such as moratoria and credit guarantees that may help to avoid
defaults on certain amounts of performing and non-performing loan exposures, or at least delay loan
defaults. Other indirect support measures from governments and supranational institutions may also help
to further alleviate the extent of the shock on the real economy. Nevertheless, these factors are difficult to
measure empirically and therefore this model does not include the impact of such factors. Therefore, this
analysis is designed to assess the magnitude of the potential rise in bad quality assets based on
hypothetical scenarios rather than forecast estimates.

40
THE COVID-19 CRISIS AND BANKING SYSTEM RESILIENCE © OECD 2021
Annex B. Simulation analysis of non-performing
loans and impact on banks’ ability to absorb loan
losses
The sensitivity of banks’ capacity to absorb higher loan losses due the deterioration of their asset quality
and a substantial rise in NPLs is examined by performing a simulation analysis applying the shock of the
COVID-19 crisis. A four-step analysis is performed to calculate the amount of the regulatory capital buffer
that may be eroded by loan losses not covered by loan loss reserves and the extent of a potential regulatory
capital shortfall.
In the first step, the magnitude of the increase in NPLs is defined under the single-hit versus double-hit
scenario informed by the OECD 2020 Economic Outlook reflecting extensive monetary and fiscal supports
that have been implemented following the COVID-19 crisis. Bank NPLs are expected to rise by the NPL
multiple of the bank’s country of incorporation.34 This approach enables to consider the magnitude of the
impact of the COVID-19 outbreak that differs across countries. This means that depending on their location,
banks are not facing similar risk of increase in their NPLs.
A second step consists in converting NPLs into loan losses35, by adjusting the amount of NPLs for loss
given default (LGD). Since the onset of the COVID-19 crisis, government loan guarantees have been
implemented in many jurisdictions. While government loan guarantees are not impacting the amount of
assets exposed at potential risk of losses, they may influence the potential losses that a bank may face
from assets exposed at potential risk of losses. In fact, government loan guarantees are affecting the loss
given default (LGD) by reducing the loss that a bank experiences when a borrower defaults. As suggested
and consistently with the IMF approach (IMF, 2020b), when such guarantees are implemented, an LGD
that prevails in normal times is used. Unfortunately, cross-country data on LGD are limited. In the existing
literature, estimates suggest that for the United States, average LGD for unsecured bank loans over the
period 1970–2009 was about 60% in normal times (Schuermann 2004; Altman et al., 2006; Shibut and
Singer, 2014; Johnston Ross et al., 2015). Alternately in the absence of government loan guarantees, an
LGD during crisis times is used. Consistently with Dagher et al. (2020), an LGD of 75% is used in this
study.
In the third step, the amount of bank losses that can be absorbed by actual loan loss reserves are
calculated. The aim is to assess the extent of gross amount of bad assets that may be absorbed by the
safety buffer a bank holds to mitigate the consequences of losses following a wave of defaults. The formula
that converts loan losses during a crisis period into capital needed to absorb them is:36
𝐶𝑎𝑝𝑖𝑡𝑎𝑙 𝑛𝑒𝑒𝑑𝑒𝑑 = (𝑁𝑜𝑛 𝑝𝑒𝑟𝑓𝑜𝑟𝑚𝑖𝑛𝑔 𝑙𝑜𝑎𝑛𝑠 ∗ 𝑀𝑢𝑙𝑡𝑖𝑝𝑙𝑒 𝑖𝑛𝑐𝑟𝑒𝑎𝑠𝑒𝑁𝑃𝐿 ∗ 𝐿𝐺𝐷) − 𝑅𝑒𝑠𝑒𝑟𝑣𝑒𝑠 𝑓𝑜𝑟 𝑙𝑜𝑎𝑛 𝑙𝑜𝑠𝑠𝑒𝑠
Under the Basel III accords, banks must comply with capital standards through minimum requirements
(BIS, 2011, 2017c). The GFC demonstrated that credit losses and writedowns come out of retained
earnings, which is part of banks’ tangible common equity base. Therefore, it is critical that banks’ risk
exposures are backed by a high quality capital base. The Basel III accords introduced a regulation that
requires banks to maintain minimum total regulatory capital ratio of 8% (of risk-weighted assets) and Tier
1 capital ratio of 6%. The Tier 1 capital ratio should comprise at least 4.5% of common equity Tier 1 (CET1)
capital. CET1 capital represents the bank’s core capital37 and is a measure of a bank’s ability to withstand
financial distress. A capital conservation buffer of 2.5%, comprised of CET1 capital, is established above
the regulatory minimum CET1 capital requirement (BIS, 2019). Capital distribution constraints will be
imposed on a bank when capital levels fall between 7% to 4.5% that consist for the bank to conserve

41
THE COVID-19 CRISIS AND BANKING SYSTEM RESILIENCE © OECD 2021
minimum retained earnings ratio in the subsequent payment period (i.e., pay out no more than a given
share of earnings in terms of dividends, share buybacks and discretionary bonus payments). Most banks
hold an amount of capital that exceeds the minimum imposed by regulation.
Following the COVID-19 crisis, bank-specific capital measures have been implemented in many
jurisdictions. Within the risk-based capital framework, the countercyclical capital buffer (CCyB) for Tier 1
capital has been reduced in many jurisdictions to alleviate regulatory capital constraints of bank credit
supply and to support further lending to businesses and households for a prompt economic recovery (BIS,
2020c; ESRB, 2020; IMF, 2020b). Nevertheless, requirements for the capital conservation buffer (CCoB)
for CET1 capital have not been modified following the COVID-19 crisis (RBA, 2020; Kleinnijenhuis et al.,
2020). This implies that banks have some flexibility toward the fluctuation of their Tier 1 capital, at least if
standing above the 8% regulatory minimum requirement of RWA. However, banks should comply with
minimum conservation buffer if CET1 capital ratio is falling below 7%. Under prolonged severe disruption,
CET1 capital ratio may deteriorate and banks may enter in what may be called “caution” and “danger”
zones (Mc Kinsey, 2020a). In this analysis, banks may enter a “caution” zone if CET1 capital ratio would
fall between 7% to 5.5%. In fact, such decline would imply that banks must start to rebuild their capital
cushions and have to comply with minimum capital conservation ratios.38 Also, banks may enter a “danger”
zone if their CET1 capital ratio is falling at 5.5% and below.39 Therefore, the fourth step consists in
comparing capital needed and actual CET1 regulatory capital to assess the amount of CET1 capital buffer
that may be eroded by loan losses not covered by reserves and the extent of a potential CET1 capital
shortfall. The amount of eroded CET1 capital buffer is calculated as the difference between actual CET1
capital buffer and capital needed to absorb loan losses not covered by reserves. The formulas that convert
capital needed during crisis into CET1 capital buffer that may be eroded by loan losses not covered by
reserves and potential CET1 capital shortfall are:
𝐶𝐸𝑇1 𝑐𝑎𝑝𝑖𝑡𝑎𝑙 𝑏𝑢𝑓𝑓𝑒𝑟 𝑒𝑟𝑜𝑑𝑒𝑑= 𝐶𝑎𝑝𝑖𝑡𝑎𝑙 𝑛𝑒𝑒𝑑𝑒𝑑𝑜𝑓 𝑏𝑎𝑛𝑘𝑠 𝑤𝑖𝑡ℎ 𝑐𝑎𝑝𝑖𝑡𝑎𝑙 𝑛𝑒𝑒𝑑𝑒𝑑< 𝐶𝐸𝑇1 𝑐𝑎𝑝𝑖𝑡𝑎𝑙 𝑏𝑢𝑓𝑓𝑒𝑟
+ 𝐶𝐸𝑇1 𝑐𝑎𝑝𝑖𝑡𝑎𝑙 𝑏𝑢𝑓𝑓𝑒𝑟𝑜𝑓 𝑏𝑎𝑛𝑘𝑠 𝑤𝑖𝑡ℎ 𝑐𝑎𝑝𝑖𝑡𝑎𝑙 𝑛𝑒𝑒𝑑𝑒𝑑> 𝐶𝐸𝑇1 𝑐𝑎𝑝𝑖𝑡𝑎𝑙 𝑏𝑢𝑓𝑓𝑒𝑟
𝐶𝐸𝑇1 𝑐𝑎𝑝𝑖𝑡𝑎𝑙 𝑠ℎ𝑜𝑟𝑡𝑓𝑎𝑙𝑙= (𝐶𝐸𝑇1 𝑐𝑎𝑝𝑖𝑡𝑎𝑙 𝑏𝑢𝑓𝑓𝑒𝑟 − 𝐶𝑎𝑝𝑖𝑡𝑎𝑙 𝑛𝑒𝑒𝑑𝑒𝑑)𝑜𝑓 𝑏𝑎𝑛𝑘𝑠 𝑤𝑖𝑡ℎ 𝑐𝑎𝑝𝑖𝑡𝑎𝑙 𝑛𝑒𝑒𝑑𝑒𝑑> 𝐶𝐸𝑇1 𝑐𝑎𝑝𝑖𝑡𝑎𝑙 𝑏𝑢𝑓𝑓𝑒𝑟
Overall, this approach implies that resulting “capital needed” and “regulatory capital eroded” or “shortfall”
are better discussed in terms of ranges rather than point estimates. Consistently with the stress testing
approaches of major central banks (Fed, 2020b; EBA, 2020; ECB, 2020c) and the IMF (2020b), the gradual
severity in adverse scenarios does not provide forecast estimates but rather hypothetical scenarios are
designed to assess the magnitude of potential capital erosion and the implications for bank resilience. Also,
results for the value of eroded CET1 capital buffer and CET1 capital shortfall are shown as a share of
CET1 capital of all banks by region. This approach helps to assess the importance of such losses for the
overall banking system.

42
THE COVID-19 CRISIS AND BANKING SYSTEM RESILIENCE © OECD 2021
Annex C. How bank loan losses may trigger the
conversion of contingent convertible bonds?
The capacity of banks to absorb higher loan losses is likely to deteriorate depending on the magnitude of
the rise in NPLs following the COVID-19 pandemic. Therefore, regulatory capital ratios may be eroded by
loan losses not covered by reserves and may enable the conversion of contingent convertible bonds
(CoCos). This analysis is intended to assess the effectiveness of CoCos in providing banks with an
additional source of equity following the deterioration of the capital base due rising bad quality assets. This
will be measured by the share of banks facing CET1 capital erosion or shortfall but with CoCos that maybe
be converted into loss absorbing equity.40 The amount of CoCos that may be triggered due to substantial
loan losses not covered by reserves is calculated in two steps.
The first step consists in calculating an eroded CET1 capital ratio by deducting capital needed from actual
CET1 capital. To assess the maximum amount of CoCos that may be converted into equity, these
calculations are performed under most adverse conditions (i.e. under the double-hit scenario) in the
absence of government loan guarantees; i.e. considering estimates of capital needed calculated using an
LGD of 75%.
In the second step, the estimated value of eroded a CET1 capital ratio is compared to minimum trigger
limit to determine if CoCos can be triggered.41 All CoCos (either additional Tier 1 or Tier 2) must include a
discretionary trigger, also known as a point of non-viability (PONV) trigger. Under the Basel III regulatory
framework, additional Tier 1 CoCos classified as liabilities must have a mechanical trigger, with a minimum
trigger level of 5.125% in terms of CET1 capital ratio (BIS, 2013; BIS, 2017c). This means that if a CET1
capital ratio falls below the capital trigger level, an additional Tier 1 capital CoCo bond may either be
converted into equity on a permanent basis or the nominal amount of the additional Tier 1 capital written
down. Nevertheless, the preventive effect of CoCos is effective only if CoCos are triggered well before a
bank faces financial distress and potential resolution would be implemented. Hence, trigger levels should
be high enough to automatically reduce the leverage of the issuing bank to avoid any operational
disruption. A trigger of 5.125% is relatively ‘low’, given that the Basel III regulatory framework includes a
4.5% CET1 capital and a 6% Tier 1 capital requirements along with capital conservation buffers. Thus,
given that banks usually hold an additional voluntary buffer on top of the minimum requirements, it is very
likely that banks would experience deleveraging pressure when their CET1 and Tier 1 capital ratios are
higher than minimum requirements or well before any CoCo trigger would be reached (Goncharenko et
al., 2019). By the time the Tier 1 capital ratio has fallen below 6%, banks have already incurred so much
loss that a bank resolution is imminent. Because information of trigger and equity conversion rate are not
available by security in Refinitiv, it is assumed that trigger limits apply if a CET1 capital ratio falls below
6%. Also, Tier 2 CoCos with a mechanical trigger of any level are considered as convertible into loss
absorbing equity (BIS, 2017b). These assumptions imply that more banks, that would experience financial
distress following the COVID-19 pandemic, will be able to trigger all their issued CoCos. Also, it is assumed
that additional Tier 1 CoCos have a mechanical trigger at the book value of CET1 capital and that all CoCos
have an equity conversation rate of 100%. CoCos that have been called over the period 2009-2020 are
excluded from these calculations.
43
THE COVID-19 CRISIS AND BANKING SYSTEM RESILIENCE © OECD 2021
1 Under Basel III regulatory framework, minimum requirement for the total regulatory capital ratios has
been raised from 8% to 10.5% of risk-weighted assets because banks should hold buffers of capital above
the regulatory minimum outside of periods of stress (BIS, 2011). Also, when additional surcharges are
activated, such as countercyclical buffer and Global Systemically Important Banks (G-SIB) surcharge,
minimum requirement may increase up to 15.5%. These two additional surcharges are deployed by
national jurisdictions when excess aggregate credit growth is judged to be associated with a build-up of
system-wide risk. A liquidity coverage ratio minimum requirement of 100% has been also introduced.
2 Figure 2 shows the simple average of non-performing loan ratios by region. Nevertheless, it should be
noted that the weighted average by total assets would lead to lower ratios for European banks in line with
estimates reported in the EBA Risk Dashboard which shows data as of the fourth quarter of 2019 (EBA,
2020a).
3 Further details about OECD scenarios are provided in Annex A.
4 Downside risks are exacerbated because one-third of corporate ratings in the United States and one-
quarter in Europe entered the crisis at ‘B’ or below, a level that indicates high vulnerability to shifts in
economic and business cycles.
5 Businesses, particularly those with high debt, are finding it difficult to meet short-term cash need for debt
repayments, taxes, and significant operational expenses. Nevertheless, the degree of severity is varying
tremendously by industry (S&P Global Ratings, 2020). Energy, labour-intensive sectors most exposed to
social distancing (i.e., construction, travel and leisure, transportation) and those most dependent on large
discretionary consumer purchases have suffered the most.
6 Detailed information about the model and the data are provided in Annex A.
7 Despite origins of the GFC or the European sovereign debt crises are different from those of the COVID-
19 crisis, effects on the real economy have been detrimental. The GFC started in 2008 with disruption to
the US real estate and financial markets and only spread to financial and real economy in the rest of the
world after a certain time delay. Many economies have been hit by recession in 2008-2009. However, the
COVID-19 pandemic is exerting a more abrupt effect with major disruptions in the real sectors. Major
international organisations have forecasted sharp reduction in GDP growth rate and rise in unemployment
both in advanced and emerging market economies in 2020 and 2021 (OECD, 2020c; IMF, 2020a). During
recession, both corporates and households are facing substantial reductions in revenues or earnings.
Therefore, banks are likely to face a substantial increase in NPLs and will be forced to increase their LLPs
and allowances following defaults on their retail and commercial loans. During the GFC, banks started to
record losses following rising defaults on their mortgages, and afterwards on other loans granted to
households and corporates that were affected by a fall in their revenues under deteriorated economic
Notes

44
THE COVID-19 CRISIS AND BANKING SYSTEM RESILIENCE © OECD 2021
conditions. During both crises, the effect on bank NPLs has been similar but not driven by defaults on
same type of loans.
8 High NPLs reduce profitability because banks have to increase their LLPs. Also, rising NPLs tends to
lower interest income, generate higher expenses associated with their monitoring and management and
lead to an increase in funding costs, as risk adverse investors are less willing to lend to institutions with a
low credit quality. In addition, NPLs feature higher risk weights that is eroding bank regulatory capital ratio.
9 It is worth noting that deleveraging performed by selling NPLs to a third party investor or through
securitization may have some negative implications for the bank, and for at least two main reasons
(Angelini, 2018). Notably, NPLs are usually sold at a discounted value compared to their actual book value.
This transaction may generate a loss that is likely to more than offset the positive effect on capital ratios
generated by the reduction of risk-weighted assets. Also, outsourcing NPLs may result in the closing of
distressed but solvent firms because the status of a non-negligible share of NPLs may become performing
again after some time.
10 In particular, European banks witnessed the highest increase in their LLPs in 2020 totalling 163% of
provisions during the first three quarters of 2019 followed by banks in North America, emerging market
economies and Asia Pacific that have at least doubled their LLPs. ECB estimates further show that much
of the increase in LLPs in the first half of 2020 was driven by the migration of non-financial corporate loans
to Stage 2, while the Stage 3 loan ratio remained broadly unchanged (ECB, 2020g).
11 This vulnerability analysis would provide valuable insights into banks’ risks under adverse economic
conditions. Nevertheless, when conducted by regulators or supervisors, this type of assessment would rely
on more granular data than used in this global exercise, and thus would provide additional richness.
12 The several steps and assumptions used in the empirical framework are detailed in Annex B. This
analysis has been performed using a sample of 633 publicly listed banks in 23 major advanced economies
for which financial statement data are available in Refinitiv at end 2019. Emerging market economies are
excluded from the scope of this analysis because OECD forecasts under single-hit versus double-hit
scenario informed by the OECD 2020 Economic Outlook are not available for several major emerging
market economies (i.e., for further details, see Annex A).
13 The “danger” zone threshold of 5.5% is considered instead of the Basel III minimum CET1 capital ratio
requirement to reflect the fact that banks are facing solvency distress well before regulatory minimum
threshold are reach and they should take prompt steps to rebuild their capital cushion.
14 Banks in the Asia Pacific are likely to record the highest share of loan losses not covered by reserves
that are implying a CET1 capital shortfall compared to European or North American banks. Under the most
adverse scenario, loan losses not covered by reserves that are implying a CET1 capital shortfall account
for 8% of total CET1 capital of banks in the Asia Pacific, compared to 0.6% and 0.5% for European and
North American banks respectively. CET1 capital shortfall prevails for 3% of the total number of banks in
the Asia Pacific included in the sample, compared to 7.9% for European banks and 1.6% for North
American banks.
15 Loan losses not covered by reserves that are implying a CET1 capital shortfall are decreasing to 5% of
total CET1 capital of banks in the Asia Pacific, compared to 0.4% and 0.1% for European and North
American banks respectively. CET1 capital shortfall still prevails for 3% of the total number of banks in the
Asia Pacific included in the sample. This is due to the fact that capital shortfall prevails for only one bank
in the Asia Pacific. Nevertheless, these shares are falling to 5.6% and 1.3% for European banks and North
American banks respectively.

45
THE COVID-19 CRISIS AND BANKING SYSTEM RESILIENCE © OECD 2021
16 The banks facing an erosion of their capital buffer are likely to experience further reduction in their
valuations and therefore stronger pressure on their funding conditions.
17 The ECB also provided temporary capital and operational relief in reaction to the COVID-19 crisis to
ensure that its directly supervised banks can continue to fulfil their role in funding the real economy (ECB,
2020a). Notably, the ECB allowed banks to operate temporarily below the level of capital defined by the
Pillar 2 Guidance (P2G), the capital conservation buffer (CCB) and the liquidity coverage ratio (LCR).
18 These actions contributed to deteriorate public finances in certain countries, i.e. leading to substantial
increase in sovereign debt and debt accumulation. Therefore, the major priority of regulators following the
GFC was ensuring that a bank’s critical functions were preserved while the costs of restructuring and
resolving failing banks fell upon the bank’s owners and creditors and not on taxpayers.
19 The main objective is to ensure that in the event of another crisis, bail-in resolution would be a credible
alternative to bailout.
20 Bail-in resolution would consist in the conversion of CoCos previously issued (BIS, 2017b). CoCos may
act as a buffer to make banks more resilient in times of crisis (Boermans et al., 2014). Tax-deductible
coupon payments, whereas dividend payments are not, make CoCos cost-effective for banks to strengthen
their capital.
21 It is worth noting that the ability of banks to issue CoCos and other capital instruments at a reasonable
price may differ depending on the diverse NPL situation across countries.
22 Detailed information about the CoCo database used in this analysis are provided in Annex C.
23 CoCos have two main defining characteristics that are the loss absorption mechanism and the trigger
that activates that mechanism. CoCos are converted into loss absorbing equity when the trigger is
breached under stressed conditions. In this analysis, because information of trigger and equity conversion
rate are not available by security in Refinitiv, it is assumed that trigger limits apply if CET1 capital ratio is
falling below 6%. Also, Tier 2 CoCos with a mechanical trigger of any level are considered as convertible
into loss absorbing equity (BIS, 2017b). The several steps and assumptions used in the empirical
framework are detailed in Annex C.
24 The first option could lead to a substantial dilution of existing equity holders because the stock price is
likely to be very low at the time the loss absorption mechanism is activated. Also, existing equity holders
would prefer avoiding a breach of the trigger to prevent this potential for dilution. The second option would
limit the dilution of existing shareholders, but also probably decrease their incentives to avoid the trigger
being breached. The combination of these two options would prevent unlimited equity dilution but the
incentives for existing equity holders to avoid a breach of the trigger are likely to persist.
25 Forbearance is a concession granted to a counterparty for reasons of financial difficulty that would not
be otherwise considered by the lender. Forborne exposures can be included within the performing or non-
performing category. The appropriate categorisation depends on: (i) the status of the exposure at the time
when forbearance is granted; and (ii) the counterparty’s payment history or creditworthiness after the
extension of forbearance (BIS, 2016).
26 A forborne exposure can cease being categorised as such when both an objective criterion, such as a
probation period for which a minimum duration is set, and a solvency criterion are met.

46
THE COVID-19 CRISIS AND BANKING SYSTEM RESILIENCE © OECD 2021
27 OECD expected fall in real GDP growth rate are consistent with expected evolution of the economy after
the COVID-19 outbreak considered by the Federal Reserve (2020b and 2020d), the ECB (2020b) for their
supervisory stress tests. Nevertheless, IMF (2020b) estimates are relatively dovish compared to estimates
from major central banks and the OECD. This reflects the differences in capturing the extent of the prompt
and extensive fiscal support provided to households in many countries in the several forecasting scenarios
of major central banks and international organisations.
The Federal Reserve has revised estimates of expected rise in unemployment and fall in real GDP growth
rate in December compared to June 2020 stress test. Under severely adverse scenario, US unemployment
rate is expected to peak at 12.5% in the fourth quarter of 2021. Real GDP growth rate is expected to
decline by 3.25% t from the end of the third quarter of 2020 to its trough in the fourth quarter of 2021. In
June, US unemployment rate was expected to peak at 10% in the third quarter of 2021. Real GDP growth
rate was expected to decline by 8.5% from its pre-recession peak, reaching a trough in the third quarter of
2021.
Under baseline scenario, real GDP growth rate in the Eurozone is expected to decline by 8.7% and
unemployment to peak at almost 3%. However, under adverse scenario, real GDP growth rate is expected
to decline by 12.6% and unemployment to peak at about 5%.
Under baseline scenario, IMF estimates show that real GDP growth rate in advanced economies is
expected to decline by 5.5% and unemployment to peak at almost 6.5%. However, under adverse scenario,
real GDP growth rate is expected to decline by 6% and unemployment to peak at about 8.5%. In emerging
market economies, under baseline scenario, real GDP growth rate is expected to decline by 8% and
unemployment to peak at almost 8. However, under adverse scenario, real GDP growth rate is expected
to decline by 9% and unemployment to remain stable at about 8%.
28 This analysis has been performed including the following countries: Argentina, Australia, Austria,
Belgium, Brazil, Canada, Chile, China (People's Republic of), Colombia, Czech Republic, Denmark,
Finland, France, Germany, Greece, Hungary, India, Indonesia, Ireland, Israel, Italy, Japan, Korea, Mexico,
Netherlands, New Zealand, Norway, Poland, Portugal, Russia, South Africa, Spain, Sweden, Switzerland,
Turkey, United Kingdom and United States. The countries included in this study are the ones for which
OECD, BIS and IMF historical data are available. Nevertheless, OECD forecasts for long-term interest rate
under single-hit versus double-hit scenario are not available for Argentina, Brazil, China, Indonesia and
Russia. IMF forecasts have been used using same values under single-hit and double-hit scenarios.
Therefore, this may lead to a slight underestimation of the rise in NPL ratio under the double-hit scenario
for emerging market economies.
29 The dependent variable therefore captures non-performing exposure. Consistently with IMF Financial
Soundness Indicators and EBA definitions of forbearance and non-performing exposures definitions, two
criterion are considered to classify a loan as non-performing when: (1) payment of principal and or interest
past due by 90 days or more, or interest payments equals to 90 days interest or more have been capitalised
(i.e. reinvested into the principal amount, refinanced or rolled-over); (2) the bank considers that the obligor
is unlikely to meet its remaining credit obligations to the bank, the parent undertaking or any of its
subsidiaries in full, without recourse by the bank to actions such as realising security.
30 In the existing literature, the unemployment rate is used to capture the financial soundness of the
household sector. However in the context of the COVID-19 crisis, it is more relevant to consider household
income given the extensive direct fiscal support provided to households to mitigate the negative
consequences of the COVID-19 crisis on their revenues. To avoid collinearity issues, only the annual
percent change in household disposable income is introduced in the model.

47
THE COVID-19 CRISIS AND BANKING SYSTEM RESILIENCE © OECD 2021
31 Long-term interest in the OECD database are reflected by 10-year sovereign bond yields with forecasts
available under the single and double-hit scenarios.
32 While some macroeconomic variables depend on a number of country-level factors that are mostly
unrelated to the state of the economy and not necessarily fixed over time, these factors are difficult to
measure empirically and therefore this model does not include the impact of such factors.
33 While satellite models maybe estimated to calculate projections, the remaining uncertainty given the
unprecedented nature of the shock and the challenges to adequately reflect extensive monetary and fiscal
supports in these models may lead to inaccurate estimates. Furthermore, data limitations to calculate
forecasts from potential satellite models is an other obstacle to engage in this empirical strategy.
Regarding, the leverage of non-financial corporates, it could be further argued that leverage was already
very high before the COVID-19 crisis both in major advanced and emerging market economies (Patalano
and Roulet, 2020). While, non-financial corporate leverage is expected to rise following the COVID-19
crisis, such increase will have a marginal contribution to the overall ratios that are already very very high.
Also, monetary and fiscal support measures and government loan guarantees are intended to ease banks’
capital constraints to maintain the flow of credit to the real economy. Therefore, aggregate bank lending
growth is not expected to fall dramatically during the current crisis compared to substantial credit crunch
that occurred during previous crisis episodes.
34 Anticipating future levels of NPLs is key for formulating NPL resolution strategies. Multiple increase in
nominal NPLs after a crisis compared to pre-crisis levels would be a good indicator of the post-crisis NPL
problems (Ari et al., 2020). Therefore, NPL multiple is calculated as the ratio of nominal projected NPLs to
end-2019 value. Methodology and data to calculate NPL ratio by country under single-hit versus double-
hit scenario are detailed in Annex A. Estimates show that with extensive monetary and fiscal support
measures implemented following the COVID-19 crisis, nominal NPLs are expected to increase between 1
and 2.8 times their 2019 values under the single-hit scenario depending on the country considered. Under
the double-hit scenario, NPL multiple is expected to increase between 1 and 3.6.
35 In this analysis, loan losses by country are attributed to banks depending on the location of their
headquarters, and not according to the location of their exposures. While this may be relevant to consider,
it is difficult to incorporate in the model due to the lack of data for the distribution of bank loan portfolio
exposure and losses by location for a large sample of banks. Also, consolidated data are used in this
analysis. Therefore, losses are compared to the overall capital of the group and not across subsidiaries in
different countries.
36 Estimates have been performed using bank financial statement data as of end-2019 for a sample of 633
banks in 23 advanced economies. Emerging market economies are excluded from the scope of this
analysis because OECD forecasts under single-hit versus double-hit scenario informed by the OECD 2020
Economic Outlook are not available for several major emerging market economies (i.e., for further details,
see Annex A). Also, Chinese banks are excluded from this sample because state ownership involves
different issues than the ones discussed in this study (Sarin and Summers, 2016).
37 It includes ordinary shares, retained earnings, stock surpluses from the issue of common shares and
common shares held by the subsidiaries of the company.
38 More precisely, banks must conserve minimum retained earnings ratio in the subsequent payment
period to strengthen their capital cushion.
39 Actual CET1 capital buffer is calculated as the difference between actual CET1 capital ratio and the
5.5% threshold. The “danger” zone threshold of 5.5% is considered instead of the Basel III minimum CET1

48
THE COVID-19 CRISIS AND BANKING SYSTEM RESILIENCE © OECD 2021
capital ratio requirement to reflect the fact that banks are facing solvency distress well before regulatory
minimum threshold are reach and they should take prompt steps to rebuild their capital cushion.
40 In all economies where Basel III regulatory framework has been implemented, banks are issuing CoCos,
except in the United States. In the United States, requirements for total loss-absorbing capital (TLAC) rely
on bail-in debt and equity. Therefore, no banks in the United States have issued contingent convertible
capital securities to date (Glasserman and Perotti, 2017). Although the Dodd Frank Wall Street Reform
and Consumer Protection Act commissioned a study (FSOC, 2012), the Federal Reserve has not
introduced contingent capital requirements.
The analysis is performed using a sample of 130 publicly listed banks for which CoCo issuance data and
financial statement data are available in Refinitiv at end 2019. These banks are located in the following 21
OECD economies (excluding the United States): Australia, Austria, Canada, Czech Republic, Denmark,
Finland, France, Germany, Greece, Ireland, Israel, Italy, Japan, Korea, Netherlands, Norway, Portugal,
Spain, Sweden, Switzerland and the United Kingdom.
41 Assessment of bank Coco issuance has been performed using Coco bond data issued by individual
banks in OECD countries since 2009 from Refinitiv. CoCos qualified as either Additional Tier 1 (AT1) or
Tier 2 (T2) capital are included regardless of their loss absorption mechanism (i.e., conversion to equity or
principal write-downs; BIS, 2013). However, CoCos that are classified as preferred shares are excluded.
Such CoCos are exempt from the requirement to have a mechanical trigger with a minimum level of 5.125%
in order to be eligible to qualify as AT1 capital. Therefore, they are considerably different from AT1 CoCos
classified as liabilities. It is worth noting that CoCos classified as preferred shares are concentrated in a
very small number of jurisdictions (BIS, 2017b).


www.oecd.org/finance/financial-markets/