the covid-19 pandemic and small business in illinois: a
TRANSCRIPT
1Contact: Robin Fretwell Wilson, Director, IGPA: (217) 244-1227
Institute of Government and Public AffairsTask Force on the Impact of the COVID-19 Pandemic
At the request of President Tim Killeen, IGPA has assembled more than four dozen interdisciplinary faculty experts from all three System universities to assess COVID-19’s effects on the state. Assessments focus on three impact groups: Economic and Fiscal Health, Community and Family Resilience, and the Health Care Workforce. Each group is collaborating on a series of modeling activities, data analyses, and syntheses of impact. This report is the third from the Economic and Fiscal Health Impact Group.
The COVID-19 pandemic and small business in Illinois: A preliminary comparison of neighboring statesEconomic and Fiscal Health Impact Group October 29, 2020
Faculty Lead
David Merriman, Senior Scholar, Institute of Government and PublicAffairs, University of Illinois System; James J. Stukel Presidential Professor ofPublic Administration, University of Illinois at Chicago
EXECUTIVE SUMMARY
In the face of growing concern about the pandemic associated with COVID-19, Illinois Gov. J.B. Pritzker issued Executive Order 2020-10, which went into effect March 21, 2020. The order re-quired that all individuals must stay at home, with exceptions for essential activities, essen-tial government functions, and essential businesses and opera-tions. Gatherings of more than 10 people were prohibited.1
Stay-at-home orders took effect in Indiana and Michigan on March 24, just three days after Illinois’ order. Wisconsin followed on March 25, Kentucky on March 26, and Missouri on April 6. Iowa has not yet issued such an order.2

2Contact: Robin Fretwell Wilson, Director, IGPA: (217) 244-1227
Fear of the illness, combined with potential legal sanctions resulting from executive actions, led to massive economic disruptions in Illinois and around the country. Within weeks, the national unemployment rate soared from a historic low of 3.5% to 14.7%. Illinois followed the national pattern and saw its unemployment rate increase by 13.3%.3
Of course, stay-at-home orders were only one fac-tor in the economic disruption. In fact, one recent study found that “State-ordered reopenings of economies [e.g., lifting of stay-at-home orders] have little impact on local employment.”4
There is reason to believe that the economic damage may weigh especially heavily on small business. Restaurants, bars, bookstores, day care centers, hair salons, and most other commercial establishments had their economic activities greatly restricted.5 Even those that continued to operate had to do so in difficult conditions, under substantial new constraints. Many consumers switched to online purchases, which likely favored large businesses with sufficient resources to expand existing web-based platforms or quickly develop new ones.6
This report provides some preliminary evidence about how small businesses in Illinois fared in comparison to their Midwestern neighbors in Iowa, Indiana, Kentucky Michigan, Missouri, and Wisconsin.
There is little evidence that Illinois’ experience was distinctive compared to its Midwestern neighbors, despite differences in the timing or intensity of states’ stay-at-home orders. Instead, there are similar patterns across each of the states examined here.
Analysis of small businesses comparing Illinois border counties with their neighbors can be especially instructive since government policies change discretely along state borders, but the prevalence of COVID-19 infections generally does not. Our analyses reveal substantial heterogene-ity, but overall revenue of small business in Illi-nois border counties was similar to revenue from businesses located in counties across the state line in adjacent states. This analysis of bordering counties also did not detect any differences in the proportions of Illinois and non-Illinois businesses that remained open.
At a time when the steps taken by government are increasingly facing pushback, there is also little evidence that the states’ very different ap-proaches to public safety were a significant driver of small business economic distress. Consumer
fears, rather than governmental actions, appear to account for much of the economic disruption.
INTRODUCTION
The COVID-19 pandemic brought widespread health, social and economic hardship to households and businesses across the state, the nation, and the world. Public health experts, economists, govern-ment officials, and many others will be studying this episode for decades to come with the hope of un-covering lessons that will provide valuable guidance for future responses to public health crises.
This report provides an initial look at some early evidence regarding one element of COVID-19’s economic challenges by conducting comparative analysis of small business conditions in Illinois and neighboring states.
It is fortunate that a number of novel high-fre-quency and relevant data sources have become available to shed insight on the economic distress of small businesses at a state and sub-state level.
The analysis in this report relies primarily on two data sources: The U.S. Census Bureau’s Small Business Pulse Survey (SBPS) and Opportunity Insights Economic Tracker (Tracker Data).7
Each small business respondent to the SBPS is asked a series of 15 questions. This report focuses on just two of these questions.
1. Overall, how has this business been affected by the COVID-19 pandemic? A. Large negative effect, B. Moderate negative effect, C. Little or no effect, D. Moderate positive effect, E. Large positive effect
2. How would you describe the current availability of cash on hand for this business, including any financial assistance or loans? Currently, cash on hand will cover: A. 1-7 days of business oper-ations, B. 1-2 weeks of business operations, C. 3-4 weeks of business operations, D. 1-2 months of business operations, E. 3 or more months of business operations, F. No cash available for business operations, G. Don’t know.
Opportunity Insights provides data from Womply, which aggregates data from credit card processors.8
This report uses two variables from that data:
1. merchants_all: Percent change in number of small businesses open, calculated as a 7-day moving average, seasonally adjusted, and in-dexed to Jan. 4-31, 2020; and,
3Contact: Robin Fretwell Wilson, Director, IGPA: (217) 244-1227
USA95
85
75
1 2 3 4 5 6 7 8 9
Per
cent
Week
INDIANA95
85
75
1 2 3 4 5 6 7 8 9
Per
cent
Week
MISSOURI95
85
75
1 2 3 4 5 6 7 8 9
Per
cent
Week
WISCONSIN95
85
75
1 2 3 4 5 6 7 8 9
Per
cent
Week
KENTUCKY95
85
75
1 2 3 4 5 6 7 8 9
Per
cent
Week
MICHIGAN95
85
75
1 2 3 4 5 6 7 8 9
Per
cent
Week
ILLINOIS95
85
75
1 2 3 4 5 6 7 8 9
Per
cent
Week
IOWA95
85
75
1 2 3 4 5 6 7 8 9
Per
cent
Week
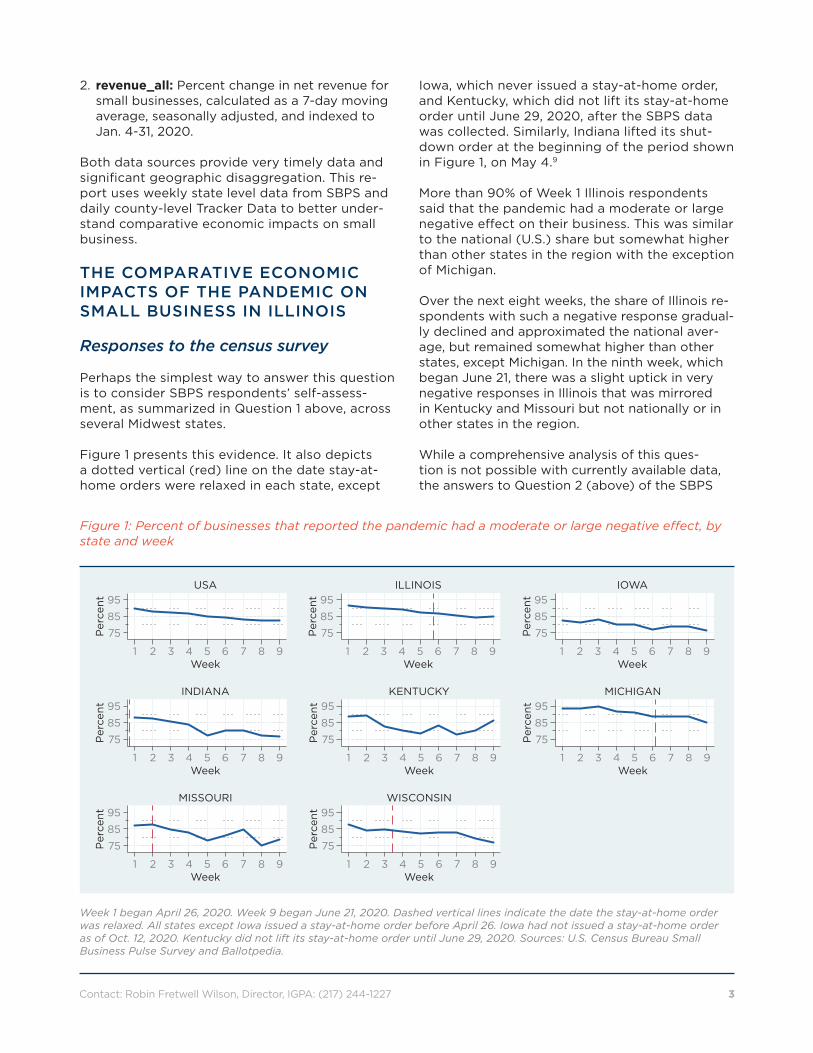
Figure 1: Percent of businesses that reported the pandemic had a moderate or large negative effect, by state and week
Week 1 began April 26, 2020. Week 9 began June 21, 2020. Dashed vertical lines indicate the date the stay-at-home order was relaxed. All states except Iowa issued a stay-at-home order before April 26. Iowa had not issued a stay-at-home order as of Oct. 12, 2020. Kentucky did not lift its stay-at-home order until June 29, 2020. Sources: U.S. Census Bureau Small Business Pulse Survey and Ballotpedia.
2. revenue_all: Percent change in net revenue for small businesses, calculated as a 7-day moving average, seasonally adjusted, and indexed to Jan. 4-31, 2020.
Both data sources provide very timely data and significant geographic disaggregation. This re-port uses weekly state level data from SBPS and daily county-level Tracker Data to better under-stand comparative economic impacts on small business.
THE COMPARATIVE ECONOMIC IMPACTS OF THE PANDEMIC ON SMALL BUSINESS IN ILLINOIS
Responses to the census survey
Perhaps the simplest way to answer this question is to consider SBPS respondents’ self-assess-ment, as summarized in Question 1 above, across several Midwest states.
Figure 1 presents this evidence. It also depicts a dotted vertical (red) line on the date stay-at-home orders were relaxed in each state, except
Iowa, which never issued a stay-at-home order, and Kentucky, which did not lift its stay-at-home order until June 29, 2020, after the SBPS data was collected. Similarly, Indiana lifted its shut-down order at the beginning of the period shown in Figure 1, on May 4.9
More than 90% of Week 1 Illinois respondents said that the pandemic had a moderate or large negative effect on their business. This was similar to the national (U.S.) share but somewhat higher than other states in the region with the exception of Michigan.
Over the next eight weeks, the share of Illinois re-spondents with such a negative response gradual-ly declined and approximated the national aver-age, but remained somewhat higher than other states, except Michigan. In the ninth week, which began June 21, there was a slight uptick in very negative responses in Illinois that was mirrored in Kentucky and Missouri but not nationally or in other states in the region.
While a comprehensive analysis of this ques-tion is not possible with currently available data, the answers to Question 2 (above) of the SBPS

4Contact: Robin Fretwell Wilson, Director, IGPA: (217) 244-1227
survey—the amount of cash on hand—do provide one important indicator of the precariousness of a small business’ long-term viability.
Figure 2 summarizes data for the same group of states. It gives the percentage of small business respondents in each state that reported having four weeks or more of cash on hand. With this question, a higher number is better than a lower number.
In Week 1 of the SBPS shown above, a slightly smaller share of Illinois respondents reported four weeks or more of cash on hand compared to the U.S. as a whole and several other states in the re-gion. Illinois businesses more closely mirror those in Kentucky and Indiana.
Over time, the share of Illinois and national re-spondents with this level of cash on hand in-creased until Week 5 (May 31 through June 6), after which it fell slightly and then plateaued.
By Week 9, which started June 21, the 55% of Illi-nois respondents reporting four or more weeks of cash on hand was similar to the national average and the share in Indiana, Kentucky, Missouri, and Wisconsin. Illinois’ 55% was slightly above the share in Iowa and slightly below the share in Michigan.
To summarize: The data from the SBFS survey, which reports small business’ self-assessment of the pandemic’s economic impact, suggest that the effect in Illinois has moderated somewhat over time and is quite similar to the impact nationally and among neighboring states.
There is little evidence that variation in the dates and stringency of the stay-at-home orders had a significant effect on the pandemic’s economic impact on small business.
Responses to the Opportunity Insights data
The Tracker Data from Opportunity Insights has some advantages and some disadvantages com-pared to the SBFS data.
It is based on data about the actual credit card revenue received by the business, which may provide a more objective measure than subjec-tive survey responses. In addition, these data are available daily and for many U.S. counties. This level of disaggregation allows us to track sub-state time trends.
USA60
50
40
1 2 3 4 5 6 7 8 9
Per
cent
Week
INDIANA60
50
40
1 2 3 4 5 6 7 8 9
Per
cent
Week
MISSOURI60
50
40
1 2 3 4 5 6 7 8 9
Per
cent
Week
WISCONSIN60
50
40
1 2 3 4 5 6 7 8 9
Per
cent
Week
KENTUCKY60
50
40
1 2 3 4 5 6 7 8 9
Per
cent
Week
MICHIGAN60
50
40
1 2 3 4 5 6 7 8 9
Per
cent
Week
ILLINOIS60
50
40
1 2 3 4 5 6 7 8 9
Per
cent
Week
IOWA60
50
40
1 2 3 4 5 6 7 8 9
Per
cent
Week
Figure 2: Percent of businesses that reported four weeks or more of cash on hand, by state and week
Week 1 began April 26, 2020. Week 9 began June 21, 2020. Dashed vertical lines indicate the date the stay-at-home order was relaxed. All states except Iowa issued a stay-at-home order before April 26. Iowa had not issued a stay-at-home order as of Oct. 12, 2020. Kentucky did not lift its stay-at-home order until June 29, 2020. Sources: U.S. Census Bureau Small Business Pulse Survey and Ballotpedia.
5Contact: Robin Fretwell Wilson, Director, IGPA: (217) 244-1227
On the other hand, Tracker Data reflect only a narrow slice of current economic activity and may not reflect broad economic conditions and judgments the way survey responses can.10
This report provides two sets of data analyses using the Tracker Data. First, this report presents the effect of stay-at-home orders on small business activity. It com-pares the number of open small businesses and revenue in Cook County, Illinois (which includes Chicago) and collar counties to small business revenue and the number of open small businesses in Marion County, Indiana (which includes Indianapolis) and sur-rounding counties.
Secondly, we compare small business’ status as opened or closed and revenue in 15 Illinois border counties with their adja-cent counties around the state line for a number of states in the region.
Small business activity in Chicago and Indianapolis
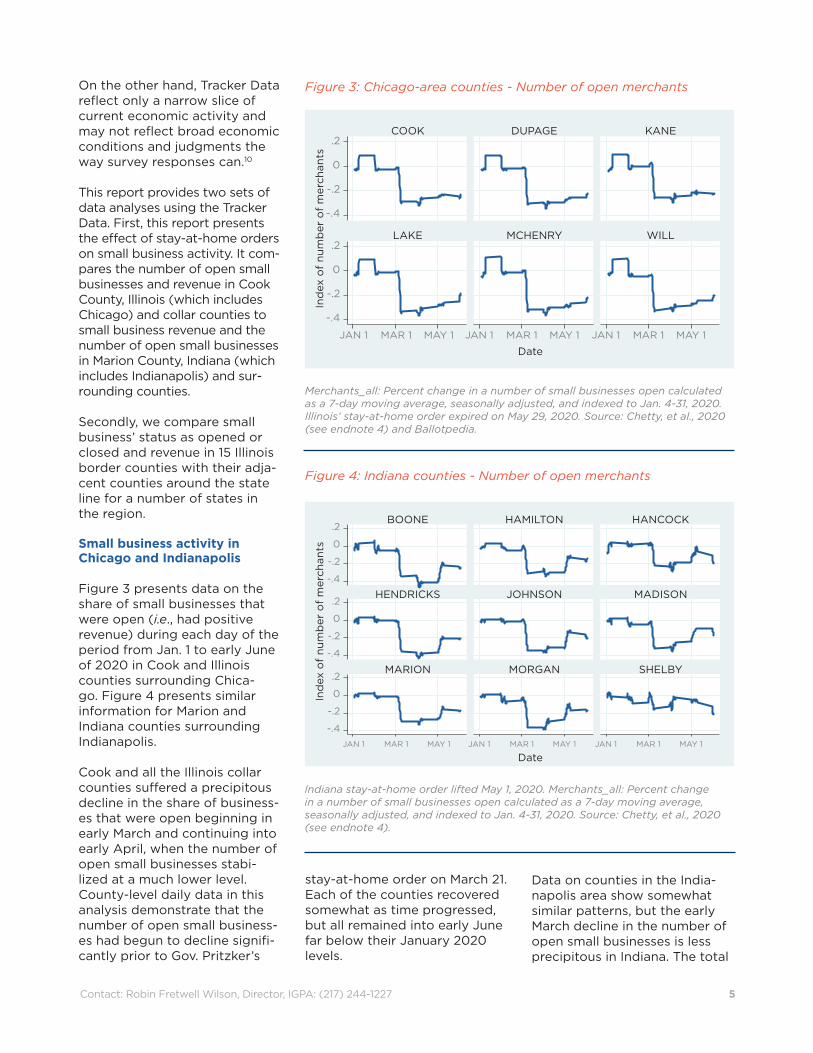
Figure 3 presents data on the share of small businesses that were open (i.e., had positive revenue) during each day of the period from Jan. 1 to early June of 2020 in Cook and Illinois counties surrounding Chica-go. Figure 4 presents similar information for Marion and Indiana counties surrounding Indianapolis.
Cook and all the Illinois collar counties suffered a precipitous decline in the share of business-es that were open beginning in early March and continuing into early April, when the number of open small businesses stabi-lized at a much lower level. County-level daily data in this analysis demonstrate that the number of open small business-es had begun to decline signifi-cantly prior to Gov. Pritzker’s
stay-at-home order on March 21. Each of the counties recovered somewhat as time progressed, but all remained into early June far below their January 2020 levels.
Data on counties in the India-napolis area show somewhat similar patterns, but the early March decline in the number of open small businesses is less precipitous in Indiana. The total
Figure 3: Chicago-area counties - Number of open merchants
.2
0
-.2
-.4
Ind
ex o
f nu
mb
er o
f m
erch
ants
Date
DUPAGECOOK KANE
JAN 1 MAR 1 MAY 1 JAN 1 MAR 1 MAY 1 JAN 1 MAR 1 MAY 1
.2
0
-.2
-.4
MCHENRYLAKE WILL
Merchants_all: Percent change in a number of small businesses open calculated as a 7-day moving average, seasonally adjusted, and indexed to Jan. 4-31, 2020. Illinois’ stay-at-home order expired on May 29, 2020. Source: Chetty, et al., 2020 (see endnote 4) and Ballotpedia.
Figure 4: Indiana counties - Number of open merchants
.2
0
-.2
-.4
.2
0
-.2
-.4
Ind
ex o
f nu
mb
er o
f m
erch
ants
Date
HAMILTON
JOHNSON
BOONE
HENDRICKS
HANCOCK
MADISON
JAN 1 MAR 1 MAY 1 JAN 1 MAR 1 MAY 1 JAN 1 MAR 1 MAY 1
.2
0
-.2
-.4
MORGANMARION SHELBY
Indiana stay-at-home order lifted May 1, 2020. Merchants_all: Percent change in a number of small businesses open calculated as a 7-day moving average, seasonally adjusted, and indexed to Jan. 4-31, 2020. Source: Chetty, et al., 2020 (see endnote 4).
magnitude of the decline and the amount of recovery through early June are similar across the two states.
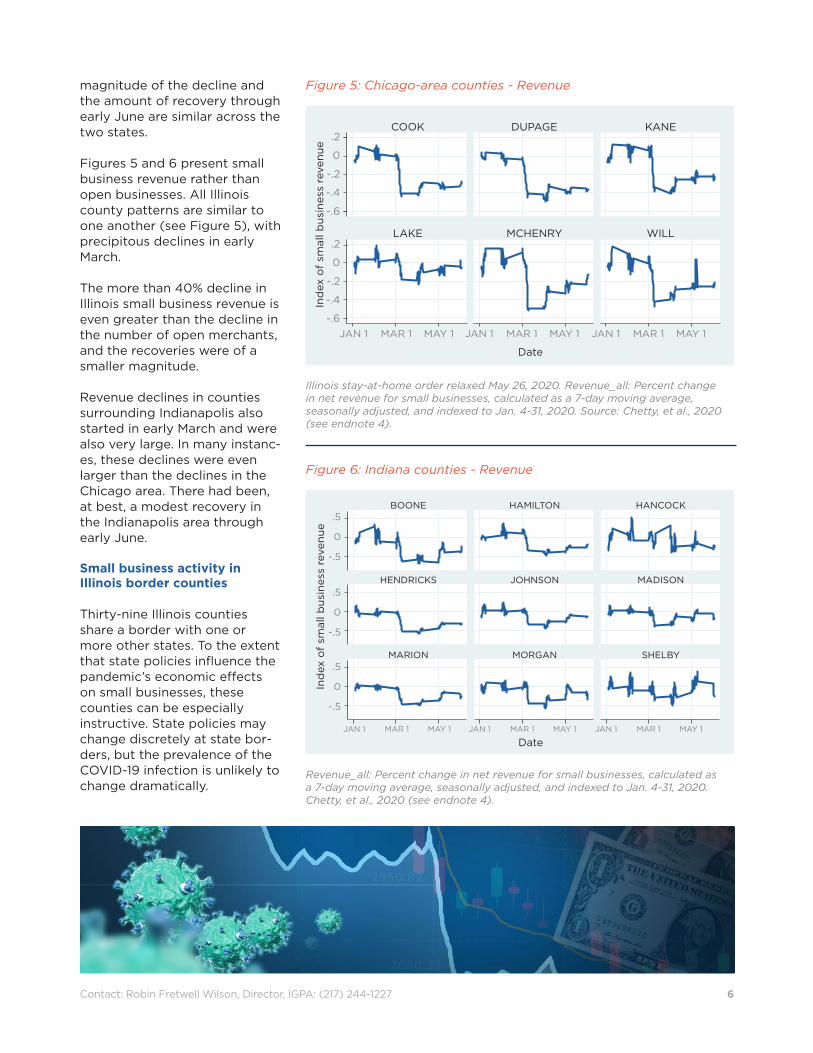
Figures 5 and 6 present small business revenue rather than open businesses. All Illinois county patterns are similar to one another (see Figure 5), with precipitous declines in early March.
The more than 40% decline in Illinois small business revenue is even greater than the decline in the number of open merchants, and the recoveries were of a smaller magnitude.
Revenue declines in counties surrounding Indianapolis also started in early March and were also very large. In many instanc-es, these declines were even larger than the declines in the Chicago area. There had been, at best, a modest recovery in the Indianapolis area through early June.
Small business activity in Illinois border counties
Thirty-nine Illinois counties share a border with one or more other states. To the extent that state policies influence the pandemic’s economic effects on small businesses, these counties can be especially instructive. State policies may change discretely at state bor-ders, but the prevalence of the COVID-19 infection is unlikely to change dramatically.
6Contact: Robin Fretwell Wilson, Director, IGPA: (217) 244-1227
Figure 6: Indiana counties - Revenue
.5
0
-.5
.5
0
-.5
Ind
ex o
f sm
all b
usin
ess
reve
nue
Date
HAMILTON
JOHNSON
BOONE
HENDRICKS
HANCOCK
MADISON
JAN 1 MAR 1 MAY 1 JAN 1 MAR 1 MAY 1 JAN 1 MAR 1 MAY 1
.5
0
-.5
MORGANMARION SHELBY
Revenue_all: Percent change in net revenue for small businesses, calculated as a 7-day moving average, seasonally adjusted, and indexed to Jan. 4-31, 2020. Chetty, et al., 2020 (see endnote 4).
Figure 5: Chicago-area counties - Revenue
.2
0
-.2
-.4
-.6
Ind
ex o
f sm
all b
usin
ess
reve
nue
Date
DUPAGECOOK KANE
JAN 1 MAR 1 MAY 1 JAN 1 MAR 1 MAY 1 JAN 1 MAR 1 MAY 1
.2
0
-.2
-.4
-.6
MCHENRYLAKE WILL
Illinois stay-at-home order relaxed May 26, 2020. Revenue_all: Percent change in net revenue for small businesses, calculated as a 7-day moving average, seasonally adjusted, and indexed to Jan. 4-31, 2020. Source: Chetty, et al., 2020 (see endnote 4).
7Contact: Robin Fretwell Wilson, Director, IGPA: (217) 244-1227
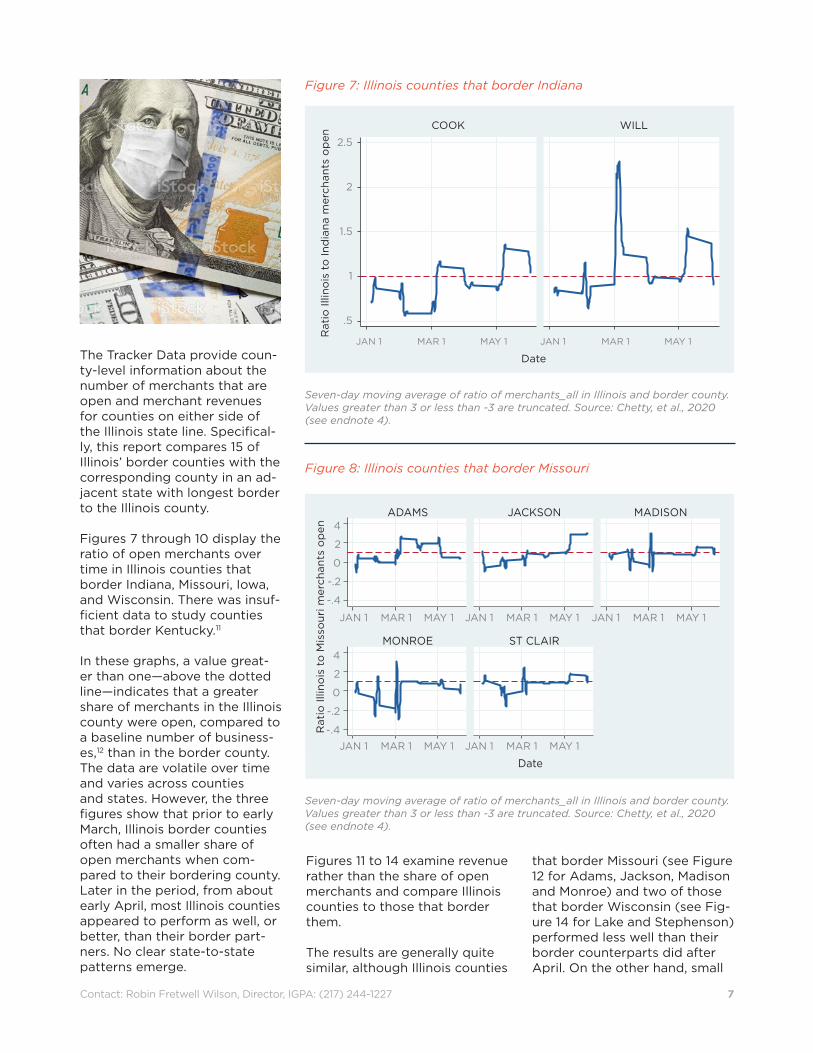
The Tracker Data provide coun-ty-level information about the number of merchants that are open and merchant revenues for counties on either side of the Illinois state line. Specifical-ly, this report compares 15 of Illinois’ border counties with the corresponding county in an ad-jacent state with longest border to the Illinois county.
Figures 7 through 10 display the ratio of open merchants over time in Illinois counties that border Indiana, Missouri, Iowa, and Wisconsin. There was insuf-ficient data to study counties that border Kentucky.11
In these graphs, a value great-er than one—above the dotted line—indicates that a greater share of merchants in the Illinois county were open, compared to a baseline number of business-es,12 than in the border county. The data are volatile over time and varies across counties and states. However, the three figures show that prior to early March, Illinois border counties often had a smaller share of open merchants when com-pared to their bordering county. Later in the period, from about early April, most Illinois counties appeared to perform as well, or better, than their border part-ners. No clear state-to-state patterns emerge.
Figures 11 to 14 examine revenue rather than the share of open merchants and compare Illinois counties to those that border them.
The results are generally quite similar, although Illinois counties
that border Missouri (see Figure 12 for Adams, Jackson, Madison and Monroe) and two of those that border Wisconsin (see Fig-ure 14 for Lake and Stephenson) performed less well than their border counterparts did after April. On the other hand, small
Figure 8: Illinois counties that border Missouri
Rat
io Il
lino
is t
o M
isso
uri m
erch
ants
op
en
Date
JAN 1 MAR 1 MAY 1 JAN 1 MAR 1 MAY 1
4
2
0
-.2
-.4
ST CLAIRMONROE
JAN 1 MAR 1 MAY 1 JAN 1 MAR 1 MAY 1 JAN 1 MAR 1 MAY 1
4
2
0
-.2
-.4
JACKSONADAMS MADISON
Seven-day moving average of ratio of merchants_all in Illinois and border county. Values greater than 3 or less than -3 are truncated. Source: Chetty, et al., 2020 (see endnote 4).
Figure 7: Illinois counties that border Indiana
Rat
io Il
lino
is t
o In
dia
na m
erch
ants
op
en
Date
JAN 1 MAR 1 MAY 1 JAN 1 MAR 1 MAY 1
2.5
2
1.5
1
.5
WILLCOOK
Seven-day moving average of ratio of merchants_all in Illinois and border county. Values greater than 3 or less than -3 are truncated. Source: Chetty, et al., 2020 (see endnote 4).

8 Contact: Robin Fretwell Wilson, Director, IGPA: (217) 244-1227
businesses in St. Clair County seemed to do better than their neighboring county in Missouri. Businesses in Boone and Win-nebago counties seemed to do better than neighboring coun-ties in Wisconsin at least during the end of the period. Rock Island and Whiteside county businesses also were outper-forming their border counties in Iowa toward the end of the period.
CONCLUSION
Evidence presented here demonstrates that the COVID-19 pandemic had ma-jor negative impacts on small businesses in Illinois and neigh-boring states.
The vast majority of business-es reported a moderate or large negative impact from the pandemic. That impact moder-ated somewhat over time but remained severe even in late June. Many small businesses had only a few weeks of cash on hand early in the pandemic and that improved only grad-ually. Many small businesses were forced to close, at least temporarily, and small business revenue plummeted.
Figure 10: Illinois counties that border Wisconsin
Rat
io Il
lino
is t
o W
isco
nsin
mer
chan
ts o
pen
Date
JAN 1 MAR 1 MAY 1 JAN 1 MAR 1 MAY 1
4
2
0
-.2
WINNEBAGOSTEPHENSON
JAN 1 MAR 1 MAY 1 JAN 1 MAR 1 MAY 1 JAN 1 MAR 1 MAY 1
4
2
0
-.2
LAKEBOONE MCHENRY
Seven-day moving average of ratio of merchants_all in Illinois and border county. Values greater than 3 or less than -3 are truncated. Source: Chetty, et al., 2020 (See endnote 4).
Figure 9: Illinois counties that border Iowa
Figure 11: Illinois counties that border Indiana
rati
o IL
to
IA m
erch
ants
op
en
JAN 1 MAR 1 MAY 1 JAN 1 MAR 1 MAY 1 JAN 1 MAR 1 MAY 1
4
2
0
-.2
ROCK ISLANDHANCOCK WHITESIDE
Date
rati
o IL
to
IN r
even
ue in
dex
JAN 1 MAR 1 MAY 1 JAN 1 MAR 1 MAY 1
Date
3
2
1
0
-1
WILLCOOK
Seven-day moving average of ratio of merchants_all in Illinois and border county. Values greater than 3 or less than -3 are truncated. Source: Chetty, et al., 2020 (see endnote 4).
Seven-day moving average of ratio of revenue_all in Illinois and border county. Values greater than 3 or less than -3 are truncated. Source: Chetty, et al., 2020 (see endnote 4).

9 Contact: Robin Fretwell Wilson, Director, IGPA: (217) 244-1227
Figure 12: Illinois counties that border Missouri
Figure 13: Illinois counties that border Iowa
Figure 14: Illinois counties that border Wisconsin
Rat
io Il
lino
is t
o M
isso
uri r
even
ue in
dex
Date
JAN 1 MAR 1 MAY 1 JAN 1 MAR 1 MAY 1
4
2
0
-.2
-.4
ST. CLAIRMONROE
JAN 1 MAR 1 MAY 1 JAN 1 MAR 1 MAY 1 JAN 1 MAR 1 MAY 1
4
2
0
-.2
-.4
JACKSONADAMS MADISON
rati
o IL
to
IA r
even
ue in
dex
JAN 1 MAR 1 MAY 1 JAN 1 MAR 1 MAY 1 JAN 1 MAR 1 MAY 1
4
2
0
-.2
ROCK ISLANDHANCOCK WHITESIDE
Date
Rat
io IL
to
WI r
even
ue in
dex
4
2
0
-.2
JAN 1 MAR 1 MAY 1
MCHENRY
JAN 1 MAR 1 MAY 1
BOONE
JAN 1 MAR 1 MAY 1
LAKE
Date
JAN 1 MAR 1 MAY 1
STEPHENSON
JAN 1 MAR 1 MAY 1
WINNEBAGO
Seven-day moving average of ratio of revenue_all in Illinois and border county. Values greater than 3 or less than -3 are truncated. Source: Chetty, et al., 2020 (see endnote 4).
Seven-day moving average of ratio of revenue_all in Illinois and border county. Values greater than 3 or less than -3 are truncated. Source: Chetty, et al., 2020 (see endnote 4).
Seven-day moving average of ratio of revenue_all in Illinois and border county. Values greater than 3 or less than -3 are truncated. Source: Chetty, et al., 2020 (see endnote 4).
We see similar patterns be-tween Illinois and each of its neighboring states and there is little evidence that states’ stay-at-home orders were a signifi-cant predictor of the negative economic outcomes for small business.
Of course, the data currently available only provide informa-tion about short-term impacts and may not capture impacts on the full range of small businesses.
The pandemic’s economic im-pact is driven by many factors including the incidence of the disease, pre-existing economic and structural conditions, and public policies. However, more study is needed before eco-nomic effects on small business can be attributed to any single cause.

10Contact: Robin Fretwell Wilson, Director, IGPA: (217) 244-1227
Geoffrey HewingsIGPA Scholar Emeritus;
Director EmeritusRegional Economics
Applications Laboratory University of Illinois at
Urbana-Champaign
Kenneth KrizIGPA Affiliate;
University DistinguishedProfessor of Public Administration;
Director, Institute for Illinois Public Finance
University of Illinoisat Springfield
David MerrimanIGPA Senior Scholar;
James J. Stukel Presidential Professor of
Public AdministrationUniversity of Illinois
at Chicago
Beverly BunchProfessor of Public
AdmiistrationUniversity of Illinois
at Springfield
Patricia ByrnesAssociate Professor
of EconomicsUniversity of Illinois
at Springfield
Francis ChoiPhD Student
Public AdministrationUniveristy of Illinois
at Chicago
Larry DeBrockDean Emeritus;
Professor of Finance and Economics
Gies College of Business
University of Illinois atUrbana-Champaign
Michael DisherPhD Student Economics
University of Illioisat Chicago
Joshua DruckerAssociate Professorof Urban Planning
and PolicyUniversity of Illinois
at Chicago
Matt FinkinMaybelle Swanlund
Endowed Chair, Center for
Advanced Study; Professor of Law
University of Illinois at Urbana-Champaign
Don FullertonIGPA Senior Scholar; Gutgsell Professor
of FinanceUniversity of Illinois at
Urbana-Champaign
Brian GainesIGPA Senior Scholar;
Professor ofPolitical Science
University ofIllinois at
Urbana-Champaign
J. Fred GiertzIGPA Scholar
Emeritus;Professor Emeritus
of EconomicsUniversity of
Illinois at Urbana-Champaign
Joseph HoerethDirector, Institute
for Policy and Civic
EngagementUniversity of Illinois
at Chicago
Faye JonesDirector
Albert E. Jenner Law Library; Clinical
Professor of Law University of
Illinois at Urbana-Champaign
Amanda Kass Associate Director
Government Finance Research Center
University of Illinoisat Chicago
Arwi KrizVisiting Research
FellowInstitute for Illinois
Public FinanceUniversity of Illinois
at Springfield
Christopher Z. MooneyIGPA Senior Scholar;W. Russell Arrington
Professor ofState Politics
University of Illinoisat Chicago
Michael PaganoDean, College of
Urban Planning and Public Affairs
Director, Government Finance Research
CenterUniversity of Illinois
at Chicago
Lisa PowellDirector
Division ofHealth Policy
and AdministrationUniversity of Illinois
at Chicago
Tara PowellAssistant Professor
School ofSocial WorkUniversity of
Illinois atUrbana-Champaign
Elizabeth T. PowersIGPA Senior Scholar Associate Professor
of EconomicsUniversity of
Illinois atUrbana-Champaign
Kent RedfieldIGPA Scholar
Emeritus;Professor Emeritusof Political ScienceUniversity of Illinois
at Springfield
Julian ReifIGPA Senior Scholar;Assistant Professor
of FinanceUniversity of
Illinois atUrbana-Champaign
Moira ZellnerAssociate Professor
Urban Planning and Policy Director,
Urban Data Visualization Lab
University of Illinoisat Chicago
Robin Fretwell WilsonDirector
Institute of Government and
Public AffairsUniversity of Illinois
System
We are honored to have the opportunity to harness our collective research and experience to serve our neighbors and
the residents of Illinois during a time of great need.
Respectfully submitted,

11Contact: Robin Fretwell Wilson, Director, IGPA: (217) 244-1227
ENDNOTES
1 “Stay at Home FAQ,” Illinois Department of Public Health, https://coronavirus.illinois.gov/s/stay-at-home-faqs#a1About%20the%20Order, accessed Oct. 12, 2020.
2 Dates of stay-at-home orders found at “Coronavirus Reopening: Map of COVID-19 Case Trends, Reopening Status and Mobility,” USA Today, updated Oct. 12, 2020, accessed Oct. 12, 2020, https://www.usatoday.com/storytelling/coronavirus-reopening-ameri-ca-map/
3 Illinois Department of Employment Securi-ty, “Illinois and Chicago Metropolitan Area Un-employment Rates,” accessed Oct. 12, 2020, https://www2.illinois.gov/ides/lmi/Local%20Area%20Unemployment%20Statistics%20LAUS/ILChicagoMetroAreaUnemployment Rates/table1.pdf.
4 Chetty, Raj, et al, “How Did COVID-19 and Stabilization Policies Affect Spending and Employment? A New Real-Time Economic Tracker Based on Private Sector Data,” op-portunityinsights.org, June 2020, accessed Oct. 12, 2020, https://opportunityinsights.org/wp-content/uploads/2020/05/tracker_paper.pdf.
5 Powers, Elizabeth T., “Child Care is Foun-dational to Economic Recovery,” Policy Spotlight, Institute of Government and Public Affairs, University of Illinois System, June 16, 2020, https://igpa.uillinois.edu/report/policy- spotlight-child-care-capacity.
6 Kwak, James, “The End of Small Business,” Washington Post, July 9, 2020, accessed Oct. 12, 2020, https://perma.cc/SW7D-53L7.
7 The U.S. Census Bureau describes the SBPS as follows: The target population is all non-farm, single-location employer businesses with 1-499 employees and receipts of $1,000 or more in the 50 states. … The sample for the Small Business Pulse Survey is not a proba-bility sample, although weights were applied to ensure that each weekly panel represented
the full population. … The Small Business Pulse Survey may be subject to non-response bias, as businesses that have closed due to COVID-19 may not be receiving the invitation to participate, so are unable to respond.
8 Chetty et. al, “COVID-19 and Stabilization Policies,” p.9, describes Womply as “a com-pany that aggregates data from several credit card processors to provide analytical insights to small businesses and other clients.” Ad-ditional information about Womply can be found at https://womply.com.
9 Indiana’s stay-at-home order was relaxed on May 4 during the first week of SBFS data collection, https://chicago.cbslocal.com/2020/05/01/indiana-easing-stay-at-home-order-roadmap-back-on-track-reopen-ing-covid-19-coronavirus/.
10 Chetty et. al, “COVID-19 and Stabilization Policies,” p.7, notes that a major disadvantage of the Tracker Data as “is that they capture information exclusively about the customers each company serves, and thus are not neces-sarily representative of the full population.” In this report’s use of the Tracker Data, it is pos-sible that the Tracker Data may be differently representative of the full population in the geographic areas presented here. That is, as one example, the Tracker Data may be quite representative of business activity in Cook County but could be less representative in less-urban counties around the region. Thus, readers should interpret these results with appropriate caution.
11 Michigan does not border Illinois except in Lake Michigan.
12 Chetty et. al, “COVID-19 and Stabilization Policies,” describes the exact procedures used to derive the baseline number of businesses in each county. Roughly speaking, the baseline number of open businesses is the number of open businesses in the county in mid-January 2020 adjusted for seasonality.

12 Contact: Robin Fretwell Wilson, Director, IGPA: (217) 244-1227
Acknowledgements
The faculty lead expresses gratitude to Economic and Fiscal Impact group members Joshua Drucker, Don Fullerton, Kenneth Kriz, and Julian Reif, and colleague Rachel Weber for their thoughtful review and commentary. Their contributions greatly aided the production of this report.
Audience
IGPA Impact Reports are intended to be useful to policymakers and stakeholders, including but not limited to University of Illinois System leaders, state legislators, Gov. J.B. Pritzker’s office, state agencies, news media, nonprofits, educators, volunteer organizations, and faith leaders.
Photography from istockphoto.com
Pg. 1 - Sorry we’re closed #1220064309 by Kanawa Studio
Pg. 6 - Virus/finance chart #1212761329 by Jira Pliankharom
Pg. 7 - Masked Ben Franklin #1218811591 by Feverpitched
Pg. 7 - Reopening sign #1226569534 by Leo Patrizi