the cruise review - clia uk · pdf filethe cruise review published march 2016. contents 2015:...
TRANSCRIPT
THE CRUISE REVIEW PUBLISHED MARCH 2016

CONTENTS
2015: WAS A SPECIAL YEAR FOR UK CRUISING 3EXECUTIVE SUMMARY 2015 5NEW SHIPS, NEW UK RECORD 6CANARIES FLYING HIGH 8RECORD CRUISE VISITORS AT UK PORTS 10SHORTER CRUISES TREND RESUMED 11CRUISING REMAINS GREAT VALUE 12CRUISERS CAN’T HAVE TOO MUCH OF A GOOD THING 14CONSUMERS STOP LEAVING IT TO LAST MINUTE 15UK PORTS TO THE FORE AGAIN 16CRUISE MARKET GOES (SOUTH)WEST 17DANUBE IS THE STAR PERFORMER 18
2015 WAS A SPECIAL YEAR FOR UK CRUISING
“All the indicators suggest that 2015 will be the best year in the UK cruise market’s history.” This was the forecast made in the last CLIA UK & Ireland Annual Cruise Review. And how accurate that turned out to be. For it was a record year thanks to a 9% increase in cruise passengers for a best-ever annual total of nearly 1.8m.
The arrival of Britannia, the largest ship built for P&O Cruises and the largest dedicated to the UK market, together with Royal Caribbean International’s Anthem of the Seas and Cruise & Maritime Voyages Magellan helped grow the number of cruise guests to new heights.
And not to be outdone, the continued investment in river vessels has led to another record year for the number of UK & Irish consumers taking a river cruise holiday.
As the world’s cruise industry continues to invest, innovate and expand fleet sizes to attract greater numbers of guests, the UK is also looking forward to the arrival of new ships with a particular focus on the domestic market.
In June, Thomson Cruises is launching its newest ship, Thomson Discovery, dedicated to the UK market which is showing many positive signs of a return to consistent growth.
Looking into next year, Norwegian Cruise Line is returning to the UK after a 7-year gap while Thomson Cruises is also offering a series of cruises from Newcastle. Cruise & Maritime Voyages has also announced another new addition to its fleet in 2017 – Columbus will be dedicated to the British market sailing year round from Tilbury.
These developments should lead to more cruises being sold and more records being broken for the UK and Ireland cruise industry.
2 3

4 5
EXECUTIVE SUMMARY 2015
UK & Ireland achieves highest growth rate of all major European markets and its largest annual rise for seven years
One in nine package holidays booked is a cruise - up from one in 10 in 2014
Huge rise in the popularity of Atlantic Islands cruises but the Mediterranean remains the No.1 choice for cruises from UK
Cruising from a UK port increased sharply in 2015 and although fly-cruise also grew, ex-UK cruises are back on course to account for 50% of passengers within a few years
Nearly two-thirds of cruise consumers took more than one cruise in 2015 – the most multiple cruisers for a decade
About a third of cruises were taken by first-timers
The average age of passengers dropped by three years – the largest annual drop for more than a decade
Last-minute bookings at lowest level for five years
River cruising’s growth reflects that of ocean cruising as passengers top 150,000
NEW SHIPS, NEW UK RECORD
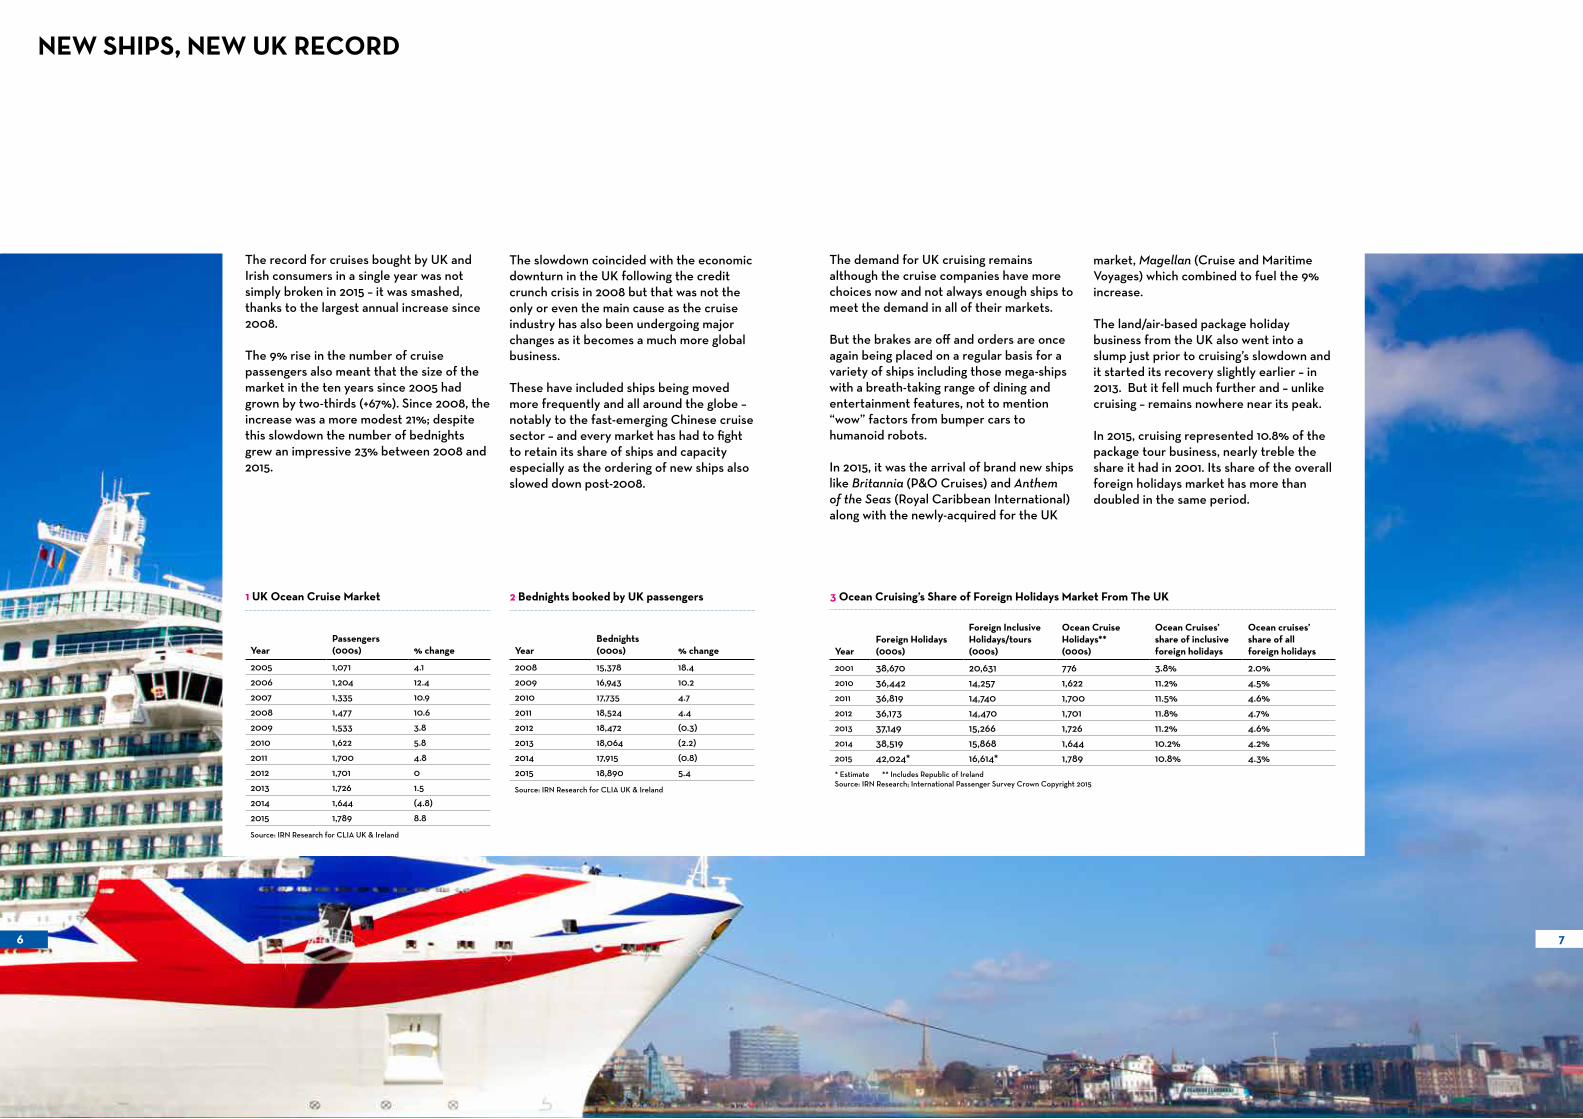
The record for cruises bought by UK and Irish consumers in a single year was not simply broken in 2015 – it was smashed, thanks to the largest annual increase since 2008.
The 9% rise in the number of cruise passengers also meant that the size of the market in the ten years since 2005 had grown by two-thirds (+67%). Since 2008, the increase was a more modest 21%; despite this slowdown the number of bednights grew an impressive 23% between 2008 and 2015.
The slowdown coincided with the economic downturn in the UK following the credit crunch crisis in 2008 but that was not the only or even the main cause as the cruise industry has also been undergoing major changes as it becomes a much more global business.
These have included ships being moved more frequently and all around the globe – notably to the fast-emerging Chinese cruise sector – and every market has had to fight to retain its share of ships and capacity especially as the ordering of new ships also slowed down post-2008.
The demand for UK cruising remains although the cruise companies have more choices now and not always enough ships to meet the demand in all of their markets.
But the brakes are off and orders are once again being placed on a regular basis for a variety of ships including those mega-ships with a breath-taking range of dining and entertainment features, not to mention “wow” factors from bumper cars to humanoid robots.
In 2015, it was the arrival of brand new ships like Britannia (P&O Cruises) and Anthem of the Seas (Royal Caribbean International) along with the newly-acquired for the UK
market, Magellan (Cruise and Maritime Voyages) which combined to fuel the 9% increase.
The land/air-based package holiday business from the UK also went into a slump just prior to cruising’s slowdown and it started its recovery slightly earlier – in 2013. But it fell much further and – unlike cruising – remains nowhere near its peak.
In 2015, cruising represented 10.8% of the package tour business, nearly treble the share it had in 2001. Its share of the overall foreign holidays market has more than doubled in the same period.
6 7
YearPassengers (000s) % change
2005 1,071 4.1
2006 1,204 12.4
2007 1,335 10.9
2008 1,477 10.6
2009 1,533 3.8
2010 1,622 5.8
2011 1,700 4.8
2012 1,701 0
2013 1,726 1.5
2014 1,644 (4.8)
2015 1,789 8.8
Source: IRN Research for CLIA UK & Ireland
1 UK Ocean Cruise Market 3 Ocean Cruising’s Share of Foreign Holidays Market From The UK
YearForeign Holidays (000s)
Foreign Inclusive Holidays/tours (000s)
Ocean Cruise Holidays**(000s)
Ocean Cruises’ share of inclusive foreign holidays
Ocean cruises’ share of all foreign holidays
2001 38,670 20,631 776 3.8% 2.0%2010 36,442 14,257 1,622 11.2% 4.5%2011 36,819 14,740 1,700 11.5% 4.6%2012 36,173 14,470 1,701 11.8% 4.7%2013 37,149 15,266 1,726 11.2% 4.6%2014 38,519 15,868 1,644 10.2% 4.2%2015 42,024* 16,614* 1,789 10.8% 4.3%* Estimate ** Includes Republic of IrelandSource: IRN Research; International Passenger Survey Crown Copyright 2015
YearBednights (000s) % change
2008 15,378 18.4
2009 16,943 10.2
2010 17,735 4.7
2011 18,524 4.4
2012 18,472 (0.3)
2013 18,064 (2.2)
2014 17,915 (0.8)
2015 18,890 5.4
Source: IRN Research for CLIA UK & Ireland
2 Bednights booked by UK passengers

CANARIES FLYING HIGH
The Atlantic Islands (Canaries and Madeira) have been favourite destinations for British cruisers for many decades but they have never had a better year than 2015 when a record 188,000 UK and Ireland passengers chose to cruise there. This was all the more remarkable as there was a small drop in the number of Atlantic Islands fly-cruises sold but a two-thirds increase in the number cruising there from the UK more than compensated. Those choosing to take a cruise from a UK port
8 9
totalled 141,000 and was more than 40% more than the next highest ever recorded (in 2013) and, again, was due to the additional ships cruising out of British ports in 2015.
There were two other records for major cruise destinations. Firstly, the sixth consecutive annual increase brought the number of passengers cruising Western Europe (ports in the UK, Atlantic and North Sea) to 252,000 and maintained its position as the most popular cruise region from a UK port.
Secondly, Mediterranean fly-cruise passengers went up 9% to a peak of 482,000 and still well ahead of Caribbean fly-cruises despite their 16% increase taking them back up to 220,000 – the highest since 2011.
Like the Atlantic Islands, Norway is a long-established favourite with British cruisers and it has recently enjoyed rapid growth but there was something of a market correction in 2015 with a 17% drop to 128,000 UK and Ireland cruise visitors.
There was strong growth in both fly-cruises and cruises from UK ports during 2015 but the result was a greater market-share for departures from UK ports which suggests that the reverse trend in 2014 was just a one-year blip and that a 50:50 split is imminent – a major swing given that fly-cruises accounted for nearly two-thirds of UK and Ireland cruise pasengers as recently as 2008.
4 Destinations Booked by UK Passengers (000s)
Destination 2001 2012 2013 2014 2015% change15/14
Mediterranean 334 698 644 613 672 10
Northern Europe 98 443 531 467 466 0
Caribbean 146 189 183 205 235 15
Atlantic Islands 77 145 161 151 188 25
Other Areas 121 226 208 208 228 10
Total 776 1,701 1,726 1,644 1,789 9
Source: IRN Research for CLIA UK & Ireland
5 UK Port Cruises Vs Fly Cruises
YearPassengers(000s)
%growth
UK Port Passengers (000s)
%share
Fly Cruise Passengers (000s)
% share
2008 1,477,000 10.6 557,000 37.7 920,000 62.3
2009 1,533,000 3.8 594,000 38.8 939,000 61.2
2010 1,622,000 5.8 653,000 40.3 968,000 59.7
2011 1,700,000 4.8 729,000 42.9 971,000 57.1
2012 1,701,000 0 807,000 47.4 894,000 52.6
2013 1,726,000 1.5 844,000 49.0 883,000 51.0
2014 1,644,000 (5) 739,000 45.0 905,000 55.0
2015 1,789,000 8.8 840,000 47.0 949,000 53.0
Source: IRN Research for CLIA UK & Ireland
RECORD CRUISE VISITORS AT UK PORTS
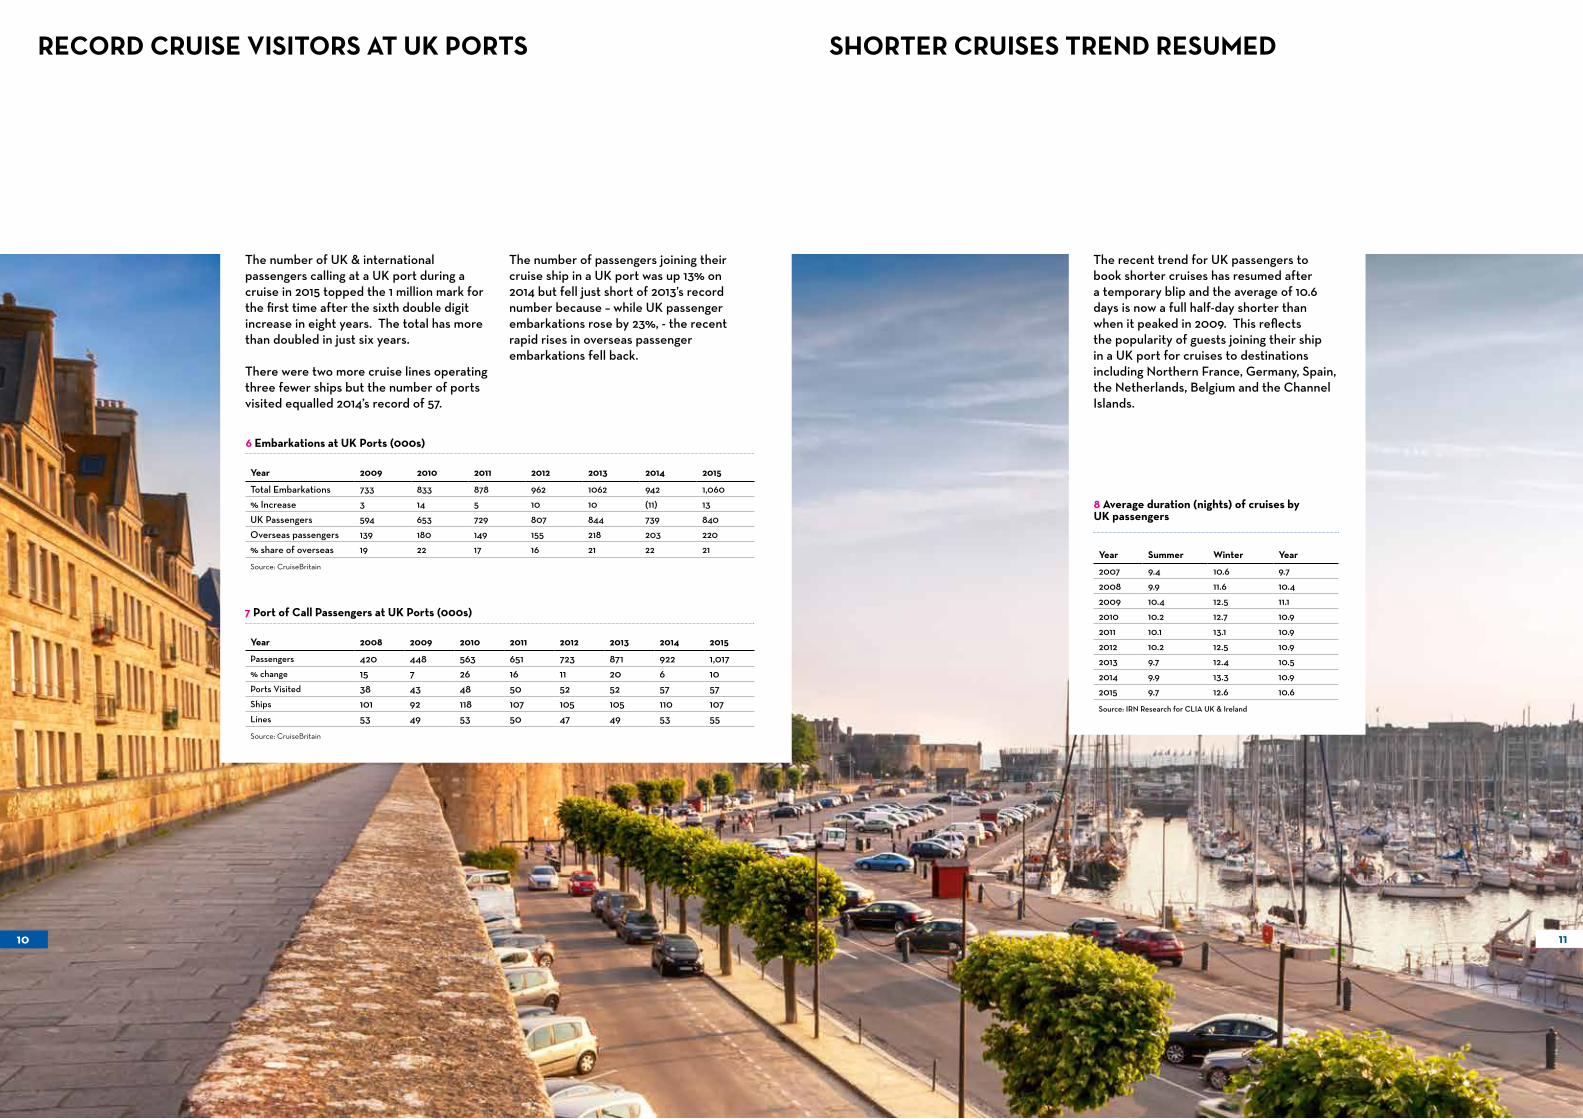
The number of UK & international passengers calling at a UK port during a cruise in 2015 topped the 1 million mark for the first time after the sixth double digit increase in eight years. The total has more than doubled in just six years.
There were two more cruise lines operating three fewer ships but the number of ports visited equalled 2014’s record of 57.
10 11
The number of passengers joining their cruise ship in a UK port was up 13% on 2014 but fell just short of 2013’s record number because – while UK passenger embarkations rose by 23%, - the recent rapid rises in overseas passenger embarkations fell back.
SHORTER CRUISES TREND RESUMED
The recent trend for UK passengers to book shorter cruises has resumed after a temporary blip and the average of 10.6 days is now a full half-day shorter than when it peaked in 2009. This reflects the popularity of guests joining their ship in a UK port for cruises to destinations including Northern France, Germany, Spain, the Netherlands, Belgium and the Channel Islands.
Year 2009 2010 2011 2012 2013 2014 2015
Total Embarkations 733 833 878 962 1062 942 1,060
% Increase 3 14 5 10 10 (11) 13
UK Passengers 594 653 729 807 844 739 840
Overseas passengers 139 180 149 155 218 203 220
% share of overseas 19 22 17 16 21 22 21
Source: CruiseBritain
6 Embarkations at UK Ports (000s)
Year 2008 2009 2010 2011 2012 2013 2014 2015
Passengers 420 448 563 651 723 871 922 1,017% change 15 7 26 16 11 20 6 10Ports Visited 38 43 48 50 52 52 57 57Ships 101 92 118 107 105 105 110 107Lines 53 49 53 50 47 49 53 55
Source: CruiseBritain
7 Port of Call Passengers at UK Ports (000s)
Year Summer Winter Year
2007 9.4 10.6 9.7
2008 9.9 11.6 10.4
2009 10.4 12.5 11.1
2010 10.2 12.7 10.9
2011 10.1 13.1 10.9
2012 10.2 12.5 10.9
2013 9.7 12.4 10.5
2014 9.9 13.3 10.9
2015 9.7 12.6 10.6
Source: IRN Research for CLIA UK & Ireland
8 Average duration (nights) of cruises by UK passengers
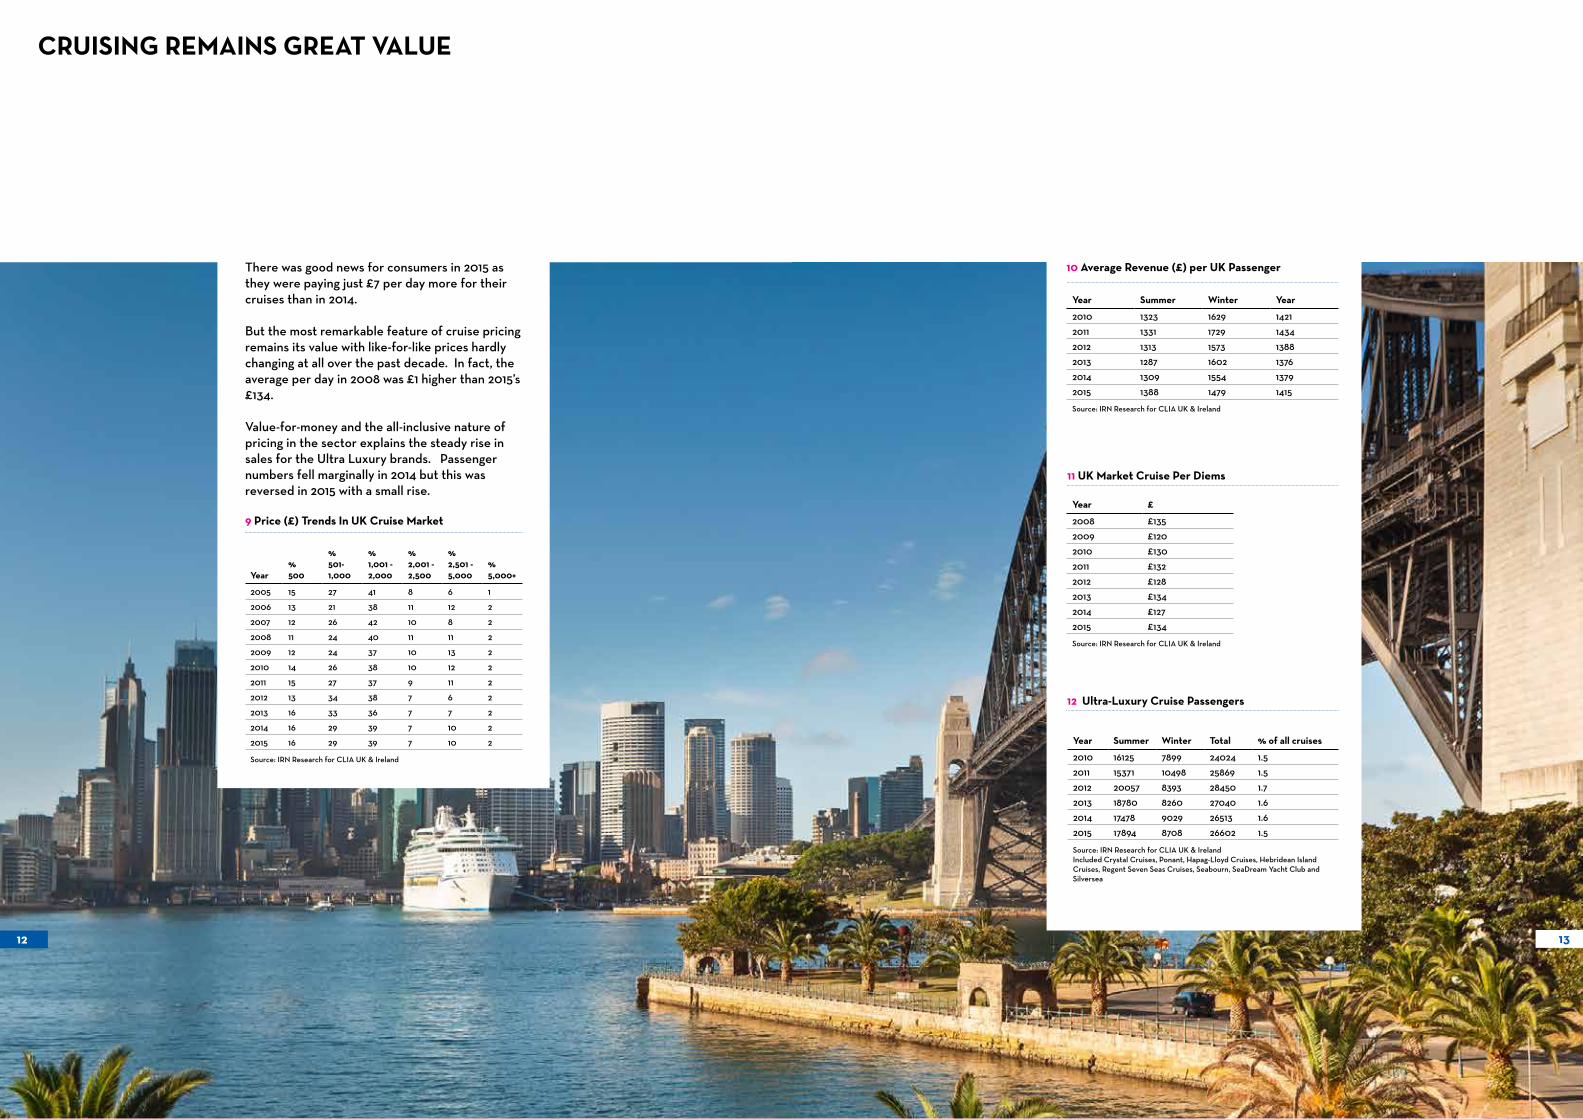
There was good news for consumers in 2015 as they were paying just £7 per day more for their cruises than in 2014. But the most remarkable feature of cruise pricing remains its value with like-for-like prices hardly changing at all over the past decade. In fact, the average per day in 2008 was £1 higher than 2015’s £134.
Value-for-money and the all-inclusive nature of pricing in the sector explains the steady rise in sales for the Ultra Luxury brands. Passenger numbers fell marginally in 2014 but this was reversed in 2015 with a small rise.
Year £
2008 £135
2009 £120
2010 £130
2011 £132
2012 £128
2013 £134
2014 £127
2015 £134
Source: IRN Research for CLIA UK & Ireland
11 UK Market Cruise Per Diems
Year Summer Winter Year
2010 1323 1629 1421
2011 1331 1729 1434
2012 1313 1573 1388
2013 1287 1602 1376
2014 1309 1554 1379
2015 1388 1479 1415
Source: IRN Research for CLIA UK & Ireland
10 Average Revenue (£) per UK Passenger
Year%500
%501-1,000
%1,001 - 2,000
%2,001 - 2,500
%2,501 - 5,000
%5,000+
2005 15 27 41 8 6 1
2006 13 21 38 11 12 2
2007 12 26 42 10 8 2
2008 11 24 40 11 11 2
2009 12 24 37 10 13 2
2010 14 26 38 10 12 2
2011 15 27 37 9 11 2
2012 13 34 38 7 6 2
2013 16 33 36 7 7 2
2014 16 29 39 7 10 2
2015 16 29 39 7 10 2
Source: IRN Research for CLIA UK & Ireland
9 Price (£) Trends In UK Cruise Market
12 13
12 Ultra-Luxury Cruise Passengers
Year Summer Winter Total % of all cruises
2010 16125 7899 24024 1.5
2011 15371 10498 25869 1.5
2012 20057 8393 28450 1.7
2013 18780 8260 27040 1.6
2014 17478 9029 26513 1.6
2015 17894 8708 26602 1.5
Source: IRN Research for CLIA UK & IrelandIncluded Crystal Cruises, Ponant, Hapag-Lloyd Cruises, Hebridean Island Cruises, Regent Seven Seas Cruises, Seabourn, SeaDream Yacht Club and Silversea
CRUISING REMAINS GREAT VALUE

CRUISERS CAN’T HAVE TOO MUCH OF A GOOD THING
Exactly half of cruise passengers took two or three cruises during 2015 and nearly two-thirds (63%) took at least two and some more than six. This is the highest share of multiple cruise-taking passengers for at least a decade.
There was also a downturn in the average age of cruise passengers at 55.2 years, a full three years down on 2014 – the biggest single year drop for two decades.
14 15
CONSUMERS STOP LEAVING IT TO LAST MINUTE
Last minute bookings were at their lowest level for five years in the UK cruise market in 2015 with just one-third being made within three months of departure. This is reflected in the price-stability detailed earlier in this review.
A quarter of bookings were made at least nine months ahead, something which used to be more common pre-2009 but which appears to be returning to the market with increases in the last two years.
In recent years, the average had been creeping up but the younger age in 2015 is a reflection of the success cruise lines have had attracting younger guests. The share of first-timer cruise passengers remained at 33% but with the overall market rising 9%, it does mean a similar rise in first-timers so progress is being made in attracting a new generation of cruise passengers.
16 UK Cruise Market - Trends in Booking Lead Times
% of bookings (no. of months)
Year 12+ 9 - 12 6 - 9 3 - 6 0 - 3
2005 17 17 18 22 22
2006 15 18 18 24 27
2007 18 17 18 23 24
2008 18 17 18 22 26
2009 25 19 17 22 17
2010 16 16 18 22 28
2011 15 15 17 20 34
2012 13 12 17 23 36
2013 11 12 16 21 40
2014 11 13 16 24 36
2015 11 14 17 24 33
Source: IRN Research for CLIA UK & Ireland
Year %
2007 38
2008 32
2009 29
2010 33
2011 40
2012 36
2013 32
2014 33
2015 33
Source: IRN Research for CLIA UK & Ireland
14 First Time Cruisers as % of UK Market
% passengers
Year Up to 26 26-34 35-44 45-54 55-64 65+ Average Age
2005 10 5 9 18 25 33 53.5
2006 8 5 11 21 27 27 52.5
2007 8 4 9 19 27 31 53.2
2008 8 4 8 18 27 33 53.7
2009 7 4 8 18 28 35 55.6
2010 9 4 9 19 27 33 54.8
2011 9 4 9 19 26 35 55.6
2012 8 4 7 18 27 37 56.1
2013 7 4 7 17 26 40 57.0
2014 5 4 5 16 27 43 58.2
2015 8 4 6 15 24 42 55.2
Source: IRN Research for CLIA UK & Ireland
13 UK Cruise Market Age Analysis
Cruises taken in last year (%)
Year 1 2 3 4 5 6+
2010 43 33 12 5 3 6
2011 58 27 9 2 1 1
2012 46 30 14 4 2 2
2013 45 33 12 4 2 1
2014 47 29 13 5 3 3
2015 37 32 18 6 5 4
Source: IRN Research for CLIA UK & Ireland
15 UK Passengers Booking Multiple Cruises Annually
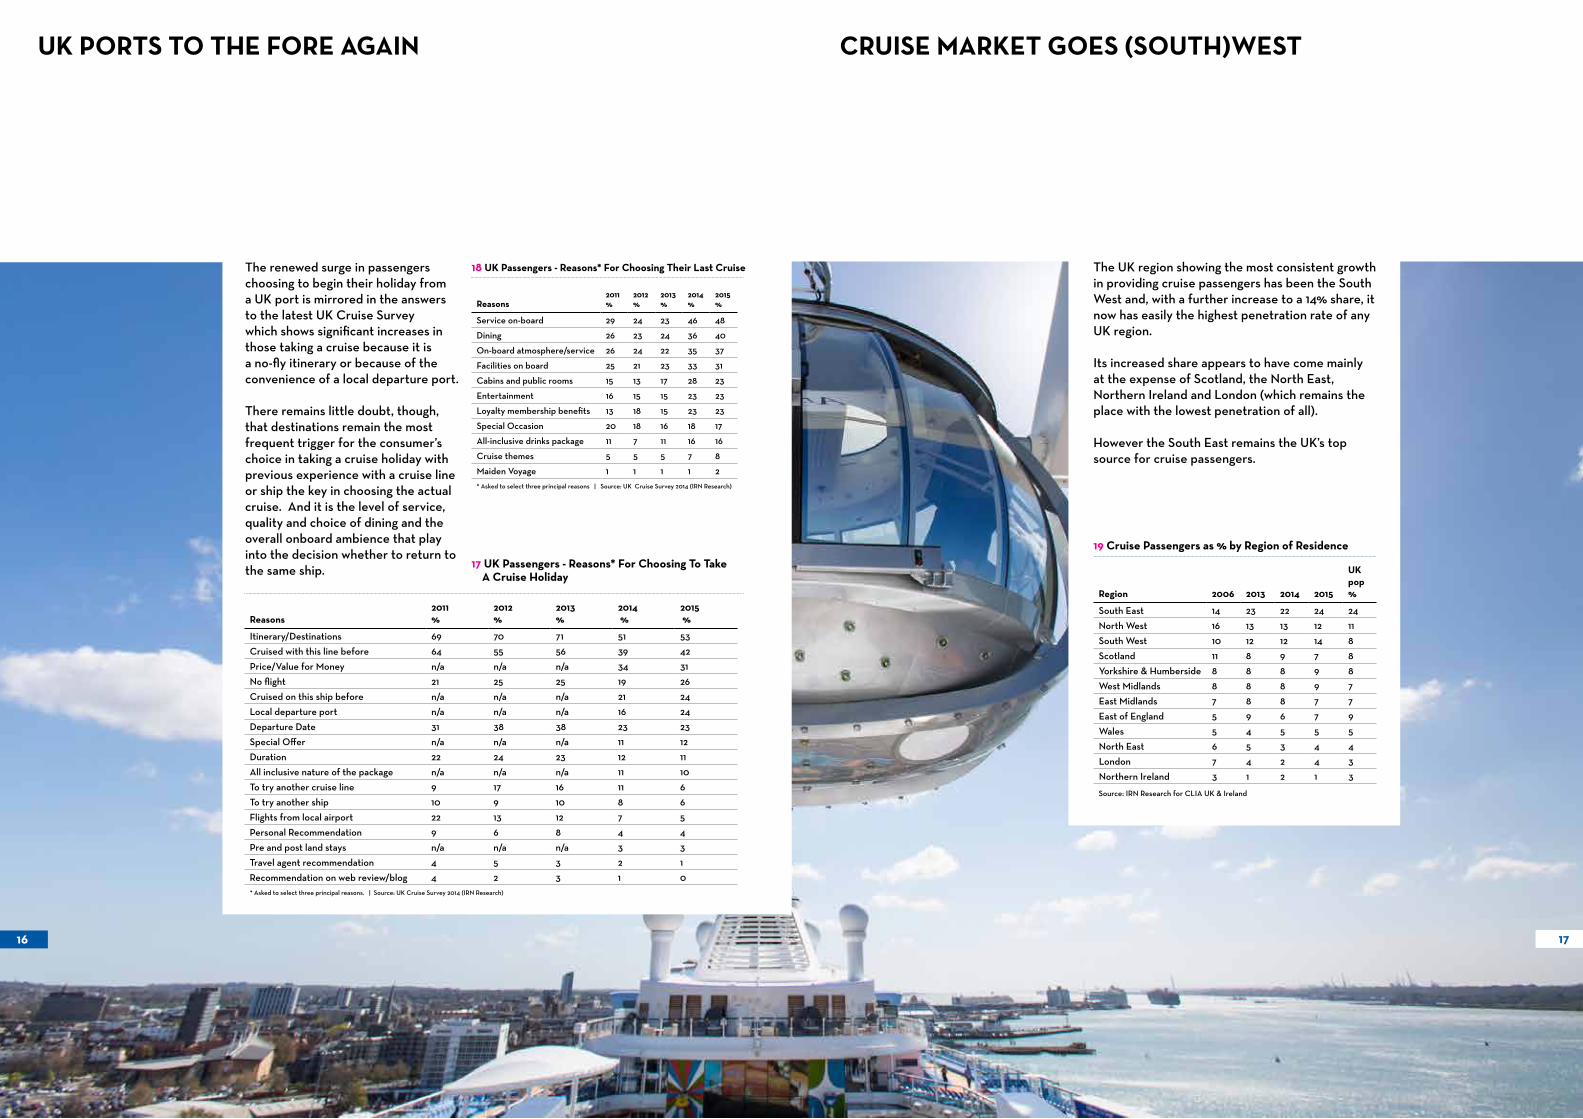
The renewed surge in passengers choosing to begin their holiday from a UK port is mirrored in the answers to the latest UK Cruise Survey which shows significant increases in those taking a cruise because it is a no-fly itinerary or because of the convenience of a local departure port.
There remains little doubt, though, that destinations remain the most frequent trigger for the consumer’s choice in taking a cruise holiday with previous experience with a cruise line or ship the key in choosing the actual cruise. And it is the level of service, quality and choice of dining and the overall onboard ambience that play into the decision whether to return to the same ship.
UK PORTS TO THE FORE AGAIN
16 17
Reasons2011 %
2012 %
2013 %
2014 %
2015 %
Service on-board 29 24 23 46 48
Dining 26 23 24 36 40
On-board atmosphere/service 26 24 22 35 37
Facilities on board 25 21 23 33 31
Cabins and public rooms 15 13 17 28 23
Entertainment 16 15 15 23 23
Loyalty membership benefits 13 18 15 23 23
Special Occasion 20 18 16 18 17
All-inclusive drinks package 11 7 11 16 16
Cruise themes 5 5 5 7 8
Maiden Voyage 1 1 1 1 2
* Asked to select three principal reasons | Source: UK Cruise Survey 2014 (IRN Research)
18 UK Passengers - Reasons* For Choosing Their Last Cruise
Reasons2011 %
2012 %
2013 %
2014 %
2015 %
Itinerary/Destinations 69 70 71 51 53
Cruised with this line before 64 55 56 39 42
Price/Value for Money n/a n/a n/a 34 31
No flight 21 25 25 19 26
Cruised on this ship before n/a n/a n/a 21 24
Local departure port n/a n/a n/a 16 24
Departure Date 31 38 38 23 23
Special Offer n/a n/a n/a 11 12
Duration 22 24 23 12 11
All inclusive nature of the package n/a n/a n/a 11 10
To try another cruise line 9 17 16 11 6
To try another ship 10 9 10 8 6
Flights from local airport 22 13 12 7 5
Personal Recommendation 9 6 8 4 4
Pre and post land stays n/a n/a n/a 3 3
Travel agent recommendation 4 5 3 2 1
Recommendation on web review/blog 4 2 3 1 0* Asked to select three principal reasons. | Source: UK Cruise Survey 2014 (IRN Research)
17 UK Passengers - Reasons* For Choosing To Take A Cruise Holiday
CRUISE MARKET GOES (SOUTH)WEST
19 Cruise Passengers as % by Region of Residence
Region 2006 2013 2014 2015
UK pop %
South East 14 23 22 24 24
North West 16 13 13 12 11
South West 10 12 12 14 8
Scotland 11 8 9 7 8
Yorkshire & Humberside 8 8 8 9 8
West Midlands 8 8 8 9 7
East Midlands 7 8 8 7 7
East of England 5 9 6 7 9
Wales 5 4 5 5 5
North East 6 5 3 4 4
London 7 4 2 4 3
Northern Ireland 3 1 2 1 3
Source: IRN Research for CLIA UK & Ireland
The UK region showing the most consistent growth in providing cruise passengers has been the South West and, with a further increase to a 14% share, it now has easily the highest penetration rate of any UK region.
Its increased share appears to have come mainly at the expense of Scotland, the North East, Northern Ireland and London (which remains the place with the lowest penetration of all).
However the South East remains the UK’s top source for cruise passengers.
DANUBE IS THE STAR PERFORMER
European Destinations 2011 2012 2013 2014 2015% change2015/14
Rhine/Moselle/tributaries 20.0 26.9 35.5 37.3 38.8 4
Danube 12.9 15.0 17.3 24.4 33.6 38
Rhine/Danube 8.3 4.6 5.1 7.0 7.6 9
Rhone/Seine 10.1 10.2 14.1 14.2 18.5 30
Russian 4.9 5.2 6.4 7.4 5.2 (30)
Italian (Po) 2.9 3.0 3.1 2.9 2.1 (28)
Elbe 2.2 2.4 3.6 2.8 3.4 21
Douro 9.4 9.3 10.7 11.0 11.7 6
Netherlands 6.8 11.0 11.1 9.7 8.1 (16)
Other European 2.8 2.4 3.1 3.7 2.4 (35)
Total European 80.3 90.0 109.9 120.4 131.4 9
Non European Destinations 2011 2012 2013 2014 2015 % change
Nile 25.2 28.3 12.2 8.9 7.0 (21)
Far East/China 5.8 8.2 7.5 7.9 7.4 (6)
Other non-European 2.5 3.3 2.0 2.3 4.6 104
Total non-European 33.5 39.8 21.7 19.0 19.1 0
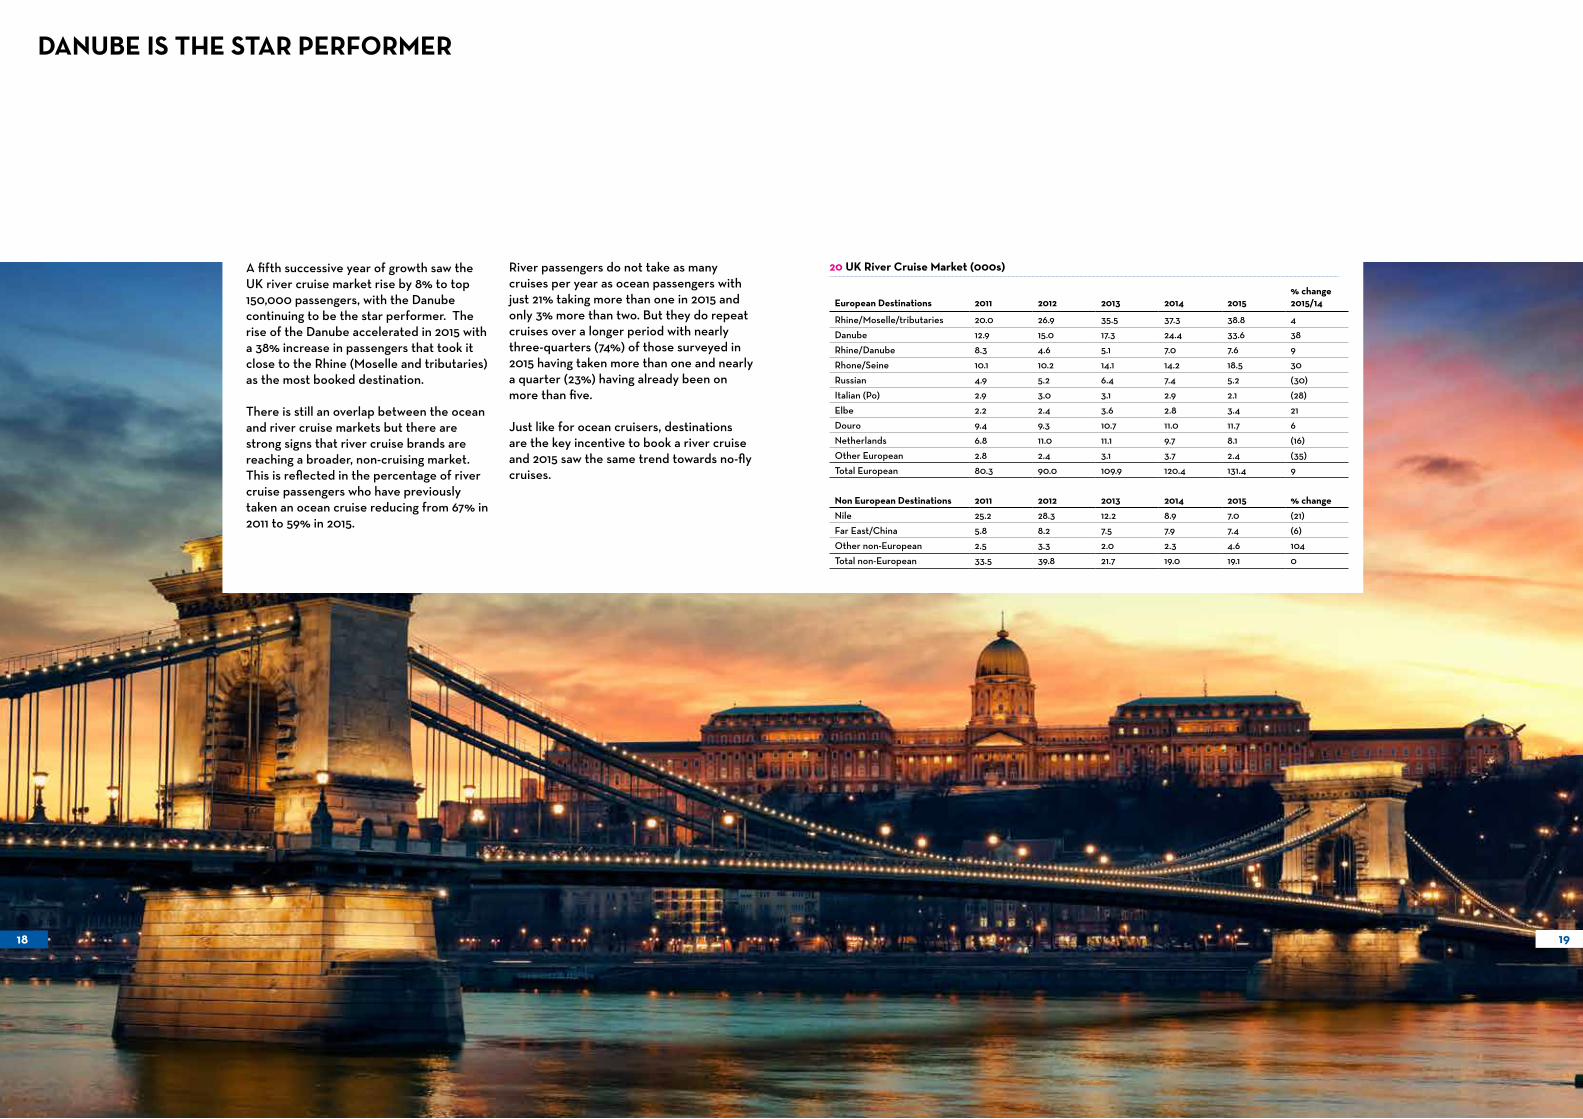
20 UK River Cruise Market (000s)A fifth successive year of growth saw the UK river cruise market rise by 8% to top 150,000 passengers, with the Danube continuing to be the star performer. The rise of the Danube accelerated in 2015 with a 38% increase in passengers that took it close to the Rhine (Moselle and tributaries) as the most booked destination.
There is still an overlap between the ocean and river cruise markets but there are strong signs that river cruise brands are reaching a broader, non-cruising market. This is reflected in the percentage of river cruise passengers who have previously taken an ocean cruise reducing from 67% in 2011 to 59% in 2015.
River passengers do not take as many cruises per year as ocean passengers with just 21% taking more than one in 2015 and only 3% more than two. But they do repeat cruises over a longer period with nearly three-quarters (74%) of those surveyed in 2015 having taken more than one and nearly a quarter (23%) having already been on more than five.
Just like for ocean cruisers, destinations are the key incentive to book a river cruise and 2015 saw the same trend towards no-fly cruises.
18 19
CLIA UK & Irelandwww.cruiseexperts.org
Cruise Lines International Association (CLIA) is the world’s largest cruise industry trade association with representation in North and South America, Europe, Asia and Australasia.
CLIA represents the interests of cruise lines, travel agents, port authorities and destinations, and various industry business partners before regulatory and legislatory policy makers.
GUIDED TOURS & RIVER CRUISES
R I V E R C R U I S E S
European River cruising