the cultural divide - anderson.ucla.edu · heterogeneity changes little. ... to capture cultural...
TRANSCRIPT

The Cultural Divide�
Klaus Desmet
SMU, NBER and CEPR
Romain Wacziarg
UCLA and NBER
June 2018
Abstract
This paper conducts a systematic quantitative study of cultural convergence and divergence
in the United States over time. Using the General Social Survey (1972-2016), we assess whether
cultural values have grown more or less heterogeneous, both overall and between groups. Groups
are de�ned according to 11 identity cleavages such as gender, religion, ethnic origin, family
income quintiles, geographic region, education levels, etc. We �nd some evidence of greater
overall heterogeneity after 1993 when averaging over all available values, yet on many issues
heterogeneity changes little. The level of between-group heterogeneity is extremely small: the
United States is very pluralistic in terms of cultural attitudes and values, but this diversity is
not primarily the result of cultural divides between groups. On average across cleavages and
values, we �nd evidence of falling between-group heterogeneity from 1972 to the late 1990s, and
growing divides thereafter. We interpret these �ndings in light of a model of cultural change
where intergenerational transmission and forces of social in�uence determine the distribution of
cultural traits in society.
�Desmet: Department of Economics, Southern Methodist University, 3300 Dyer, Dallas, TX 75205,
kdesmet@smu:edu; Wacziarg: UCLA Anderson School of Management, 110 Westwood Plaza, Los Angeles CA 90095,
wacziarg@ucla:edu. We thank Omer Ali for outstanding research assistance. We also thank Alberto Alesina, Raquel
Fernández, Paola Giuliano, Ricardo Perez-Truglia, Fabio Schiantarelli, Jesse Shapiro and Francesco Trebbi for useful
comments.

1 Introduction
Many scholars and commentators have argued that the United States faces a growing cultural
divide along lines of race, geography, gender, age, income and other dimensions. These growing
disagreements go hand in hand with a fraying social fabric, growing dysfunction in the political
arena, and the disintegration of social capital. Others have argued that the greater availability
of information and exchange facilitated by travel and exposure to di¤erent cultures have brought
about cultural convergence, so that cultural heterogeneity between groups is becoming smaller as
cultural traits di¤use throughout society.1 Which view is correct?
In this paper we conduct a systematic quantitative study of cultural convergence and divergence
in the United States over time. We assess whether cultural values - or memes - have grown more
or less heterogeneous across groups de�ned according to 11 identity cleavages, among which are
gender, religion, ethnic origin, family income quintiles, geographic region and education levels.2
We use the General Social Survey (GSS), a survey of norms, values and attitudes, spanning 1972
to 2016. We consider a wide range of memes covering religious beliefs and practices, con�dence in
institutions, preferences over public policies, moral values and attitudes, measures of trust and life
satisfaction, and tolerance for alternative viewpoints and lifestyles.
We use two classes of measures of cultural heterogeneity. The �rst captures overall heterogeneity,
describing, for each meme, the likelihood that two randomly chosen individuals surveyed in the
GSS will have a di¤erent cultural trait. The second is a measure of heterogeneity between groups,
capturing the degree of �xation of memetic traits onto group identity. A high degree of �xation
indicates that memes are highly group-speci�c, while a low degree of �xation indicates that the
distribution of memes within each group closely resembles that in society overall. Rising �xation,
in this context, would be associated with a growing cultural divide between groups.
We �nd that the overall degree of cultural heterogeneity in the United States is remarkably
1On the �rst view, prominent enunciations include Putnam (2000) and Murray (2013). Commentary along these
lines among pundits and journalists are too numerous to list. The second view is more closely associated with
modernization theory - see for instance Inglehart (1997) and Ritzer (2011), pointing, respectively, to rising incomes
and globalization as powerful forces for cultural homogenization.
2The term "meme" was coined by Richard Dawkins (1989) to describe a cultural trait, much like a gene is a
genetic trait. A meme can take on several variants, for instance the meme "belief in God" could take on variants
"yes", "no" or "maybe". A person�s culture, in our terminology, is simply that person�s vector of memetic traits.
1

stable when averaging heterogeneity across all available memes. We �nd evidence that average
cultural heterogeneity fell slightly between 1972 and 1993, and rose slightly thereafter. These
average tendencies mask interesting variation across questions. For some questions, such as several
questions on sexual behavior and public policies, there is growing social consensus. For others, such
as questions on gun laws and con�dence in some civic institutions, we �nd growing disagreements.
Some of these dynamics can be understood as transitions from one end of the belief spectrum to the
other. For instance, on the issue of marijuana legalization, attitudes have moved from generalized
disagreement to majority agreement, so heterogeneity rose and is now falling. Overall, we �nd some
evidence of a systematic tendency toward greater heterogeneity after 1993 when averaging over all
available memes, yet on many issues heterogeneity changes little.
Across all identity cleavages, the level of between-group heterogeneity is extremely small: we
con�rm past �ndings that most heterogeneity in cultural traits occurs within, not between, groups
(Desmet, Ortuño-Ortín and Wacziarg, 2017). The United States is an extremely pluralistic country
in terms of cultural attitudes and values, but this diversity is not primarily the result of cultural
divides between groups, however de�ned.
The time path of these cultural divides between groups displays interesting patterns. We �nd
evidence of falling between-group heterogeneity from 1972 to the late 1990s, and growing divides
thereafter, but only for some cleavages and only for some memes. Average heterogeneity has
risen across religious identities since the mid-1990s, and across education levels, income quintiles,
ethnic groups and racial groups since the early 2000s. The same trend is particularly pronounced
across groups de�ned by political party self-identi�cation. The cultural divide across party self-
identi�cation started to gradually increase at the end of the 1990s, and rose sharply in the �rst
half of the 2000s. Of course, this may re�ect the ability of individuals to more easily self-identify
with a party that closely matches their cultural beliefs (sorting) rather than cultural change within
groups prede�ned by party identi�cation.3 In many cases, the most recent levels of between-group
heterogeneity do not surpass levels reached in the early 1970s. We also �nd stable or falling
cultural heterogeneity across di¤erent regions of the United States, across urban categories, across
age groups, and across genders. Some of these �ndings come as a surprise in light of the public
pronouncements concerning growing divides across some of these identity cleavages.
3For instance, the gradual realignment of Southern Democrats with the Republican Party over time may imply
greater �xation of political preferences on party identi�cation.
2

How can we interpret these results in light of the popular commentary on the fraying social and
cultural fabric of the United States? We hypothesize that several forces are at play, and may operate
di¤erently depending on speci�c memes and speci�c identity cleavages. To understand these forces,
one needs to form a picture of how memes change over time. To do so, we propose a model of
cultural change. In our model, three forces explain the distribution of memes across and within
groups and its dynamics: intergenerational transmission, social conformism and the emergence
of cultural innovations. First, an individual�s vector of memes originates, with variation, from
intergenerational transmission. Second, agents tend to conform to the majority memes of their
own group. Third, innovations in values (particularly values initially held by a minority) can occur
and spread through social in�uence. These three forces determine the dynamics of cultural change.
Our model provides simple comparative statics to understand the dynamics of cultural change
in light of characteristics of memes and characteristics of identity cleavages. We use the model as
a lense through which we interpret our empirical results. A crucial distinction is whether social
in�uence occurs mostly within or across identity cleavages. This depends on the manner in which
members of society interact across and within groups. For example, the emergence of technologies
that create "echo chambers" reinforcing within-group conformism and weakening between-group
interactions is important to understand the di¤erential dynamics of the cultural divide across
cleavages. This may help understand why, for instance, the cultural divide across Party ID seems
to go up much more than across other cleavages. This trend is reinforced by the possible sorting
of people with di¤erent memes into speci�c identities (such as party a¢ liations), a possibility that
we explicitly allow for in our model. We also discuss how cultural divides may change di¤erently
across question categories. For instance, the emergence of cultural innovations such as greater
social acceptance for gay marriage or marijuana legalization can lead to greater cultural divides if
adopted at di¤erent rates across identity cleavages.
Our paper is related to a growing literature on the evolution of cultural traits. Our terminology
and overall approach to culture borrow from the literature on cultural evolution (Cavalli-Sforza
and Feldman, 1981, Boyd and Richerson, 1985, Richerson and Boyd, 2004, Henrich, 2015, Bell,
Richerson and McElreath, 2009). Recent work by economists also tries to better understand the
causes and mechanics of cultural change. Salient examples in this tradition include Bisin and Verdier
(2000), Kuran and Sandholm (2008), Olivier, Thoenig and Verdier (2008), Fernández (2014) and
Guiso, Herrera and Morelli (2016). Another literature, originating in political science and sociology,
3

examines cultural change arising from modernization and globalization (Inglehart, 1997, Inglehart
and Baker, 2000, Norris and Inglehart, 2009, Ritzer, 2011). Our work is also linked to wide-ranging
scholarship on cultural change and persistence (Alesina and Giuliano, 2015, Giuliano and Nunn,
2017). A related literature focuses on the features and behavior of immigrants to draw inferences
on the persistence of cultural traits across generations (Giuliano, 2007, Fernández and Fogli, 2006,
Luttmer and Singhal, 2011, Giavazzi, Petrov and Schiantarelli, 2016).
Drawing on the aforementioned literature on the evolution of cultural traits, social scientists
have also studied heterogeneity in cultural traits, which is our main focus here. An important
recent contribution by Alesina, Tabellini and Trebbi (2017) studies cultural heterogeneity in Europe
using two waves of the World Values Survey.4 In contemporaneous work, Bertrand and Kamenica
(2018) apply a machine learning algorithm to a variety of survey data in order to analyze how
well someone�s culture or consumption behavior predicts their gender, race, income, education
and political ideology. Their conclusions are broadly consistent with ours: with the exception of
political ideology, and to a lesser extent income, over the past half century culture and behavior
have not become more predictive of someone�s identity, suggesting that the cultural divide has
not greatly deepened.5 Our work is also related to research on cultural and political polarization
in the United States (DiMaggio, Evans and Bryson, 1996, McCarty, Poole and Rosenthal, 2006,
Fiorina and Abrams, 2008, Gentzkow, Shapiro and Taddy, 2016, Boxell, Gentzkow and Shapiro,
4Like us, Alesina, Tabellini and Trebbi (2017) are interested in characterizing cultural convergence or divergence.
However, their focus is on the evolution of cultural di¤erences between European countries, using heterogeneity
between US states as a point of comparison. Instead, we focus on the US, consider a wide range of eleven identity
cleavages, use a distinct measurement framework and interpret our �ndings through the lense of a model of cultural
evolution.
5Our approach to the cultural divide is di¤erent along a number of dimensions. First, while Bertrand and
Kamenica (2018) consider other sources of data on culture and behavior besides the GSS � including surveys on
consumer behavior and time use patterns �we analyze the cultural divide along a broader set of identity cleavages
(including urbanicity, ethnic origin, region, age, religion and work status). Second, their measurement framework
di¤ers from ours: they use machine learning to quantify the extent to which a person�s identity can be correctly
classi�ed by knowing that person�s culture and behavior. In contrast, we calculate how predictive identity is for
cultural values. Third, we propose a conceptual framework to help us interpret why some divides have deepened and
others have not. Finally, we emphasize that it is di¢ cult to understand the dynamics of the cultural divide between
groups without paying attention to the evolution of overall cultural heterogeneity in society. For instance, when
certain values become more acceptable in society at large, they often di¤use at di¤erent rates in di¤erent groups,
giving rise to a deeper divide.
4

2017). Finally, there is a recent literature on the measurement of cultural heterogeneity at the
individual-level rather than at the group level, using either genetic or memetic data (Ashraf and
Galor 2013, Desmet, Ortuño-Ortín and Wacziarg, 2017), with which the present study shares a
measurement approach.
Our paper is organized as follows. Section 2 discusses our measurement framework and presents
the data. Section 3 discusses the time path of our measures of heterogeneity between 1972 and
2014. Section 4 presents a model of cultural change leading to predictions on the dynamics of
overall and between-group cultural heterogeneity. Section 5 concludes.
2 Data and Measurement of Cultural Heterogeneity
2.1 Measurement Approach
To capture cultural heterogeneity and the cultural divide between identity cleavages, we start from
the measurement framework in Desmet, Ortuño-Ortín and Wacziarg (2017).6 That paper proposed
a simple model of social antagonism to derive three classes of heterogeneity measures: heterogeneity
in identity cleavages, overall heterogeneity in cultural values (memes), and heterogeneity in memes
between identity cleavages. For the purposes of this paper we use the same functional forms to
capture the latter two.
In particular, consider c = 1; :::; C identity cleavages that each consist of groups kc = 1; :::;Kc.
Consider also m = 1; :::;M memes that each can take on values im = 1; :::; Im. For instance, c could
be gender (kc = male, female) and m could be belief in God (im = yes, no). We denote by sim the
share of the total population that holds variant im of meme m, and by skc the share of group kc in
the total population. We denote by simkc the share of group kc (de�ned over cleavage c) that holds
variant im of meme m. For instance, this could be the share of males that believe in God.
Overall heterogeneity is simply memetic fractionalization over the whole population. For meme
m:
CFm = 1�ImXim=1
(sim)2
6That paper applied these measures to studying, in a cross-country context, heterogeneity across ethnic groups.
Instead, here we use them to measure, for a single country across time, cultural heterogeneity between a much broader
range of identity cleavages, not limited to ethnicity.
5
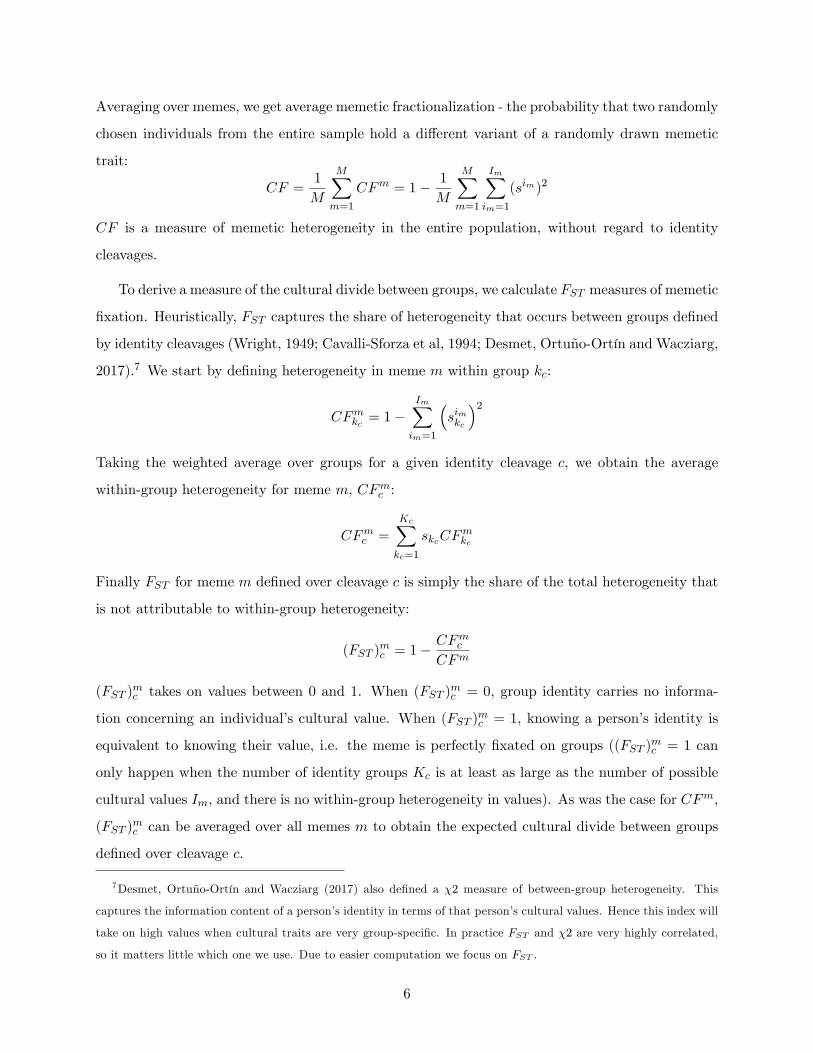
Averaging over memes, we get average memetic fractionalization - the probability that two randomly
chosen individuals from the entire sample hold a di¤erent variant of a randomly drawn memetic
trait:
CF =1
M
MXm=1
CFm = 1� 1
M
MXm=1
ImXim=1
(sim)2
CF is a measure of memetic heterogeneity in the entire population, without regard to identity
cleavages.
To derive a measure of the cultural divide between groups, we calculate FST measures of memetic
�xation. Heuristically, FST captures the share of heterogeneity that occurs between groups de�ned
by identity cleavages (Wright, 1949; Cavalli-Sforza et al, 1994; Desmet, Ortuño-Ortín and Wacziarg,
2017).7 We start by de�ning heterogeneity in meme m within group kc:
CFmkc = 1�ImXim=1
�simkc
�2Taking the weighted average over groups for a given identity cleavage c, we obtain the average
within-group heterogeneity for meme m, CFmc :
CFmc =
KcXkc=1
skcCFmkc
Finally FST for meme m de�ned over cleavage c is simply the share of the total heterogeneity that
is not attributable to within-group heterogeneity:
(FST )mc = 1�
CFmcCFm
(FST )mc takes on values between 0 and 1. When (FST )mc = 0, group identity carries no informa-
tion concerning an individual�s cultural value. When (FST )mc = 1, knowing a person�s identity is
equivalent to knowing their value, i.e. the meme is perfectly �xated on groups ((FST )mc = 1 can
only happen when the number of identity groups Kc is at least as large as the number of possible
cultural values Im, and there is no within-group heterogeneity in values). As was the case for CFm,
(FST )mc can be averaged over all memes m to obtain the expected cultural divide between groups
de�ned over cleavage c.
7Desmet, Ortuño-Ortín and Wacziarg (2017) also de�ned a �2 measure of between-group heterogeneity. This
captures the information content of a person�s identity in terms of that person�s cultural values. Hence this index will
take on high values when cultural traits are very group-speci�c. In practice FST and �2 are very highly correlated,
so it matters little which one we use. Due to easier computation we focus on FST .
6

2.2 Data
We use survey data from the General Social Survey (GSS) from 1972 to 2016, from the 31 waves
that have occurred so far. The universe of all GSS questions across all waves includes 5; 895 �elds,
but many questions were asked only episodically. We require as long a time series as possible over
a common set of questions, to ensure the comparability of the measures of cultural diversity across
time.8 There is a trade-o¤: the higher the frequency over which the measures are computed, the
smaller the set of common questions across successive observations. To achieve balance between
these considerations, we group waves into either two-wave sets or �ve-year sets and keep questions
that were asked at least once in each grouping (Online Appendix, Table A1 displays these group-
ings). This amounts to keeping questions asked at least once every two waves, or at least once in
any �ve-year period. Next, to capture a respondent�s vector of memes, we consider the universe of
questions that refer to values and attitudes. This implies excluding questions that relate to either
other people (spouse, parents, etc.) or to a respondent�s education when he/she was younger; ques-
tions that do not relate to values; and identity or demographic questions. Some factual questions
are retained, to the extent that they carry information on values (for instance, "do you have a gun
in your home?" or "how often do you attend religious services?"), but these instances are rare. In
the end, we are left with 76 memes when requiring questions to be asked every two wave, and 96
memes when requiring questions to be asked at least once in each �ve year interval. These questions
are listed in the Online Appendix, Table A2. We use the 76 questions obtained from the two-wave
groupings as our baseline set, since it provides higher frequency for the heterogeneity measures,
and use the expanded set of questions obtained from the �ve-year groupings for robustness checks
presented in the Online Appendix.
Questions come in di¤erent categories and types. We rely on the question categories provided
8The questions that are asked regularly in the GSS are also more likely to re�ect important, salient societal and
cultural issues - trust, life satisfaction, attitudes toward fundamental civil rights like freedom of speech, etc. On the
other hand, information from questions that enter or exit the survey at a given point in time could also be interesting.
Many of these �eeting questions are asked only episodically, sometimes in special GSS modules devoted, in speci�c
waves, to deeper investigations of topical subjects. But some questions may also enter or exit the survey depending
on the degree of social consensus. Of particular concern is the exit of questions for which a social consensus has
developed, and the entry of questions that are characterized by emerging divides. Entry and exit of questions along
those lines cause opposing biases on CF (it is hard to form priors on the direction of the bias on FST ). We leave a
systematic investigation of these issues for future work.
7

by the GSS to classify questions. Broad categories include civil liberties, current a¤airs, gender and
marriage, politics, religion and spirituality. These are further divided into �ner subcategories. For
instance, gender and marriage includes questions on children and working, on marriage, and on sex
and sexual orientation. Questions are either binary or answered on a scale. In our baseline set of
76 questions, 26 are binary (yes/no, agree/disagree) and 50 admit answers that can be ordered on
a scale. In 35 cases, the scale admits 3 answers, and in the remainder, 4 or more possible answers.
We consider 11 identity cleavages to compute the FST indices. These cleavages are character-
istics of the respondents also observed in the GSS survey waves. They are labeled age, education,
ethnicity, family income, gender, party ID, race, region, religion, urbanicity and work status. These
cleavages admit anywhere from two values (gender) to nine values (region, ethnicity), with the
modal number of categories equal to �ve. Table A3 in the Online Appendix displays the cleavages
and corresponding categories.
3 The Evolution of Cultural Divides in the United States
3.1 The Dynamics of CF and FST
We begin by discussing the evolution of overall heterogeneity. Figure 1 displays the time path of
CF , averaged over all 76 questions available, and the �rst columns of Table 1 shows the underlying
numbers. We �nd that average CF varies between 0:482 (in 1993) and 0:500 (1976). There is a
U-shaped pattern over the sample period: overall heterogeneity declined between the early 1970s
and the mid-1990s and grew back to its initial level by the end of the period.9 This average over
all questions masks some underlying heterogeneity. Panel A of Table 2 breaks down the dynamics
by question. We �nd that 14:5% of the questions display a signi�cant U-shaped pattern (with the
minimum reached some time between 1980 and 2005). Heterogeneity is declining for 29% of the
questions and increasing for 25% of them. The rest is either hump-shaped or �at. This �nding of
a substantial degree of heterogeneity in the dynamics of cultural diversity across questions will be
9The overall variation can re�ect a substantial change in the underlying shares of respondents giving a speci�c
answer to a question. For instance, consider a binary question. With a CF of 0:5, response shares would be equally
divided between both possible answers. Then a change in CF to 0:482 represents a shift in answer shares of 9:5%
(shares of 40:5% to 59:5% for each possible answer). More generally, given the speci�c distribution of the number of
possible answers among our baseline set of 76 questions, the theoretical maximal average level of CF is 0:63. The
United States appears to be be quite culturally diverse overall, but there is room for that diversity to grow.
8

echoed when discussing �xation measures, highlighting the fact that generalizations about cultural
diversity are hard to draw.
Table 3 characterizes the dynamics of CF by question category and subcategory. Overall there
is a lot of variation in the dynamics of CF across question categories. We tend to �nd U-shaped or
increasing paths for questions on crime, economic well-being and life satisfaction, and decreasing
heterogeneity on questions regarding free speech.
Figure 2 turns to cultural �xation by identity cleavage. For each of the 11 cleavages, it displays
the time path of FST , averaged over all questions (the underlying data is in Table 1). Figure 2
reveals an interesting ranking of cleavages by level of �xation, some of them surprising in light of
public commentary on the cultural divide. The biggest cultural divides are between groups de�ned
by educational attainment, family income quintiles and religion. The smallest divides are between
genders, races and urbanicity. But across all cleavages, the absolute level of �xation is very low, on
the order of 1 � 3%. The high level of cultural pluralism in the US, then, is not primarily due to
diversity between identity cleavages, but mostly due to diversity within identity categories.
These levels of cultural �xation change substantially through time. On average, one can discern
an overall U-shaped pattern, whereby cultural divides decreased between 1972 and the late 1990s,
and rose thereafter.10 Yet this masks very di¤erent patterns across cleavages. These are easiest to
see in Figure 3, which plots the dynamics of average FST cleavage by cleavage. For instance average
FST for Party ID is relatively �at through the mid-1990s, starts to gradually increase in the late
1990s, and then accelerates in the 2000s, reaching its maximum in 2016. Of course, it is possible
that people with given Party IDs have grown culturally more distinct, or that people with distinct
beliefs have sorted more e¤ectively into di¤erent party IDs. A similar pattern is found for religion,
and to a weaker extent for ethnicity. Other cleavages display �atter or mild U-shaped patterns:
family income, education and race. Finally, some cleavages show declining levels of cultural �xation,
though the decline typically �attens at the end of the sample: age, urbanicity, region, and work
status. Average FST for gender is mildly hump-shaped around a very low level. The latter patterns
are once again surprising in light of many commentators� priors on rising divides across urban
categories, genders, regions of the US and employment status.
Table 2, Panel B classi�es the types of dynamics of FST across questions for each cleavage. The
10A simple average of cultural �xation across the 11 identity cleavages reaches a minimum in 1997, and starts to
increase in 2001.
9

�rst observation is that, across all 11 cleavages, about 50% of the questions display no clear direction
over time: the dynamics are �at. For the remaining questions that do display signi�cant patterns,
we largely con�rm the dynamics of average FST displayed in Figure 3. For instance, for 48:7% of the
questions, FST based on Party ID displays a signi�cant U-shaped pattern over the sample period,
with an additional 6:6% of the questions displaying a strictly increasing trend. Similarly for religion,
FST is U-shaped for 34:2% of the questions, and increasing for 5:3% of them. Positive trends are
weaker for race and ethnicity, with a combined share of U-shaped and increasing patterns equal
to 36:8% and 32:9%, respectively. For region, urbanicity and age, we see high shares of declining
FST indices (respectively 34:2%, 27:6% and 31:6%). Finally for gender, we see a combined share of
hump-shaped and declining FST dynamics equal to 29:0%.
Table 4 classi�es the types of dynamics within question categories and sub-categories, for all 11
cleavages. We rely on the nomenclature of questions provided by the GSS. This gives �ve broad
categories (civil liberties, current a¤airs, gender & marriage, politics, and religion & spirituality)
that are further divided into sub-categories. For instance, for civil liberties there are 23 questions,
and 11 cleavages: when we state that 19:76% of the dynamics are U-shaped we mean that 50
out of 11 � 23 series have U-shaped dynamics. We �nd again that a generally large share of the
questions display �at dynamics of FST . But interesting patterns emerge nonetheless. For instance,
for free speech, a large percentage of the question-cleavage categories (52:5%) display signi�cantly
decreasing levels of FST . These same questions, incidentally, tend to display a decreasing CF ,
indicating that between-group diversity is decreasing faster than overall diversity. Another notable
category is the set of questions on crime, where we �nd on the contrary that �xation is either
U-shaped or increasing in about 42:7% of the cases. A similar pattern is found for questions on
sex and sexual orientation, with a combined share of U-shaped and increasing FST indices equal to
49:1%.
Table 5 carries out a regression analysis of variation in the level of FST . We pooled all of
the FST measures across cleavages, questions and periods (with 76 questions, 16 periods and 11
cleavages, this gives us 13; 376 observations). Each panel reports results on each of three sets of
regressors: cleavage type, question category or subcategory, and time period (these are all entered
simultaneously). We largely con�rm previous observations. Looking at Panel A, we replicate the
ordering of FST magnitudes across cleavages. The average level of FST is elevated for age, education,
family income and religion, and is low for race, urbanicity and gender (the latter is the smallest,
10

and hence is the excluded category). In sum, the ranking of FST magnitudes across cleavages
is consistent with that displayed in Figure 2. Panel B analyzes the level of �xation by question
category (column 1) and subcategory (column 2), �nding that across all cleavages, FST tends to be
high for free speech questions, sex and sexual orientation, and religious a¢ liation and behaviors.
FST tends to be low for national spending, children and working, and con�dence and power (the
cultural divide on questions on marriage is the smallest of all, which is why it is our excluded
category). Finally Panel C looks at time e¤ects by including a dummy for each of the 16 periods
(excluding the one that starts in 1972, which is the excluded category). We �nd a U-shaped pattern
reminiscent of the general pattern displayed in Figure 2: cultural �xation across all questions and
cleavages tends to fall until the late 1990s, and to rise in the 2000s (the minimum is reached for
the 1996-1998 wave grouping). Of course these average level di¤erences mask a lot heterogeneity
in time and across cleavages, already discussed previously.
3.2 Alternative Approach Based on Regressions
As an alternative approach to assessing the dynamics of the cultural divide, we use a regression
approach. For each meme m at time t, we run a regression of the following form:
y = �+
11Xc=1
Kc�1Xkc=1
�kcDkc + "
where y is the response of an individual to meme m at time t , � is a constant, Dkc is a dummy
variable taking on a value of 1 if the individual is in cleavage category kc, and " is an error term.
With 16 time periods and 76 memes, this means we are running 1; 216 regressions. We record the
total R2 from each of these regressions, a measure of the informativeness of all identity cleavages
together, in terms of cultural memes. We then calculate the partial R2 due to each set of cleavage
dummies. To do so, we rerun the above regressions excluding the set of dummies for the cleavage
of interest (this is an additional 1; 216 regressions for each of 11 cleavages). We refer to the R2
from these regressions as the restricted R2. For each meme i at time t, we then take the di¤erence
between the total R2 and the restricted R2, giving us the partial R2 for the corresponding cleavage.
For each time t, we then average the total and the partial R2 over all memes.
This approach is related to measuring �xation using FST . The greater the explanatory power
of an identity cleavage for cultural values, the higher the corresponding partial R2 in the above
regression. Similarly, the FST for that cleavage will tend to be relatively high.11 One advantage of
11Desmet, Ortuño-Ortín and Wacziarg (2017) explicitly relate FST to measures of informativeness such as �2,
11

the R2 approach is that all identity cleavages are entered jointly, so we are controlling for the e¤ect
of other cleavages when assessing the explanatory power of a particular cleavage.
The results are presented in Table 6 and displayed graphically in Figures 4 and 5. The overall
R2, i.e. the joint explanatory power of all cleavages, displays a U-shaped pattern and is minimized
for the 1996-1998 wave grouping (Figure 4). The level of the R2 itself is modest, going from 15:5%
in 1972-1973 to 11:4% in 1996-1998 and back to 15:1% in 2016. The ability of cleavages overall
to explain answers to these 76 GSS questions therefore has increased starting in the early 2000s,
indicating growing cultural divides in the last decade and a half.
However, this average pattern masks interesting di¤erences cleavage by cleavage. These di¤er-
ences largely replicate those found for FST , con�rming that the average partial R2 re�ects a similar
concept of informativeness of cleavages for memes as does FST . In terms of the average levels of
partial R2 and FST , there is a clear correspondence, with high values of both indicators for age,
education, family income, party ID, region and religion (compare the last rows of Tables 1 and
Table 6). These similarities in terms of average levels extend to the time path of the indicators
cleavage by cleavage. This is most easily seen by comparing Figure 5 and Figure 3: the dynamics of
partial R2 are broadly similar to those of FST , cleavage by cleavage. Overall, partial R2 values for
Party ID are relatively �at until the early 2000s, after which they increase rapidly, almost doubling
in the span of 15 years. We uncover a similar pattern for religion, with an acceleration starting
slightly earlier, in the second half of the 1990s. We �nd a hump-shaped partial R2 for gender, and
falling partial R2 for urbanicity and region, as we did when capturing �xation with FST .
4 A Model of Cultural Change
In this section, we propose a model of cultural change. The model builds upon ideas from the cul-
tural evolution literature in both anthropology and, more recently, economics. Among the earliest
contributions to model culture in an explicitly evolutionary context are Boyd and Richerson (1985)
and Richerson and Boyd (2004, 2005). These authors proposed a range of evolutionary mechanisms
explaining the dynamic paths of cultural traits where cultural traits evolve through mutation and
selection, much like genes but at very di¤erent rates, partly because, unlike genes, cultural traits
showing that they are very highly correlated. �2 explicitly captures the informational content of a cleavage in
terms of memes (Cover and Thomas, 2006). Similarly, in our context the partial R2 also captures the degree of
informativeness of speci�c identity cleavages for responses on cultural values.
12

can be transmitted horizontally.12 Bisin and Verdier (2000) study the intergenerational transmis-
sion of norms in an explicitly economic model where parents rationally choose which traits to pass
on to their children, to derive the degree of cultural heterogeneity of a stationary population.13
Bernheim (1994) models conformism, assuming that it arises from social in�uence: social status
enters the utility function, so there is a penalty for not conforming. Such conformism can lead to
persistent customs as well as temporary fads. Bikhchandani, Hirshleifer and Welch (1992) contains
a theory of fads and culture whereby certain values can originate from small shocks to preferences
and spread through local conformism, leading to informational cascades and cultural change. Ku-
ran and Sandholm (2008) compare the dynamics of cultural evolution in isolated and integrated
societies, by analyzing the role of intergroup versus intragroup socialization and coordination. The
goal is to understand the conditions under which cultural integration occurs, and circumstances
under which societies can retain their original cultures. We build on all these contributions, but
emphasize the role of cultural diversity between and within identity groups, since our purpose is to
study how and why the resulting cultural divide changes over time.
The aim of our conceptual framework is two-fold. First, we seek to understand the drivers
of di¤erent dynamic patterns of CF and FST . The speci�c sources of cultural change that we
model include intergenerational transmission, conformism, and cultural innovations. Some of these
sources of cultural change may lead to cultural convergence between groups, whereas others may
lead to cultural divergence, or more complex non-monotonic dynamics. Second, our model provides
us with a lens through which to interpret our empirical �ndings. Depending on characteristics of
memes, of identity cleavages, and of the extent of cross-group versus within-group cultural di¤usion,
our model predicts di¤erent dynamic patterns for CF and FST . We then discuss these predictions
and their origins in light of the speci�c empirical patterns identi�ed in Section 3.
4.1 Setup
Consider a society with one identity cleavage (e.g., gender) and one cultural meme (e.g., belief
in God). The identity cleavage has two identity traits k and �k (e.g., male or female) and the
cultural meme can take two values i and �i. Time is discrete, t = 1; 2; ::: . Identity groups are
12Genes and cultural traits can also coevolve. Henrich (2015) contains further explorations in a similar vein.
13Doepke and Zilibotti (2008) also explicitly model parents� choices of values to impart to their children as a
function of economic incentives. Lazear (1999) models an individual�s choice to learn languages, gain familiarity with
other cultures, and assimilate culturally, again as a function of economic incentives to trade.
13
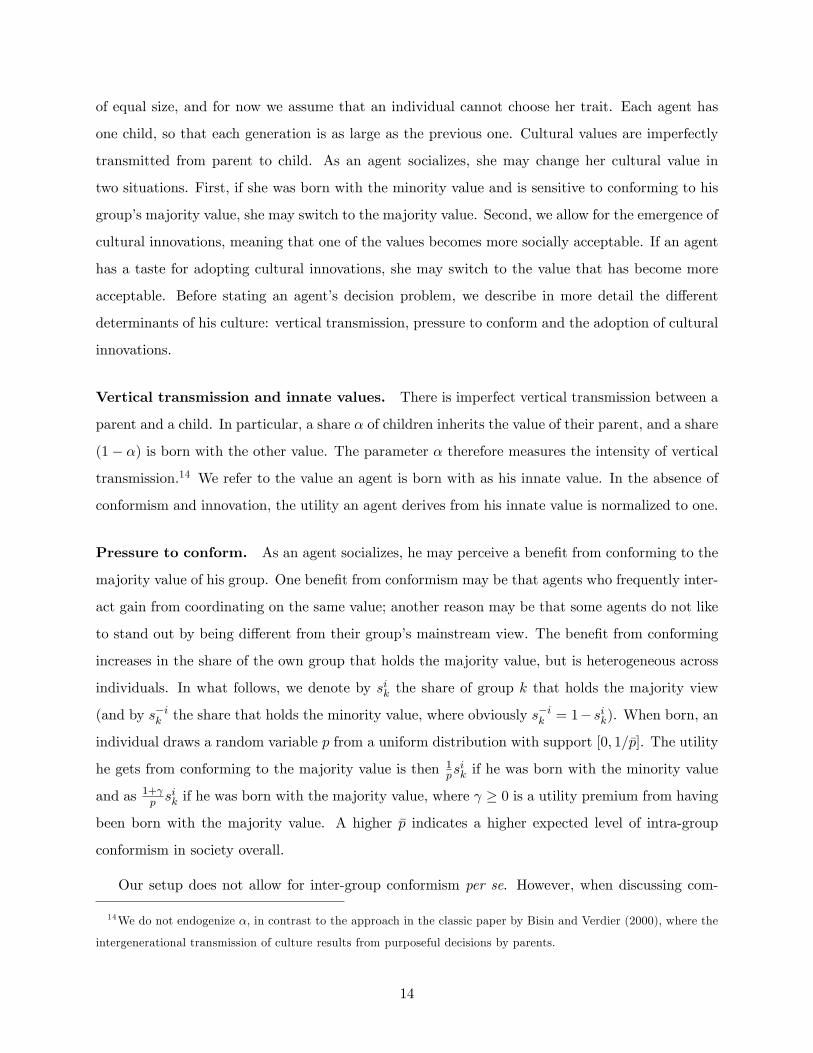
of equal size, and for now we assume that an individual cannot choose her trait. Each agent has
one child, so that each generation is as large as the previous one. Cultural values are imperfectly
transmitted from parent to child. As an agent socializes, she may change her cultural value in
two situations. First, if she was born with the minority value and is sensitive to conforming to his
group�s majority value, she may switch to the majority value. Second, we allow for the emergence of
cultural innovations, meaning that one of the values becomes more socially acceptable. If an agent
has a taste for adopting cultural innovations, she may switch to the value that has become more
acceptable. Before stating an agent�s decision problem, we describe in more detail the di¤erent
determinants of his culture: vertical transmission, pressure to conform and the adoption of cultural
innovations.
Vertical transmission and innate values. There is imperfect vertical transmission between a
parent and a child. In particular, a share � of children inherits the value of their parent, and a share
(1� �) is born with the other value. The parameter � therefore measures the intensity of vertical
transmission.14 We refer to the value an agent is born with as his innate value. In the absence of
conformism and innovation, the utility an agent derives from his innate value is normalized to one.
Pressure to conform. As an agent socializes, he may perceive a bene�t from conforming to the
majority value of his group. One bene�t from conformism may be that agents who frequently inter-
act gain from coordinating on the same value; another reason may be that some agents do not like
to stand out by being di¤erent from their group�s mainstream view. The bene�t from conforming
increases in the share of the own group that holds the majority value, but is heterogeneous across
individuals. In what follows, we denote by sik the share of group k that holds the majority view
(and by s�ik the share that holds the minority value, where obviously s�ik = 1� sik). When born, an
individual draws a random variable p from a uniform distribution with support [0; 1=�p]. The utility
he gets from conforming to the majority value is then 1psik if he was born with the minority value
and as 1+ p sik if he was born with the majority value, where � 0 is a utility premium from having
been born with the majority value. A higher �p indicates a higher expected level of intra-group
conformism in society overall.
Our setup does not allow for inter-group conformism per se. However, when discussing com-
14We do not endogenize �, in contrast to the approach in the classic paper by Bisin and Verdier (2000), where the
intergenerational transmission of culture results from purposeful decisions by parents.
14

parative statics on �p , we will argue that a weakening of within-group conformism (a lower �p ) can
be interpreted as a stengthening of between-group conformism.
The di¤usion of cultural innovations. We de�ne a cultural innovation as an existing value that
becomes socially more acceptable or fashionable. A cultural innovation is simply a label attached to
a given value that makes that value more attractive to hold. Some agents may �nd it attractive to
adopt this value, and switch from the non-innovating to the innovating value. Suppose that j is the
innovating value. For an agent of group k, the bene�t of holding the innovating value is increasing
in the share of agents of group k that hold this value, but is heterogeneous across agents. When a
cultural innovation occurs, each agent draws a random variable r from a uniform distribution with
support [0; 1=�rk]. This determines an agent�s utility from imitating the innovating value, 1rsjk. A
higher �rk indicates a higher expected level of sensitivity to imitating cultural innovations, i.e. a
higher sensitivity to fads, fashions or social trends.
Cultural innovations di¤use within groups, but may evolve di¤erently in the two groups if �rk
and �r�k are very di¤erent from each other. We discuss below situations under which �rk and �r�k
may be more or less similar to each other.
4.2 Decision problem
We now analyze an agent�s value choice at a given time t. Denote by i the value held by the
majority of the agent�s group and by j the value experiencing an innovation, where j could be
equal or di¤erent from i. An agent born with value x in group k, after drawing variables p and r,
decides which value x0 to adopt by maximizing the following discrete choice problem:
u(x; k) = maxx02fj;i;xg
�I(x); I(i)
1 + I(x)
psik; I(j)
1
rsjk
�(1)
where
I(x) =
8><>:1 if x0 = x
0 otherwise
I(i) =
8><>:1 if x0 = i
0 otherwise
I(j) =
8><>:1 if x0 = j
0 otherwise
15

To give an example, consider someone born with the majority value in a society where there is
a cultural innovation to the minority value. If she holds on to her majority value, she will get a
utility equal to maxn1+ p s
ik; 1o, whereas if she switches to the innovating value she will get utility
1rsjk.
Laws of motion. Since individuals do not always keep the value they are born with, we denote
by zik(t) the share of people of group k born in period t with innate value i and by sik(t) the share
of people of group k with value i after solving the discrete choice problem. Our assumption on the
imperfect vertical transmission of values between a parent and a child implies that
zik(t+ 1) = �sik(t) + (1� �)(1� sik(t)) = (2�� 1)sik(t) + (1� �) (2)
Of course if � = 1, vertical transmission is perfect so that zik(t+ 1) = sik(t).
To derive the laws of motion that determine cultural evolution, we solve the discrete choice
problem (1), assuming that the random draws of p and r are independent. We start by analyzing
the case where the innovation occurs to the minority value �i. Depending on their draws of p
and r, agents of group k born with value �i may want to switch to value i. Similarly, agents
of group k born with value i may prefer value �i. In Theoretical Appendix A, we show that
the ex ante probability that an individual of group k born in period t + 1 with value �i prefers
value i is �psik(t + 1) � 12 �p�rks
ik(t + 1)(1 � sik(t + 1)). Because of the law of large numbers, this
is the same as the share of agents of group k born with value �i that switch to value i. As for
individuals of group k born in period t + 1 with value i, the share that prefers to switch to value
�i is �rk(1� sik(t+ 1))� 12 �p�rk(1 + )s
ik(t+ 1)(1� sik(t+ 1)). These results yield the following law
of motion for the share of the population holding value i when the innovation occurs to value �i:
sik(t+ 1) = zik(t+ 1) + �psik(t+ 1)(1� zik(t+ 1))� �rk(1� sik(t+ 1))zik(t+ 1)
+1
2�rk �ps
ik(t+ 1)(1� sik(t+ 1))((1 + )zik(t+ 1)� (1� zik(t+ 1))) if j = �i (3)
Next we turn to the case where the innovation occurs to the majority value i. The share of
individuals of group k born in period t + 1 with value �i who prefer to switch to value i can be
shown to be �pski (t + 1) + �rkski (t + 1) � �rk �p(ski (t + 1))2. The law of motion for the share of people
holding value i when the innovation occurs to value i then becomes:
sik(t+ 1) = zik(t+ 1) + �psik(t+ 1)(1� zik(t+ 1)) + �rksik(t+ 1)(1� zik(t+ 1))
��rk �p(sik(t+ 1))2(1� zik(t+ 1)) if j = i (4)
16

The above two laws of motion are di¤erence equations that describe the evolution of the majority
value. Of course, the two laws of motion of the minority value are the complements of the laws of
motion of the majority value. The laws of motion of the other group �k can be written down by
analogy. Theoretical Appendix A gives further details. Note that if no one is sensitive to cultural
innovations (i.e. �rk = 0), or if there is no conformism (�p = 0), then these di¤erence equations
simplify considerably and become linear.
Choice of identity trait. Until now we have assumed that agents cannot choose their identity
trait. Of course, for some identity cleavages (e.g., party ID) an individual can freely choose identity
trait k or �k. In that case, at a given time t, the discrete choice problem of an agent born with
value x becomes
u(x) = maxfu(x; k); u(x;�k)g (5)
where u(x; k) and u(x;�k) are the outcomes of maximization problem (1) for an agent who, re-
spectively, chooses identity trait k and �k. We postpone the discussion of the laws of motion under
this scenario until Proposition 3.
4.3 Patterns of Cultural Evolution
In this section, we analyze di¤erent patterns of cultural evolution generated by our model. In doing
so, we focus on the cases that are most relevant to our empirical analysis.
Conformism. We start by exploring a society with no di¤usion of cultural innovation and with
no choice of identity traits. We are interested in understanding how the steady-state value shares,
and hence CF and FST , depend on the intensity of vertical transmission and the intensity of
conformism. As we will now see, the results depend crucially on whether the majority value is the
same across groups or not.
Proposition 1: Conformism. Consider a society with no di¤usion of cultural innovations (i.e.
�rk = 0). Then, in steady state:
1. The majority share in each group is weakly increasing in the strength of vertical transmission
(�) and conformism ( �p);
2. If the majority value is the same in both groups, FST is zero and CF is weakly decreasing in
the strength of vertical transmission and conformism;
17

3. If the majority value is di¤erent in both groups, FST is weakly increasing in the strength of
vertical transmission and conformism, and CF is maximized (and equal to 0:5).
Proof. See Theoretical Appendix B.
This proposition is intuitive. The steady-state share of the majority value is increasing in
the pressure to conform (�p) and in the strength of the intergenerational vertical transmission of
values (�). With stronger pressure to conform, individuals have a greater incentive to switch to
the majority value. As a result, the steady-state majority share becomes larger. With stronger
intergenerational transmission of values, the constraint on how high the majority share can become
is weakened. Taken together, there is less intra-group heterogeneity when �p is larger and/or � is
larger.
By increasing the steady-state share of the majority value, larger values for �p and � reduce
within-group cultural fractionalization. If both groups conform to the same majority value, this
also reduces overall cultural fractionalization. Since, in that case, there are no di¤erences between
groups, FST is zero in steady state. If the two groups conform to di¤erent majority values, then a
higher � and/or a higher �p leave the society�s overall cultural fractionalization unchanged, because
the two groups are assumed to be of equal size. In this case, the cleavage between groups deepens,
thus increasing FST .
How can we extend this discussion to a consideration of between-group conformism? Individuals
from one group may be sensitive to the majority value of the other group. Of course, the importance
of this force would depend on the importance of interactions between groups. For example, if the
intensity of interactions between groups declines, individuals become less sensitive to the majority
view of the other group. If the majority values di¤er across groups, then in our interpretation
becoming less sensitive to the other group is akin to becoming more sensitive to one�s own group.
This translates into an increase in �p, and hence a higher FST . If, on the other hand, the majority
value is the same across groups, then allowing for inter-group conformism does not a¤ect the
steady-state cultural divide, since FST remains zero.
Proposition 1 has a simple corollary which states that if an exogenous shock switches the
majority value of one of the groups, the cultural divide between groups will increase.
Corollary 1: Switching of Majority Values. Consider a society with no di¤usion of cultural
innovations. Starting o¤ in a steady state where both groups conform to the same majority value,
18

assume the value of the majority switches in one of the two groups. In that case, society converges
to a new steady state with higher FST and higher CF .
This result is immediate. If initially both groups have the same majority value, their steady-
state value shares are identical, so that FST is zero. Consider a shock that turns the majority value
of one of the groups into the minority value. Irrespective of the magnitude of this initial shock,
the steady-state value shares of that group will switch. For instance, if the two values had shares
of 0:2� 0:8 in both groups, these now switch to 0:8� 0:2 in one of the two groups. As a result,
the steady-state aggregate value shares are 1=2, so CF is maximized. Given that both groups now
conform to di¤erent majority values, there is a growing divide between groups, so FST increases.
This result can be applied to a situation where shifting circumstances disrupt the existing consensus
enough to make the majority view change in one of the groups.
Cultural innovations. We now turn to analyzing the di¤usion of cultural innovations, while
still assuming that individuals cannot choose their identity trait. We focus on a situation in which
both groups start o¤ holding the same majority value and where the innovation a¤ects the minority
value.15
Proposition 2: Di¤usion of Cultural Innovations. Starting from a situation in which both
groups have the same majority value and the same majority share, suppose an innovation occurs to
the minority value.
1. If conformism is su¢ ciently weak and di¤usion is su¢ ciently strong, the majority value
switches in both groups. During the transition, CF exhibits a hump-shaped path.
2. If conformism is su¢ ciently strong and di¤usion is su¢ ciently weak, the majority value stays
the same in both groups. During the transition, CF increases.
Proof. See Theoretical Appendix B.
Once again, this proposition is intuitive. If di¤usion is strong, and hence �rk and �r�k are high,
individuals have a strong propensity to adopt innovations. Fads di¤use easily, and eventually take
15 In practice, for many memes, the majority value is the same across groups, so focusing on the case where both
groups have the same majority value is reasonable. Theoretical Appendix B analyzes what happens if initially both
groups hold di¤erent majority values. As for the cultural innovation, the more interesting case is when it occurs to
the minority value. If, instead, it occurs to the majority value, then it simply reinforces the share of people holding
the majority view.
19
over, becoming the new majority norm. As the original consensus breaks down, there is initially
growing disagreement between individuals. However, as the old majority norm is replaced by a new
majority norm, agreement between individuals once again increases. This translates into a hump-
shaped transition path for cultural fractionalization. If cultural di¤usion is weak in both groups,
the cultural innovation increases CF . In both cases, if the strength of di¤usion of a particular
cultural innovation di¤ers across groups, this will lead to a growing divide across groups since the
steady state shares of each value will be di¤erent across groups, and FST will rise.
How can this proposition inform our understanding of inter-group cultural di¤usion? In our
model, the innovation a¤ects the same value in both groups. However, the adoption pattern may
be di¤erent in the two groups, to the extent that �rk and �r�k are di¤erent. For instance, if �rk is
low and �r�k is high, then group k will be much less sensitive to the innovation than group �k.
If interactions between groups are frequent and intense, the sensitivity to cultural innovations in
the two groups is likely to be more similar.16 Hence we can interpret di¤erences between �rk and
�r�k as having e¤ects on cultural diversity akin to those of interactions between groups. If �rk and
�r�k are the same, cultural innovations are adopted to the same degree in both groups, leaving FST
unchanged. Correspondingly, if the intensity of intra-group di¤usion is di¤erent across groups, a
cultural innovation will lead to a growing divide between groups. These insights are summarized
in the following corollary.
Corollary 2: Di¤erences in Intra-group Di¤usion. Starting o¤ in a steady state where �rk
and �r�k are di¤erent, if this di¤erence becomes smaller, then FST falls.
Choice of identity trait. We now let individuals choose their identity trait. Consider an indi-
vidual born with the minority value in her identity group. In addition to holding on to the minority
value in her group or adopting the majority value of her group, she now has one more option: she
can also switch identity groups. This may be an attractive option if she is a conformist and her
value is held by the majority in the other identity group. The following proposition summarizes
this insight.
Proposition 3: Choice of Identity Trait. In a society with no di¤usion of cultural innovations
where the majority value of one group is the minority value of the other, then as long as the majority
16By interactions we mean communication, contact and cooperative exchange between groups, not unlike the
meaning of "contact" in Intergroup Contact Theory in social psychology (Allport, 1954).
20
shares are smaller than one,
1. FST is larger if individuals can choose their identity trait than if individuals cannot choose
their identity trait;
2. The greater the degree of conformism, the larger the di¤erence in FST between a situation
where individuals can choose their identity trait and one where they cannot.
Proof. See Theoretical Appendix B.
This proposition says that the cultural divide between groups increases if individuals can freely
choose their identity trait. Moreover, the increase in the cultural divide is larger if within-group
conformism is stronger. The intuition for these two results is straightforward. Take an individual
who holds the minority value in the group she is born into. If it is costless to switch groups, then
she would rather change to the group where her innate value is held by the majority, as opposed
to changing her value. That is, if changing identity trait is free, then it is better to change identity
trait than to change value. This leads to sorting of values along identity traits, and hence to a
rising cultural divide between groups. The average payo¤ from sorting into the identity trait where
one�s innate value is held by the majority is especially high if within-group conformism is strong.
Hence, the incentive to sort on the majority value is greater in societies where people care a lot
about conforming to the group.
4.4 Interpretation of Empirical Findings
We now use our conceptual framework to interpret our empirical �ndings. In doing so, we are not
providing a test of our conceptual framework. Rather, we are using the model as a lens through
which to interpret the patterns observed in the data. We start by looking at how the dynamics of
FST depend on the type of identity cleavage, and we then turn to analyzing the dynamics of both
CF and FST for di¤erent question categories.
4.4.1 Cultural Evolution across Cleavages
Our empirical analysis documents that on average FST displayed a U-shaped pattern between
1972 and 2016, declining from the early 1970s until the late 1990s, and increasing since the early
2000s. Underlying this average pattern there is substantial heterogeneity across identity cleavages.
Starting in the late 1990s and accelerating in the mid-2000s, we see important increases in FST for
21

Party ID and for religion, and to a weaker extent for ethnicity. Other cleavages display a �atter
or mildly increasing pattern for FST since the late 1990s. These include family income, education
and race. Some cleavages exhibit no signi�cant change in FST in the later period: age, gender,
urbanicity, region and work status.
Here, we seek to explain these di¤erences in the dynamics of FST across cleavages. How do
model parameters relate to the evolution of the cultural divide? In the context of our conceptual
framework, the main parameters of interest are the level of �p and the di¤erence between �rk and
�r�k. An increase in �p can be interpreted as either a strengthening of intra-group conformism or a
weakening of inter-group conformism. According to Proposition 1, this would lead to an increase
in FST . The intuition is as follows: in a society where the majority values di¤er across groups, an
increase in �p implies a stronger tendency to conforming towards the own-group norm, and hence
a weaker sensitivity towards the views of the other group. In the case where the majority value
is the same in both group, an increase in �p has no e¤ect on FST . Therefore, on average a higher
�p implies a deepening divide, and greater �xation of values on identity traits. An increase in the
di¤erence between �rk and �r�k can be interpreted as a weakening of the inter-group di¤usion of
cultural innovations. According to Corollary 2, this would also lead to an increase in FST . The
intuition is, once again, easy to understand. If there is less inter-group di¤usion of innovations,
then the adoption of innovations is more likely to occur with di¤erent intensities across groups,
leading to a deepening divide.
Within-group and between-group interactions. The environment in which individuals in-
teract with each other a¤ects the level of �p and the di¤erence between �rk and �r�k, i.e. whether
social in�uence occurs mostly within groups or also between groups. In this context, the rise of
new forms of communication in the late 1990s and early 2000s may have led to di¤erential changes
in our model�s main parameters depending upon the speci�c cleavage under consideration.
We start by discussing under which conditions these new technologies might have facilitated the
creation of echo chambers that favor within-group interactions relative to between-group interac-
tions. For modern technologies to have such echo chamber e¤ects, one of two conditions must hold.
They must allow individuals with a certain identity trait who previously lacked contact with others
with the same identity to deepen their interaction, or they must allow individuals with di¤erent
identity traits who previously had frequent contact to isolate themselves with people of their own
identity. These conditions do not apply to all identity cleavages. For example, in the case of the
22
urban-rural identity cleavage, individuals in urban areas already mainly interacted with other indi-
viduals in urban areas before the advent of the modern technologies such as the internet. The same
is true for group identity based on the region where individuals reside. For both the rural-urban
identity cleavage and the regional identity cleavage, modern communication technologies would
therefore not have much scope to enhance group-speci�c echo chambers, simply because groups
de�ned by these cleavages were already living in echo chambers to start with.
Another example of an identity cleavage where we would not expect new technologies to have
an important impact is the gender cleavage. Individuals of a particular gender do not live isolated
from others of the same gender. For example, women do not need the internet to have frequent
interaction with other women. In that sense, the gender cleavage is similar to the urban-rural
cleavage in that it does not satisfy the �rst condition for modern media to have a group-speci�c
echo chamber e¤ect. Of course, one could argue that social media allows people of a certain gender
to isolate themselves more from those of a di¤erent gender. However, given how much people of
di¤erent genders interact with each other on a day to day basis, it is unlikely that the internet
can make women and men more isolated from each other. In that sense, the gender cleavage does
not satisfy the second condition for modern communication technology to have a group-speci�c
echo chamber e¤ect. The same is true for the age cleavage, but perhaps to a lesser extent because
people of di¤erent ages do not necessarily live together and interact to the same degree that men
and women do.
For other cleavages, such as party ID, religion, family income, work status, education and race,
arguably the conditions above hold, at least to some extent. In these cases, people with di¤erent
identity traits are neither totally isolated from each other, nor interacting intensively. Hence, for
these identity cleavages, modern communication technologies have the potential to create group-
speci�c echo chambers, by facilitating interactions within groups. In our model, this corresponds
to a higher �p or a bigger di¤erence between �rk and �r�k, and thus a rising FST .
Summarizing, we can classify the 11 identity cleavages into two categories along the echo cham-
ber e¤ect dimension. Four identity cleavages have little scope for group-speci�c echo chamber e¤ects
(urbanicity, region, gender and age), whereas all the other identity cleavages have more scope for
group-speci�c echo chamber e¤ects. An increase in FST would only be prominent for the latter
identity cleavages for which modern communication technologies either allows individuals with the
same traits to connect or permits individuals with di¤erent traits to disconnect. Consistent with
23
our discussion, we should therefore not see a rise in FST for cleavages such as urbanicity, region,
gender, and possibly age. In contrast, there is potential for an increasing level of FST for all other
identity cleavages: party ID, religion, family income, work status, education, ethnicity and race.
Choice of identity traits. For identity cleavages with scope for an echo chamber e¤ect (party
ID, religion, family income, work status, education, ethnicity and race), Proposition 3 suggests
that we should expect the e¤ect to be particularly important for cleavages along which individuals
can freely choose their trait. For example, individuals can choose their party ID. The payo¤ from
changing party ID in order to align individual values with those of the majority is greater if within-
group conformism is stronger (i.e. when �p is higher). By introducing a complementarity between
within-group echo chambers and sorting, this increases the �xation of party ID on values. In
contrast, individuals can typically not choose their race. Although internet and social media make
it easier for isolated individuals of a certain race to interact with others of the same race, it does not
increase the sorting of races on particular values. Hence, �xation on race does not further increase.
An additional observation stems from the ability to directly sort into groups on the basis of
cultural values: the increasing alignment between values and traits such as party ID implies that
the distinction between identity traits and values could become more blurred. In that sense, some
group-speci�c echo chambers are not unlike value-speci�c echo chambers. For example, Republican-
leaning media increasingly coincide with media promoting conservative values, and vice versa.
If the emergence of new forms of media facilitate sorting on values rather than on identity traits,
then the cultural divide on some identity cleavages may actually fall. For instance, conservative
members of di¤erent racial groups may have an easier time �nding each other on social media. If
so, this might lead to a narrowing cultural divide between races. This observation suggests that
the dynamics of the cultural divide across di¤erent cleavages may need to be considered jointly. In
the example above, if individuals of di¤erent races are increasingly sorting on values, this may to
some extent be equivalent to increasingly sorting on party ID. In that case, the drop in the cultural
divide across races would coincide with a rise in the cultural divide across party ID.
Dynamics of FST across identity cleavages. In terms of how the internet, social media and
cable TV news are expected to a¤ect the cultural divide across di¤erent identity cleavages, the
above discussion suggests that two dimensions matter: the scope of the echo chambers e¤ect, and
the ease of sorting into identity trait. Figure 6 shows this graphically in a two-dimensional matrix.
24

We can distinguish between three categories of identity cleavages.
A �rst category consists of identity cleavages for which there is little scope for an echo chamber
e¤ect: age, gender, region and urbanicity. In the absence of an echo chamber e¤ect, being able to
choose one�s identity trait is irrelevant in the sense that modern media does not further reinforce
sorting. That is, the complementarity between echo chambers and sorting is inoperative when there
is no echo chamber e¤ect. For the identity traits in the left half of Figure 6 we would therefore
expect no increase in FST . A second category consists of identity cleavages with scope for an echo
chamber e¤ect, but identity traits cannot be freely chosen: ethnicity, race, and to a lesser extent,
family income, work status and education. For the identity cleavages in the bottom-right quadrant
of Figure 6 we would therefore expect the introduction of modern media to have a moderately
positive e¤ect on FST . A third class consists of identity cleavages with echo chamber e¤ects for
which the complementarity between echo chambers and sorting is at work: party ID, and to a lesser
extent, religion. For the identity cleavages in the top-right quadrant of Figure 6 our conceptual
framework therefore predicts an increase in FST following the introduction of modern media.
These theoretical predictions are largely consistent with the empirical patterns seen after the
introduction of modern media and communication technologies. Since the late 1990s, �xation is
mostly �at for age, gender, region and urbanicity; it is mildly increasing for ethnicity, race, income,
work status and education; and it strongly increasing for religion and party ID.
4.4.2 Cultural Evolution across Question Categories
There is substantial heterogeneity in cultural evolution, not just across identity cleavages, but also
across question categories and within question categories. In what follows we start by focusing on
two question categories that exhibit a fairly homogeneous pattern across questions.
Crime. The �rst of these categories are questions related to crime. In 69% of questions pertaining
to crime CF exhibits either a U-shaped or an increasing pattern over time. For the subset of crime
questions for which FST is not �at, 67% display a U-shaped or an increasing FST path. What
might account for the U-shaped pattern in CF and FST for many of the crime questions? One
obvious candidate is the evolution of the violent crime rate and the property crime rate, both of
which peaked in 1991. There are many explanations for the decline in crime rates since then.
They include more and better policing, mass incarceration, the end of the crack epidemic, the
introduction of legalized abortion, and the decline in lead exposure, among others.
25

To see how the rapid decline in crime rates might have changed people�s attitudes towards crime
issues, it is useful to focus on a particular example. Take, for instance, the question in the GSS
that asks respondents whether courts deal too harshly or not harshly enough with criminals. In
1991, of those surveyed by the GSS, 16 answered courts were dealing too harshly with criminals,
compared to 1; 202 who said courts were not harsh enough. By 2016, those numbers had changed
to 513 and 1; 578, respectively. There are two ways of interpreting these numbers in light of the
precipitous drop in crime rates. If the driving force in the decline in crime is a harsher judicial
system, this change in policy may push more people to believe the courts are too harsh. Under
this interpretation, people are not changing their preferences about how harsh the courts should
be, but given that the courts have become harsher, fewer people now believe the courts are not
harsh enough. As a result, we would see CF increase. If, instead, the driving force in the decline
in crime is unrelated to the judicial system, then people may change their preferences about how
harsh the courts should be given that crime rates are lower. In our model we would view this as
a cultural innovation that increases the minority view that courts are too harsh. In other words,
there is an innovation to the minority value. Through the parameter �rk, this leads to a changing
cultural consensus in the direction of a growing minority believing that courts are too harsh. In
that case, cultural heterogeneity increases, since the overall consensus that courts are not harsh
enough is waning. Hence, according to Proposition 2, we should expect CF to increase, because of
a cultural innovation to the minority value.
At the same time, the view on crime has become more divisive across identity groups. Going
back to the question on the harshness of courts, consider the changing racial divide. In 1991,
there was a broad consensus across racial groups: only 3% of whites and 12% of blacks answered
that courts were not treating criminals harshly enough. By 2016, these shares had increased to
16% and 38%, respectively. One way of interpreting these facts is that whites have a lower �rk for
this particular value than blacks. The sensitivity of each group to the cultural innovation di¤ers,
because di¤erent groups may be a¤ected di¤erently by, say, the increase in mass incarceration.
Consistent with Proposition 2, if �rk di¤ers from �r�k, the divide between groups increases when an
innovation occurs, and FST increases.
Another interesting question in the crime category relates to the legality of marijuana use.
Between 1972 and the early 1990s there was a growing consensus that it should be illegal, reaching
a maximum of 83% in favor of keeping it illegal in 1990. Since then, the consensus has completely
26
shifted, and by 2016 only 39% were still in favor of keeping marijuana illegal. As with the question
on the harshness of courts, this would lead to an increase in CF since the early 1990s. In terms
of FST , here as well the susceptibility to the innovation di¤ers across groups. For example, blacks
were less in favor of legalization than whites in 1990; this had switched by 2016.
These examples illustrate that when circumstances change, in a way that a¤ects di¤erent groups
di¤erently, the pre-existing consensus may weaken (showing up as increasing cultural heterogeneity)
and there may be growing divides across identity groups (showing up as growing �xation). Looking
ahead, whether in the long run the pre-existing consensus is replaced by a new consensus or whether
the new steady state is a lack of consensus will depend on the speci�c question. For example, in
the case of marijuana the growing majority in favor of legalization is such that in recent years CF
has started to decline, suggesting that a new consensus might be emerging. Indeed, when the old
consensus is replaced by a new consensus, Proposition 2 predicts a hump-shaped path for CF .
Free speech. The second category of questions where we see homogeneous patterns is the one
related to freedom of speech. For 78% of those questions CF exhibits a decreasing pattern over
time. And for the subset of free speech questions for which FST is not �at, 65% display a decreasing
FST path. As an example, consider the question whether an atheist should be allowed to make a
speech against religion in your community. In 1972, 62% of those surveyed answered positively;
by 2016, this percentage had increased to 80%. This points to a long-term growing consensus in
favor of free speech, thus leading to a falling CF over time. In general, this increasing agreement
happened across all groups. As an illustration, consider how the question on free speech for an
atheist changed across the rural-urban divide. In 1972, 80% of those living in locations of more
than 1 million favored free speech for atheists, compared to 58% of those living in locations of fewer
than 10; 000. In 2016, those numbers were 80% and 78%, respectively. Hence, for this particular
question on free speech, the rural-urban divide all but disappeared. As a result, in this case FST
converged to a number very close to zero.
In the context of our model, this can be viewed as the di¤usion of a cultural value across groups.
The end of McCarthyism, the civil rights movement, and the increasing level of education might
have led to a renewed commitment to the First Amendment. Not all groups took this change
on board simultaneously, but eventually it di¤used to all groups. This led to a decrease in the
di¤erence between �rk and �r�k. According to Corollary 2, this should lead to a decrease in FST .
This is an example of cultural convergence. Why do some changing values di¤use across groups and
27

others do not? One reason is that the issue at stake may a¤ect di¤erent groups very di¤erently. For
example, the harshness of courts may a¤ect African Americans di¤erently from Whites, whereas
the issue of free speech does not have a strong racial element.
Same-sex relations. Within question categories, some speci�c questions exhibit strong dynamics
that are worth highlighting in the context of our model. For example, the percentage of people
answering that homosexual relations were always wrong peaked at the end of the eighties, with
78% in 1987; by 2016, that �gure had gone down to 39%. The decline was especially rapid in
the early 1990s. Between two consecutive GSS waves, 1991 and 1993, the percentage dropped by
nearly 10 percentage points. This increasing tolerance towards same-sex relations translated into
an increasing CF . This is consistent with Proposition 2: as the original consensus disintegrates, we
initially see rising disagreement in society, and hence an increase in CF . This has happened across
groups, but not at the same rate. Compare locations below 10; 000 inhabitants to those above 1
million. In 1990, the share answering homosexual relations were always wrong was 83% and 78%,
respectively. These �gures stood at 45% and 35% respectively in 2016. Hence, both saw a drop,
but the drop was faster in urban areas. In the context of our model, this is a cultural change
going from one consensus to a di¤erent consensus, but at di¤ering rates across groups. Thus, FST
increases in the transition.
5 Conclusion
In this paper, we have conducted a systematic analysis of the evolution of cultural heterogeneity in
the United States. We sought to assess growing concerns about deepening cultural divides between
groups de�ned along a wide range of identity cleavages. We considered eleven such cleavages,
such as race, gender, income quintiles, educational attainment, etc. Using answers to questions on
values, attitudes and norms - cultural traits that we refer to as memes, in reference to Dawkins�
(1989) terminology - we characterized the time paths of cultural divides. The picture that emerges
from this analysis is not one of a generalized deepening of cultural divisions. First, the degree
of between-group cultural speci�city is very small, as between-goup variation represents between
0:6% (for gender) and 2:4% (education) of total variation: most variation in memes is within groups.
Second, we �nd, on average, a U-shaped pattern for our FST measure of cultural �xation: on average
cultural divisions tended to fall from the early 1970s to the late 1990s, and to rise in the 2000s.
In most cases, FST remains below its earlier peaks. Third, the data does not justify a sweeping
28

conclusion that there are deepening cultural divides. The increase in the 2000s is driven largely by
cleavages such as Party ID. Many commentators have focused on the cultural divide across political
lines, ignoring trends across other divides and ignoring heterogeneity across memes. Our paper in
contrast took a more systematic approach of looking at a wide range of cleavages and memes. This
broader approach does not warrant a pessimistic conclusion that the United States is experiencing
cultural disintegration. The data suggests a more quali�ed conclusion that cultural divisions have
grown only since the late 1990s, only for some cleavages and only for some memes.
We also provided a theoretical interpretation for the heterogeneity in the dynamics of cultural
divides across cleavages and memes. In our model, agents are born with cultural traits inherited
with variation from their parents. Social in�uence then triggers potential changes in these inherited
traits, because agents conform to the majority of their own group and because they respond to
cultural fads and innovations: social in�uence is a major force explaining cultural change. The
degree to which cultural change is group speci�c determines the evolution of cultural divides between
goups.
The model suggests that the manner in which agents access information and interact with
each other has important e¤ects on the evolution of cultural divisions. If the predominant mode of
interaction is between-groups, cultural change will occur in a similar manner across group identities,
keeping FST low. If instead most interactions are within-groups and information is group speci�c,
it becomes more likely that cultural �xation increases as a result of a cultural innovation. For
instance, new information technologies such as tailored cable TV channels and online social media
can increase the relative importance of within versus between-group social interactions, by creating
echo chambers. The dynamics of cultural divides also depend on characteristics of the cultural
traits under consideration. For instance, since the mid-1990s, there is an increasing view that
the justice system is too harsh on crime, but this change has occurred di¤erentially across races.
African-Americans are more likely to �nd the judicial system too harsh than Whites. In terms of
our model, this happens because the susceptibility of each group to this speci�c cultural innovation
is di¤erent, creating a growing divide.
Our work can be extended in several directions. First, we have provided a comprehensive
analysis of the dynamics of cultural divides across several identity cleavages, but di¤erences in
these dynamics warrant a closer analysis of the factors a¤ecting each cleavage. Second, for each
cleavage, we have considered all groups jointly, but this may mask interesting patterns for speci�c
29

group pairs. For instance, the average divide between all races may follow a certain time path, but
the speci�c divide between Hispanics and Whites may follow a di¤erent pattern. Third, we have
also treated identity cleavages separately but interactions may be relevant: while men and women
may not have drifted apart culturally, it is conceivable that African American women could have
drifted apart from White men. Our methodology can easily accommodate such extensions, as FST
can be calculated for speci�c pairs of identity groups, or for groups de�ned by the intersection of
several traits.
Ultimately, we are interested in the evolution of cultural heterogeneity because of its potential
e¤ects on social cohesion, social capital and the ability of di¤erent groups to reach agreements on
public policy. In this paper, we have described the evolution of cultural divides, but the question
of their impact on political economy outcomes such as public goods provision, voting, inequality
and economic interactions between groups remains an important topic for future research.
References
Alesina, A. and Giuliano, P. (2015). "Culture and Institutions", Journal of Economic Literature,
53(4): 898-944.
Alesina, A., G. Tabellini and F. Trebbi (2017), "Is Europe an Optimal Political Area?", NBER
Working Paper #23325.
Allport, G. W. (1954). The Nature of Prejudice. Cambridge, MA: Perseus Books
Ashraf, Q. and O. Galor (2013), "The Out of Africa Hypothesis, Human Genetic Diversity, and
Comparative Economic Development," American Economic Review, 103(1): 1-46.
Bell, A., P. J. Richerson and R. McElreath (2009), "Culture Rather than Genes Provides Greater
Scope for the Evolution of Large-Scale Human Prosociality," PNAS, 106(2): 17671-17674.
Bernheim, B. D. (1994), "A Theory of Conformity", Journal of Political Economy, 102(5):
841-876.
Bertrand, M. and E. Kamenica (2018), "Coming Apart? Cultural Distances in the United
States over Time", NBER Working Paper No. 24771, June.
Bikhchandani, S., D. Hirshleifer and I. Welch, (1992), "A Theory of Fads, Fashion, Custom,
and Cultural Change in Informational Cascades," Journal of Political Economy, 100(5): 992-1026.
30

Bisin, A. and T. Verdier, (2000), "Beyond the Melting Pot: Cultural Transmission, Marriage,
and the Evolution of Ethnic and Religious Traits", Quarterly Journal of Economics, 105: 955-988.
Boyd, R. and P. J. Richerson (1985), Culture and the Evolutionary Process. Chicago: University
of Chicago Press.
Boyd, R. and P. J. Richerson (2005), The Origin and Evolution of Cultures. Oxford: Oxford
University Press.
Boxell, L., M. Gentzkow and J. M. Shapiro (2017), "Greater Internet Use Is Not Associated
With Faster Growth in Political Polarization Among US Demographic Groups", PNAS, 114 (40):
10612-10617.
Cavalli-Sforza, L. L. and M. W. Feldman (1981), Cultural Transmission and Evolution. Prince-
ton: Princeton University Press.
Cover, T. M., and J. A. Thomas (2006), Elements of Information Theory. Hoboken: John
Wiley & Sons.
Dawkins, R. (1989), The Sel�sh Gene (2 ed.), Oxford: Oxford University Press.
Desmet, K., I. Ortuño-Ortín and R. Wacziarg (2017), "Culture, Ethnicity and Diversity", Amer-
ican Economic Review, vol. 107(9): 2479-2513.
DiMaggio, P., J. Evans and B. Bryson (1996), "Have Americans�Social Attitudes Become More
Polarized", American Journal of Sociology, 102(3): 690-755.
Doepke, M. and Zilibotti, F. (2008), "Occupational Choice and the Spirit of Capitalism", Quar-
terly Journal of Economics, 123(2): 747�793.
Fernández, R. (2014), "Cultural Change as Learning: The Evolution of Female Labor Force
Participation over a Century", American Economic Review, 103(1): 472-500.
Fernández, R. and A. Fogli (2006), "Fertility: the Role of Culture and Family Experience",
Journal of the European Economic Association, 4(2-3): 552-561.
Fiorina, M. P. and S. J. Abrams (2008), "Political Polarization in the American Public", Annual
Review of Political Science, 11: 563-588.
Gentzkow, M., J. Shapiro and M. Taddy (2016), "Measuring Polarization in High-Dimensional
Data: Method and Application to Congressional Speech", NBER Working Paper # 22423.
31

Guiso, L., Herrera, H. and Morelli, M. (2016). Cultural Di¤erences and Institutional Integra-
tion", Journal of International Economics, 99: S97-S113.
Giavazzi, F., I. Petkov, F. Schiantarelli (2016), "Culture: Persistence and Evolution", NBER
Working Paper # 20174.
Giuliano, P. (2007), "Living Arrangements in Western Europe: Does Cultural Origin Matter?",
Journal of the European Economic Association, 5(5): 927-952.
Henrich, J. (2015), The Secret of Our Success: How Culture Is Driving Human Evolution,
Domesticating Our Species, and Making Us Smarter, Princeton: Princeton University Press.
Inglehart, R. (1997). Modernization and Postmodernization: Cultural, Economic, and Political
Change in 43 Societies. Princeton University Press.
Inglehart, R. and W. E. Baker (2000), "Modernization, Cultural Change and the Persistence of
Traditional Values", American Sociological Review, 65: 19-51.
Kuran, T. and Sandholm, W. H. (2008), "Cultural Integration and Its Discontents", Review of
Economic Studies, 75(1): 201-228.
Lazear, E. (1999), "Culture and Language", Journal of Political Economy, 107(S6): S95-S126.
Luttmer, E. F. P. and M. Singhal (2011). "Culture, Context, and the Taste for Redistribution",
American Economic Journal: Economic Policy, 3(1): 157-179.
Murray, C. (2013). Coming Apart: The State of White America, 1960-2010. New York, NY:
Crown Forum.
Norris, P. and Inglehart, R. (2009). Cosmopolitan Communications: Cultural Diversity in a
Globalized World. Cambridge: Cambridge University Press.
Olivier, J., Thoenig, M. and Verdier, T. (2008). "Globalization and the Dynamics of Cultural
Identity", Journal of International Economics, 76(2): 356-370.
Richerson, P. J. and R. Boyd, (2004), Not by Genes Alone: How Culture Transformed Human
Evolution, Chicago: University of Chicago Press.
Ritzer, G. (2011), Globalization - The Essentials. London: Wiley-Blackwell.
Wright, S. (1949), "The Genetical Structure of Populations," Annals of Human Genetics, 15(1):
323-354.
32

Theoretical Appendix
A. Derivation of Laws of Motion
We focus on group k and start by solving the case where the innovation occurs to the minority
value �i. There are two relevant types of agents, those born with value �i and those born with
value i. For an individual born with value �i to prefer value i, it must be that the utility of
conforming, 1psik(t+1), is greater than both his default innate utility, 1, and the utility of imitating
the innovation, 1r (1 � s
ik(t + 1)). We can rewrite these two conditions as p < sik(t + 1) and
r > p1�sik(t+1)sik(t+1)
. The area of the parameter space that satis�es these two conditions isR sik(t+1)0 ( 1�rk �
p1�sik(t+1)sik(t+1)
)dp. To get the probability that an individual of group k born with value �i prefers
to switch to i, we divide this by the total area of the parameter space, 1�p�rk. Doing so yields a
probability �psik(t + 1) � 12 �p�rks
ik(t + 1)(1 � sik(t + 1)). Because of the law of large numbers, this
is the same as the share of agents of group k born with value �i that switch to value i. For an
individual of group k born with value i to prefer value �i, it must be that 1r (1� sik(t+1)) > 1 and
1r (1�s
ik(t+1)) >
1+ p s
ik(t+1). The area of the parameter space that satis�es these two conditions isR 1�sik(t+1)
0 (1�p�r(1+ )sik(t+1)
1�sik(t+1))dr. This implies a share �rk(1�sik(t+1))�1
2 �p�rk(1+ )sik(t+1)(1�sik(t+1))
of individuals born with value i who want to switch to value �i. These results give us the following
law of motion for value i when the innovation occurs to value �i:
sik(t+ 1) = zik(t+ 1) + �psik(t+ 1)(1� zik(t+ 1))� �rk(1� sik(t+ 1))zik(t+ 1)
+1
2�rk �ps
ik(t+ 1)(1� sik(t+ 1))((1 + )zik(t+ 1)� (1� zik(t+ 1))) if j = �i
Next we turn to the case where the innovation occurs to the majority value i. An individual
born with value �i prefers to switch to i if either 1psik(t+1) > 1 or
1rsik(t+1) > 1. The probability
of this occurring is the complement of p > sik(t + 1) and r > sik(t + 1), which is equal to 1 � (1 �
�psik(t+1))(1� �rksik(t+1)). Simplifying, the share of people with value �i that �nd it bene�cial to
switch to value i is equal to �psik(t+ 1) + �rksik(t+ 1)� �rk �p(sik(t+ 1))2. The law of motion for value
i when the innovation occurs to value i then becomes:
sik(t+ 1) = zik(t+ 1) + �psik(t+ 1)(1� zik(t+ 1)) + �rksik(t+ 1)(1� zik(t+ 1))
��rk �p(sik(t+ 1))2(1� zik(t+ 1)) if j = i
33

We can complete the analysis by writing down the two laws of motion of the minority value:
s�ik (t+ 1) = z�ik (t+ 1)� �p(1� s�ik (t+ 1))z
�ik (t+ 1) + �rks
�ik (t+ 1)(1� z
�ik (t+ 1))
�12�rk �p(1� s�ik (t+ 1))s
�ik (t+ 1)((1 + )(1� z
�ik (t+ 1))� z
�ik (t+ 1)) if j = �i
s�ik (t+ 1) = z�ik (t+ 1)� �p(1� s�ik (t+ 1))z
�ik (t+ 1)� �rk(1� s
�ik (t+ 1))z
�ik (t+ 1)
��rk �p(1� s�ik (t+ 1))2z�ik (t+ 1) if j = i
B. Proofs of Propositions
B.1. Proof of Proposition 1
Suppose that in group k the majority value is i. Because sik(t+ 1) = zik(t+ 1) + �ps
ik(t+ 1)(1�
zik(t + 1)), we can write sik(t + 1) = zik(t + 1)=(1 � �p(1 � zik(t + 1)). Since sik(t + 1) is weakly
increasing in �p and is increasing in zik(t + 1), and since zik(t + 1) is increasing in s
ik(t) and weakly
increasing in �, it follows that for a given level of sik(t), sik(t+1) is weakly increasing in �p and �. If
�p = 1 or � = 1, it is straightforward to see that sik converges to 1. This, together with the previous
statement, implies that the steady state sik is weakly increasing in �p and �. If the majority value
is the same in both groups, then the value shares in both groups converge to the same shares. As
a result, in steady state, FST is zero. CF is equal to 1 � (12(sik + s
i�k))
2 � (1 � 12(s
ik + s
i�k))
2. In
steady state, if both groups have the same majority shares, CF can be written as 2si(1� si) which
is maximized when si = 12 . Since s
ik is weakly increasing in � and �p for s
i � 12 , it follows that CF
is weakly decreasing in � and �p. If the majority value is di¤erent in both groups, then in steady
state sik = s�i�k, so that the aggregate value shares will be equal to
12 . As a result, CF will be 1
2 ,
and group-speci�c CF is weakly decreasing in � and �p. Hence, FST will be weakly increasing in �
and �p. �
B.2. Proof of Proposition 2
Case 1: Since group k experienced an innovation to value �i, with the majority value still
being i, we start o¤ with 1 > sik(t) >12 . From zik(t + 1) � sik(t) = (1 � �)(1 � 2sik(t)) it follows
that zik(t + 1) < sik(t), so zik(t + 1) < 1. If �pk = 0 and �rk > 0, then sik(t + 1)=z
ik(t + 1) =
1 � �rk(1 � sik(t + 1)) � 1. In the previous expression, for sik(t + 1)=zik(t + 1) to be equal to 1, it
must be that sik(t+ 1) = zik(t+ 1) = 1. Since this would contradict z
ik(t+ 1) < 1, we can conclude
that sik(t + 1)=zik(t + 1) < 1, so that sik(t + 1) < zik(t + 1). By continuity of s
ik(t + 1)=z
ik(t + 1)
34

when sik(t + 1) >12 , it follows that if �p is su¢ ciently small, s
ik(t + 1) < zik(t + 1). Together with
zik(t + 1) < sik(t), this implies that sik is decreasing over time as long as the original majority
value continues to have a share greater than 12 . Now consider what happens when the share of the
original majority value drops below 12 . Following the notation above, we now refer to the original
majority value as �i. If �p = 0 and �rk > 0, then s�ik (t+ 1)=z�ik (t+ 1) = 1� �rk(1� s
�ik (t+ 1)) < 1,
so that s�ik (t + 1) < z�ik (t + 1). Since z�ik (t + 1) = (2� � 1)s�ik (t) + (1 � �) and s
�ik (t) <
12 , it
follows that z�ik (t+1) <12 , so that s
�ik (t+1) <
12 . Hence, if the original majority value has a share
below 12 , that share remains below
12 . Because of continuity of s
�ik (t+ 1)=z
�ik (t+ 1) when s
�ik < 1
2 ,
this conclusion does not change if �p is su¢ ciently small. The dynamics for sik when sik >
12 and
the dynamics for s�ik when s�ik < 12 imply that eventually the share of the original majority value
drops below 12 . There is no need to describe the dynamics for when s
�ik = 1
2 as this would never
be a stable equilibrium. The value shares in group �k follow similar dynamics. We can therefore
conclude that if �p is su¢ ciently small and if �rk > 0 and �r�k > 0, then the majority value switches
in both groups. As a result, in both groups CF �rst goes up (because value shares become more
equal as the original majority share gets closer to 12) and then goes down (because value shares
become more unequal as the new majority value increases its share above 12). If �rk = �r�k, then
the within-group dynamics of CF will be the same in both groups, so that overall CF also �rst
goes up and then down, with FST remaining equal to zero. If �rk 6= �r�k, the two groups converge
to di¤erent shares, so that FST goes up.
Case 2: If �p > 0 and �rk = 0 in group k, then the original steady-state value share of group k
remain unchanged. Hence, if the original majority value corresponded to the value that also was
the steady-state majority value, this will not change. Since the law of motion is continuous, this
result does not change if �p > 0 and �rk is su¢ ciently small. If �rk > 0 and �r�k > 0, the majority
shares become closer to 12 so that CF increases. If �rk and �r�k di¤er, the two groups will converge
to di¤erent shares, so that FST increases, assuming they started o¤ with the same shares. �
B.3. Proof of Proposition 3
Consider an agent holding the minority value �i in group k. After drawing p, he has three
options: keep the minority value and remain in group k (payo¤ 1); switch to the majority value
and remain in group k (payo¤ 1psik); and switch to group �k where his value �i is the majority value
(payo¤max[1; 1+ p s�i�k]. Because of symmetry,
1+ p s
�i�k =
1+ p s
ik. Since
1+ p s
ik >
1psik, the agent will
always prefer the option of keeping his value and switching traits to adopting the majority value
35

without switching traits. Assuming that the default option is to keep his minority value without
changing trait, the agent only switches traits when 1+ p s
ik > 1, i.e., when p < (1 + )s
ik. Applying
the law of large numbers, a share max[(1 + )�psik; 1] of the population holding value �i, (1 � zik),
switches to the other group. Because of symmetry, an identical share of the other group switches
to group k. As a result, the law of motion of value i in group k is
sik(t+ 1) =
8><>:zik(t+1)
1�(1+ )�p(1�zik(t+1))if �p < 1
1+
1 otherwise
The proposition is for the case where the majority share does not reach one. For the rest of the
proof we therefore focus on the case where �p < 11+ . Using a similar argument as in Proposition 1,
in steady state sik = s�i�k, so that the aggregate value shares will be equal to
12 . As a result, CF will
be 12 , and group-speci�c CF is weakly decreasing in �p and . Hence, FST will be weakly increasing
in �p and . To show that the increase in FST with �p is greater in a situation where agents can
choose their identity trait compared to a situation where they cannot choose their identity trait,
we write down the law of motion of value i in group k when identity traits are given:
si0k(t+ 1) =zik(t+ 1)
1� (1 + )�p(1� zik(t+ 1))
where we have introduced a prime to distinguish with the share when individuals can choose their
identity trait. For a given zik(t+1) we can now show that the ratio sik(t+1) to s
i0k(t+1) is increasing
in �p. The ratio can be written as:
sik(t+ 1)
si0k(t+ 1)=
1� �p(1� zik(t+ 1))1� (1 + )�p(1� zik(t+ 1))
The derivative of this ratio with respect to �p is strictly positive if > 0. Hence, the majority shares
diverge more from 12 if �p is greater. As a result, the increase in FST is greater when �p is larger. �
36

37
Tabl
e 1
– CF
by
Tim
e Pe
riod
and
F ST b
y Ti
me
Perio
d an
d Cl
eava
ge
(2-w
ave
grou
ping
)
Tim
e Pe
riod
CF
F ST
Age
F ST
Educ
. F S
T Et
hnic
F S
T Fa
mily
in
com
e
F ST
Gen
der
F ST
Part
y ID
F S
T Ra
ce
F ST
Regi
on
F ST
Relig
ion
F ST
Urb
an
F ST
Wor
k St
atus
19
72
0.49
5 0.
025
0.03
0 0.
015
0.02
0 0.
006
0.01
6 0.
012
0.01
9 0.
024
0.01
5 0.
019
1974
0.
494
0.02
5 0.
026
0.01
4 0.
017
0.00
6 0.
013
0.00
9 0.
020
0.02
2 0.
016
0.01
8 19
76
0.50
0 0.
024
0.02
6 0.
013
0.01
7 0.
006
0.01
1 0.
009
0.01
7 0.
019
0.01
2 0.
017
1979
0.
499
0.02
3 0.
028
0.01
4 0.
018
0.00
6 0.
011
0.01
0 0.
018
0.02
2 0.
013
0.01
7 19
82
0.49
7 0.
020
0.02
7 0.
017
0.02
0 0.
006
0.01
4 0.
015
0.01
8 0.
019
0.01
3 0.
018
1984
0.
496
0.02
2 0.
028
0.01
6 0.
018
0.00
7 0.
013
0.01
0 0.
016
0.02
0 0.
011
0.01
8 19
86
0.49
4 0.
020
0.02
5 0.
019
0.02
0 0.
007
0.01
2 0.
015
0.02
0 0.
018
0.01
1 0.
017
1988
0.
486
0.02
1 0.
027
0.01
3 0.
018
0.00
7 0.
010
0.00
8 0.
015
0.01
9 0.
010
0.01
8 19
90
0.48
4 0.
017
0.02
3 0.
013
0.01
6 0.
009
0.01
0 0.
009
0.01
8 0.
019
0.01
1 0.
018
1993
0.
482
0.01
7 0.
019
0.01
3 0.
015
0.00
6 0.
011
0.00
9 0.
014
0.01
8 0.
009
0.01
5 19
97
0.48
9 0.
015
0.01
9 0.
012
0.01
4 0.
006
0.01
3 0.
009
0.01
1 0.
020
0.00
9 0.
013
2001
0.
491
0.01
5 0.
018
0.01
3 0.
017
0.00
7 0.
013
0.01
1 0.
012
0.02
1 0.
008
0.01
3 20
05
0.49
5 0.
012
0.02
1 0.
016
0.01
8 0.
006
0.01
9 0.
015
0.01
1 0.
023
0.00
9 0.
011
2009
0.
499
0.01
4 0.
025
0.01
8 0.
019
0.00
6 0.
018
0.01
2 0.
012
0.02
4 0.
009
0.01
2 20
13
0.49
6 0.
013
0.02
4 0.
016
0.01
9 0.
005
0.02
1 0.
012
0.01
2 0.
025
0.00
8 0.
013
2016
0.
491
0.01
3 0.
022
0.01
7 0.
017
0.00
5 0.
023
0.01
3 0.
012
0.02
7 0.
010
0.01
4 Av
erag
e 0.
493
0.01
8 0.
024
0.01
5 0.
018
0.00
6 0.
014
0.01
1 0.
015
0.02
1 0.
011
0.01
6 Ti
me
perio
d re
fers
to 2
-wav
e gr
oupi
ngs.
So
for i
nsta
nce
1972
refe
rs to
poo
led
data
ove
r the
197
2 an
d 19
73 w
aves
of t
he G
SS.

38
Tabl
e 2-
Dyn
amic
s of C
F an
d F S
T, by
Cle
avag
e
(2-w
ave
grou
ping
, 197
2-20
16, 7
6 Q
uest
ions
)
U
-sha
ped
Hum
p-Sh
aped
In
crea
sing
De
crea
sing
Fl
at
Pane
l A: C
F CF
14
.47%
13
.16%
25
.00%
28
.95%
18
.42%
Pa
nel B
: FST
Ag
e 11
.84%
9.
21%
10
.53%
31
.58%
36
.84%
Ed
ucat
ion
15.7
9%
3.95
%
13.1
6%
21.0
5%
46.0
5%
Ethn
icity
14
.47%
3.
95%
18
.42%
10
.53%
52
.63%
Fa
mily
Inco
me
5.26
%
1.32
%
14.4
7%
22.3
7%
56.5
8%
Gend
er
6.58
%
17.1
1%
11.8
4%
11.8
4%
52.6
3%
Part
y ID
48
.68%
3.
95%
6.
58%
6.
58%
34
.21%
Ra
ce
14.4
7%
3.95
%
22.3
7%
14.4
7%
44.7
4%
Regi
on
11.8
4%
1.32
%
2.63
%
34.2
1%
50.0
0%
Relig
ion
34.2
1%
0.00
%
9.21
%
14.4
7%
42.1
1%
Urb
anic
ity
15.7
9%
2.63
%
5.26
%
27.6
3%
48.6
8%
Wor
k st
atus
7.
89%
11
.84%
7.
89%
18
.42%
53
.95%
Pa
nel B
Ave
rage
16
.99%
5.
38%
11
.12%
19
.38%
47
.13%
N
ote:
Thi
s Tab
le d
ispla
ys th
e fr
actio
n of
que
stio
ns, a
mon
g th
e 76
in o
ur b
asel
ine
sam
ple,
for w
hich
CF
or F
ST fo
llow
s the
type
s of d
ynam
ics l
isted
in th
e fir
st ro
w, i
.e. U
-sha
ped,
hum
p sh
aped
, inc
reas
ing,
de
crea
sing
or fl
at. T
o as
sess
thes
e dy
nam
ics,
we
regr
ess f
or e
ach
ques
tion
its C
F / F
ST o
n a
time
tren
d an
d its
squa
re. I
f bot
h th
e lin
ear a
nd q
uadr
atic
term
s are
stat
istic
ally
sign
ifica
nt a
t the
5%
leve
l, an
d th
e ve
rtex
of t
he fi
tted
qua
drat
ic c
urve
is b
etw
een
1980
and
200
5, w
e ch
arac
teriz
e th
e dy
nam
ics a
s eith
er
U-s
hape
d or
hum
p-sh
aped
. In
all o
ther
cas
es, w
e ru
n a
linea
r reg
ress
ion
of C
F / F
ST o
n a
time
tren
d, a
nd
clas
sify
the
dyna
mic
s as i
ncre
asin
g, d
ecre
asin
g or
flat
dep
endi
ng o
n w
heth
er th
e co
effic
ient
on
the
time
tren
d is
signi
fican
tly p
ositi
ve, s
igni
fican
tly n
egat
ive,
or i
nsig
nific
ant,
resp
ectiv
ely.

39
Tabl
e 3
- Dyn
amic
s of C
F, b
y Q
uest
ion
Cate
gory
and
Sub
-cat
egor
y (2
-wav
e gr
oupi
ng, 1
972-
2016
, 76
Que
stio
ns)
Que
stio
n Ca
tego
ry
Que
stio
n Su
b-ca
tego
ry
# of
qu
estio
ns
U-s
hape
d Hu
mp-
Shap
ed
Incr
easi
ng
Decr
easi
ng
Flat
Civi
l Lib
ertie
s
23
21.7
4%
17.3
9%
17.3
9%
43.4
8%
0.00
%
Cr
ime
13
38.4
6%
7.69
%
30.7
7%
23.0
8%
0.00
%
Di
ffere
nces
& D
iscrim
inat
ion
1 0.
00%
10
0.00
%
0.00
%
0.00
%
0.00
%
Fr
ee S
peec
h 9
0.00
%
22.2
2%
0.00
%
77.7
8%
0.00
%
Curr
ent A
ffai
rs
23
0.
00%
4.
35%
43
.48%
21
.74%
30
.43%
Econ
omic
Wel
l-Bei
ng
4 0.
00%
25
.00%
75
.00%
0.
00%
0.
00%
Nat
iona
l Spe
ndin
g 11
0.
00%
0.
00%
36
.36%
18
.18%
45
.45%
Soci
al Is
sues
8
0.00
%
0.00
%
37.5
0%
37.5
0%
25.0
0%
Gen
der &
Mar
riage
14
28.5
7%
21.4
3%
21.4
3%
21.4
3%
7.14
%
Ch
ildre
n &
Wor
king
2
50.0
0%
50.0
0%
0.00
%
0.00
%
0.00
%
Li
fe S
atisf
actio
n 6
33.3
3%
0.00
%
33.3
3%
16.6
7%
16.6
7%
M
arria
ge
1 0.
00%
10
0.00
%
0.00
%
0.00
%
0.00
%
Se
x &
Sex
ual O
rient
atio
n 5
20.0
0%
20.0
0%
20.0
0%
40.0
0%
0.00
%
Polit
ics
13
15
.38%
0.
00%
15
.38%
23
.08%
46
.15%
Conf
iden
ce &
Pow
er
12
16.6
7%
0.00
%
8.33
%
25.0
0%
50.0
0%
Po
litic
al B
elie
fs
1 0.
00%
0.
00%
10
0.00
%
0.00
%
0.00
%
Relig
ion
& S
pirit
ualit
y
3 0.
00%
66
.67%
0.
00%
33
.33%
0.
00%
Belie
fs
1 0.
00%
0.
00%
0.
00%
10
0.00
%
0.00
%
Re
ligio
us A
ffilia
tion
& B
ehav
iors
2
0.00
%
100.
00%
0.
00%
0.
00%
0.
00%
N
ote:
Thi
s Tab
le d
ispla
ys th
e ty
pes o
f dyn
amic
s of C
F fo
r diff
eren
t cat
egor
ies a
nd su
bcat
egor
ies o
f que
stio
ns, a
s def
ined
by
the
GSS.
The
ty
pes o
f dyn
amic
s are
list
ed in
the
first
row
, i.e
. U-s
hape
d, h
ump
shap
ed, i
ncre
asin
g, d
ecre
asin
g or
flat
. To
asse
ss th
ese
dyna
mic
s, w
e re
gres
s for
eac
h qu
estio
n its
CF
on a
tim
e tr
end
and
its sq
uare
. If b
oth
the
linea
r and
qua
drat
ic te
rms a
re st
atist
ical
ly si
gnifi
cant
at t
he 5
%
leve
l, an
d th
e ve
rtex
of t
he fi
tted
qua
drat
ic c
urve
is b
etw
een
1980
and
200
5, w
e ch
arac
teriz
e th
e dy
nam
ics a
s eith
er U
-sha
ped
or h
ump-
shap
ed. I
n al
l oth
er c
ases
, we
run
a lin
ear r
egre
ssio
n of
CF
on a
tim
e tr
end,
and
cla
ssify
the
dyna
mic
s as i
ncre
asin
g, d
ecre
asin
g or
flat
de
pend
ing
on w
heth
er th
e co
effic
ient
on
the
time
tren
d is
signi
fican
tly p
ositi
ve, s
igni
fican
tly n
egat
ive,
or i
nsig
nific
ant,
resp
ectiv
ely.
We
then
sum
mar
ize th
ese
dyna
mic
s by
aver
agin
g w
ithin
que
stio
n ca
tego
ries /
subc
ateg
orie
s.

40
Tabl
e 4
- Dyn
amic
s of F
ST, b
y Q
uest
ion
Cate
gory
and
Sub
-cat
egor
y, a
vera
ged
acro
ss 1
1 cl
eava
ges
(2-w
ave
grou
ping
, 197
2-20
16, 7
6 Q
uest
ions
)
Que
stio
n Ca
tego
ry
Que
stio
n Su
b-ca
tego
ry
# of
qu
estio
ns
U-s
hape
d Hu
mp-
Shap
ed
Incr
easi
ng
Decr
easi
ng
Flat
Civi
l Lib
ertie
s
23
19.7
6%
5.53
%
13.8
3%
29.6
4%
31.2
3%
Cr
ime
13
23.7
8%
6.29
%
18.8
8%
14.6
9%
36.3
6%
Di
ffere
nces
& D
iscrim
inat
ion
1 9.
09%
0.
00%
0.
00%
18
.18%
72
.73%
Free
Spe
ech
9 15
.15%
5.
05%
8.
08%
52
.53%
19
.19%
Cu
rren
t Aff
airs
23
14.2
3%
5.14
%
11.4
6%
13.0
4%
56.1
3%
Ec
onom
ic W
ell-B
eing
4
2.27
%
0.00
%
22.7
3%
13.6
4%
61.3
6%
N
atio
nal S
pend
ing
11
12.4
0%
9.92
%
11.5
7%
14.0
5%
52.0
7%
So
cial
Issu
es
8 22
.73%
1.
14%
5.
68%
11
.36%
59
.09%
G
ende
r & M
arria
ge
14
16
.23%
5.
19%
11
.04%
20
.13%
47
.40%
Child
ren
& W
orki
ng
2 13
.64%
9.
09%
0.
00%
13
.64%
63
.64%
Life
Sat
isfac
tion
6 4.
55%
1.
52%
13
.64%
28
.79%
51
.52%
Mar
riage
1
0.00
%
0.00
%
0.00
%
0.00
%
100.
00%
Sex
& S
exua
l Orie
ntat
ion
5 34
.55%
9.
09%
14
.55%
16
.36%
25
.45%
Po
litic
s
13
17.4
8%
5.59
%
5.59
%
9.09
%
62.2
4%
Co
nfid
ence
& P
ower
12
15
.15%
5.
30%
6.
06%
8.
33%
65
.15%
Polit
ical
Bel
iefs
1
45.4
5%
9.09
%
0.00
%
18.1
8%
27.2
7%
Relig
ion
& S
pirit
ualit
y
3 18
.18%
6.
06%
12
.12%
30
.30%
33
.33%
Belie
fs
1 27
.27%
0.
00%
9.
09%
18
.18%
45
.45%
Relig
ious
Affi
liatio
n &
Beh
avio
rs
2 13
.64%
9.
09%
13
.64%
36
.36%
27
.27%
N
ote:
Thi
s Tab
le d
ispla
ys th
e ty
pes o
f dyn
amic
s of F
ST fo
r diff
eren
t cat
egor
ies a
nd su
bcat
egor
ies o
f que
stio
ns, a
s def
ined
by
the
GSS.
The
ty
pes o
f dyn
amic
s are
list
ed in
the
first
row
, i.e
. U-s
hape
d, h
ump
shap
ed, i
ncre
asin
g, d
ecre
asin
g or
flat
. To
asse
ss th
ese
dyna
mic
s, w
e re
gres
s for
eac
h qu
estio
n its
FST
on
a tim
e tr
end
and
its sq
uare
. If b
oth
the
linea
r and
qua
drat
ic te
rms a
re st
atist
ical
ly si
gnifi
cant
at t
he 5
%
leve
l, an
d th
e ve
rtex
of t
he fi
tted
qua
drat
ic c
urve
is b
etw
een
1980
and
200
5, w
e ch
arac
teriz
e th
e dy
nam
ics a
s eith
er U
-sha
ped
or h
ump-
shap
ed. I
n al
l oth
er c
ases
, we
run
a lin
ear r
egre
ssio
n of
FST
on
a tim
e tr
end,
and
cla
ssify
the
dyna
mic
s as i
ncre
asin
g, d
ecre
asin
g or
flat
de
pend
ing
on w
heth
er th
e co
effic
ient
on
the
time
tren
d is
signi
fican
tly p
ositi
ve, s
igni
fican
tly n
egat
ive,
or i
nsig
nific
ant,
resp
ectiv
ely.
We
then
sum
mar
ize th
ese
dyna
mic
s by
aver
agin
g w
ithin
que
stio
n ca
tego
ries /
subc
ateg
orie
s and
acr
oss a
ll 11
cle
avag
es.

41
Table 5 – Regression analysis of the Level of FST, by cleavage type, by question category and by subcategory, and by time period.
Categories Sub-categories Panel A - Cleavages Age 1.194 (13.56)*** 1.194 (13.27)*** Education 1.770 (20.10)*** 1.770 (19.66)*** Ethnicity 0.851 (9.67)*** 0.851 (9.45)*** Family income 1.127 (12.80)*** 1.127 (12.52)*** Gender (excluded) (excluded) Party ID 0.775 (8.80)*** 0.775 (8.61)*** Race 0.475 (5.39)*** 0.475 (5.28)*** Region 0.884 (10.04)*** 0.884 (9.82)*** Religion 1.477 (16.77)*** 1.477 (16.40)*** Urbanicity 0.435 (4.94)*** 0.435 (4.84)*** Work status 0.908 (10.31)*** 0.908 (10.08)*** Panel B - Categories and sub-categories Civil liberties 0.801 (14.11)*** - Crime 1.163 (6.85)*** - Differences and discrimination 1.424 (6.15)*** - Free speech 2.488 (14.42)*** Current affairs -0.206 (3.63)*** - Economic well being 0.986 (5.39)*** - National spending 0.552 (3.23)*** - Social issues 0.721 (4.15)*** Gender and marriage (excluded) - Marriage (excluded) - Children and working 0.214 (1.07) - Life satisfaction 0.815 (4.61)*** - Sex and sexual orientation 1.434 (8.00)*** Politics -0.756 (11.74)*** - Confidence and power 0.084 (0.49) - Political beliefs 0.761 (3.29)*** Religion and spirituality 1.288 (12.10)*** - Beliefs 0.826 (3.57)*** - Religious affiliation and behaviors 2.858 (14.26)***
(Continued)

42
Categories Sub-categories Panel C - Time Dummies 1972 (excluded) (excluded) 1974 -0.139 (1.31) -0.139 (1.28) 1976 -0.283 (2.67)*** -0.283 (2.61)*** 1979 -0.192 (1.81)* -0.192 (1.77)* 1982 -0.133 (1.25) -0.133 (1.23) 1984 -0.200 (1.88)* -0.200 (1.84)* 1986 -0.155 (1.46) -0.155 (1.43) 1988 -0.323 (3.04)*** -0.323 (2.97)*** 1990 -0.347 (3.26)*** -0.347 (3.19)*** 1993 -0.507 (4.77)*** -0.507 (4.67)*** 1997 -0.544 (5.12)*** -0.544 (5.01)*** 2001 -0.479 (4.51)*** -0.479 (4.41)*** 2005 -0.361 (3.40)*** -0.361 (3.32)*** 2009 -0.289 (2.72)*** -0.289 (2.66)*** 2013 -0.290 (2.73)*** -0.290 (2.67)*** 2016 -0.252 (2.37)** -0.252 (2.32)** Intercept -0.064 (0.34) 0.829 (7.83)*** R2 0.15 0.11 Number of observations 13,376 13,376
* p<0.1; ** p<0.05; *** p<0.01; t-statistics in parentheses; FST multiplied by 100 to improve readability. Time dummies refers to 2-wave groupings. So for instance 1972 refers to pooled data over the 1972 and 1973 waves of the GSS, and the dummy takes on a value of 1 if the FST measure is computed using these underlying waves, and zero otherwise.

43
Tabl
e 6
– O
vera
ll or
Par
tial R
2 , Ove
r Tim
e
Tim
e Pe
riod
R2 O
vera
ll Ag
e Ed
uc.
Ethn
ic
Fam
ily
Inco
me
Gen
der
Part
y ID
Ra
ce
Regi
on
Relig
ion
Urb
an
Wor
k St
atus
19
72
0.15
5 0.
013
0.01
3 0.
006
0.01
1 0.
003
0.01
0 0.
003
0.01
4 0.
014
0.00
7 0.
007
1974
0.
141
0.01
2 0.
010
0.00
7 0.
009
0.00
3 0.
008
0.00
2 0.
012
0.01
3 0.
007
0.00
6 19
76
0.13
2 0.
012
0.01
1 0.
005
0.00
9 0.
004
0.00
7 0.
003
0.01
1 0.
011
0.00
7 0.
006
1979
0.
136
0.01
2 0.
011
0.00
4 0.
010
0.00
4 0.
008
0.00
2 0.
011
0.01
3 0.
007
0.00
5 19
82
0.13
5 0.
011
0.01
1 0.
006
0.00
9 0.
004
0.00
8 0.
003
0.01
1 0.
011
0.00
6 0.
006
1984
0.
140
0.01
1 0.
014
0.00
8 0.
010
0.00
5 0.
011
0.00
2 0.
013
0.01
2 0.
005
0.00
7 19
86
0.13
6 0.
010
0.01
1 0.
008
0.01
0 0.
005
0.01
0 0.
002
0.01
1 0.
011
0.00
5 0.
006
1988
0.
134
0.01
0 0.
013
0.00
6 0.
011
0.00
5 0.
011
0.00
2 0.
011
0.01
0 0.
005
0.00
7 19
90
0.13
4 0.
010
0.01
2 0.
006
0.01
0 0.
006
0.01
0 0.
002
0.01
3 0.
010
0.00
6 0.
006
1993
0.
118
0.00
9 0.
010
0.00
5 0.
010
0.00
5 0.
010
0.00
2 0.
008
0.01
1 0.
005
0.00
5 19
97
0.11
4 0.
008
0.01
1 0.
004
0.00
8 0.
004
0.01
0 0.
002
0.00
6 0.
013
0.00
4 0.
004
2001
0.
122
0.00
7 0.
010
0.00
5 0.
010
0.00
5 0.
010
0.00
2 0.
008
0.01
4 0.
005
0.00
5 20
05
0.13
3 0.
007
0.00
9 0.
004
0.01
0 0.
004
0.01
7 0.
002
0.00
8 0.
014
0.00
5 0.
004
2009
0.
135
0.00
7 0.
011
0.00
6 0.
009
0.00
5 0.
014
0.00
2 0.
008
0.01
6 0.
005
0.00
6 20
13
0.13
6 0.
007
0.01
1 0.
005
0.00
9 0.
004
0.01
6 0.
002
0.00
7 0.
015
0.00
5 0.
005
2016
0.
151
0.00
8 0.
012
0.00
8 0.
010
0.00
4 0.
020
0.00
3 0.
008
0.01
9 0.
005
0.00
7 Av
erag
e 0.
135
0.01
0 0.
011
0.00
6 0.
010
0.00
4 0.
011
0.00
2 0.
010
0.01
3 0.
006
0.00
6 Ti
me
perio
d re
fers
to 2
-wav
e gr
oupi
ngs.
So
for i
nsta
nce
1972
refe
rs to
poo
led
data
ove
r the
197
2 an
d 19
73 w
aves
of t
he G
SS.

Figu
re 1
– C
F ov
er T
ime
(76
ques
tions
, 2-w
ave
grou
ping
)

0.00
0
0.00
5
0.01
0
0.01
5
0.02
0
0.02
5
0.03
0
0.03
5
1972
1974
1976
1979
1982
1984
1986
1988
1990
1993
1997
2001
2005
2009
2013
2016
Figure 2 ‐Average Cu
ltural FST over T
ime for 1
1 Cleavages (76
que
stions)
FST Ag
eFST Ed
ucation
FST Ethn
icity
FST Family income
FST Gen
der
FST Party ID
FST Ra
ceFST Re
gion
FST Urbanicity
FST Work Status
FST Re
ligion

Figu
re 3
– E
volu
tion
of F
ST fo
r Eac
h of
11
Clea
vage
s, o
ver T
ime


Figu
re 4
– T
otal
R2 a
cros
s All
11 C
leav
ages
, Ove
r Tim
e (7
6 qu
estio
ns, 2
-wav
e gr
oupi
ng)

Figu
re 5
– P
artia
l R2 a
cros
s Eac
h of
11
Clea
vage
s, O
ver T
ime


Urbanicity
Region
Gen
der
Age
Choice Identity TraitParty ID
Religion
Education
Family income
Work status
Race
Ethn
icity
Echo
Chambe
r
Figure 6 –Classification of Id
entity Cleavages