the cyclical behavior of labor force participation
TRANSCRIPT

ISSN 1936-5330
Didem Tüzemen and Willem Van Zandweghe August 2018RWP 18-08https://doi.org/10.18651/RWP2018-08
The Cyclical Behavior of Labor Force Participation

The Cyclical Behavior of Labor Force Participation∗
Didem Tuzemen† Willem Van Zandweghe‡
August 30, 2018
Abstract
We document that labor force participation declines in the short run following a
positive technology shock. The countercyclical response of labor force participation to
a technology shock contrasts with the well documented mild procyclical behavior of
labor force participation in the business cycle. In a search model of the labor market
that incorporates a participation choice, we show that a positive technology shock
reduces labor force participation in the short run under a reasonable calibration. In
the calibrated model, discount factor shocks induce a procyclical response of labor force
participation. As a result, the model can generate both the countercyclical response
to technology shocks and the procyclical behavior, consistent with the evidence. Our
results indicate an important role of nontechnology shocks for explaining labor market
fluctuations.
Keywords: Labor force participation; Unemployment; Technology shocks; Discount
factor shocks
JEL Classification: E24, E32, J22, J64
∗The authors are grateful to John Keating, Rong Li, Nicolas Petrosky-Nadeau, Pierre-Daniel Sarte, and
Rob Vigfusson for comments and discussions. The views expressed in this paper are those of the authors
and do not necessarily reflect the official views of the Federal Reserve Bank of Kansas City or the Federal
Reserve System.
†Research Department, Federal Reserve Bank of Kansas City (e-mail: [email protected])
‡Corresponding author. Research Department, Federal Reserve Bank of Kansas City, 1 Memorial Drive,
Kansas City, MO 64198, USA (e-mail: [email protected])
1

1 Introduction
A large body of business cycle research has studied the cyclical fluctuations of unemployment,
but most studies assume that the labor force is constant.1 This is perhaps not surprising, as
fluctuations in labor force participation are small compared with unemployment fluctuations
in the U.S. data. However, understanding the cyclical behavior of labor force participation
can provide insight into the nature of unemployment fluctuations. For instance, the decline
in labor force participation during the Great Recession and its aftermath stirred up debate
about the severity of the labor market slump and whether the unemployment rate is an
accurate measure of it.2
This paper makes two contributions. First, we examine the empirical response of labor
force participation to a technology shock using a structural vector autoregression (VAR),
and document that a positive shock reduces labor force participation in the short run. To
the best of our knowledge, our paper is the first to document the empirical response of
labor force participation to a technology shock. Based on simulated data from the VAR,
the correlation of labor force participation and output conditional on technology shocks
is −0.91. The highly countercyclical response of labor force participation to a technology
shock stands in contrast with the well documented mild procyclical behavior of labor force
participation in the business cycle. Indeed, the unconditional correlation of labor force
participation and output in the postwar U.S. data is 0.17. The large difference between
the two correlations implies that technology shocks are not a major driver of fluctuations in
labor force participation.
The new evidence also points to an important role of nontechnology shocks for explaining
fluctuations in unemployment. The unemployment rate might overstate or understate the
1Rogerson and Shimer (2010) review the macro-labor literature that examines the implications of labor
market search frictions for business cycle fluctuations.
2For analyses of the Great Recession’s effect on labor force participation, see Aaronson et al. (2014),
Erceg and Levin (2014), and Van Zandweghe (2012).
2

depth of recessions, in terms of employment losses, depending on the mix of shocks causing
the recession. In a technology-driven recession, a rise in labor force participation would
dampen the decline in employment, so the rise in unemployment would overstate the depth
of the recession (although the productivity decline would worsen output losses). But if
the recession is caused by a demand shock, a decline in labor force participation would
exacerbate the decline in employment. Therefore, the rise in unemployment would understate
the severity of the recession.3 A large body of research has analyzed various propagation
mechanisms that can lead technology shocks to generate the large unemployment fluctuations
observed in the data. Prominent amplification mechanisms include wage rigidity (Hall,
2005; Shimer, 2005), an alternative calibration of the standard search model (Hagedorn and
Manovskii, 2008), an alternative wage bargaining mechanism (Hall and Milgrom, 2008), fixed
matching costs (Pissarides, 2009), and on-the-job search (Krause and Lubik, 2006; Menzio
and Shi, 2011). Our empirical evidence indicates that in addition to propagation mechanisms,
the nature of shocks is an important factor for explaining unemployment fluctuations.
The paper’s second contribution is to provide an economic explanation for the evidence.
We show that two straightforward extensions of the standard search model can account
for the two facts—that is, the mild procyclical behavior of labor force participation and its
countercyclical response to technology shocks. The first extension consists of incorporating a
participation choice of households, whose leisure is diminished not only by the utility cost of
employment but also by the utility cost of searching for jobs. Shimer (2013) shows that the
assumption of wage rigidity in such a model amplifies unemployment fluctuations and allows
the disutility of employment and search to be determined independently. We calibrate the
3Labor force participation and unemployment may have different drivers over the business cycle. For
example, fluctuations in labor force participation may arise largely from shocks affecting labor supply whereas
fluctuations in unemployment may be largely due to technology shocks affecting labor demand. Even so,
nontechnology shocks would affect unemployment dynamics through the effect of labor force participation
on unemployment. Elsby, Hobijn, and Sahin (2015) examine gross worker flows and find that changes in
labor force participation account for around one third of unemployment fluctuations.
3

ratio of the two disutility parameters to generate a decline in labor force participation after
a positive technology shock, the magnitude of which corresponds with our VAR evidence.
The second extension is adding discount factor shocks. The empirical finance literature has
established that discount rates vary over time (e.g. Cochrane, 2011), and we assume a portion
of this variation is exogenous to labor market fluctuations. Under our model calibration, an
expansionary discount factor shock increases labor force participation and employment, while
reducing unemployment. Moreover, discount factor shocks induce a larger response of labor
force participation in absolute value than technology shocks in the model. As a result, the
model with two shocks can generate procyclical labor force participation along with the
countercyclical response to technology shocks.
The conclusion that nontechnology shocks are an important driver of labor market fluctu-
ations is consistent with previous research. In a search model, Hall (2017) examines implica-
tions of large discount factor volatility, as inferred from the stock market, for unemployment
fluctuations and shows that the discount factor movements can account for a substantial
portion of observed unemployment fluctuations. Mortensen and Nagypal (2007) highlight a
role for job separation shocks to account for the volatility of unemployment. Furthermore,
the empirical business cycle literature views nontechnology shocks as nontrivial drivers of
cyclical fluctuations.4 Different from the previous studies, our paper provides evidence fa-
voring an important role for nontechnology shocks in explaining labor market fluctuations
based on the dynamics of labor force participation.
A small number of research papers has studied the cyclical properties of labor force par-
ticipation. Tripier (2003) and Veracierto (2008) show that real business cycle models with
unemployment and labor force participation predict a procyclical or acyclical unemployment
4In a benchmark estimated medium-scale DSGE model, Smets and Wouters (2007) attribute no more
than one third of the forecast error variance of output to neutral technology shocks. Adding labor market
search in an estimated DSGE model, Gertler, Sala, and Trigari (2008) find a similar contribution of neutral
technology shocks to the forecast error variance of output growth.
4

rate. Shimer (2013) shows that in such a model, wage rigidity can render the unemployment
rate countercylical, consistent with the U.S. data, and Tuzemen (2017) shows that allow-
ing on-the-job search can similarly generate a countercyclical unemployment rate. However,
these previous studies evaluate model predictions for labor market dynamics based on tech-
nology shocks against unconditional correlations of labor force participation and unemploy-
ment.5
Our paper is also related to the VAR literature on the response of hours worked to a
technology shock. Using long-run restrictions to identify technology shocks, Galı (1999)
showed that hours decline after a positive shock, spawning a extensive literature. We find
that labor force participation declines after a positive technology shock, regardless of whether
we use short-run or long-run identifying restrictions. The short-run restrictions lead unem-
ployment to decline more than the rise in employment, so labor force participation declines.
The long-run restrictions lead employment to decline more than the rise in unemployment,
so participation again declines. Our conclusion that technology shocks cannot be a major
source of business cycle fluctuations is similar to that of Galı (1999); however, our argument
is based on the response of labor force participation to a technology shock and does not
depend on whether such shocks are identified based on short-run or long-run restrictions.
The remainder of the paper proceeds as follows. Section 2 presents new evidence on
the dynamic behavior of labor force participation. Section 3 describes a business cycle
model with search frictions, and Section 4 provides a quantitative evaluation of the model.
Section 5 examines the robustness of the new evidence under a different identification scheme
for technology shocks. Section 6 concludes.
5A recent exception is Krusell et al. (2017), who build a heterogeneous-agent model with search frictions
and aggregate shocks to the employment arrival and separation rates to explain the cyclical properties of
gross worker flows between employment, unemployment and inactivity. Campolmi and Gnocchi (2016) and
Nucci and Riggi (2018) examine implications of endogenous labor force participation in DSGE models with
labor market search frictions and multiple shocks. The presence of nominal price rigidity and a monetary
policy rule in their models affects the propagation of shocks.
5

2 Empirical Evidence
This section presents new evidence about the response of labor force participation to a
technology shock. Estimating a structural VAR reveals that labor force participation declines
temporarily after a positive technology shock. The negative response is at odds with the
stylized fact that labor force participation is procyclical.
2.1 Dynamic responses to a technology shock
The empirical analysis uses quarterly U.S. data for productivity, labor force participation,
the unemployment rate, and employment.6 Data used in the estimation are in logarithms
and detrended prior to estimation using a Hodrick-Prescott (HP) filter with a high value
for the smoothing parameter of λ = 105, following Shimer (2005, 2013). The solid line in
Figure 1 displays the cyclical component of labor force participation. It exhibits procyclical-
ity: participation declined during and in the aftermath of each of the three recessions since
1984 before rebounding in the expansion. For comparison, the dashed line shows an alterna-
tive measure of cyclical labor force participation, which is detrended with the Congressional
Budget Office (CBO)’s estimate of the potential labor force participation rate. The CBO
carefully accounts for demographic and other trend shifts using a cohort model.7 While the
dashed line lies below the solid line, the correlation between the two series is high (0.78).
To characterize the dynamic response of labor force participation to a technology shock,
6Productivity is measured as real GDP divided by civilian employment, 16 years and over; labor force
participation is the civilian labor force participation rate, 16 years and over; the unemployment rate is the
civilian unemployment rate, 16 years and over; employment is the civilian employment-population ratio, 16
years and over. The sample period is 1952:Q1–2018:Q2.
7See Montes (2018) for details about the CBO’s methodology, which builds on the methods of Kudlyak
(2013) and Aaronson et al. (2014). The CBO’s quarterly series covers the period from 1984:Q1 to 2018:1.
6

Figure 1: The cyclical component of labor force participation.
1984 1988 1992 1996 2000 2004 2008 2012 2016Year
-3
-2
-1
0
1
2
%
Notes: The figure shows the deviation of log labor force participation from trend, which is the HP filter (the
solid line) or the CBO’s estimate of the potential labor force participation rate (the dashed line). The HP
filter uses the data series for labor force participation from 1952:Q1 to 2018:Q2 and smoothing parameter
λ = 105. Gray bars denote NBER-defined recessions.
7

we identify a structural shock to labor productivity.8 Identification of the technology shock
follows the method of Fujita and Ramey (2007).9 Accordingly, technology shocks are recov-
ered based on the identifying assumption that no other shocks affect productivity contem-
poraneously. In addition to this recursive identification scheme, the exogenous component of
productivity is recovered from the structural shocks by setting the coefficients on the lags of
other endogenous variables equal to zero in the equation for productivity. Then the impulse
responses are generated from a quasi-VAR system that relates each variable to lags of the
exogenous component of productivity, lags of the endogenous variables except productivity,
and the technology shock.10
Figure 2 shows the empirical responses to a one-standard-deviation (positive) technology
shock. Labor force participation declines on impact for about 4 quarters, then turns positive
(upper right panel). However, while the short-run decline is significantly different from zero,
the subsequent rise is not.11 Fluctuations in labor force participation reflect fluctuations
in unemployment and employment. Thus, labor force participation declines as a fall in
unemployment outweighs a rise in employment (lower panels). In absolute magnitudes, the
response of participation is smallest, the response of the unemployment rate is largest, with
an intermediate response of employment. A priori, labor force participation could rise or
fall in a boom, depending on whether fewer workers become discouraged and more choose
8We use the term technology shock as equivalent with total factor productivity shock. It is sometimes
also referred to as a neutral technology shock.
9Fujita and Ramey (2007) use cubic time polynomials to remove the trend from the time series used
in their VAR (productivity, labor market tightness, and employment). The correlation of cyclical labor
force participation obtained with their filtering procedure and the CBO’s estimate of potential labor force
participation is lower (0.19).
10The lag length of the VAR is set to two quarters based on the Schwarz criterion. However, the results
are similar based on the commonly used lag length of four quarters.
11The response of labor force participation is qualitatively unchanged when employment is dropped from
the vector of variables. Using prime-age labor force participation (ages 25 to 54) rather than the aggregate
in the estimation also produces a significant contractionary response to a technology shock in the short run.
8

Figure 2: Empirical impulse responses to a technology shock.
5 10 15 20 25 30-0.2
0
0.2
0.4
0.6
0.8
%
Productivity
5 10 15 20 25 30-0.2
-0.1
0
0.1
0.2
%
Labor Force Participation
5 10 15 20 25 30
Quarters
-8
-4
0
4
%
Unemployment Rate
5 10 15 20 25 30
Quarters
-0.2
0
0.2
0.4
0.6
%
Employment
Notes: The solid lines are impulse responses obtained by estimating a structural VAR during the period
1952:Q1–2018:Q2 on the logarithms of labor productivity, the unemployment rate, the labor force participa-
tion rate, and the employment-population ratio. The lag length of the VAR is two quarters as determined
by the Schwarz criterion. Labor productivity is measured as real GDP divided by civilian employment.
The technology shock is identified using the method of Fujita and Ramey (2007). The dashed lines are
±2-standard-deviations confidence intervals obtained from 1, 000 bootstrap replications of the VAR.
9
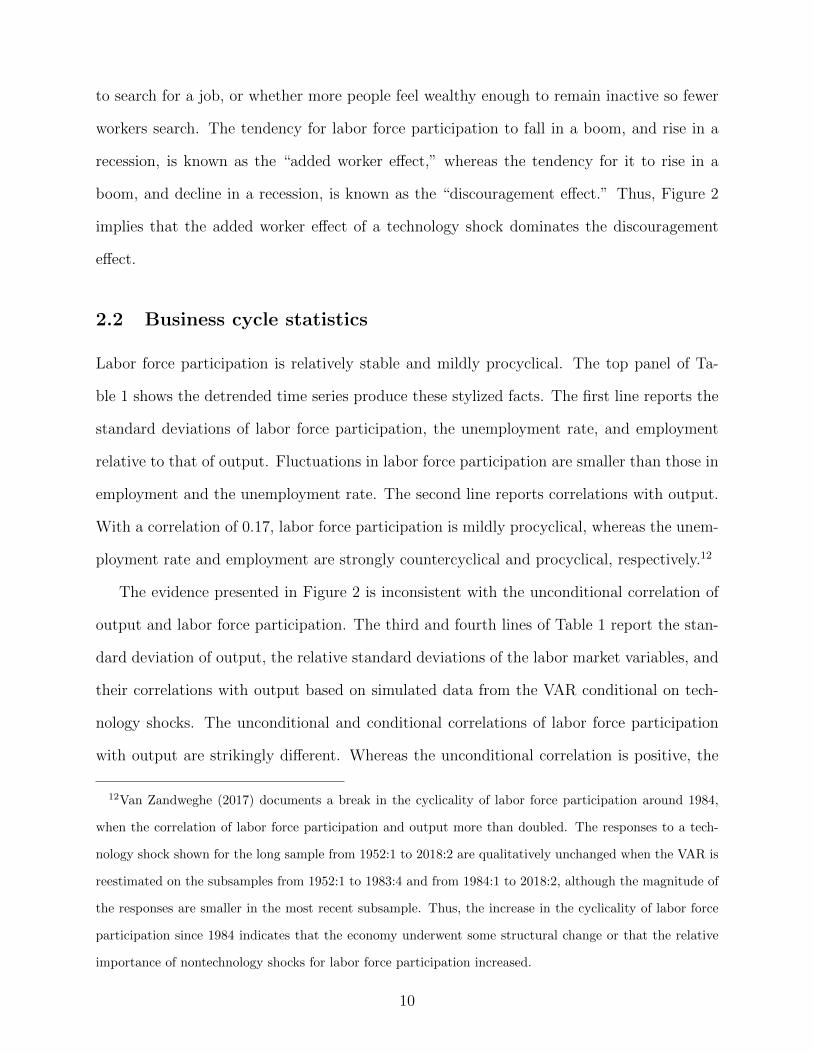
to search for a job, or whether more people feel wealthy enough to remain inactive so fewer
workers search. The tendency for labor force participation to fall in a boom, and rise in a
recession, is known as the “added worker effect,” whereas the tendency for it to rise in a
boom, and decline in a recession, is known as the “discouragement effect.” Thus, Figure 2
implies that the added worker effect of a technology shock dominates the discouragement
effect.
2.2 Business cycle statistics
Labor force participation is relatively stable and mildly procyclical. The top panel of Ta-
ble 1 shows the detrended time series produce these stylized facts. The first line reports the
standard deviations of labor force participation, the unemployment rate, and employment
relative to that of output. Fluctuations in labor force participation are smaller than those in
employment and the unemployment rate. The second line reports correlations with output.
With a correlation of 0.17, labor force participation is mildly procyclical, whereas the unem-
ployment rate and employment are strongly countercyclical and procyclical, respectively.12
The evidence presented in Figure 2 is inconsistent with the unconditional correlation of
output and labor force participation. The third and fourth lines of Table 1 report the stan-
dard deviation of output, the relative standard deviations of the labor market variables, and
their correlations with output based on simulated data from the VAR conditional on tech-
nology shocks. The unconditional and conditional correlations of labor force participation
with output are strikingly different. Whereas the unconditional correlation is positive, the
12Van Zandweghe (2017) documents a break in the cyclicality of labor force participation around 1984,
when the correlation of labor force participation and output more than doubled. The responses to a tech-
nology shock shown for the long sample from 1952:1 to 2018:2 are qualitatively unchanged when the VAR is
reestimated on the subsamples from 1952:1 to 1983:4 and from 1984:1 to 2018:2, although the magnitude of
the responses are smaller in the most recent subsample. Thus, the increase in the cyclicality of labor force
participation since 1984 indicates that the economy underwent some structural change or that the relative
importance of nontechnology shocks for labor force participation increased.
10
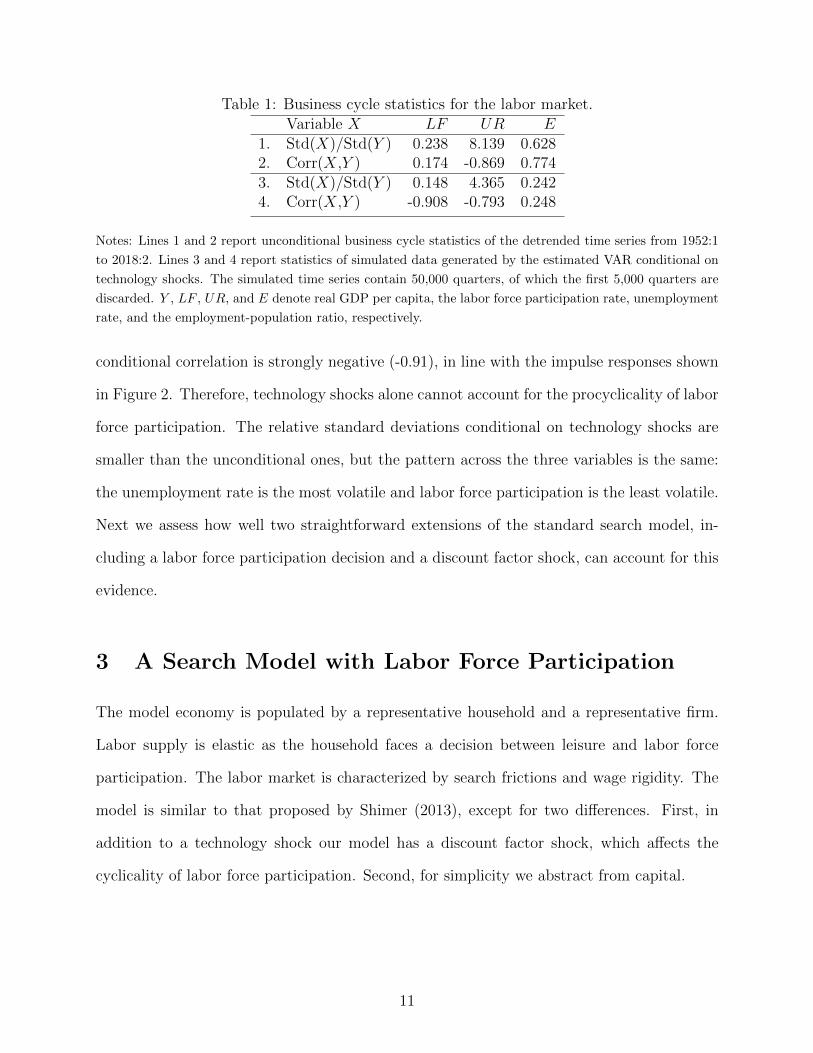
Table 1: Business cycle statistics for the labor market.Variable X LF UR E
1. Std(X)/Std(Y ) 0.238 8.139 0.6282. Corr(X,Y ) 0.174 -0.869 0.7743. Std(X)/Std(Y ) 0.148 4.365 0.2424. Corr(X,Y ) -0.908 -0.793 0.248
Notes: Lines 1 and 2 report unconditional business cycle statistics of the detrended time series from 1952:1
to 2018:2. Lines 3 and 4 report statistics of simulated data generated by the estimated VAR conditional on
technology shocks. The simulated time series contain 50,000 quarters, of which the first 5,000 quarters are
discarded. Y , LF , UR, and E denote real GDP per capita, the labor force participation rate, unemployment
rate, and the employment-population ratio, respectively.
conditional correlation is strongly negative (-0.91), in line with the impulse responses shown
in Figure 2. Therefore, technology shocks alone cannot account for the procyclicality of labor
force participation. The relative standard deviations conditional on technology shocks are
smaller than the unconditional ones, but the pattern across the three variables is the same:
the unemployment rate is the most volatile and labor force participation is the least volatile.
Next we assess how well two straightforward extensions of the standard search model, in-
cluding a labor force participation decision and a discount factor shock, can account for this
evidence.
3 A Search Model with Labor Force Participation
The model economy is populated by a representative household and a representative firm.
Labor supply is elastic as the household faces a decision between leisure and labor force
participation. The labor market is characterized by search frictions and wage rigidity. The
model is similar to that proposed by Shimer (2013), except for two differences. First, in
addition to a technology shock our model has a discount factor shock, which affects the
cyclicality of labor force participation. Second, for simplicity we abstract from capital.
11

3.1 Representative household
The representative household consists of a large number of family members with identical
preferences over consumption and leisure. Each member is infinitely lived, has a subjective
discount factor β ∈ (0, 1), and maximizes expected utility. Each period a household member
is either employed, unemployed, or inactive, incurring a disutility of γn > 0, γu > 0, or zero,
respectively. The household maximizes expected utility
E0
∞∑t=0
βtedt (lnCt − γnNt − γuUt) .
Here Et is the rational expectations operator, edt is a shock to the discount factor, Ct denotes
per-capita consumption, Nt is the employment-population ratio, and Ut is the unemployment-
population ratio in period t. The optimization is subject to the household’s budget constraint
Ct = WtNt, where Wt is the wage rate, and to the employment accumulation constraint
Nt+1 = (1− s)Nt + ftUt, (1)
where s ∈ (0, 1) is the constant job separation rate and ft is the job finding rate. Unemployed
workers who find a job begin working in the next period. The assumption that family
members insure each other against variations in labor income was introduced by Merz (1995)
and is common in business cycle models of labor search. The discount factor shock follows
a stochastic process
ln edt = ρd ln edt−1 + εdt , εdt ∼ N(0, σ2d). (2)
Household optimization yields the equilibrium condition for labor force participation:
γuCtft
= βEtCtCt+1
edt+1
edt
[Wt+1 − γnCt+1 + (1− s)γuCt+1
ft+1
]. (3)
This condition requires that the expected cost of assigning a nonemployed household member
to search for a job is equal to the expected benefit. The expected cost is the product of the
per-period flow disutility of unemployment, in consumption terms, and the time until a job
is found. The expected benefit of job search consists of the present value of the future
12

wage net off the disutility of labor once employed, and the foregone future search cost.
The household applies a stochastic discount factor to evaluate today’s search cost against
tomorrow’s benefit.13
3.2 Representative firm
The representative firm produces output Yt using a labor-only technology to maximize the
present value of its profits
E0
∞∑j=0
βjCtCt+j
edt+jedt
(Yt −WtNt) ,
subject to the production function
Yt = At(Nt − Vt) (4)
and the firm’s employment accumulation constraint
Nt+1 = (1− s)Nt + qtVt. (5)
Here, Vt is the number of employees allocated to recruiting, so Nt−Vt is the number of workers
allocated to production, and qt is the number of new hires per recruiter, or the recruiter
efficiency. The technology level At undergoes stochastic shocks along a deterministic trend
g, that is At = gteat , where
ln eat = ρa ln eat−1 + εat , εat ∼ N(0, σ2a). (6)
Firm optimization yields the equilibrium condition for recruiting:
Atqt
= βEtCtCt+1
edt+1
edt
[At+1 −Wt+1 + (1− s) At+1
qt+1
], (7)
13While U.S. data show large monthly worker flows from inactivity to employment, the household in the
model cannot allocate inactive members directly to employment. We leave this extension of the model for
future work.
13
which balances the expected cost and benefit of recruiting a worker for the firm. The expected
cost is the foregone marginal product of labor of a recruiter multiplied by the time needed to
fill a vacancy. The expected benefit of recruiting consists of the present value of the future
marginal product of the worker net off the wage once a job is filled, and the foregone future
recruiting cost. For this intertemporal decision the firm applies the household’s stochastic
discount factor.
3.3 Labor market and equilibrium
Job searchers and recruiters meet in the labor market according to the matching function
Mt = µU ξt V
1−ξt , (8)
where ξ ∈ (0, 1) is the unemployment elasticity of the matching function and Mt is the
number of new worker-job matches. Once an unemployed worker and a recruiter meet they
determine the worker’s wage, which splits the surplus of the match between the worker and
the firm. Following Shimer (2005, 2013) and Hall (2005), we assume that wages are rigid.
Specifically, wages, Wt, may adjust partially to a target wage, W ∗t , as follows:
Wt = (1− ρ)W ∗t + ρgWt−1, (9)
where ρ ∈ [0, 1] is the degree of wage rigidity. The target wage is the outcome of Nash
bargaining, so it is an average of the marginal product of labor and the marginal rate
of substitution between consumption and leisure, with a weight η ∈ (0, 1) denoting the
bargaining power of workers:
W ∗t = ηAt + (1− η)γnCt. (10)
If wages are flexible—that is, ρ = 0—a technology shock raises the wage, consumption, and
output in proportion to the level of technology, whereas employment, unemployment, the
job finding rate, the number of recruiters, and the recruiter efficiency remain constant. This
14

reflects the offsetting effects of the income and substitution effects of a technology shock on
labor supply, as discussed by Blanchard and Galı (2010) and Shimer (2010) in models with a
constant labor force. Thus, the same property extends to the model with endogenous labor
force participation.14 Consequently, wage rigidity will play a key role for the propagation of
technology shocks in the model.
Labor market clearing requires equality of the household’s and firm’s accumulation con-
straints, so
ftUt = qtVt = Mt. (11)
The unemployment rate is defined as ut = Ut/LFt, where LFt = Nt + Ut is the labor force
participation rate. Goods market clearing implies
Yt = Ct. (12)
Competitive equilibrium consists of equations (1) − (12). We solve the model by first
writing the equilibrium conditions in terms of detrended output, yt = Yt/gt, the detrended
wage, wt = Wt/gt, and the detrended target wage, w∗t = W ∗
t /gt, and then deriving a log-
linear approximation of the equilibrium conditions for the detrended variables around the
balanced-growth path.
4 Quantitative Results
We calibrate the model and evaluate its empirical performance by the dynamic responses
to a technology shock and by the results of simulation conditional on technology shocks
and discount factor shocks. The successful model reproduces two facts. First, labor force
14An increase in consumption following a technology shock raises the cost of job search, as shown by the
left hand side of Equation (3); this is the negative income effect. However, the increase in consumption also
raises the benefit of job search as shown by the right hand side, which reflects the positive substitution effect.
With the household’s preferences and the absence of capital in the model, the two effects exactly offset each
other.
15

participation is mildly procyclical, as established by the business cycle literature. Second,
technology shocks produce a countercyclical response of labor force participation, as docu-
mented in Section 2.
4.1 Calibration
The model is calibrated to monthly frequency, and the calibration is summarized in Table 2.
The parameter values in the top panel of the table are taken from Shimer (2013). The value
for the subjective discount factor, β, translates to 4.7 percent annually, and the growth
rate of technology, g, amounts to 2.2 percent per year. The value for s is the average exit
probability from employment to unemployment. The value for q is based on evidence that
a recruiter can attract about 25 workers per quarter, or 8.33 per month. The labor force
along the balanced-growth path is set at 0.6. Although the labor force participation rate in
the U.S. appears to exhibit trend movements, the value of LF does not affect the model’s
business cycle predictions. The efficiency level of the matching function, µ, is chosen to
target a long-run unemployment rate of u = 0.05. Then, on the balanced-growth path the
job finding rate equals f = 0.646, employment equals N = 0.57, the number of recruiters
equals V = 0.0023, and the detrended wage rate is w = 0.9954.
Table 2: Calibration of parameters in the monthly model.β Subjective discount factor 0.996g Long-run growth rate of technology 1.0018s Separation rate 0.034q Long-run recruiter efficiency 8.33LF Long-run labor force 0.6µ Efficiency of the matching function 2.3197ξ Unemployment elasticity of matching function 0.5η Bargaining power 0.5ρ Degree of wage rigidity 1
ρd Persistence of discount factor shock 0.91/3
ρa Persistence of technology shock 0.951/3
σd Standard deviation of discount factor shock 0.03σa Standard deviation of technology shock 0.00032
16

Wage rigidity is important for the dynamics of labor force participation in the model. As
mentioned before, the case of flexible wages (ρ = 0) is unable to account for the dynamic
responses of employment, unemployment, and labor force participation to a technology shock.
Thus, we focus on the case of wage rigidity (ρ = 1). A key distinction between these cases
is in their implications for the disutility parameters γn and γu, as demonstrated by Shimer
(2013). With flexible wages set by Nash bargaining, the value of γn can be determined by the
wage equation on the balanced-growth path, and the value of γu can in turn be determined
by the condition for labor force participation on the balanced-growth path. Under our
calibration, the disutility of job search is an order of magnitude smaller than the disutility
of work (specifically, γn = 1.746 and γu = 0.137). If ρ = 1, however, the wage equation
(10) is absent from the model, leaving the two parameters undetermined. We set the ratio
r = γu/γn so as to produce a countercyclical response of labor force participation to a
technology shock that matches the conditional volatility of labor force participation to that
observed in the VAR (0.148). This yields a value r = 0.577, so job search is only about half
as unpleasant as employment. As Shimer (2013) points out, a relatively high disutility of
job search is consistent with survey evidence that unemployed workers spend only a small
fraction of their time searching for jobs.15 The levels of γn and γu are then determined by
the balanced-growth condition for labor force participation: γn = 1.696 and γu = 0.977.
The bottom panel of Table 2 presents the calibration of the shock processes. The value
of ρd is close to and between the values estimated by Smets and Wouters (2003), Galı and
Rabanal (2004), and Ireland (2004), and the value of ρa is standard in the real business
cycle literature. For the standard deviations, the value of σd is between the values estimated
15Krueger and Mueller (2010) examine the American Time Use Survey and report that unemployed workers
spend only about 32 minutes per day on job search. Based on a slightly longer sample period, Campolmi
and Gnocchi (2016) report a number of 23 minutes per day.
17

by Galı and Rabanal (2004) and Ireland (2004).16 The value of σa is chosen to match the
standard deviation of output conditional on a technology shock in the model with that in
the VAR (0.007).
4.2 Impulse responses analysis
The left column of Figure 3 shows dynamic responses of labor force participation, the un-
employment rate, and employment to a one-standard-deviation (positive) technology shock
generated by the calibrated model. Monthly responses of the model variables have been ag-
gregated to quarterly frequency. Consistent with the VAR evidence in Figure 2, labor force
participation declines modestly, the unemployment rate declines sharply, and employment
rises. All else equal, a smaller value of r than the calibrated one would generate a more neg-
ative response of labor force participation, whereas the response would become less negative
and eventually even positive for higher values of r. Thus, Figure 3 demonstrates that the
search model under a reasonable calibration is able to reproduce the empirical responses of
labor force participation, the unemployment rate, and employment to a technology shock.
Given the impulse responses to a technology shock, whether the search model can also
replicate the unconditional volatilities and correlations of the labor market variables will de-
pend on their responses to a discount factor shock. The right column of Figure 3 shows that
an expansionary one-standard-deviation discount factor shock increases labor force partici-
pation along with employment, whereas the unemployment rate declines. Thus, the discount
factor shock induces procyclical behavior of labor force participation. Moreover, the response
of labor force participation to the discount factor shock is larger than the response to the
technology shock in absolute value. The relatively strong response of labor force participation
16Of these empirical studies, Galı and Rabanal (2004) and Ireland (2004) estimate a consumption prefer-
ence shock. Smets and Wouters (2003) estimate a discount factor shock, but their estimate of the shock’s
standard deviation is not comparable to our calibrated value due to a normalization of the shock in their
estimation procedure.
18

Figure 3: Model impulse responses.
Technology shock Discount factor shock
0 10 20 30 40-0.05
-0.04
-0.03
-0.02
-0.01
0
%
Labor Force Participation
0 10 20 30 40-5
-4
-3
-2
-1
0
%
Unemployment Rate
0 10 20 30 40
Quarters
0
0.05
0.1
0.15
0.2
%
Employment
0 10 20 30 400
0.02
0.04
0.06
0.08
0.1
%
Labor Force Participation
0 10 20 30 40-1.5
-1
-0.5
0
0.5
%
Unemployment Rate
0 10 20 30 40
Quarters
0
0.05
0.1
0.15
0.2
%
Employment
Notes: The left column shows the impulse responses to a technology shock obtained with the calibrated
search model. The right column shows the impulse responses to a discount factor shock.
19

to discount factor shocks indicates that the procyclical response of labor force participation
to such shocks can dominate the countercyclical response to technology shocks.17
To see why the response of labor force participation to a technology shock or discount
factor shock depends on the ratio of disutilities, r, we simplify the labor force participation
condition (3) by dividing both sides by Ct:
γuft
= βEtedt+1
edt
[Wt+1
Ct+1
− γn + (1− s) γuft+1
].
This equilibrium condition requires the expected cost of job search expressed in terms of
utility to equal its expected benefit. For the sake of intuition we consider the household’s
labor force participation decision when γu is small or large, where those magnitudes should
be interpreted as relative to the size of γn.
Consider first the effects of a positive technology shock. The ensuing increase in hiring
raises the job finding rate ft, thus lowering the expected cost of job search. For small
(large) values of γu, the rise in the job finding rate will induce a small (large) decline in
the expected cost of job search, since D(γu/ft) = −γu/f 2t . Assuming wages are rigid, the
persistent shock also lowers the expected benefit of job search by reducing the future marginal
utility of consumption, 1/Ct+1, and raising the future job finding rate, ft+1. The effect of the
job finding rate on the foregone future search cost—the second component of the expected
benefit of job search—also depends on the value of γu. However, because the expected
benefit consists of two components, it is less sensitive to the value of γu than the expected
cost. Therefore, if the value of γu is small, the shock tends to induce a small decline in
the expected cost of job search relative to the decline in the expected benefit. Then, as
the expected cost exceeds the expected benefit the household reduces the number of job
searchers, which boosts the job finding rate until the expected cost equals the expected
benefit. Labor force participation declines. Conversely, if γu is large, the expected cost of
17Consistent with the predictions of our calibrated model, the calibrated DSGE model of Campolmi and
Gnocchi (2016) produces a modest decline in labor force participation following a positive technology shock,
and a larger increase in participation following an expansionary preference shock.
20
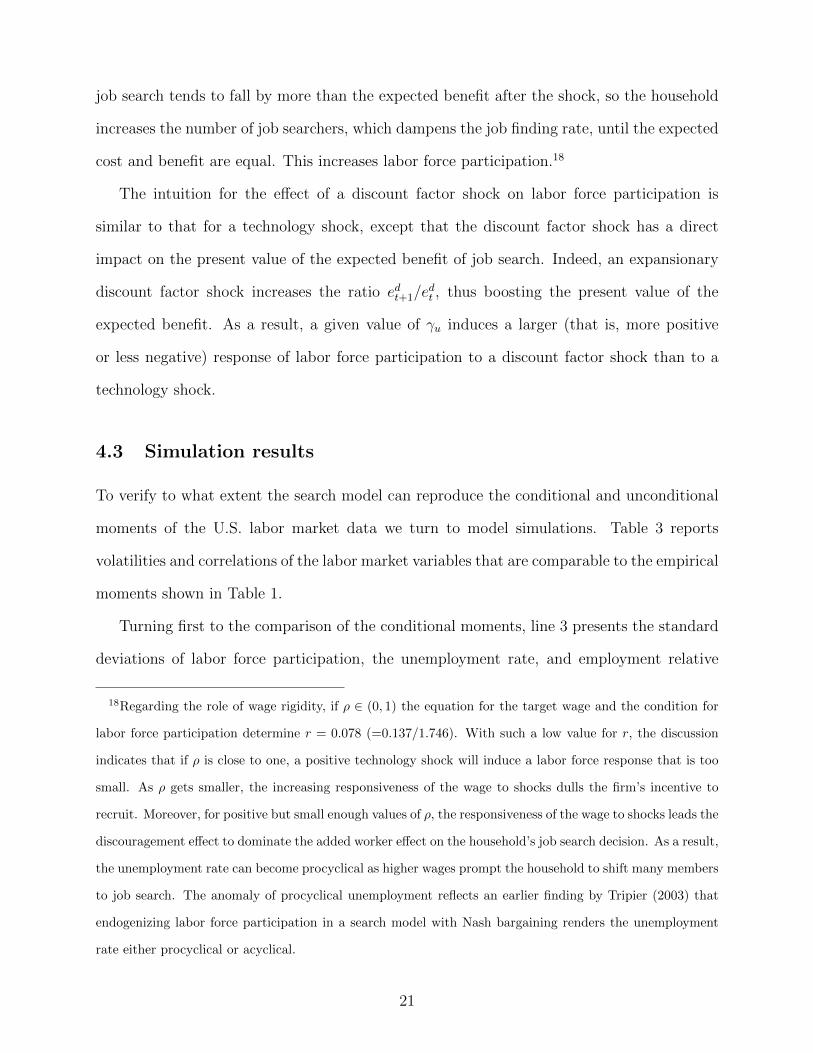
job search tends to fall by more than the expected benefit after the shock, so the household
increases the number of job searchers, which dampens the job finding rate, until the expected
cost and benefit are equal. This increases labor force participation.18
The intuition for the effect of a discount factor shock on labor force participation is
similar to that for a technology shock, except that the discount factor shock has a direct
impact on the present value of the expected benefit of job search. Indeed, an expansionary
discount factor shock increases the ratio edt+1/edt , thus boosting the present value of the
expected benefit. As a result, a given value of γu induces a larger (that is, more positive
or less negative) response of labor force participation to a discount factor shock than to a
technology shock.
4.3 Simulation results
To verify to what extent the search model can reproduce the conditional and unconditional
moments of the U.S. labor market data we turn to model simulations. Table 3 reports
volatilities and correlations of the labor market variables that are comparable to the empirical
moments shown in Table 1.
Turning first to the comparison of the conditional moments, line 3 presents the standard
deviations of labor force participation, the unemployment rate, and employment relative
18Regarding the role of wage rigidity, if ρ ∈ (0, 1) the equation for the target wage and the condition for
labor force participation determine r = 0.078 (=0.137/1.746). With such a low value for r, the discussion
indicates that if ρ is close to one, a positive technology shock will induce a labor force response that is too
small. As ρ gets smaller, the increasing responsiveness of the wage to shocks dulls the firm’s incentive to
recruit. Moreover, for positive but small enough values of ρ, the responsiveness of the wage to shocks leads the
discouragement effect to dominate the added worker effect on the household’s job search decision. As a result,
the unemployment rate can become procyclical as higher wages prompt the household to shift many members
to job search. The anomaly of procyclical unemployment reflects an earlier finding by Tripier (2003) that
endogenizing labor force participation in a search model with Nash bargaining renders the unemployment
rate either procyclical or acyclical.
21

to that of output, and line 4 presents the correlations with output. The relative standard
deviation of labor force participation matches its empirical counterpart as this statistic was
the calibration target for the ratio of disutilities, r. The model predicts larger volatility of
the unemployment rate and employment conditional on technology shocks than is evident
from the VAR. Thus, the volatility of labor force participation is considerably smaller than
that of employment, consistent with the VAR evidence. As for the correlations, the model
generates strongly countercyclical labor force participation, a strongly countercyclical unem-
ployment rate, and strongly procyclical employment. While the correlation of employment
is larger than its counterpart from the VAR, the correlations of labor force participation and
unemployment are close to the VAR-based ones. Note that, although the calibration of r
ensured a decline (rise) in labor force participation following a positive (negative) technology
shock, the strongly negative correlation that is close to its empirical counterpart is a result
delivered by the calibrated model.
Table 3: Business cycle statistics of the model.Variable X LF UR E
1. Std(X)/Std(Y ) 0.365 17.515 0.9752. Corr(X,Y ) 0.285 -0.941 0.9993. Std(X)/Std(Y ) 0.148 20.445 0.9464. Corr(X,Y ) -0.856 -0.997 1.000
Notes: Lines 1 and 2 report business cycle statistics generated by simulating the calibrated model with
technology shocks and discount factor shocks. Lines 3 and 4 report statistics of data generated by simulating
the calibrated model conditional on technology shocks only. The simulations comprise 5,000 histories of
798 months each. Each monthly series is aggregated to quarterly frequency and detrended with the HP
filter (λ = 105). Y , LF , UR, and E denote output, labor force participation, the unemployment rate, and
employment, respectively.
Lines 1 and 2 of Table 3 present the unconditional volatilities and correlations predicted
by the model. While the relative standard deviations are all higher than their empirical
counterparts in Table 1, the model generates a fairly small standard deviation of labor force
participation. Consistent with the evidence, the volatility of labor force participation is
less than half that of employment. Furthermore, the model successfully replicates the mildly
22

procyclical labor force participation rate along with a strongly countercyclical unemployment
rate and strongly procyclical employment.
The results also highlight that the two shocks have differing effects on the unemployment
rate. While the conditional and unconditional volatilities of employment in the model are
similar, the conditional volatility of the unemployment rate is larger than the unconditional
one. This reflects that employment gains driven by technology shocks are accompanied by
relatively large declines in unemployment, as labor force participation falls. In contrast, em-
ployment gains driven by discount factor shocks are accompanied by relatively small declines
in unemployment aided by increased labor force participation. Thus, the countercyclical re-
sponse of labor force participation to a technology shock leads the unemployment rate to
overstate the downturn or upturn in employment, whereas the procyclical response of labor
force participation to a discount factor shock leads the unemployment rate to understate the
movements in employment.
In sum, while the calibrated model overpredicts the volatilities of labor market variables
relative to output, it successfully generates a smaller volatility of labor force participation
than of employment. The model also successfully generates the countercyclical response of
labor force participation to technology shocks along with its overall mild procyclical behavior.
5 Long-run identifying restrictions
The evidence in Section 2 is based on short-run identifying restrictions for the technology
shock. An alternative identification method for the structural technology shock imposes
long-run restrictions.19 Blanchard and Quah (1989), who pioneered this method, found that
unemployment rises after a positive permanent shock to output. Using the same identification
19Christiano, Eichenbaum, and Vigfusson (2007) provide an econometric argument in favor of short-run
restrictions. They assess structural VARs and find that they perform well when identification is based
on short-run restrictions, but that sampling uncertainty associated with estimated impulse responses is
substantially larger based on long-run restrictions.
23

Figure 4: Empirical impulse responses to a technology shock: long-run identifying restric-tions.
5 10 15 20 25 30-0.2
0
0.2
0.4
0.6
0.8
%
Productivity Growth
5 10 15 20 25 30-0.2
-0.1
0
0.1
%
Labor Force Participation
5 10 15 20 25 30
Quarters
-4
-2
0
2
4
%
Unemployment Rate
5 10 15 20 25 30
Quarters
-0.4
-0.2
0
0.2
%
Employment
Notes: The solid lines are impulse responses obtained by estimating a structural VAR during the period
1952:Q1–2018:Q2 on the logarithm of the first difference of labor productivity and the logarithms of the
unemployment rate, the labor force participation rate, and the employment-population ratio. The lag length
of the VAR is two quarters as determined by the Schwarz criterion. Labor productivity is measured as real
GDP divided by civilian employment. The technology shock is identified using the method of Blanchard
and Quah (1989). The dashed lines are ±2-standard-deviations confidence intervals obtained from 1, 000
bootstrap replications of the VAR.
24

scheme, Galı (1999) showed that hours worked decline after a positive technology shock.
Though the finding of a contractionary effect of technology shocks proved controversial,
Fernald (2007) showed that it is a robust finding once the low-frequency movements are
removed from productivity growth prior to estimation of the VAR.20
To check the robustness of our empirical finding for labor force participation, we estimate
a VAR on the first difference of productivity and the levels of labor force participation, the
unemployment rate, and employment. As before, variables are detrended using the low-
frequency HP filter. The logarithm of productivity is differenced before the trend is removed
from the differenced series, in line with Fernald’s (2007) recommendation of removing the
low-frequency movements from productivity growth. The structural technology shock is
recovered via the identifying assumption that no other shocks affect productivity in the long
run.
A technology shock that permanently raises productivity produces a rise in the unem-
ployment rate and a decline in employment in the short run, as shown in Figure 4. This
is consistent with the findings of Galı (1999), Fernald (2007), and others. Labor force par-
ticipation declines in the short run, in line with its response in the main empirical result
displayed in Figure 2. Thus, our new empirical finding is robust to whether technology shocks
are identified with short-run or long-run restrictions. In the case of long-run restrictions,
participation declines as the effect of the decline in employment outweighs the effect of the
rise in the unemployment rate. In both cases, however, the results indicate that in the short
run, the added worker effect of a technology shock on labor force participation outweighs
the discouragement effect.
Our search model with labor force participation appears at odds with the positive effect
of technology shocks on unemployment obtained with long-run restrictions. The evidence
obtained with the long-run restrictions may call for an extension of the model that incorpo-
20Basu, Fernald, and Kimball (2006) construct an alternative measure of technology change and confirm
the contractionary effect of technology improvements.
25

rates nominal price rigidities, as Galı (1999) points out. Such an extended model would allow
only a minor role for technology shocks, because it would have to reconcile (i) the procyclical
response of unemployment to a technology shock with the countercyclicality of unemploy-
ment, and (ii) the countercyclical response of labor force participation to a technology shock
with the procyclicality of labor force participation.
6 Conclusion
This paper has presented new evidence based on VAR analysis that labor force participation
declines in the short run following a positive technology shock. The highly countercyclical
response of labor force participation to a technology shock contrasts with the well docu-
mented mild procyclical behavior of labor force participation in the business cycle. The
paper also showed that a search model of the labor market that incorporates a participation
choice can interpret the evidence. A positive technology shock temporarily reduces labor
force participation under a reasonable calibration, whereas discount factor shocks induce a
procyclical response of labor force participation. As a result, the model can generate both
the countercyclical response to technology shocks and the procyclical behavior. The evidence
that labor force participation declines after the technology shock is obtained regardless of
whether the shock is identified with short-run or long-run identifying restrictions.
Our results indicate nontechnology shocks play an important role in explaining labor
market fluctuations. The vast labor market search literature based on the ideas of Diamond
(1982) and Mortensen and Pissarides (1994) focuses primarily on technology shocks as the
sole driving force of labor market fluctuations. The technology-driven view reflects the real
business cycle model that dominated business cycle research at the time the search model
was developed, but the business cycle literature has since moved on to consider a variety of
other shocks. Our paper indicates that considering other shocks for explaining labor market
fluctuations is a promising avenue for future research based on search models.
26

References
[1] Aaronson, Stephanie, Tomaz Cajner, Bruce Fallick, Felix Galbis-Reig, Christopher
Smith, and William Wascher (2014), “Labor force participation: recent developments
and future prospects,” Brookings Papers on Economic Activity, 2014(2), 197-275.
[2] Blanchard, Olivier, and Jordi Galı (2010), “Labor markets and monetary policy: A New
Keynesian model with unemployment,” American Economic Journal: Macroeconomics,
2(2), 1-30.
[3] Blanchard, Olivier J., and Danny Quah (1989), “The dynamic effectts of aggregate
demand and supply disturbances,” American Economic Review, 79(4), 655-673.
[4] Basu, Susanto, John G. Fernald, and Miles S. Kimball (2006), “Are technology improve-
ments contractionary?” American Economic Review, 96(5), 1418-1448.
[5] Campolmi, Alessia, and Stefano Gnocchi (2016), “Labor market participation, unem-
ployment, and monetary policy,” Journal of Monetary Economics, 79, 17-29.
[6] Christiano, Lawrence J., Martin Eichenbaum, and Robert Vigfusson, “Assessing struc-
tural VARs,” in NBER Macroeconomics Annual 2006, D. Acemoglu, K. Rogoff, and M.
Woodford (Eds), MIT Press, 2007.
[7] Cochrane, John H. (2011), “Presidential Address: Discount Rates,” Journal of Finance
66(4), 1047-1108.
[8] Diamond, Peter (1982), “Aggregate demand management in search equilibrium,” Jour-
nal of Political Economy, 90(5), 881-894.
[9] Elsby, Michael W.L., Bart Hobijn, and Aysegul Sahin (2015), “On the importance of the
participation margin for labor market fluctuations,” Journal of Monetary Economics,
72, 64-82.
27

[10] Erceg, Christopher J, and Andrew T. Levin (2014), “Labor force participation and
monetary policy in the wake of the Great Recession,” Journal of Money, Credit and
Banking, 46(2), 3-49.
[11] Fernald, John (2007), “Trend breaks, long-run restrictions, and contractionary technol-
ogy shocks,” Journal of Monetary Economics, 54, 2467-2485.
[12] Fujita, Shigeru, and Garey Ramey (2007), “Job matching and propagation,” Journal of
Economic Dynamics and Control, 31, 3671-3698.
[13] Galı, Jordi, and Pau Rabanal, “Technology shocks and aggregate fluctuations: How well
does the real business cycle model fit postwar U.S. data,” in NBER Macroeconomics
Annual 2004, M. Gertler, and K. Rogoff (Eds), MIT Press, 2005.
[14] Galı, Jordi (1999), “Technology, employment, and the business cycle: do technology
shocks explain aggregate fluctuations?” American Economic Review, 89(1), 249-271.
[15] Gertler, Mark, Luca Sala, and Antonella Trigari (2008), “An estimated monetary DSGE
model with unemployment and staggered nominal wage bargaining,” Journal of Money,
Credit and Banking, 40(8), 1713-1764.
[16] Hall, Robert E. (2017), “High discounts and high unemployment,” American Economic
Review, 107(2), 305-330.
[17] Hall, Robert E. (2005), “Employment fluctuations with equilibrium wage stickiness,”
American Economic Review, 95(1), 50-65.
[18] Hall, Robert E., and Paul R. Milgrom (2008), “The limited influence of unemployment
on the wage bargain,” American Economic Review, 98(4), 1653-1674.
[19] Ireland, Peter N. (2004), “Technology shocks in the New Keynesian model, Review of
Economics and Statistics, 86(4), 923-936.
28

[20] Krause, Michael U., and Thomas A. Lubik (2006), “The cyclical upgrading of labor and
on-the-job search,” Labour Economics, 13, 459-477.
[21] Krueger, Alan B, and Andreas Mueller (2010), “Job search and unemployment insur-
ance: New evidence from time use data,” Journal of Public Economics, 94, 298-307.
[22] Krusell, Per, Toshihiko Mukoyama, Richard Rogerson, and Aysegul Sahin (2017),
“Gross worker flows over the business cycle,” American Economic Review, 107(11),
3447-3476.
[23] Kudlyak, Marianna (2013), “A cohort model of labor force participation,” Federal Re-
serve Bank of Richmond, Economic Quarterly, 99(1), 25-54.
[24] Menzio, Guido, and Shouyong Shi (2011), “Efficient search on the job and the business
cycle,” Journal of Political Economy, 119(3), 468-510.
[25] Merz, Monica (1995), “Search in the labor market and the real business cycle,” Journal
of Monetary Economics, 36, 269-300.
[26] Mortensen, Dale T., and Eva Nagypal (2007), “More on unemployment and vacancy
fluctuations,” Review of Economic Dynamics, 10, 327-347.
[27] Mortensen, Dale T., and Christopher A. Pissarides (1994), “Job creation and job de-
struction in the theory of unemployment,” Review of Economic Studies, 61, 397-415.
[28] Nucci, Francesco, and Marianna Riggi (2018), “Labor force participation, wage rigidi-
ties, and inflation,” Journal of Macroeconomics, 55, 274-292.
[29] Montes, Joshua (2018), “CBO’s projection of labor force participation rates,” Congres-
sional Budget Office, Working Paper 2018-04.
[30] Pissarides, Christopher A. (2009), “The unemployment volatility puzzle: is wage stick-
iness the answer? Econometrica, 77(5), 1339-1369.
29

[31] Rogerson, Richard, and Robert Shimer, “Search in macroeconomic models of the labor
market,” Chapter 7 in Handbook of Labor Economics, Volume 4A, O. Ashenfelter, and
D. Card (Eds), Elsevier, 2010.
[32] Shimer, Robert, “Job search, labor-force participation, and wage rigidities,” in Advances
in Economics and Econometrics, Tenth World Congress, Volume II: Applied Economics,
D. Acemoglu, M. Arellano, and E. Dekel (Eds), Cambridge University Press, 2013.
[33] Shimer, Robert, “Labor markets and business cycles,” Princeton University Press, 2010.
[34] Shimer, Robert (2005), “The cyclical behavior of equilibrium unemployment and va-
cancies,” American Economic Review, 95(1), 25-49.
[35] Smets, Frank, and Raf Wouters (2007), “Shocks and frictions in US business cycles: A
Bayesian DSGE approach,” American Economic Review, 97(3), 586-606.
[36] Smets, Frank, and Raf Wouters (2003), “An estimated dynamic stochastic general equi-
librium model of the euro area,” Journal of the European Economic Association, 1(5),
1123-1175.
[37] Tripier, Fabien (2003), “Can the labor market search model explain the fluctuations of
allocations of time? Economic Modelling, 21, 131-146.
[38] Tuzemen, Didem (2017), “Labor market dynamics with endogenous labor force partic-
ipation and on-the-job search,” Journal of Economic Dynamics and Control, 75, 28-51.
[39] Van Zandweghe, Willem (2017), “The changing cyclicality of labor force participation,”
Federal Reserve Bank of Kansas City, Economic Review, Third quarter, 5-33.
[40] Van Zandweghe, Willem (2012), “Interpreting the recent decline in labor force partici-
pation,” Federal Reserve Bank of Kansas City, Economic Review, First quarter, 5-34.
[41] Veracierto, Marcelo (2008), “On the cyclical behavior of employment, unemployment
and labor force participation,” Journal of Monetary Economics, 55, 1143-1157.
30