the dar es salaam stock exchange plc … quarterly newslet… · the dar es salaam stock exchange...
TRANSCRIPT
THE DAR ES SALAAM STOCK EXCHANGE PLC C r e a t i n g O p p o r t u n i t i e s
ISSN No. 0856 8448 ISSUE No. 71 SEPTEMBER, 2016UARTERLY UPDATE
THE DAR ES SALAAM STOCK EXCHANGE PLC - QUARTERLY UPDATE
CEO’s MEssagE
Greetings!
Market depth (measured by market capitalisation) from domestic listed companies and liquidity (trading turnover) increased during the quarter. Market liquidity increased by 11 percent, from TZS 102 billion in Q2, 2016 to TZS 113 billion during this quarter (Q3, 2016). Domestic market capitalisation increased by 4 percent from TZS TZS 7,912 billion by end of June 2016 to TZS 8,103 billion by 30th September 2016, this was a result of both DSE listing its shares as well as the increase in prices on some of the counters. The DSE Index also increased by 4 percent from 3,706.15 points as of June 2016 to 3,855.90 points as of 30th September 2016.
On the other hand the total market capitalisation and TSI (the index that tracks performance of all listed companies) decreased by one percentage point from a market cap of TZS 21,729 billion to a market cap of TZS 21,580 billion TSI moving from 2,481.99 points to 2,477.24 points. The slight de-crease can be linked to the lesser than anticipated global growth in trading and investment activities, the collapse of commodity prices that affected some of commodity-reliance African countries, as well as rising debt for many African economies. The shock of global risk aversion sparked by Brexit is also a factor into all this, these fundamental and sentimental based factors were on top of portfolio investors as they contemplate and make decisions in entry of continuance existence or committing to new investments in Africa. This, in a rather indirect manner affects the Exchanges activities.
On the valuation aspect: Weighted Average market Price Earnings (PE) Ratio for domestic listed companies was trailing at 13.18 times as of September 2016 compared with the trailing PE ratio of 14.12 times during the end of Q2, 2016. The trailing weighted average dividend yield was 4.8 percent compared to 4.7 percent in the previous quarter.
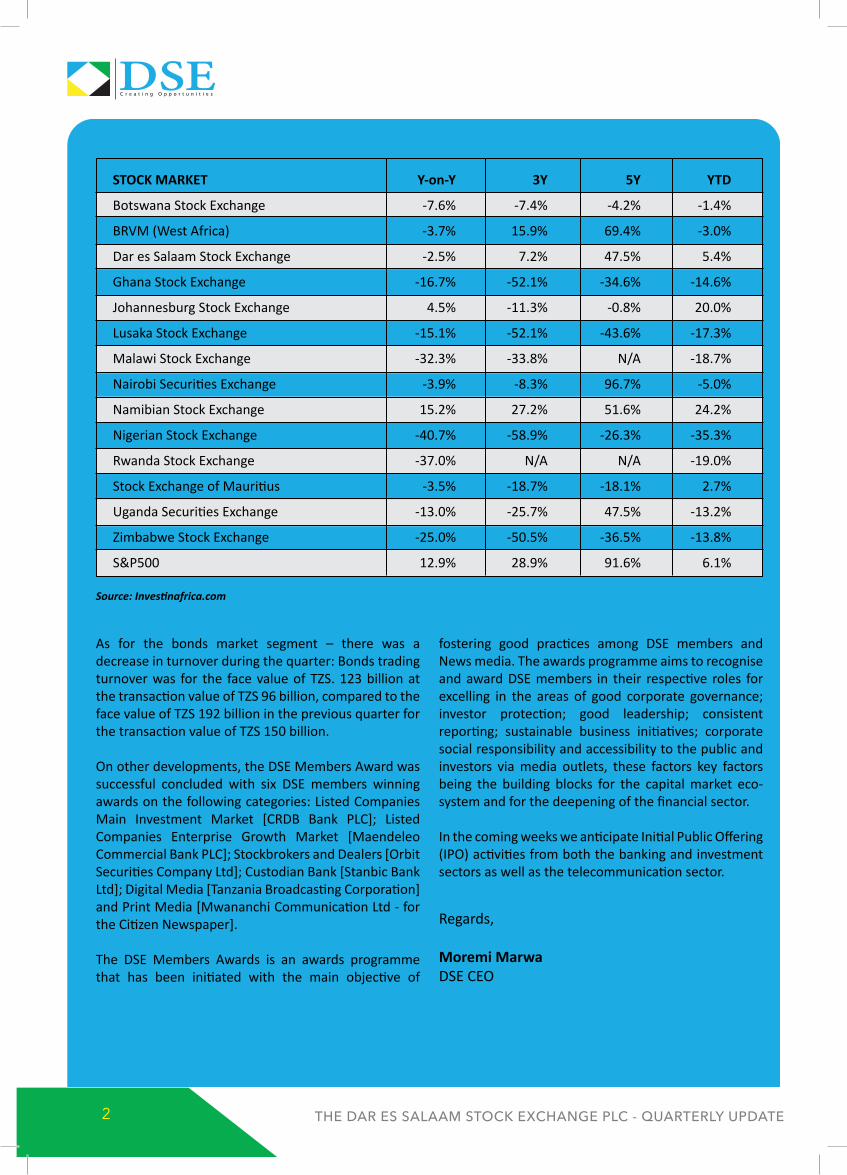
Relative to other selected stock markets in Africa, the index performance in US Dollar Adjusted Returns as reported by InvestinAfrica.net are as follows:
1
INSIDE
CEO’s MEssagE
ECOnOMiC rEviEwa) interest rate Trend
MarkET rEpOrTa. EquitiesB. Bonds
nEw LisTings
sTraTEgiC DEvELOpMEnTaLMaTTErs
invEsTOr EDuCaTiOn & puBLiC awarEnEss iniTiaTivEs
COrpOraTE aCTiOns
sTaTisTiCs & CharTs
12
3
45
6
78
C r e a t i n g O p p o r t u n i t i e s
THE DAR ES SALAAM STOCK EXCHANGE PLC - QUARTERLY UPDATE2
As for the bonds market segment – there was a decrease in turnover during the quarter: Bonds trading turnover was for the face value of TZS. 123 billion at the transaction value of TZS 96 billion, compared to the face value of TZS 192 billion in the previous quarter for the transaction value of TZS 150 billion.
On other developments, the DSE Members Award was successful concluded with six DSE members winning awards on the following categories: Listed Companies Main Investment Market [CRDB Bank PLC]; Listed Companies Enterprise Growth Market [Maendeleo Commercial Bank PLC]; Stockbrokers and Dealers [Orbit Securities Company Ltd]; Custodian Bank [Stanbic Bank Ltd]; Digital Media [Tanzania Broadcasting Corporation] and Print Media [Mwananchi Communication Ltd - for the Citizen Newspaper].
The DSE Members Awards is an awards programme that has been initiated with the main objective of
fostering good practices among DSE members and News media. The awards programme aims to recognise and award DSE members in their respective roles for excelling in the areas of good corporate governance; investor protection; good leadership; consistent reporting; sustainable business initiatives; corporate social responsibility and accessibility to the public and investors via media outlets, these factors key factors being the building blocks for the capital market eco-system and for the deepening of the financial sector.
In the coming weeks we anticipate Initial Public Offering (IPO) activities from both the banking and investment sectors as well as the telecommunication sector.
Regards,
Moremi MarwaDSE CEO
Source: Investinafrica.com
STOCK MARKET Y-on-Y 3Y 5Y YTD
Botswana Stock Exchange -7.6% -7.4% -4.2% -1.4%
BRVM (West Africa) -3.7% 15.9% 69.4% -3.0%
Dar es Salaam Stock Exchange -2.5% 7.2% 47.5% 5.4%
Ghana Stock Exchange -16.7% -52.1% -34.6% -14.6%
Johannesburg Stock Exchange 4.5% -11.3% -0.8% 20.0%
Lusaka Stock Exchange -15.1% -52.1% -43.6% -17.3%
Malawi Stock Exchange -32.3% -33.8% N/A -18.7%
Nairobi Securities Exchange -3.9% -8.3% 96.7% -5.0%
Namibian Stock Exchange 15.2% 27.2% 51.6% 24.2%
Nigerian Stock Exchange -40.7% -58.9% -26.3% -35.3%
Rwanda Stock Exchange -37.0% N/A N/A -19.0%
Stock Exchange of Mauritius -3.5% -18.7% -18.1% 2.7%
Uganda Securities Exchange -13.0% -25.7% 47.5% -13.2%
Zimbabwe Stock Exchange -25.0% -50.5% -36.5% -13.8%
S&P500 12.9% 28.9% 91.6% 6.1%
C r e a t i n g O p p o r t u n i t i e s
THE DAR ES SALAAM STOCK EXCHANGE PLC - QUARTERLY UPDATE 3
2) Economic rEviEw
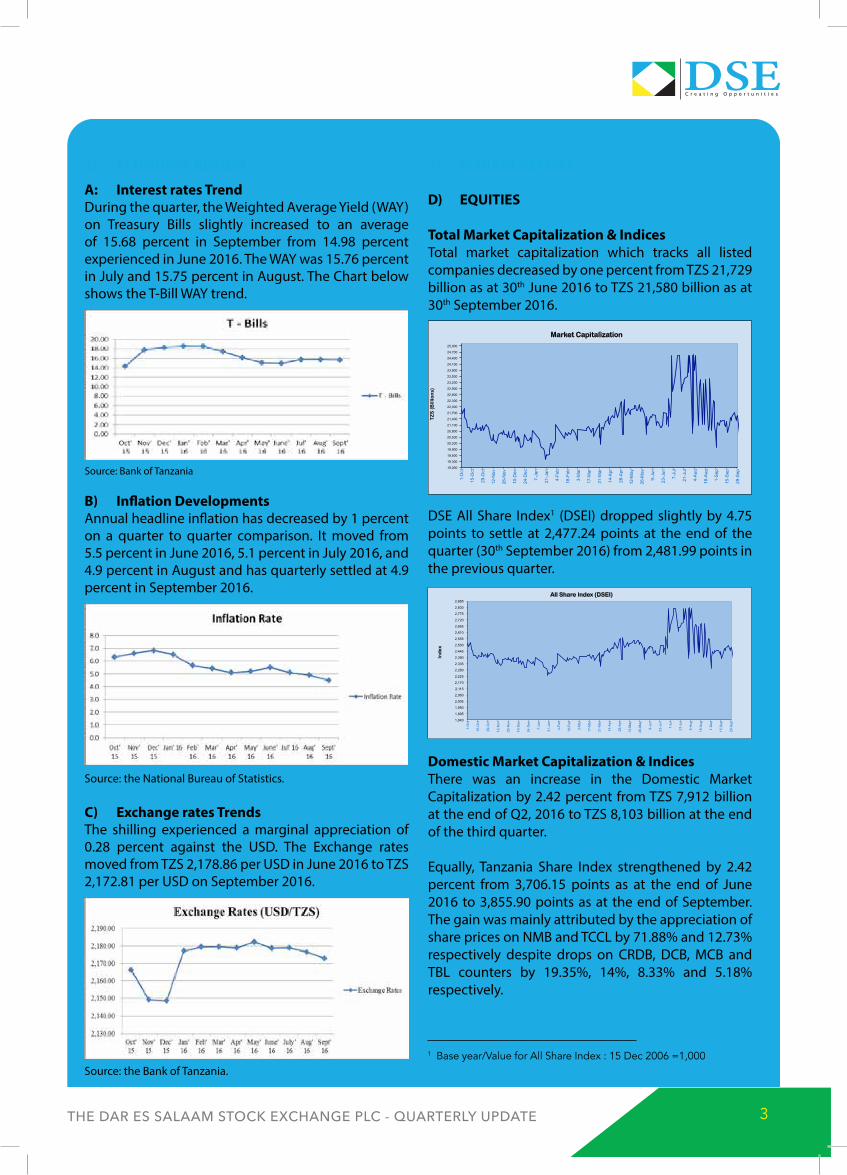
A: interest rates Trend During the quarter, the Weighted Average Yield (WAY) on Treasury Bills slightly increased to an average of 15.68 percent in September from 14.98 percent experienced in June 2016. The WAY was 15.76 percent in July and 15.75 percent in August. The Chart below shows the T-Bill WAY trend.
B) inflation DevelopmentsAnnual headline inflation has decreased by 1 percent on a quarter to quarter comparison. It moved from 5.5 percent in June 2016, 5.1 percent in July 2016, and 4.9 percent in August and has quarterly settled at 4.9 percent in September 2016.
Source: the National Bureau of Statistics.
c) Exchange rates TrendsThe shilling experienced a marginal appreciation of 0.28 percent against the USD. The Exchange rates moved from TZS 2,178.86 per USD in June 2016 to TZS 2,172.81 per USD on September 2016.
3) mArKET rEPorT
D) EQUiTiES
Total market capitalization & indicesTotal market capitalization which tracks all listed companies decreased by one percent from TZS 21,729 billion as at 30th June 2016 to TZS 21,580 billion as at 30th September 2016.
DSE All Share Index1 (DSEI) dropped slightly by 4.75 points to settle at 2,477.24 points at the end of the quarter (30th September 2016) from 2,481.99 points in the previous quarter.
Domestic market capitalization & indicesThere was an increase in the Domestic Market Capitalization by 2.42 percent from TZS 7,912 billion at the end of Q2, 2016 to TZS 8,103 billion at the end of the third quarter.
Equally, Tanzania Share Index strengthened by 2.42 percent from 3,706.15 points as at the end of June 2016 to 3,855.90 points as at the end of September. The gain was mainly attributed by the appreciation of share prices on NMB and TCCL by 71.88% and 12.73% respectively despite drops on CRDB, DCB, MCB and TBL counters by 19.35%, 14%, 8.33% and 5.18% respectively.
1 Base year/Value for All Share Index : 15 Dec 2006 =1,000
Source: Bank of Tanzania
Source: the Bank of Tanzania.
1,840
1,895
1,950
2,005
2,060
2,115
2,170
2,225
2,280
2,335
2,390
2,445
2,500
2,555
2,610
2,665
2,720
2,775
2,830
2,885
1-O
ct
15-O
ct
29-O
ct
12-N
ov
26-N
ov
10-D
ec
24-D
ec
7-Ja
n
21-J
an
4-Fe
b
18-F
eb
3-M
ar
17-M
ar
31-M
ar
14-A
pr
28-A
pr
12-M
ay
26-M
ay
9-Ju
n
23-J
un
7-Ju
l
21-J
ul
4-A
ug
18-A
ug
1-S
ep
15-S
ep
29-S
ep
Inde
x
All Share Index (DSEI)
19,000
19,300
19,600
19,900
20,200
20,500
20,800
21,100
21,400
21,700
22,000
22,300
22,600
22,900
23,200
23,500
23,800
24,100
24,400
24,700
25,000
1-O
ct
15-O
ct
29-O
ct
12-N
ov
26-N
ov
10-D
ec
24-D
ec
7-Ja
n
21-J
an
4-Fe
b
18-F
eb
3-M
ar
17-M
ar
31-M
ar
14-A
pr
28-A
pr
12-M
ay
26-M
ay
9-Ju
n
23-J
un
7-Ju
l
21-J
ul
4-A
ug
18-A
ug
1-S
ep
15-S
ep
29-S
ep
TZS
(Bill
ions
)
Market Capitalization
C r e a t i n g O p p o r t u n i t i e s
THE DAR ES SALAAM STOCK EXCHANGE PLC - QUARTERLY UPDATE4
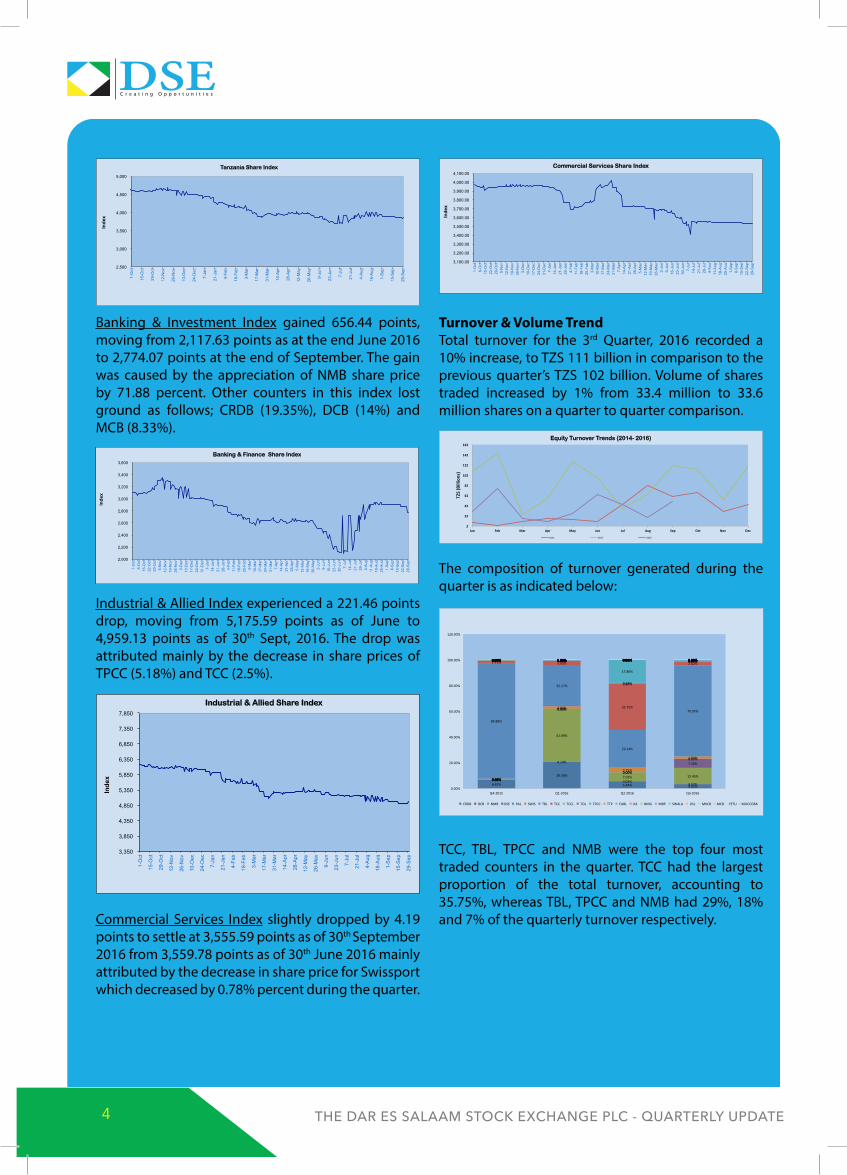
Banking & Investment Index gained 656.44 points, moving from 2,117.63 points as at the end June 2016 to 2,774.07 points at the end of September. The gain was caused by the appreciation of NMB share price by 71.88 percent. Other counters in this index lost ground as follows; CRDB (19.35%), DCB (14%) and MCB (8.33%).
Industrial & Allied Index experienced a 221.46 points drop, moving from 5,175.59 points as of June to 4,959.13 points as of 30th Sept, 2016. The drop was attributed mainly by the decrease in share prices of TPCC (5.18%) and TCC (2.5%).
Commercial Services Index slightly dropped by 4.19 points to settle at 3,555.59 points as of 30th September 2016 from 3,559.78 points as of 30th June 2016 mainly attributed by the decrease in share price for Swissport which decreased by 0.78% percent during the quarter.
Turnover & volume TrendTotal turnover for the 3rd Quarter, 2016 recorded a 10% increase, to TZS 111 billion in comparison to the previous quarter’s TZS 102 billion. Volume of shares traded increased by 1% from 33.4 million to 33.6 million shares on a quarter to quarter comparison.
The composition of turnover generated during the quarter is as indicated below:
TCC, TBL, TPCC and NMB were the top four most traded counters in the quarter. TCC had the largest proportion of the total turnover, accounting to 35.75%, whereas TBL, TPCC and NMB had 29%, 18% and 7% of the quarterly turnover respectively.
2,500
3,000
3,500
4,000
4,500
5,000
1-O
ct
15-O
ct
29-O
ct
12-N
ov
26-N
ov
10-D
ec
24-D
ec
7-Ja
n
21-J
an
4-Fe
b
18-F
eb
3-M
ar
17-M
ar
31-M
ar
14-A
pr
28-A
pr
12-M
ay
26-M
ay
9-Ju
n
23-J
un
7-Ju
l
21-J
ul
4-A
ug
18-A
ug
1-S
ep
15-S
ep
29-S
ep
Inde
x
Tanzania Share Index
2,000
2,200
2,400
2,600
2,800
3,000
3,200
3,400
3,600
1-O
ct
8-O
ct
15-O
ct
22-O
ct
29-O
ct
5-N
ov
12-N
ov
19-N
ov
26-N
ov
3-D
ec
10-D
ec
17-D
ec
24-D
ec
31-D
ec
7-Ja
n 14
-Jan
21
-Jan
28
-Jan
4-
Feb
11-F
eb
18-F
eb
25-F
eb
3-M
ar
10-M
ar
17-M
ar
24-M
ar
31-M
ar
7-A
pr
14-A
pr
21-A
pr
28-A
pr
5-M
ay
12-M
ay
19-M
ay
26-M
ay
2-Ju
n 9-
Jun
16-J
un
23-J
un
30-J
un
7-Ju
l 14
-Jul
21
-Jul
28
-Jul
4-
Aug
11
-Aug
18
-Aug
25
-Aug
1-
Sep
8-
Sep
15
-Sep
22
-Sep
29
-Sep
Inde
x
Banking & Finance Share Index
3,350
3,850
4,350
4,850
5,350
5,850
6,350
6,850
7,350
7,850
1-O
ct
15-O
ct
29-O
ct
12-N
ov
26-N
ov
10-D
ec
24-D
ec
7-Ja
n
21-J
an
4-Fe
b
18-F
eb
3-M
ar
17-M
ar
31-M
ar
14-A
pr
28-A
pr
12-M
ay
26-M
ay
9-Ju
n
23-J
un
7-Ju
l
21-J
ul
4-A
ug
18-A
ug
1-S
ep
15-S
ep
29-S
ep
Inde
x
Industrial & Allied Share Index
3,100.00
3,200.00
3,300.00
3,400.00
3,500.00
3,600.00
3,700.00
3,800.00
3,900.00
4,000.00
4,100.00
1-O
ct
8-O
ct
15-O
ct
22-O
ct
29-O
ct
5-N
ov
12-N
ov
19-N
ov
26-N
ov
3-D
ec
10-D
ec
17-D
ec
24-D
ec
31-D
ec
7-Ja
n 14
-Jan
21
-Jan
28
-Jan
4-
Feb
11-F
eb
18-F
eb
25-F
eb
3-M
ar
10-M
ar
17-M
ar
24-M
ar
31-M
ar
7-A
pr
14-A
pr
21-A
pr
28-A
pr
5-M
ay
12-M
ay
19-M
ay
26-M
ay
2-Ju
n 9-
Jun
16-J
un
23-J
un
30-J
un
7-Ju
l 14
-Jul
21
-Jul
28
-Jul
4-
Aug
11
-Aug
18
-Aug
25
-Aug
1-
Sep
8-
Sep
15
-Sep
22
-Sep
29
-Sep
Inde
x
Commercial Services Share Index
2
22
42
62
82
102
122
142
162
Jan Feb Mar Apr May Jun Jul Aug Sep Oct Nov Dec
TZS(Billions)
Equity Turnover Trends (2014- 2016)
2014 2015 2016
6.62%
20.56%
5.44% 3.31%
0.08%
0.14%
0.03%0.03%
0.38%
41.09%
7.02% 12.45%0.00%
0.00%
0.00%
7.20%
0.00%
0.00%
0.00%
0.00%
0.40%
2.05%
3.75%
1.83%
89.88%
32.17%
29.24%
70.95%
1.71% 3.03%
35.75%
2.82%0.57% 0.45%
0.30%
0.29%0.03% 0.09%
0.63%
0.57%0.27% 0.36%
17.80%
0.54%0.00% 0.00% 0.00% 0.00%0.00% 0.00% 0.00% 0.00%0.00% 0.00% 0.00% 0.00%0.00% 0.00% 0.00% 0.00%0.00% 0.02% 0.03% 0.00%0.02% 0.00% 0.00% 0.00%0.00% 0.00% 0.00% 0.00%0.03% 0.04% 0.00% 0.01%0.00% 0.00% 0.01% 0.00%0.00% 0.00% 0.00%0.00% 0.00%
0.00%
20.00%
40.00%
60.00%
80.00%
100.00%
120.00%
Q4-2015 Q1-2016 Q2-2016 Q3-2016
CRDB DCB NMB DSE PAL SWIS TBL TCC TCCL TOL TPCC TTP EABL KA NMG MBP SWALA USL MKCB MCB YETU MUCCOBA
C r e a t i n g O p p o r t u n i t i e s
THE DAR ES SALAAM STOCK EXCHANGE PLC - QUARTERLY UPDATE 5
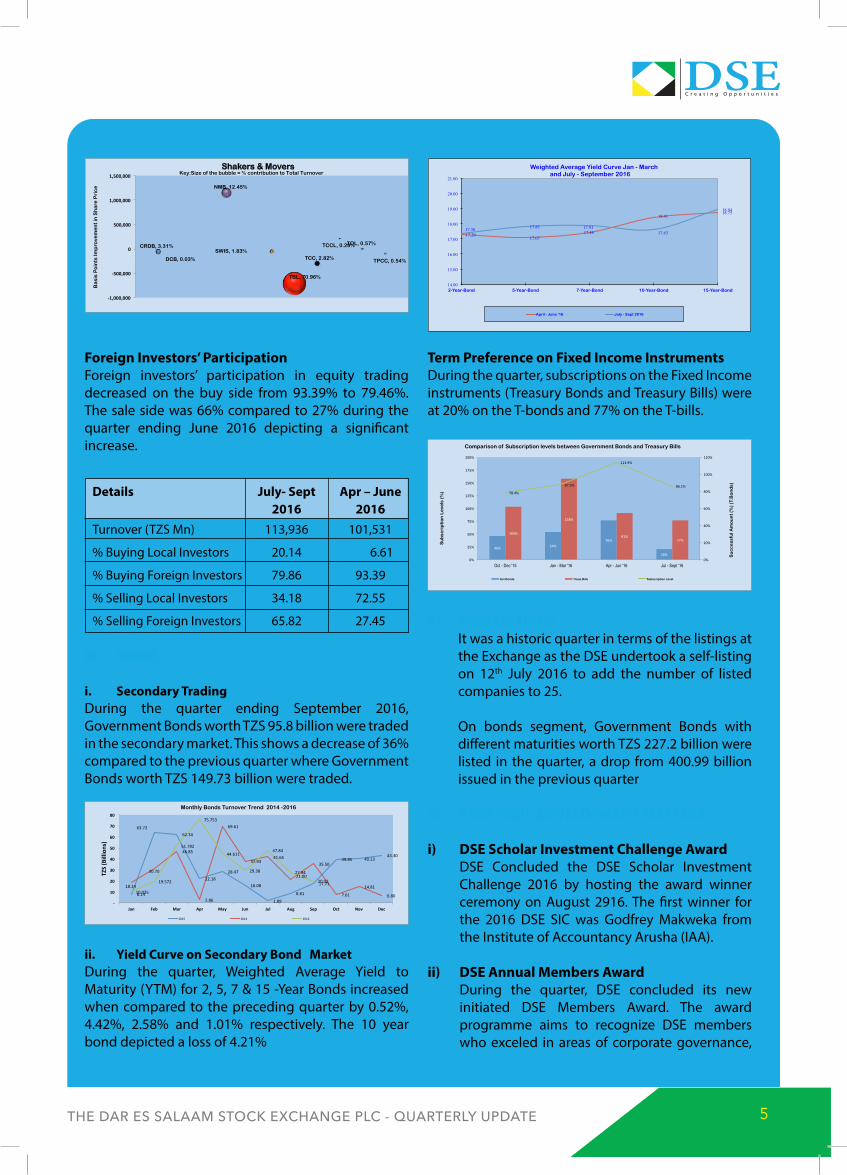
Foreign investors’ ParticipationForeign investors’ participation in equity trading decreased on the buy side from 93.39% to 79.46%. The sale side was 66% compared to 27% during the quarter ending June 2016 depicting a significant increase.
Details July- Sept Apr – June 2016 2016Turnover (TZS Mn) 113,936 101,531
% Buying Local Investors 20.14 6.61
% Buying Foreign Investors 79.86 93.39
% Selling Local Investors 34.18 72.55
% Selling Foreign Investors 65.82 27.45
B) BonDS
i. Secondary TradingDuring the quarter ending September 2016, Government Bonds worth TZS 95.8 billion were traded in the secondary market. This shows a decrease of 36% compared to the previous quarter where Government Bonds worth TZS 149.73 billion were traded.
ii. Yield curve on Secondary Bond marketDuring the quarter, Weighted Average Yield to Maturity (YTM) for 2, 5, 7 & 15 -Year Bonds increased when compared to the preceding quarter by 0.52%, 4.42%, 2.58% and 1.01% respectively. The 10 year bond depicted a loss of 4.21%
Term Preference on Fixed income instrumentsDuring the quarter, subscriptions on the Fixed Income instruments (Treasury Bonds and Treasury Bills) were at 20% on the T-bonds and 77% on the T-bills.
4) nEw LiSTinGSIt was a historic quarter in terms of the listings at the Exchange as the DSE undertook a self-listing on 12th July 2016 to add the number of listed companies to 25.
On bonds segment, Government Bonds with different maturities worth TZS 227.2 billion were listed in the quarter, a drop from 400.99 billion issued in the previous quarter
5) STrATEGic DEvELoPmEnT mATTErS
i) DSE Scholar investment challenge AwardDSE Concluded the DSE Scholar Investment Challenge 2016 by hosting the award winner ceremony on August 2916. The first winner for the 2016 DSE SIC was Godfrey Makweka from the Institute of Accountancy Arusha (IAA).
ii) DSE Annual members AwardDuring the quarter, DSE concluded its new initiated DSE Members Award. The award programme aims to recognize DSE members who exceled in areas of corporate governance,
CRDB, 3.31%
DCB, 0.03%
NMB, 12.45%
SWIS, 1.83%
TBL, 70.96%
TCC, 2.82%
TCCL, 0.29% TOL, 0.57%
TPCC, 0.54%
-1,000,000
-500,000
0
500,000
1,000,000
1,500,000
Ba
sis
Po
ints
Imp
rove
me
nt
in S
ha
re P
ric
e
Shakers & Movers Key:Size of the bubble = % contribution to Total Turnover
8.14
63.7262.34
22.1828.47
16.08
1.89
8.81
17.71
39.85 40.1343.30
18.24
30.70
46.85
2.86
69.61
37.9341.65
21.00
35.50
7.61
14.81
6.8010.035
19.572
51.782
75.753
44.611
29.38
47.84
27.94
20.02
-
10
20
30
40
50
60
70
80
Jan Feb Mar Apr May Jun Jul Aug Sep Oct Nov Dec
TZS(Billions)
Monthly Bonds Turnover Trend 2014 -2016
2015 2014 2016
17.29 17.07
17.46
18.41 18.75
17.38 17.83 17.91 17.63
18.94
14.00
15.00
16.00
17.00
18.00
19.00
20.00
21.00
2-Year-Bond 5-Year-Bond 7-Year-Bond 10-Year-Bond 15-Year-Bond
Weighted Average Yield Curve Jan - March and July - September 2016
April - June '16 July - Sept 2016
46% 54%76%
20%
103%
158%
91%77%
78.4%
87.5%
113.9%
86.1%
0%
20%
40%
60%
80%
100%
120%
0%
25%
50%
75%
100%
125%
150%
175%
200%
Oct - Dec '15 Jan - Mar '16 Apr - Jun '16 Jul - Sept '16
Su
cc
ess
ful A
mo
un
t (%
) (T
.Bo
nd
s)
Su
bsc
rip
tio
n L
eve
ls (
%)
Comparison of Subscription levels between Government Bonds and Treasury Bills
Gvt Bonds Treas.Bills Subscription Level
C r e a t i n g O p p o r t u n i t i e s
THE DAR ES SALAAM STOCK EXCHANGE PLC - QUARTERLY UPDATE6
investor protection, social responsibility, consistent reporting and accessibility to the public via media outlets.
6) invESTor EDUcATion & PUBLic AwArEnESS iniTiATivES
i) Public AwarenessDSE made visits to sixteen Universities and colleges as part of the sensitization campaign ahead of the Annually DSE Scholar Investor Challenge; the Challenge was closed on 30th June with a participation rate of 3,200 students.
ii) Student visitsDSE hosted students from the Loyola, Ashira and Tusiime Secondary School.
7) corPorATE AcTionS AnD comPAnY PUBLicATionS
Swissport Tanzania PLc announced an interim dividend of TZS 120.06 per share (TZS 154.84 per share in the year 2015).
Tanzania Portland cement company announced an interim dividend of TZS 120 per share, an increase of 26% from TZS 95 in the year 2015.
C r e a t i n g O p p o r t u n i t i e s
THE DAR ES SALAAM STOCK EXCHANGE PLC - QUARTERLY UPDATE 7
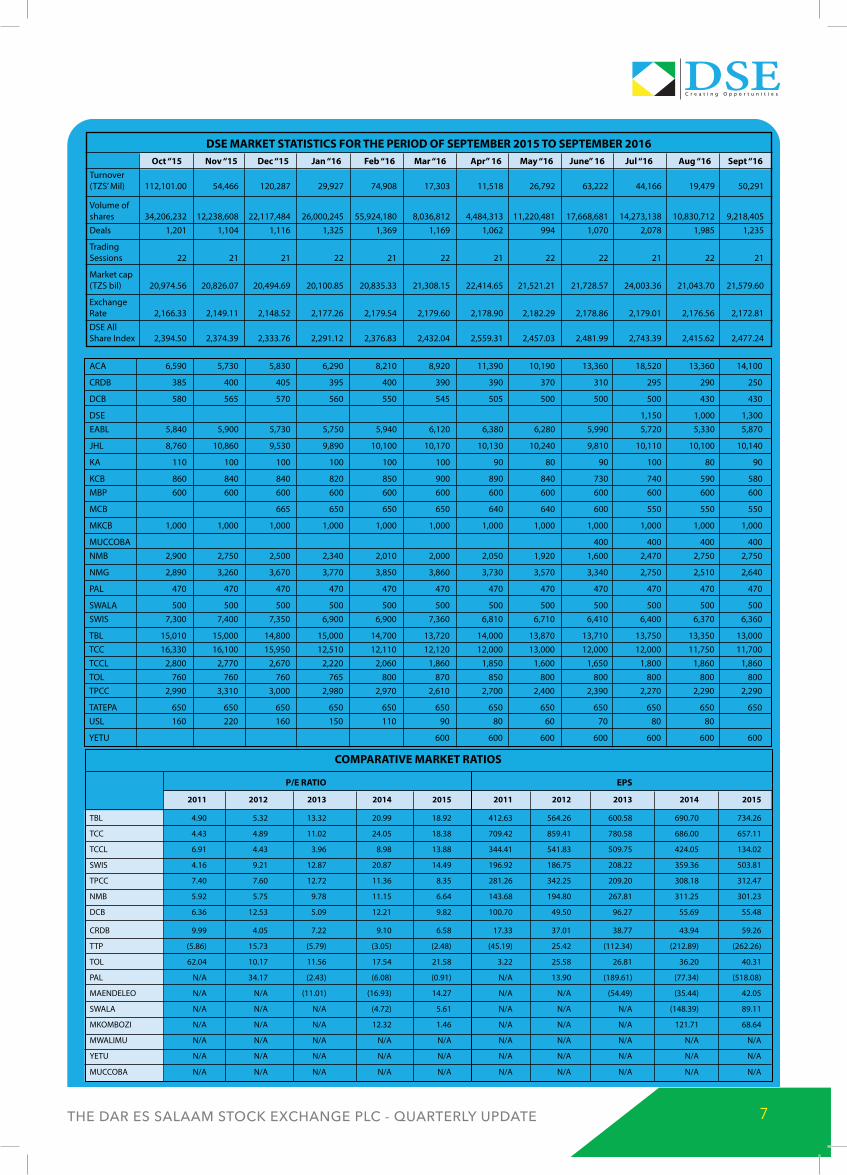
DSE mArKET STATiSTicS For THE PErioD oF SEPTEmBEr 2015 To SEPTEmBEr 2016 oct “15 nov “15 Dec “15 Jan “16 Feb “16 mar “16 Apr” 16 may “16 June” 16 Jul “16 Aug “16 Sept “16Turnover (TZS’ Mil) 112,101.00 54,466 120,287 29,927 74,908 17,303 11,518 26,792 63,222 44,166 19,479 50,291
Volume of shares 34,206,232 12,238,608 22,117,484 26,000,245 55,924,180 8,036,812 4,484,313 11,220,481 17,668,681 14,273,138 10,830,712 9,218,405 Deals 1,201 1,104 1,116 1,325 1,369 1,169 1,062 994 1,070 2,078 1,985 1,235
Trading Sessions 22 21 21 22 21 22 21 22 22 21 22 21
Market cap (TZS bil) 20,974.56 20,826.07 20,494.69 20,100.85 20,835.33 21,308.15 22,414.65 21,521.21 21,728.57 24,003.36 21,043.70 21,579.60
Exchange Rate 2,166.33 2,149.11 2,148.52 2,177.26 2,179.54 2,179.60 2,178.90 2,182.29 2,178.86 2,179.01 2,176.56 2,172.81 DSE All Share Index 2,394.50 2,374.39 2,333.76 2,291.12 2,376.83 2,432.04 2,559.31 2,457.03 2,481.99 2,743.39 2,415.62 2,477.24
ACA 6,590 5,730 5,830 6,290 8,210 8,920 11,390 10,190 13,360 18,520 13,360 14,100
CRDB 385 400 405 395 400 390 390 370 310 295 290 250
DCB 580 565 570 560 550 545 505 500 500 500 430 430
DSE 1,150 1,000 1,300 EABL 5,840 5,900 5,730 5,750 5,940 6,120 6,380 6,280 5,990 5,720 5,330 5,870
JHL 8,760 10,860 9,530 9,890 10,100 10,170 10,130 10,240 9,810 10,110 10,100 10,140
KA 110 100 100 100 100 100 90 80 90 100 80 90
KCB 860 840 840 820 850 900 890 840 730 740 590 580 MBP 600 600 600 600 600 600 600 600 600 600 600 600
MCB 665 650 650 650 640 640 600 550 550 550
MKCB 1,000 1,000 1,000 1,000 1,000 1,000 1,000 1,000 1,000 1,000 1,000 1,000
MUCCOBA 400 400 400 400 NMB 2,900 2,750 2,500 2,340 2,010 2,000 2,050 1,920 1,600 2,470 2,750 2,750
NMG 2,890 3,260 3,670 3,770 3,850 3,860 3,730 3,570 3,340 2,750 2,510 2,640
PAL 470 470 470 470 470 470 470 470 470 470 470 470
SWALA 500 500 500 500 500 500 500 500 500 500 500 500 SWIS 7,300 7,400 7,350 6,900 6,900 7,360 6,810 6,710 6,410 6,400 6,370 6,360
TBL 15,010 15,000 14,800 15,000 14,700 13,720 14,000 13,870 13,710 13,750 13,350 13,000 TCC 16,330 16,100 15,950 12,510 12,110 12,120 12,000 13,000 12,000 12,000 11,750 11,700 TCCL 2,800 2,770 2,670 2,220 2,060 1,860 1,850 1,600 1,650 1,800 1,860 1,860 TOL 760 760 760 765 800 870 850 800 800 800 800 800 TPCC 2,990 3,310 3,000 2,980 2,970 2,610 2,700 2,400 2,390 2,270 2,290 2,290
TATEPA 650 650 650 650 650 650 650 650 650 650 650 650 USL 160 220 160 150 110 90 80 60 70 80 80
YETU 600 600 600 600 600 600 600
comPArATivE mArKET rATioS P/E rATio EPS
2011 2012 2013 2014 2015 2011 2012 2013 2014 2015
TBL 4.90 5.32 13.32 20.99 18.92 412.63 564.26 600.58 690.70 734.26
TCC 4.43 4.89 11.02 24.05 18.38 709.42 859.41 780.58 686.00 657.11
TCCL 6.91 4.43 3.96 8.98 13.88 344.41 541.83 509.75 424.05 134.02
SWIS 4.16 9.21 12.87 20.87 14.49 196.92 186.75 208.22 359.36 503.81
TPCC 7.40 7.60 12.72 11.36 8.35 281.26 342.25 209.20 308.18 312.47
NMB 5.92 5.75 9.78 11.15 6.64 143.68 194.80 267.81 311.25 301.23
DCB 6.36 12.53 5.09 12.21 9.82 100.70 49.50 96.27 55.69 55.48
CRDB 9.99 4.05 7.22 9.10 6.58 17.33 37.01 38.77 43.94 59.26
TTP (5.86) 15.73 (5.79) (3.05) (2.48) (45.19) 25.42 (112.34) (212.89) (262.26)
TOL 62.04 10.17 11.56 17.54 21.58 3.22 25.58 26.81 36.20 40.31
PAL N/A 34.17 (2.43) (6.08) (0.91) N/A 13.90 (189.61) (77.34) (518.08)
MAENDELEO N/A N/A (11.01) (16.93) 14.27 N/A N/A (54.49) (35.44) 42.05
SWALA N/A N/A N/A (4.72) 5.61 N/A N/A N/A (148.39) 89.11
MKOMBOZI N/A N/A N/A 12.32 1.46 N/A N/A N/A 121.71 68.64
MWALIMU N/A N/A N/A N/A N/A N/A N/A N/A N/A N/A
YETU N/A N/A N/A N/A N/A N/A N/A N/A N/A N/A
MUCCOBA N/A N/A N/A N/A N/A N/A N/A N/A N/A N/A
C r e a t i n g O p p o r t u n i t i e s
THE DAR ES SALAAM STOCK EXCHANGE PLC - QUARTERLY UPDATE8
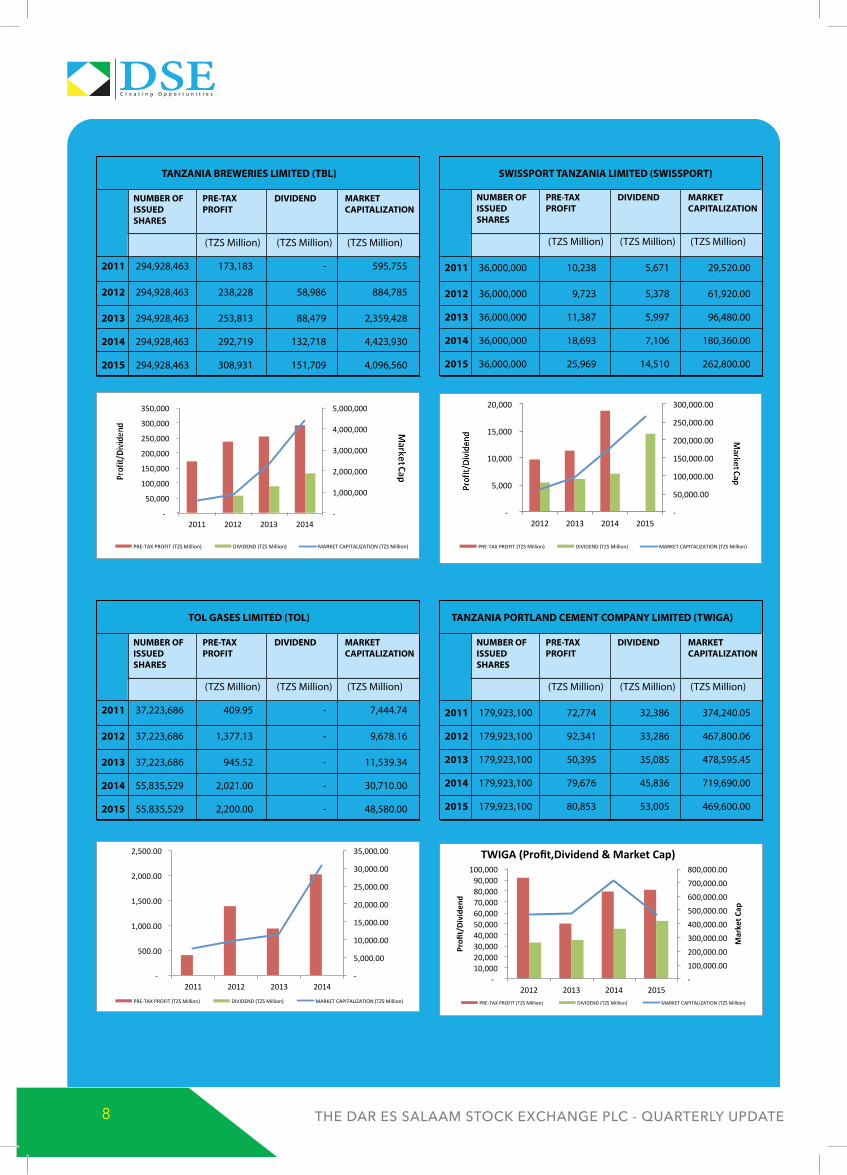
TAnZAniA BrEwEriES LimiTED (TBL) nUmBEr oF PrE-TAX DiviDEnD mArKET iSSUED ProFiT cAPiTALiZATion SHArES
(TZS Million) (TZS Million) (TZS Million)
2011 294,928,463 173,183 - 595,755
2012 294,928,463 238,228 58,986 884,785
2013 294,928,463 253,813 88,479 2,359,428
2014 294,928,463 292,719 132,718 4,423,930
2015 294,928,463 308,931 151,709 4,096,560
ToL GASES LimiTED (ToL) nUmBEr oF PrE-TAX DiviDEnD mArKET iSSUED ProFiT cAPiTALiZATion SHArES
(TZS Million) (TZS Million) (TZS Million)
2011 37,223,686 409.95 - 7,444.74
2012 37,223,686 1,377.13 - 9,678.16
2013 37,223,686 945.52 - 11,539.34
2014 55,835,529 2,021.00 - 30,710.00
2015 55,835,529 2,200.00 - 48,580.00
SwiSSPorT TAnZAniA LimiTED (SwiSSPorT) nUmBEr oF PrE-TAX DiviDEnD mArKET iSSUED ProFiT cAPiTALiZATion SHArES
(TZS Million) (TZS Million) (TZS Million)
2011 36,000,000 10,238 5,671 29,520.00
2012 36,000,000 9,723 5,378 61,920.00
2013 36,000,000 11,387 5,997 96,480.00
2014 36,000,000 18,693 7,106 180,360.00
2015 36,000,000 25,969 14,510 262,800.00
TAnZAniA PorTLAnD cEmEnT comPAnY LimiTED (TwiGA) nUmBEr oF PrE-TAX DiviDEnD mArKET iSSUED ProFiT cAPiTALiZATion SHArES
(TZS Million) (TZS Million) (TZS Million)
2011 179,923,100 72,774 32,386 374,240.05
2012 179,923,100 92,341 33,286 467,800.06
2013 179,923,100 50,395 35,085 478,595.45
2014 179,923,100 79,676 45,836 719,690.00
2015 179,923,100 80,853 53,005 469,600.00
-
1,000,000
2,000,000
3,000,000
4,000,000
5,000,000
-
50,000
100,000
150,000
200,000
250,000
300,000
350,000
2011 2012 2013 2014
PRE-TAXPROFIT(TZSMillion) DIVIDEND(TZSMillion) MARKETCAPITALIZATION(TZSMillion)
-
50,000.00
100,000.00
150,000.00
200,000.00
250,000.00
300,000.00
-
5,000
10,000
15,000
20,000
2012 2013 2014 2015
PRE-TAXPROFIT(TZSMillion) DIVIDEND(TZSMillion) MARKETCAPITALIZATION(TZSMillion)
-
5,000.00
10,000.00
15,000.00
20,000.00
25,000.00
30,000.00
35,000.00
-
500.00
1,000.00
1,500.00
2,000.00
2,500.00
2011 2012 2013 2014PRE-TAXPROFIT(TZSMillion) DIVIDEND(TZSMillion) MARKETCAPITALIZATION(TZSMillion)
-
100,000.00
200,000.00
300,000.00
400,000.00
500,000.00
600,000.00
700,000.00
800,000.00
-10,00020,00030,00040,00050,00060,00070,00080,00090,000
100,000
2012 2013 2014 2015
MarketC
ap
Profi
t/Divide
nd
TWIGA(Profit,Dividend&MarketCap)
PRE-TAXPROFIT(TZSMillion) DIVIDEND(TZSMillion) MARKETCAPITALIZATION(TZSMillion)
C r e a t i n g O p p o r t u n i t i e s
THE DAR ES SALAAM STOCK EXCHANGE PLC - QUARTERLY UPDATE 9
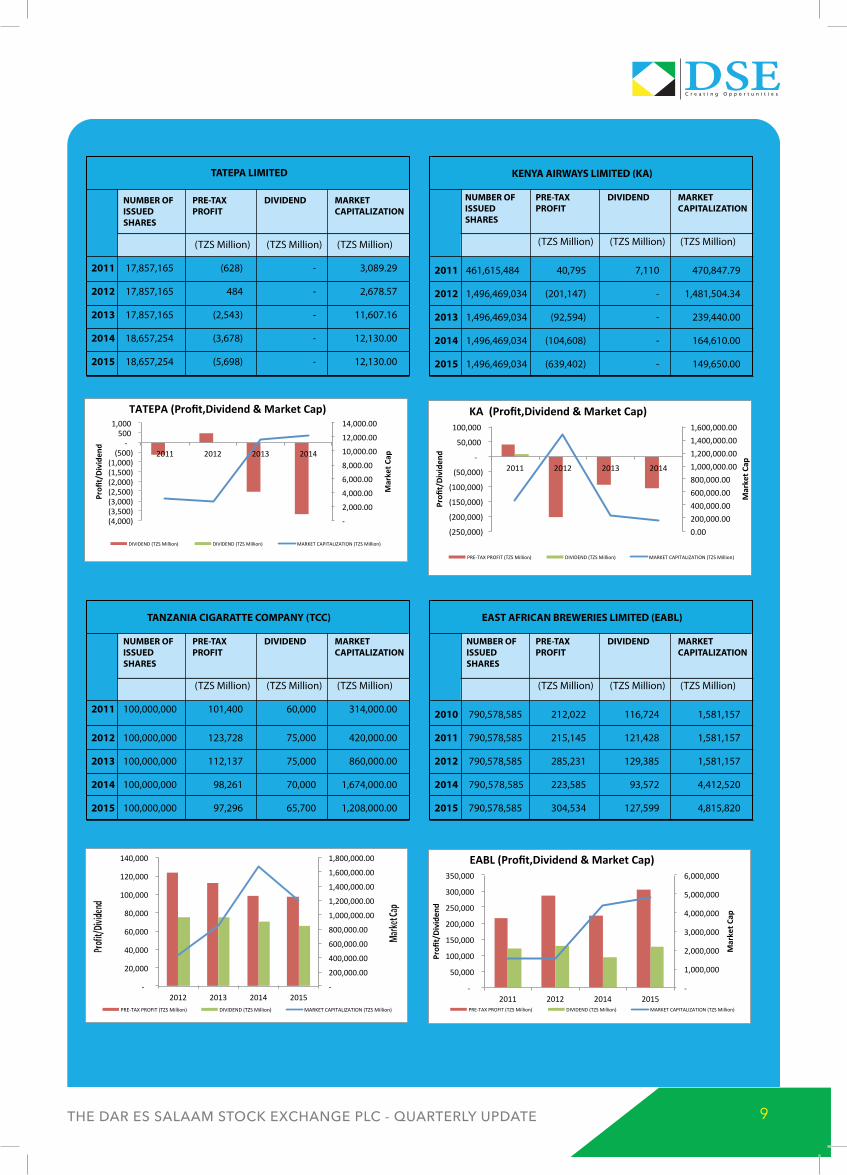
TATEPA LimiTED nUmBEr oF PrE-TAX DiviDEnD mArKET iSSUED ProFiT cAPiTALiZATion SHArES
(TZS Million) (TZS Million) (TZS Million)
2011 17,857,165 (628) - 3,089.29
2012 17,857,165 484 - 2,678.57
2013 17,857,165 (2,543) - 11,607.16
2014 18,657,254 (3,678) - 12,130.00
2015 18,657,254 (5,698) - 12,130.00
TAnZAniA ciGArATTE comPAnY (Tcc) nUmBEr oF PrE-TAX DiviDEnD mArKET iSSUED ProFiT cAPiTALiZATion SHArES
(TZS Million) (TZS Million) (TZS Million)
2011 100,000,000 101,400 60,000 314,000.00
2012 100,000,000 123,728 75,000 420,000.00
2013 100,000,000 112,137 75,000 860,000.00
2014 100,000,000 98,261 70,000 1,674,000.00
2015 100,000,000 97,296 65,700 1,208,000.00
KEnYA AirwAYS LimiTED (KA) nUmBEr oF PrE-TAX DiviDEnD mArKET iSSUED ProFiT cAPiTALiZATion SHArES
(TZS Million) (TZS Million) (TZS Million)
2011 461,615,484 40,795 7,110 470,847.79
2012 1,496,469,034 (201,147) - 1,481,504.34
2013 1,496,469,034 (92,594) - 239,440.00
2014 1,496,469,034 (104,608) - 164,610.00
2015 1,496,469,034 (639,402) - 149,650.00
EAST AFricAn BrEwEriES LimiTED (EABL) nUmBEr oF PrE-TAX DiviDEnD mArKET iSSUED ProFiT cAPiTALiZATion SHArES
(TZS Million) (TZS Million) (TZS Million)
2010 790,578,585 212,022 116,724 1,581,157
2011 790,578,585 215,145 121,428 1,581,157
2012 790,578,585 285,231 129,385 1,581,157
2014 790,578,585 223,585 93,572 4,412,520
2015 790,578,585 304,534 127,599 4,815,820
-
2,000.00
4,000.00
6,000.00
8,000.00
10,000.00
12,000.00
14,000.00
(4,000)(3,500)(3,000)(2,500)(2,000)(1,500)(1,000)(500)
-500
1,000
2011 2012 2013 2014
MarketC
ap
Profi
t/Divide
nd
TATEPA(Profit,Dividend&MarketCap)
DIVIDEND(TZSMillion) DIVIDEND(TZSMillion) MARKETCAPITALIZATION(TZSMillion)
0.00200,000.00400,000.00600,000.00800,000.001,000,000.001,200,000.001,400,000.001,600,000.00
(250,000)
(200,000)
(150,000)
(100,000)
(50,000)
-
50,000
100,000
2011 2012 2013 2014
MarketC
ap
Profi
t/Divide
nd
KA(Profit,Dividend&MarketCap)
PRE-TAXPROFIT(TZSMillion) DIVIDEND(TZSMillion) MARKETCAPITALIZATION(TZSMillion)
-
200,000.00
400,000.00
600,000.00
800,000.00
1,000,000.00
1,200,000.00
1,400,000.00
1,600,000.00
1,800,000.00
-
20,000
40,000
60,000
80,000
100,000
120,000
140,000
2012 2013 2014 2015PRE-TAXPROFIT(TZSMillion) DIVIDEND(TZSMillion) MARKETCAPITALIZATION(TZSMillion)
-
1,000,000
2,000,000
3,000,000
4,000,000
5,000,000
6,000,000
-
50,000
100,000
150,000
200,000
250,000
300,000
350,000
2011 2012 2014 2015
MarketC
ap
Profi
t/Divide
nd
EABL(Profit,Dividend&MarketCap)
PRE-TAXPROFIT(TZSMillion) DIVIDEND(TZSMillion) MARKETCAPITALIZATION(TZSMillion)
C r e a t i n g O p p o r t u n i t i e s
THE DAR ES SALAAM STOCK EXCHANGE PLC - QUARTERLY UPDATE10
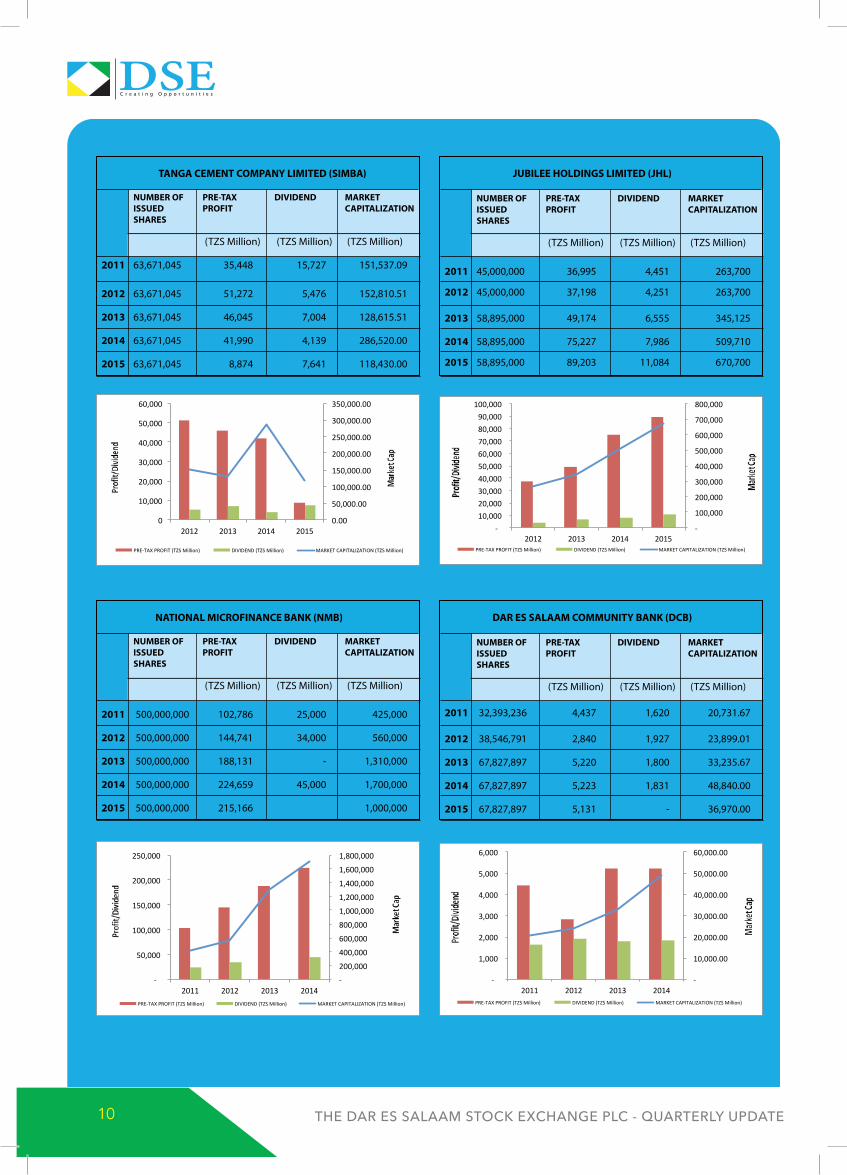
TAnGA cEmEnT comPAnY LimiTED (SimBA) nUmBEr oF PrE-TAX DiviDEnD mArKET iSSUED ProFiT cAPiTALiZATion SHArES
(TZS Million) (TZS Million) (TZS Million)
2011 63,671,045 35,448 15,727 151,537.09
2012 63,671,045 51,272 5,476 152,810.51
2013 63,671,045 46,045 7,004 128,615.51
2014 63,671,045 41,990 4,139 286,520.00
2015 63,671,045 8,874 7,641 118,430.00
nATionAL microFinAncE BAnK (nmB) nUmBEr oF PrE-TAX DiviDEnD mArKET iSSUED ProFiT cAPiTALiZATion SHArES
(TZS Million) (TZS Million) (TZS Million)
2011 500,000,000 102,786 25,000 425,000
2012 500,000,000 144,741 34,000 560,000
2013 500,000,000 188,131 - 1,310,000
2014 500,000,000 224,659 45,000 1,700,000
2015 500,000,000 215,166 1,000,000
JUBiLEE HoLDinGS LimiTED (JHL) nUmBEr oF PrE-TAX DiviDEnD mArKET iSSUED ProFiT cAPiTALiZATion SHArES
(TZS Million) (TZS Million) (TZS Million)
2011 45,000,000 36,995 4,451 263,700
2012 45,000,000 37,198 4,251 263,700
2013 58,895,000 49,174 6,555 345,125
2014 58,895,000 75,227 7,986 509,710
2015 58,895,000 89,203 11,084 670,700
DAr ES SALAAm commUniTY BAnK (DcB) nUmBEr oF PrE-TAX DiviDEnD mArKET iSSUED ProFiT cAPiTALiZATion SHArES
(TZS Million) (TZS Million) (TZS Million)
2011 32,393,236 4,437 1,620 20,731.67
2012 38,546,791 2,840 1,927 23,899.01
2013 67,827,897 5,220 1,800 33,235.67
2014 67,827,897 5,223 1,831 48,840.00
2015 67,827,897 5,131 - 36,970.00
0.00
50,000.00
100,000.00
150,000.00
200,000.00
250,000.00
300,000.00
350,000.00
0
10,000
20,000
30,000
40,000
50,000
60,000
2012 2013 2014 2015
PRE-TAXPROFIT(TZSMillion) DIVIDEND(TZSMillion) MARKETCAPITALIZATION(TZSMillion)
-
100,000
200,000
300,000
400,000
500,000
600,000
700,000
800,000
-10,00020,00030,00040,00050,00060,00070,00080,00090,000
100,000
2012 2013 2014 2015PRE-TAXPROFIT(TZSMillion) DIVIDEND(TZSMillion) MARKETCAPITALIZATION(TZSMillion)
-
200,000
400,000
600,000
800,000
1,000,000
1,200,000
1,400,000
1,600,000
1,800,000
-
50,000
100,000
150,000
200,000
250,000
2011 2012 2013 2014PRE-TAXPROFIT(TZSMillion) DIVIDEND(TZSMillion) MARKETCAPITALIZATION(TZSMillion)
-
10,000.00
20,000.00
30,000.00
40,000.00
50,000.00
60,000.00
-
1,000
2,000
3,000
4,000
5,000
6,000
2011 2012 2013 2014PRE-TAXPROFIT(TZSMillion) DIVIDEND(TZSMillion) MARKETCAPITALIZATION(TZSMillion)
C r e a t i n g O p p o r t u n i t i e s
THE DAR ES SALAAM STOCK EXCHANGE PLC - QUARTERLY UPDATE 11
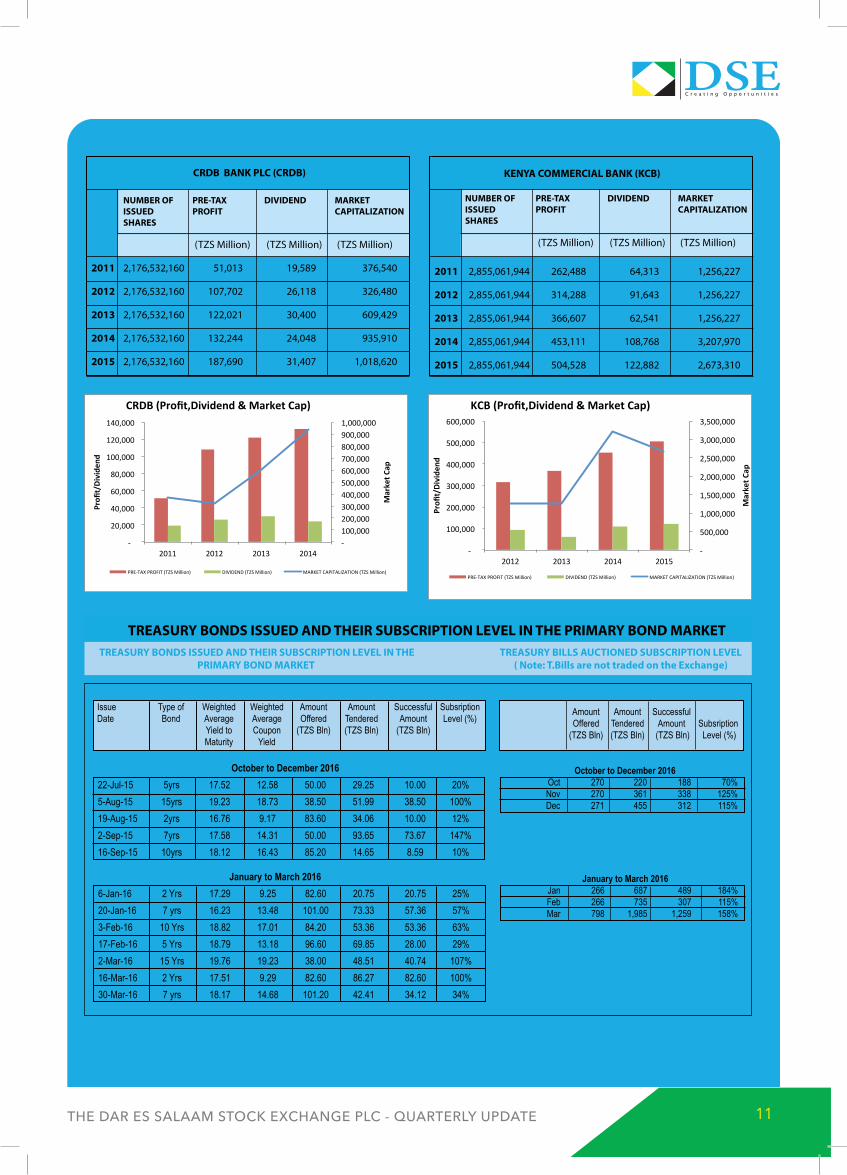
crDB BAnK PLc (crDB) nUmBEr oF PrE-TAX DiviDEnD mArKET iSSUED ProFiT cAPiTALiZATion SHArES
(TZS Million) (TZS Million) (TZS Million)
2011 2,176,532,160 51,013 19,589 376,540
2012 2,176,532,160 107,702 26,118 326,480
2013 2,176,532,160 122,021 30,400 609,429
2014 2,176,532,160 132,244 24,048 935,910
2015 2,176,532,160 187,690 31,407 1,018,620
KEnYA commErciAL BAnK (KcB) nUmBEr oF PrE-TAX DiviDEnD mArKET iSSUED ProFiT cAPiTALiZATion SHArES
(TZS Million) (TZS Million) (TZS Million)
2011 2,855,061,944 262,488 64,313 1,256,227
2012 2,855,061,944 314,288 91,643 1,256,227
2013 2,855,061,944 366,607 62,541 1,256,227
2014 2,855,061,944 453,111 108,768 3,207,970
2015 2,855,061,944 504,528 122,882 2,673,310
Issue Type of Weighted Weighted Amount Amount Successful Subsription Date Bond Average Average Offered Tendered Amount Level (%) Yield to Coupon (TZS Bln) (TZS Bln) (TZS Bln) Maturity Yield
Amount Amount Successful Offered Tendered Amount Subsription (TZS Bln) (TZS Bln) (TZS Bln) Level (%)
October to December 2016 22-Jul-15 5yrs 17.52 12.58 50.00 29.25 10.00 20%5-Aug-15 15yrs 19.23 18.73 38.50 51.99 38.50 100%19-Aug-15 2yrs 16.76 9.17 83.60 34.06 10.00 12%2-Sep-15 7yrs 17.58 14.31 50.00 93.65 73.67 147%16-Sep-15 10yrs 18.12 16.43 85.20 14.65 8.59 10%
October to December 2016 Oct 270 220 188 70% Nov 270 361 338 125% Dec 271 455 312 115%
TrEASUrY BonDS iSSUED AnD THEir SUBScriPTion LEvEL in THE PrimArY BonD mArKET TrEASUrY BonDS iSSUED AnD THEir SUBScriPTion LEvEL in THE
PrimArY BonD mArKETTrEASUrY BiLLS AUcTionED SUBScriPTion LEvEL
( note: T.Bills are not traded on the Exchange)
January to March 2016 6-Jan-16 2 Yrs 17.29 9.25 82.60 20.75 20.75 25%20-Jan-16 7 yrs 16.23 13.48 101.00 73.33 57.36 57%3-Feb-16 10 Yrs 18.82 17.01 84.20 53.36 53.36 63%17-Feb-16 5 Yrs 18.79 13.18 96.60 69.85 28.00 29%2-Mar-16 15 Yrs 19.76 19.23 38.00 48.51 40.74 107%16-Mar-16 2 Yrs 17.51 9.29 82.60 86.27 82.60 100%30-Mar-16 7 yrs 18.17 14.68 101.20 42.41 34.12 34%
January to March 2016 Jan 266 687 489 184% Feb 266 735 307 115% Mar 798 1,985 1,259 158%
-100,000200,000300,000400,000500,000600,000700,000800,000900,0001,000,000
-
20,000
40,000
60,000
80,000
100,000
120,000
140,000
2011 2012 2013 2014
MarketC
ap
Profi
t/Divide
nd
CRDB(Profit,Dividend&MarketCap)
PRE-TAXPROFIT(TZSMillion) DIVIDEND(TZSMillion) MARKETCAPITALIZATION(TZSMillion)
-
500,000
1,000,000
1,500,000
2,000,000
2,500,000
3,000,000
3,500,000
-
100,000
200,000
300,000
400,000
500,000
600,000
2012 2013 2014 2015
MarketC
ap
Profi
t/Divide
nd
KCB(Profit,Dividend&MarketCap)
PRE-TAXPROFIT(TZSMillion) DIVIDEND(TZSMillion) MARKETCAPITALIZATION(TZSMillion)
C r e a t i n g O p p o r t u n i t i e s
THE DAR ES SALAAM STOCK EXCHANGE PLC - QUARTERLY UPDATE12
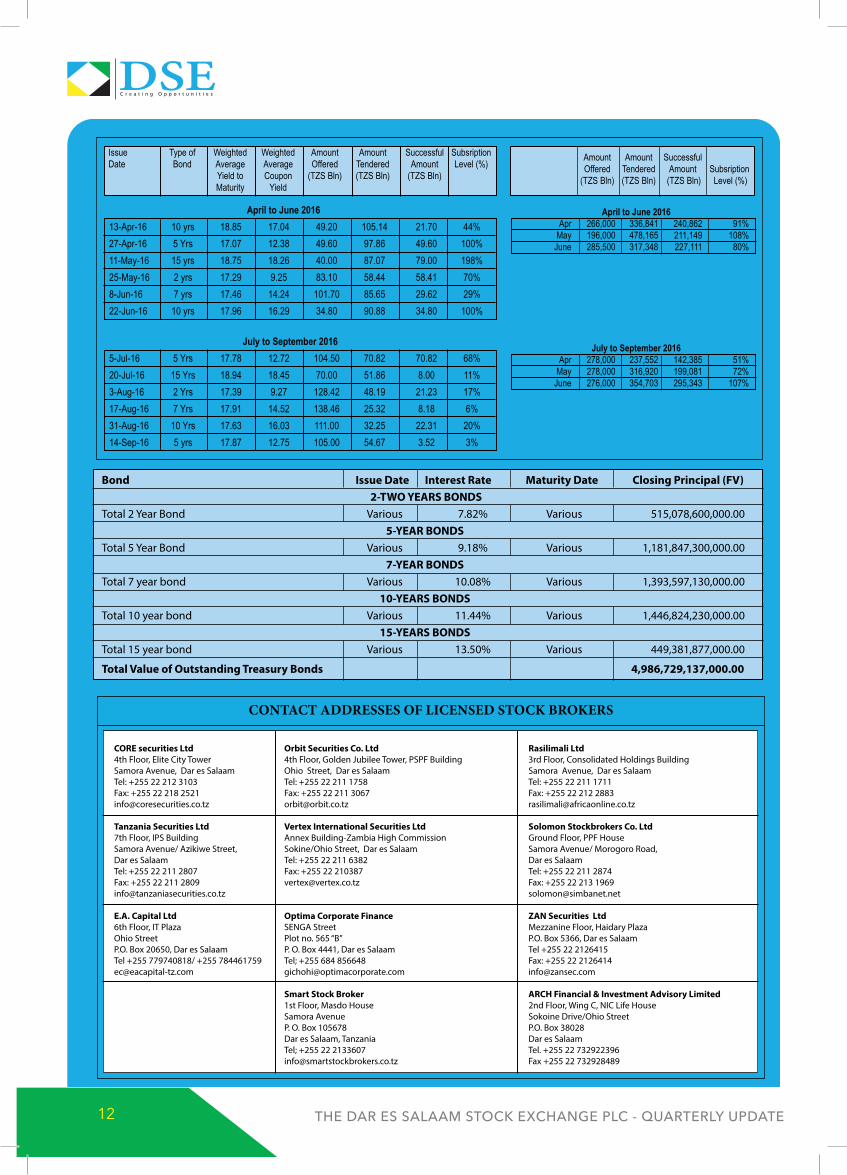
Bond issue Date interest rate maturity Date closing Principal (Fv) 2-Two YEArS BonDS
Total 2 Year Bond Various 7.82% Various 515,078,600,000.00 5-YEAr BonDS
Total 5 Year Bond Various 9.18% Various 1,181,847,300,000.00 7-YEAr BonDS
Total 7 year bond Various 10.08% Various 1,393,597,130,000.00 10-YEArS BonDS
Total 10 year bond Various 11.44% Various 1,446,824,230,000.00 15-YEArS BonDS
Total 15 year bond Various 13.50% Various 449,381,877,000.00
Total value of outstanding Treasury Bonds 4,986,729,137,000.00
Issue Type of Weighted Weighted Amount Amount Successful Subsription Date Bond Average Average Offered Tendered Amount Level (%) Yield to Coupon (TZS Bln) (TZS Bln) (TZS Bln) Maturity Yield
Amount Amount Successful Offered Tendered Amount Subsription (TZS Bln) (TZS Bln) (TZS Bln) Level (%)
April to June 2016 13-Apr-16 10 yrs 18.85 17.04 49.20 105.14 21.70 44%27-Apr-16 5 Yrs 17.07 12.38 49.60 97.86 49.60 100%11-May-16 15 yrs 18.75 18.26 40.00 87.07 79.00 198%25-May-16 2 yrs 17.29 9.25 83.10 58.44 58.41 70%8-Jun-16 7 yrs 17.46 14.24 101.70 85.65 29.62 29%22-Jun-16 10 yrs 17.96 16.29 34.80 90.88 34.80 100%
July to September 2016 5-Jul-16 5 Yrs 17.78 12.72 104.50 70.82 70.82 68%20-Jul-16 15 Yrs 18.94 18.45 70.00 51.86 8.00 11%3-Aug-16 2 Yrs 17.39 9.27 128.42 48.19 21.23 17%17-Aug-16 7 Yrs 17.91 14.52 138.46 25.32 8.18 6%31-Aug-16 10 Yrs 17.63 16.03 111.00 32.25 22.31 20%14-Sep-16 5 yrs 17.87 12.75 105.00 54.67 3.52 3%
April to June 2016 Apr 266,000 336,841 240,862 91% May 196,000 478,165 211,149 108% June 285,500 317,348 227,111 80%
July to September 2016 Apr 278,000 237,552 142,385 51% May 278,000 316,920 199,081 72% June 276,000 354,703 295,343 107%
ContaCt addresses of LiCensed stoCk Brokers
corE securities Ltd orbit Securities co. Ltd rasilimali Ltd4th Floor, Elite City Tower 4th Floor, Golden Jubilee Tower, PSPF Building 3rd Floor, Consolidated Holdings BuildingSamora Avenue, Dar es Salaam Ohio Street, Dar es Salaam Samora Avenue, Dar es SalaamTel: +255 22 212 3103 Tel: +255 22 211 1758 Tel: +255 22 211 1711Fax: +255 22 218 2521 Fax: +255 22 211 3067 Fax: +255 22 212 [email protected] [email protected] [email protected]
Tanzania Securities Ltd vertex international Securities Ltd Solomon Stockbrokers co. Ltd7th Floor, IPS Building Annex Building-Zambia High Commission Ground Floor, PPF HouseSamora Avenue/ Azikiwe Street, Sokine/Ohio Street, Dar es Salaam Samora Avenue/ Morogoro Road, Dar es Salaam Tel: +255 22 211 6382 Dar es SalaamTel: +255 22 211 2807 Fax: +255 22 210387 Tel: +255 22 211 2874Fax: +255 22 211 2809 [email protected] Fax: +255 22 213 [email protected] [email protected]
E.A. capital Ltd optima corporate Finance ZAn Securities Ltd6th Floor, IT Plaza SENGA Street Mezzanine Floor, Haidary PlazaOhio Street Plot no. 565 “B” P.O. Box 5366, Dar es SalaamP.O. Box 20650, Dar es Salaam P. O. Box 4441, Dar es Salaam Tel +255 22 2126415Tel +255 779740818/ +255 784461759 Tel; +255 684 856648 Fax: +255 22 [email protected] [email protected] [email protected]
Smart Stock Broker ArcH Financial & investment Advisory Limited 1st Floor, Masdo House 2nd Floor, Wing C, NIC Life House Samora Avenue Sokoine Drive/Ohio Street P. O. Box 105678 P.O. Box 38028 Dar es Salaam, Tanzania Dar es Salaam Tel; +255 22 2133607 Tel. +255 22 732922396 [email protected] Fax +255 22 732928489