the dark side of the moon: structured products from the ... · pdf filethe dark side of the...
TRANSCRIPT

The dark side of the moon: structuredproducts from the customer’s perspective
Thorsten Hens∗
Marc Oliver Rieger†
September 8, 2008
Abstract
The paper develops a framework for the design of optimal struc-tured products allowing us to analyze the maximal utility gain for aninvestor that can be achieved by introducing structured products. Wedemonstrate on data from two of the largest markets for structuredproducts (Germany and Switzerland) that most of the successful struc-tured products are not optimal for a perfectly rational investor and weinvestigate the reasons that make them nevertheless look so attractivefor many investors. Finally, using a large-scale field experiment, inwhich subjects freely designed structured products, we deduce howvarious factors effect the preferences on structured products.
JEL classification: G11,C61.Keywords: Structured financial products, behavioral finance, capital assetpricing model.
1 Importance of structured financial prod-
ucts
Structured products, SPs, combine one or more classical assets (stocks, bonds,indices) with at least one derivative into a bundle that shall have specific
∗Swiss Finance Institute research fellow and professor at the ISB, University of Zurich,Plattenstrasse 32, 8032 Zurich, Switzerland and NHH Bergen, Norway. [email protected]†ISB, University of Zurich, Plattenstrasse 32, 8032 Zurich, Switzerland.
1

2 1 IMPORTANCE OF STRUCTURED FINANCIAL PRODUCTS
interesting features for investors, like capital protection or increased partici-pation. They enable investors with comparatively low budget and knowledgeto invest indirectly into derivatives. Banks profit from the restricted partici-pation of these non-institutional investors in the derivatives market, in thatthey retain a margin profit when issuing structured products. Structuredproducts are immensely popular in Europe. However, some European stateslike Norway recently introduced high regulatory burdens on them. Our pa-per contributes to these regulatory issues by analyzing the risks and benefitsof structured products for private investors. Structured products are not yetas popular in the USA. Potential reasons for this are regulatory reasons, butalso the fact that more private investors than in Europe hold stocks1.
Note that the existence of structured products is puzzling since in traditionalportfolio models there is no role for SPs. The classical mean-variance modelof Markowitz [21], for example, suggests that an investment in the mar-ket portfolio and the risk-free asset would be sufficient to construct optimalinvestments for all degrees of risk-aversion – this is the famous Two-Fund-Separation, 2FS. Hence the only role for banks would be to offer the marketportfolio at minimal cost, e.g. in the form of an exchange traded fund (ETF).
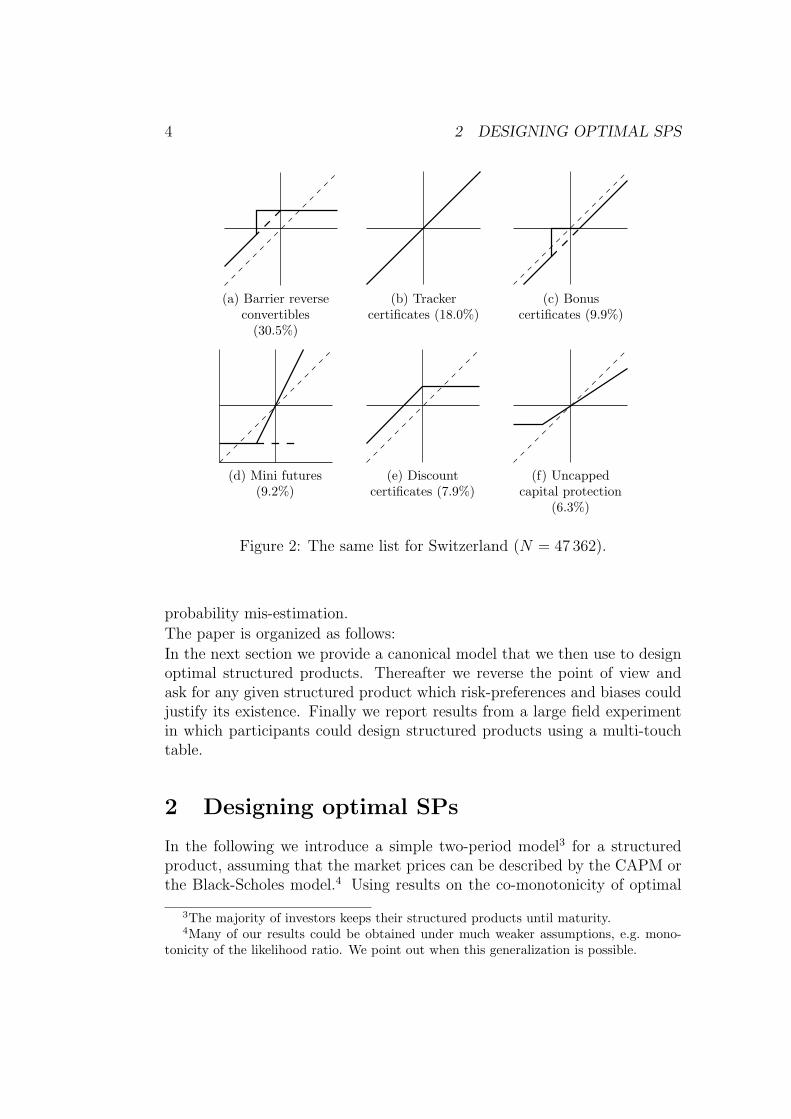
Not only the widespread existence of structured products is puzzling, but alsothe large variety of payoff patterns that can be found. Even very complicatedpayoff patterns are often not as exotic and rare as one would expect: thiscan be seen in data from the German and the Swiss market (the two largestmarkets for structured products in Europe). The Swiss sample consists ofN = 47′362 products issued from March 2007 to November 2007. The Ger-man sample consists of all structured products on the market (N = 270′254)as of end of November 2007. Figure 1 and Figure 2 show typical payoff dia-grams for the most popular types in each country.2 We observe that in eachcountry a large variety of products are popular: leverage, capital protectionand outperformance can all be found. At the same time there are clear sim-ilarities between Germany and Switzerland: three product types (discountcertificates, bonus certificates and leverage products) can be found in the toplist of both countries.
Structured products have so far been studied in academic research nearly ex-clusively from the issuer’s perspective, mostly in the context of option pricingand hedging. (For an early exception see the article by Shefrin and Stat-man [27].) Indeed, building on the seminal paper of Black and Scholes [3]a new field of finance, called financial engineering, has emerged in which
1Compare [2] for more on the regulatory background for structured products in the US.2For clarification, we omit plain vanilla type put and call options that are occasionally
also listed as structured products.

3
(a) DiscountCertificates (24.6%)
(b)Bonus-/partially
protected products(19.3%)
(c) K.O. productswith stop loss
(8.9%)
(d) K.O. productswithout stop loss
(3.1%)
(e) Reverseconvertibles (2.3%)
(f) Exotic leverage(2.0%)
Figure 1: The most popular structured products in Germany with theirrespective shares of all issued products (N = 270 254).
mathematicians and engineers developed more and more elaborate pricingtechniques for ever more complicated structured products. Besides this hugetechnical literature, recently a few empirical studies on the actual marketprices [32, 15, 31] of SPs can be found and there are interesting first ex-plorative studies on specific puzzles regarding the investors’ preferences forcertain product classes [28, 16, 6, 7]. But all in all the investor’s perspectiveon structured products is still uncharted territory, somehow “the dark sideof the moon”.
In this article we try to shed some light on this “dark side” and take the in-vestor’s perspective as the starting point for our expedition. In this way weask whether structured products are an appropriate tool to improve invest-ment performance and what types of products are optimal under normative,but also under behavioral models. In particular, we measure how big the po-tential improvement of a portfolio can be when adding structured products.We also demonstrate that the most popular products derive their popularitynot from rational, but from behavioral factors like framing, loss aversion and
4 2 DESIGNING OPTIMAL SPS
(a) Barrier reverseconvertibles
(30.5%)
(b) Trackercertificates (18.0%)
(c) Bonuscertificates (9.9%)
(d) Mini futures(9.2%)
(e) Discountcertificates (7.9%)
(f) Uncappedcapital protection
(6.3%)
Figure 2: The same list for Switzerland (N = 47 362).
probability mis-estimation.
The paper is organized as follows:
In the next section we provide a canonical model that we then use to designoptimal structured products. Thereafter we reverse the point of view andask for any given structured product which risk-preferences and biases couldjustify its existence. Finally we report results from a large field experimentin which participants could design structured products using a multi-touchtable.
2 Designing optimal SPs
In the following we introduce a simple two-period model3 for a structuredproduct, assuming that the market prices can be described by the CAPM orthe Black-Scholes model.4 Using results on the co-monotonicity of optimal
3The majority of investors keeps their structured products until maturity.4Many of our results could be obtained under much weaker assumptions, e.g. mono-
tonicity of the likelihood ratio. We point out when this generalization is possible.

2.1 A canonical model 5
investments [23] and extending previous results on optimal investments in thestrictly concave expected utility setting [20], we obtain qualitative propertiesthat optimal structured products should satisfy under more and more relaxedconditions on the rationality of the investors. We will use these results toshow later that the attractiveness of the currently most popular classes ofSPs cannot be understood within a rational decision model.Some of our analytical results are similar to independent work by Prigent [22]on portfolio optimization and rank-dependent expected utility. In particular,Prigent derives a solution for a basic optimization problem in the case of non-concave utility functions (see Lemma 1).
2.1 A canonical model
We say that a structured product is optimal if its payoff distribution maxi-mizes the given utility of an investor under the constraint that the arbitrage-free price of the product cannot exceed a certain value. It seems appropriateto use a two-period model, since most structured products are sold over thecounter and have a fixed maturity. To obtain intuitive results, we will assumemost of the time that the market can be described by the capital asset pricingmodel. Note that the validity of the CAPM is not at odds with violations ofthe two-fund separation property. For example heterogeneous beliefs or un-correlated optimization mistakes give rise to heterogeneous portfolios whileon the level of the market the security market line property of the CAPMcan still hold [8, 13, 4]. Moreover, we assume that the market is complete forthe product designer and that the investor does not hold other assets thanthe structured product (or at least considers them as a separate “mentalaccount”).5
It has been shown in [23] that any optimal structured product can be de-scribed by its return distribution at maturity as a function of the return ofthe market portfolio. Therefore we naturally arrive at the following utilitymaximization problem:
maxy∈RS
S∑s=1
psu(ys),
subject to∑s
πsys = B,
where u : R → R is the utility function, B > 0 is the budget, s = 1, . . . , Smark the states that occur with probability ps > 0 and π = (π1, . . . , πS)� 0
5Most of our results carry over if the investor holds additionally risk-free assets.
6 2 DESIGNING OPTIMAL SPS
are the state prices. ys denotes the payoff of the structured product atmaturity in state s.It will turn out to be useful to transform this model slightly: normalize πsto π∗s with
∑s π∗s = 1, set B = 1, then we can define the likelihood ratio
`s = π∗s/ps. Absence of arbitrage implies∑
s π∗sR
ks = R, where Rk
s is thereturn of asset k in state s and R is the risk-free rate. Therefore
∑s πs = R
and we can reformulate the optimization problem using the likelihood ratioprocess
maxy∈RS
S∑s=1
psu(ys),
subject to∑s
ps`sys = R. (1)
While studying a discrete state space helps to find an intuition for this prob-lem, it will turn out to be easier if we study a continuous state space. Particu-larly, we will not face the problem that we have to split states when studyingnon-concave utility functions. Therefore we continue with the continuousvariant of (1) and maximize
U(y) :=
∫Ru(y(x)) dp(x),
over all y ∈ L1(R, `p), subject to the condition∫Ry(x)`(x)dp(x) = R.
The likelihood ratio ` can be written in the CAPM as
`(x) = a− bx,
for some positive constants a,b, as has been shown in [5]. From the linearityof the likelihood ratio ` the security-market line of the CAPM can be derivedby elementary computations.In the case of the Black-Scholes model this can be written as `(x) = Ae−Bx
for suitable A,B > 0.
2.2 Optimal SPs in the strictly concave case: convexpayoffs
Let us assume that the investor has rational preferences, i.e. he follows theexpected utility approach by von Neumann and Morgenstern [30]. The case

2.2 Optimal SPs in the strictly concave case: convex payoffs 7
where the utility function u is strictly increasing and strictly concave hasbeen studied previously by Kramkov and Schachermeyer [20]. In this case, astraightforward variational approach leads to the optimality condition
y(x) = v−1(λ`(x)), (2)
where v := u′ and λ is a Lagrange parameter that has to be chosen suchthat (2) holds.Note that unless the utility function is quadratic, in the two-period modelthe 2FS property does not hold for any distribution of returns6.What conditions on y can we derive from (2) in general? In fact, in the mostrealistic case (when the investor is prudent7), y is convex, as the followingtheorem shows:
Theorem 1. Let u be a strictly increasing and strictly concave utility func-tion. Assume furthermore that u′′′ > 0 (i.e. the investor is prudent). Thenthe return of an optimal SP on a CAPM market is strictly convex as a func-tion of the market return. If u′′′ = 0 (i.e. u is quadratic) then the payofffunction will be linear. If u′′′ < 0 the payoff function will be strictly concave.
Proof. Take the second derivative of y(x) = v−1(λ(a + bx)) with v := u′.This gives:
y′′(x) = −λ2b2v′′(v−1(λ(a+ bx)))
(v′(v−1(λ(a+ bx))))3.
The denominator is positive, since v′ = u′′ < 0 (u is strictly concave).Thus y′′ is positive if u′′′ = v′′ > 0.This result is surprising since prudent investors prefer SPs that look similarto call options which are usually associated with gambling or risk-taking! Inparticular, the theorem shows that if u is quadratic, the return is a linearfunction of the market return, i.e. there is no need for a SP at all, whichis the classical two-fund separation theorem of the mean-variance portfoliotheory.The following corollary gives a simpler condition that is well-known to financeunder which strict convexity of y holds:
Corollary 1. If the investor has non-increasing absolute risk-aversion, thenthe payoff function should be strictly convex.
6In models with time continuous trading, no transaction costs and an underlying processthat follows a geometric Brownian motion the 2FS property would hold for any class ofutility functions with constant relative risk aversion.
7The importance of prudence is well known from the literature in insurance theory, seefor example [14]

8 2 DESIGNING OPTIMAL SPS
Proof. Consider the Arrow-Pratt risk measure r(x) := −u′′(x)/u′(x). Then
r′(x) = −u′′′(x)u′(x)− (u′′(x))2
(u′(x))2. (3)
Hence, if r′ ≥ 0 (i.e. r is not increasing) then u′′′(x) ≥ (u′′(x))2
u′(x). Since u is
strictly increasing, this is positive. Thus v′′ = u′′′ > 0 and we can applyTheorem 1.Corollary 1 essentially also holds when we replace the CAPM with the Black-Scholes model:
Theorem 2. If the pricing is described by Black-Scholes, then the optimalpayoff function is strictly convex if the investor has decreasing absolute riskaversion (e.g. constant relative risk aversion).
Proof. We compute the second derivative of y which becomes
y′′(x) =λAB2e−Bx
(v′(v−1(λAe−Bx)))− λ2A2B2e−2Bxv′′(v−1(λAe−Bx))
(v′(v−1(λAe−Bx)))3.
This is positive if the following condition holds:
λAe−Bxv′′(v−1(λAe−Bx))− (v′(v−1(λAe−Bx)))2 > 0. (4)
Noticing that λAe−Bx = v(v−1(λAe−Bx) and using (3) we prove this inequal-ity.Let us now study two prominent examples of specific utility functions, wherethe payoff function of the optimal structured product can be given explicitly.
Power utility
Let u(x) := 1αxα with α < 1, α 6= 0. Then v(x) := u′(x) = xα−1 and
v−1(z) = z1
α−1 . Therefore, recalling (2), the optimal structured product isgiven by
y(x) = (λ`(x))−1
1−α .
We can compute λ explicitly, if we use the constraint (2):∫(λ`(x))−
11−α `(x)p(x) dx = R,
which can be resolved to
λ =
(R∫
`(x)αα−1p(x) dx
)α−1
.
2.2 Optimal SPs in the strictly concave case: convex payoffs 9
All together we obtain:
y(x) =C
`(x)1
1−α, where C :=
R∫`(x)
αα−1p(x) dx
.
We see that y is a decreasing function of `. In the case of the CAPM weobtain
y(x) =C
(a− bx)1
1−α.
Thus the structured product is an increasing and convex function of theunderlying.
Exponential utility
Let u(x) := − 1αe−αx. Then v(x) := u′(x) = e−αx and v−1(z) = − 1
αln z.
Thus,
y(x) = − 1
αln(λ`(x)).
Again, we can compute λ explicitly, if we use 2, i.e.∫y(x)`(x)p(x) dx = R.
The left hand side can be computed as follows:∫y(x)`(x)p(x) dx = − 1
α
∫ln(λ`(x))p(x)`(x) dx
= − 1
α
∫(ln(λ) + ln(`(x)))p(x)`(x) dx
= − 1
αln(λ)− 1
α
∫ln(`(x))p(x)`(x) dx.
Thus we obtain
λ = e−αR−Rp(x)`(x) ln(`(x) dx.
The optimal structured product is therefore given by
y(x) = R− 1
α
(ln `(x)−
∫p(x)`(x) ln(`(x)) dx
).
And in the case of the CAPM we obtain
y(x) = R− 1
α(ln(a− bx)− C) ,
where C :=∫p(x)(a−bx) ln(a−bx) dx. Again, y is an increasing and strictly
convex function of x.

10 2 DESIGNING OPTIMAL SPS
2.3 Optimal SPs in the general case
The assumption of strict concavity for the utility function is classical, but hasbeen disputed a lot in recent years. Implied utility functions can be computedfrom stock market data and often show non-concave regions, compare forexample [17] and [9]. Moreover, the most popular descriptive theory fordecisions under risk, cumulative prospect theory, predicts non-concavity ofu in losses [29]. Other descriptive theories also assume risk-seeking behaviorat least for small losses.Given the empirical and experimental evidence, it seems therefore more likelythat u depends on a reference point (e.g. current wealth level) and that ithas some strictly convex region for small losses. What would be an optimalSP for an investor described by such a model?We first show that in order to find an optimal SP, it is sufficient to considerthe concavification of the value function u, i.e. the smallest function largeror equal u which is concave8:
Lemma 1. Assume that u is concave for large returns and assume that thereturns are bounded from below by zero9. Let uc be the concavification of u,then there is an optimal SP for uc which is also optimal for u.
Proof. Let y0 be a point where uc(y0) > u(y0). We prove for any marketreturn x0 that an optimal SP for u does not have to yield the value y0, i.e.y0 6∈ supp y. Suppose the opposite, i.e. y(x0) = y0 for some x0. We can findtwo points y1, y2 with y1 < y0 < y2 such that λy1 + (1 − λ)y2 = y0 withλ ∈ (0, 1), u(y1) = uc(y1), u(y2) = uc(y2) and uc(y0) = λu(y1) + (1−λ)u(y2).Now we can construct another SP y such that whenever the market returnis x0, y gives a return of y1 with probability λ and a return of y2 withprobability 1 − λ. Let us do the same construction for all values y0 whereuc(y0) > u(y0). The new product obviously has a utility which is at leastas big as before, since λu(y1) + (1 − λ)u(y2) = uc(y0) > u(y0). Moreover, itsatisfies by construction the pricing constraint.For the concavified utility we can now follow the same computations as be-fore. The only difficulty is that the inverse of the derivative is still noteverywhere defined, since it can be constant. This, however, simply corre-sponds to a jump in y, as can be seen, for instance, by an approximationargument.This implies particularly that we typically do not have convexity of the op-timal structured product in the case of non-concave utility functions. There
8A similar result has been obtained by Prigent [22]9This is always true in assumptions since there is limited liability for structured prod-
ucts, i.e. the most one can lose is the initial investment.

2.4 Numerical results: what drives what? 11
is, however, one general property that holds in both cases which has beenproved (in a more general setting) in [23]:
Theorem 3. If the decision model is given by an arbitrary utility function(possibly with reference point set by the initial wealth level and not necessarilyconcave), any optimal structured product in a CAPM market or a marketwith Black-Scholes pricing is a monotonic function (or correspondence) ofthe market return.
In other words: the higher the return of the market portfolio at maturity,the higher the return of the optimal structured product.The intuition for this result is that whenever possible we would like to putlarge returns on “cheap” states.10 Since the state price density is decreasingin market returns, both in the case of CAPM and the case of Black-Scholes,the cheapest states are the ones with the largest market returns. This forcesus naturally to assign large returns to states with large market return andconsequently small returns to states with small market return.
2.4 Numerical results: what drives what?
We know now how optimal structured products can be analytically computedand what properties they satisfy. This framework should enable us to designoptimal structured products for investors with a broad range of risk prefer-ences. However, the numerical computation is not as easy as the previousexamples suggested: in principle, we just need to evaluate equation (2), how-ever, it is often difficult to compute the Lagrange parameter λ as explicitlyas we have done in the case of a power and of an exponential utility function.Thus, we use for our numerical computation an iteration method, i.e. weevaluate (2) for a fixed λ, then compute the error of the constraint (2) andcorrect the λ. We iterate this until the error is sufficiently small.Let us now give a couple of examples to see how optimal structured productslook like.
Power utility
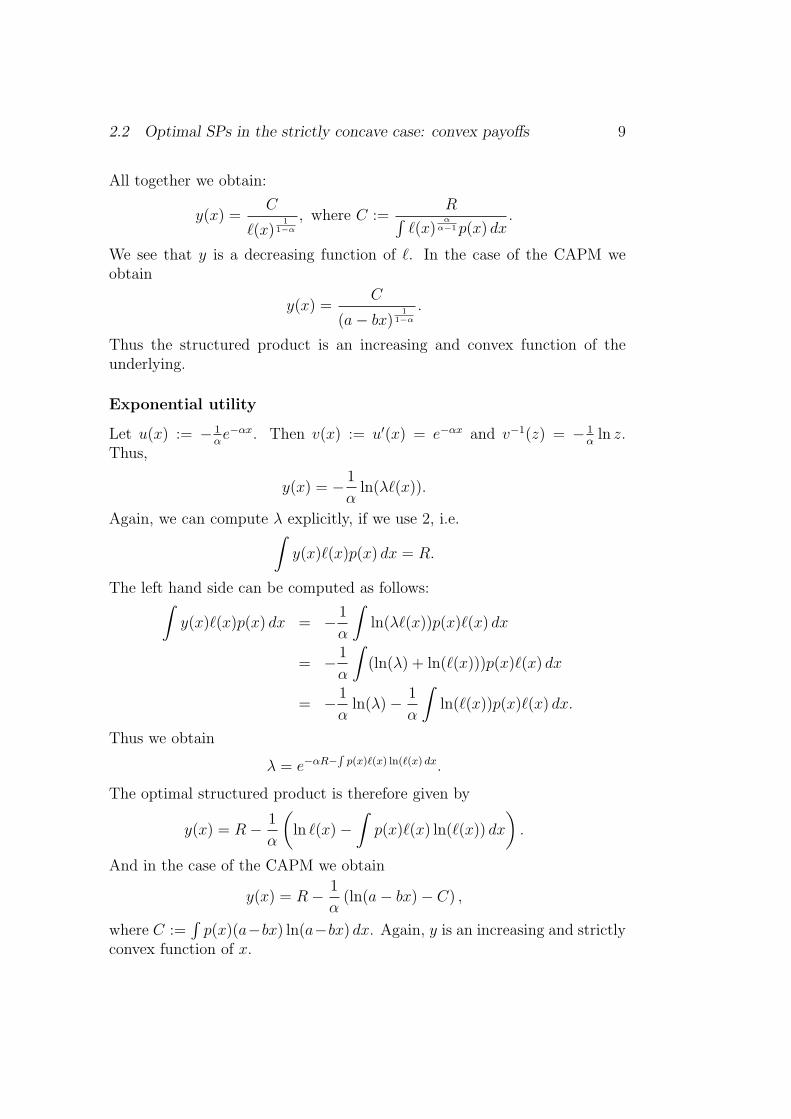
Let us consider the power utility function u(x) = xα/α (i.e. a typical functionwith constant relative risk aversion −x · u′′(x)/u′(x) = 1− α). The optimalstructured products for expected utility investors with this utility functionon a CAPM market (here and in the following examples always R = 0.05,σ = 0.2 and µ = 1.09) is shown in Fig. 3. We see that the payoff function
10This intuition can be used to prove a special case of this theorem, which has beenfound by Dybvig [10].
12 2 DESIGNING OPTIMAL SPS
0.7 0.8 0.9 1 1.1 1.2 1.3 1.4 1.50.7
0.8
0.9
1
1.1
1.2
1.3
1.4
1.5
-4
-2.5-1
0.5
Figure 3: Optimal structured product for CRRA-investors with α =−4,−2.5,−1, 0.5.
of the product is strictly convex (which we know already from Theorem 1).It features a “smooth” capital protection and an increasing participation ingains.
Exponential utility
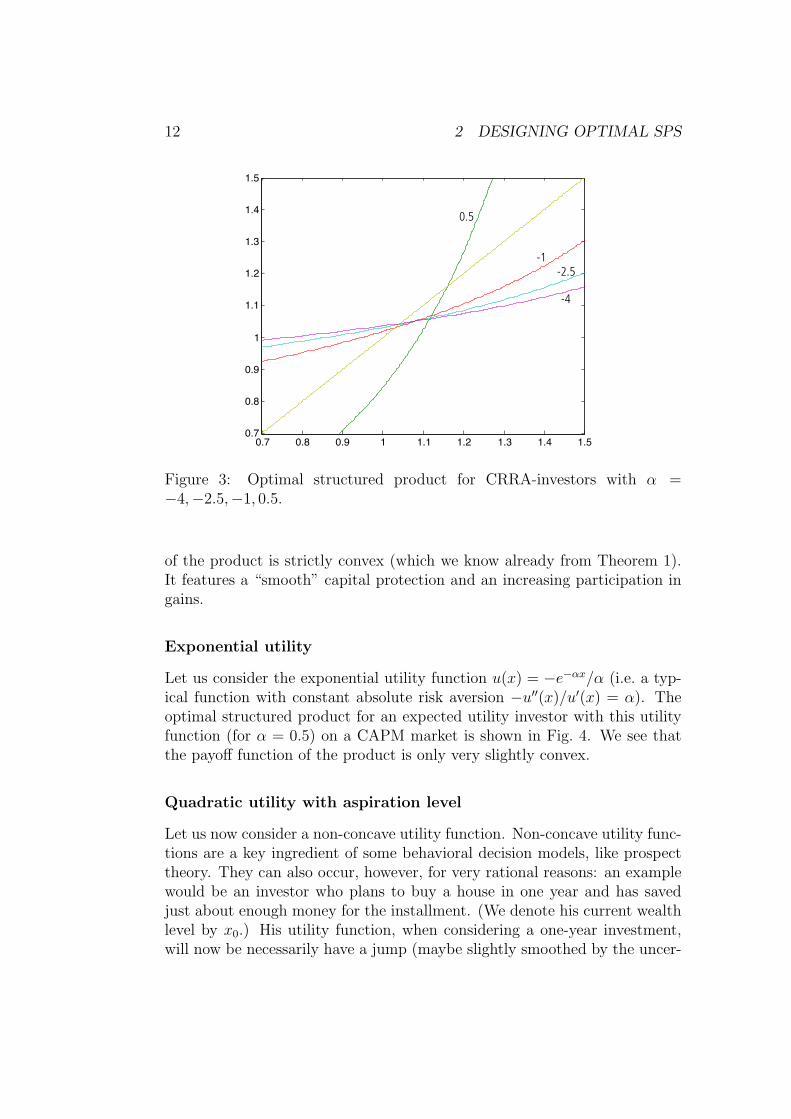
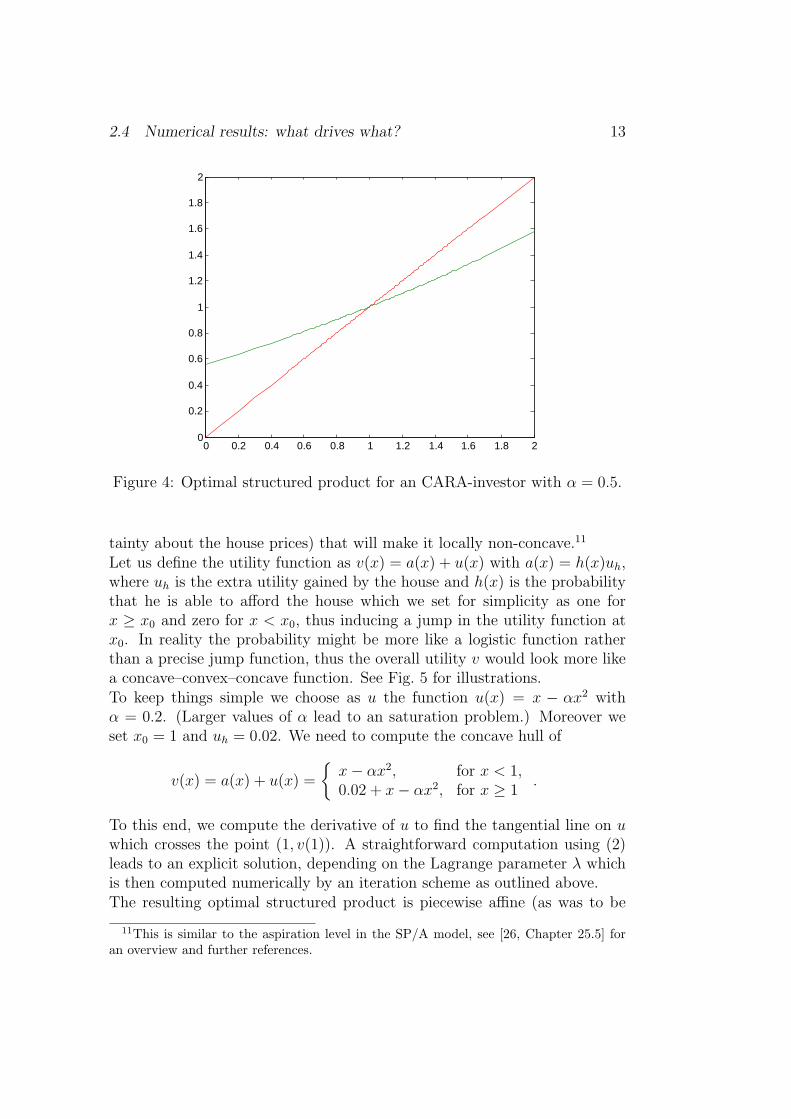
Let us consider the exponential utility function u(x) = −e−αx/α (i.e. a typ-ical function with constant absolute risk aversion −u′′(x)/u′(x) = α). Theoptimal structured product for an expected utility investor with this utilityfunction (for α = 0.5) on a CAPM market is shown in Fig. 4. We see thatthe payoff function of the product is only very slightly convex.
Quadratic utility with aspiration level
Let us now consider a non-concave utility function. Non-concave utility func-tions are a key ingredient of some behavioral decision models, like prospecttheory. They can also occur, however, for very rational reasons: an examplewould be an investor who plans to buy a house in one year and has savedjust about enough money for the installment. (We denote his current wealthlevel by x0.) His utility function, when considering a one-year investment,will now be necessarily have a jump (maybe slightly smoothed by the uncer-
2.4 Numerical results: what drives what? 13
0 0.2 0.4 0.6 0.8 1 1.2 1.4 1.6 1.8 20
0.2
0.4
0.6
0.8
1
1.2
1.4
1.6
1.8
2
Figure 4: Optimal structured product for an CARA-investor with α = 0.5.
tainty about the house prices) that will make it locally non-concave.11
Let us define the utility function as v(x) = a(x) + u(x) with a(x) = h(x)uh,where uh is the extra utility gained by the house and h(x) is the probabilitythat he is able to afford the house which we set for simplicity as one forx ≥ x0 and zero for x < x0, thus inducing a jump in the utility function atx0. In reality the probability might be more like a logistic function ratherthan a precise jump function, thus the overall utility v would look more likea concave–convex–concave function. See Fig. 5 for illustrations.To keep things simple we choose as u the function u(x) = x − αx2 withα = 0.2. (Larger values of α lead to an saturation problem.) Moreover weset x0 = 1 and uh = 0.02. We need to compute the concave hull of
v(x) = a(x) + u(x) =
{x− αx2, for x < 1,0.02 + x− αx2, for x ≥ 1
.
To this end, we compute the derivative of u to find the tangential line on uwhich crosses the point (1, v(1)). A straightforward computation using (2)leads to an explicit solution, depending on the Lagrange parameter λ whichis then computed numerically by an iteration scheme as outlined above.The resulting optimal structured product is piecewise affine (as was to be
11This is similar to the aspiration level in the SP/A model, see [26, Chapter 25.5] foran overview and further references.

14 2 DESIGNING OPTIMAL SPS
x
v(x)=u(x)+a(x)
x
v(x)=u(x)+a(x)
convex concaveconcave
Figure 5: The utility function v of an investor with an aspiration level: hisutility increases above a certain threshold, thus making it non-concave with ajump (left). If the precise location of the threshold is uncertain, the effectiveutility function becomes again continuous, but is still convex around thatpoint (right).
0.5 0.6 0.7 0.8 0.9 1 1.1 1.2 1.3 1.4 1.50.5
0.6
0.7
0.8
0.9
1
1.1
1.2
1.3
1.4
1.5
0.90
1.001.05
1.10
Figure 6: Optimal structured products for investors with quadratic utility(α = 0.2) plus an aspiration for uh = 0.2 at position x0 = 0.9, 1, 1.05, 1.1.
2.4 Numerical results: what drives what? 15
expected when using a quadratic u in CAPM12) and corresponds to a limitedcapital protection as it can be found in many structured products (compareFig. 6).
The model, even though certainly simplistic, can in fact be confirmed byempirical evidence: the classical investment goal for private investors is realestate. Whereas in the US the percentage of realty owners in the populationis very high, this is not the case in most continental European countries,moreover there houses are usually owned for longer periods of time, thus,buying realty tends to be a very special event. If our previous considerationsare correct, then we would therefore expect that investors who plan to buyrealty in the next future would be more interested in buying capital protectedSPs. This has been tested in a survey by AZEK [12], where N = 106 testsubjects have been asked to choose between six structured products on theMSCI World, out of which one provided a full capital protection. The testsubjects were mainly bankers and other professionals working in the financialindustry, thus their competence in understanding the survey question can beassumed. The subjects were also asked whether they plan to buy in thenext years a house or an apartment and whether they already own realty. Asimple lottery question was used as proxy for their loss aversion.
According to our model there should be a significant positive relation betweenthe investment into a capital protected product and the plan to buy realty.This correlation could, however, also be triggered by a general affinity toconservative investments, which is just reflected by the plan to buy realty. Totest this, we performed a logit regression where we added two independentvariables: the loss aversion as estimated from the lottery question and adummy variable for the owners of realty. It turned out that all of these factorswere significant for their decision (see Table 2.4). The effect was stable whenremoving the dummy variables for realty owners and the loss aversion andwas even more pronounced when only considering subjects which did notown realty yet (N = 85).
Prospect theory
We can also use prospect theory as underlying preferences, i.e. a utility func-tion which is convex in losses and concave in gains. As functional formwe use here the specification from [33] that can be seen as a second order
12If we use Black-Scholes, we get piecewise affine solutions when using piecewise expo-nential utility functions, as can be shown be a similar computation.

16 2 DESIGNING OPTIMAL SPS
All subjects (N = 106):Model 1 Model 2 Model 3
Coeff. Prob> χ2 Coeff. Prob> χ2 Coeff. Prob> χ2
Plan to buy 1.994 0.001*** 0.749 0.047** 1.101 0.059*Owning realty 1.919 0.032** 1.138 0.066*Loss aversion 0.819 0.035**
Only non-owners (N = 85):Model 1 Model 2
Coeff. Prob> χ2 Coeff. Prob> χ2
Plan to buy 1.845 0.002*** 1.907 0.001***Loss aversion 1.094 0.001***
Table 1: Factors influencing the decision to invest into a capital protectedstructured product. ∗, ∗∗, ∗ ∗ ∗ =significant on the 10%, 5%, 1% level.
approximation of any prospect theory value function:13
u(x) :=
{−λ(x− βx2), for x < 0,x− αx2, for x ≥ 0.
(5)
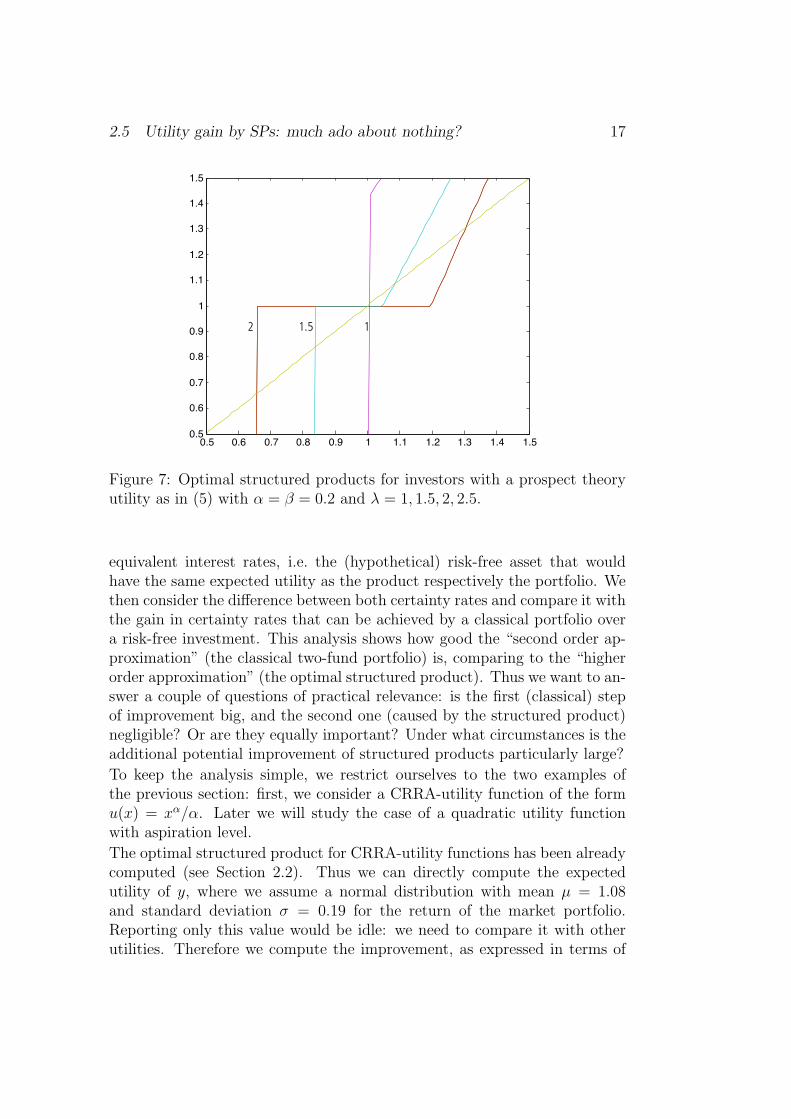
We can think here of an investor who is (like most investors) afraid of losses,but does not distinguish that much between small and large losses. This leadsto risk-seeking behavior in losses. Depending on the amount of loss-aversionλ a smaller or larger amount of capital protection becomes optimal. Figure 7shows the optimal solution in this case for various values of loss-aversion.
2.5 Utility gain by SPs: much ado about nothing?
We have seen so far that optimal structured products do indeed deliver a pay-off structure that is different to classical portfolios including only the marketportfolio and a risk-free asset. The effort of computing such an optimal struc-tured product and hedging it can in praxis not be neglected, therefore thenatural question arises whether it is worth it: how big is the potential utilityimprovement?To answer this question, we compute the expected utility of an optimal struc-tured product and the expected utility of the optimal mix between the mar-ket portfolio and the risk-free asset. We translate both values into certainty
13This form is also computationally simpler than the standard specification by Tverskyand Kahneman [29] and incorporates mean-variance preferences as a the special case whenα = β and λ = 1.
2.5 Utility gain by SPs: much ado about nothing? 17
0.5 0.6 0.7 0.8 0.9 1 1.1 1.2 1.3 1.4 1.50.5
0.6
0.7
0.8
0.9
1
1.1
1.2
1.3
1.4
1.5
11.52
Figure 7: Optimal structured products for investors with a prospect theoryutility as in (5) with α = β = 0.2 and λ = 1, 1.5, 2, 2.5.
equivalent interest rates, i.e. the (hypothetical) risk-free asset that wouldhave the same expected utility as the product respectively the portfolio. Wethen consider the difference between both certainty rates and compare it withthe gain in certainty rates that can be achieved by a classical portfolio overa risk-free investment. This analysis shows how good the “second order ap-proximation” (the classical two-fund portfolio) is, comparing to the “higherorder approximation” (the optimal structured product). Thus we want to an-swer a couple of questions of practical relevance: is the first (classical) stepof improvement big, and the second one (caused by the structured product)negligible? Or are they equally important? Under what circumstances is theadditional potential improvement of structured products particularly large?
To keep the analysis simple, we restrict ourselves to the two examples ofthe previous section: first, we consider a CRRA-utility function of the formu(x) = xα/α. Later we will study the case of a quadratic utility functionwith aspiration level.
The optimal structured product for CRRA-utility functions has been alreadycomputed (see Section 2.2). Thus we can directly compute the expectedutility of y, where we assume a normal distribution with mean µ = 1.08and standard deviation σ = 0.19 for the return of the market portfolio.Reporting only this value would be idle: we need to compare it with otherutilities. Therefore we compute the improvement, as expressed in terms of
18 2 DESIGNING OPTIMAL SPS
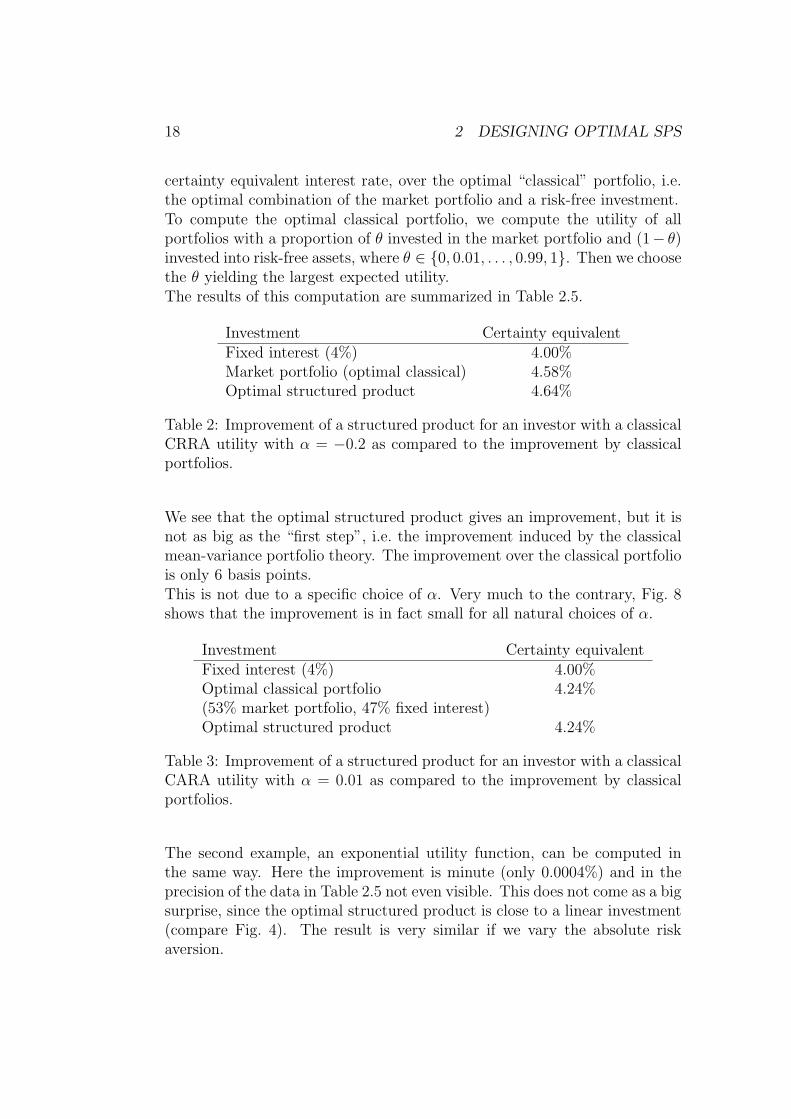
certainty equivalent interest rate, over the optimal “classical” portfolio, i.e.the optimal combination of the market portfolio and a risk-free investment.To compute the optimal classical portfolio, we compute the utility of allportfolios with a proportion of θ invested in the market portfolio and (1− θ)invested into risk-free assets, where θ ∈ {0, 0.01, . . . , 0.99, 1}. Then we choosethe θ yielding the largest expected utility.The results of this computation are summarized in Table 2.5.
Investment Certainty equivalentFixed interest (4%) 4.00%Market portfolio (optimal classical) 4.58%Optimal structured product 4.64%
Table 2: Improvement of a structured product for an investor with a classicalCRRA utility with α = −0.2 as compared to the improvement by classicalportfolios.
We see that the optimal structured product gives an improvement, but it isnot as big as the “first step”, i.e. the improvement induced by the classicalmean-variance portfolio theory. The improvement over the classical portfoliois only 6 basis points.This is not due to a specific choice of α. Very much to the contrary, Fig. 8shows that the improvement is in fact small for all natural choices of α.
Investment Certainty equivalentFixed interest (4%) 4.00%Optimal classical portfolio 4.24%(53% market portfolio, 47% fixed interest)Optimal structured product 4.24%
Table 3: Improvement of a structured product for an investor with a classicalCARA utility with α = 0.01 as compared to the improvement by classicalportfolios.
The second example, an exponential utility function, can be computed inthe same way. Here the improvement is minute (only 0.0004%) and in theprecision of the data in Table 2.5 not even visible. This does not come as a bigsurprise, since the optimal structured product is close to a linear investment(compare Fig. 4). The result is very similar if we vary the absolute riskaversion.

2.5 Utility gain by SPs: much ado about nothing? 19
−5 −4 −3 −2 −1 0 10.9
0.95
1
1.05
1.1
1.15Utility (depending on alpha)
fixed intereststock marketoptimal two−fundoptimal SP
Figure 8: Utility for CRRA (as measured by the certainty equivalent interestrate) of stock, risk-free asset (5% return), optimal two-fund portfolio andoptimal structured product. The utility gain by the structured product issmall.
So far it looks like the improvements of structured products are somewherebetween tiny and small, but noticeable. Structured products – much adoabout nothing? Are there no situations in which we can generate a decisiveimprovement of a portfolio with their help?
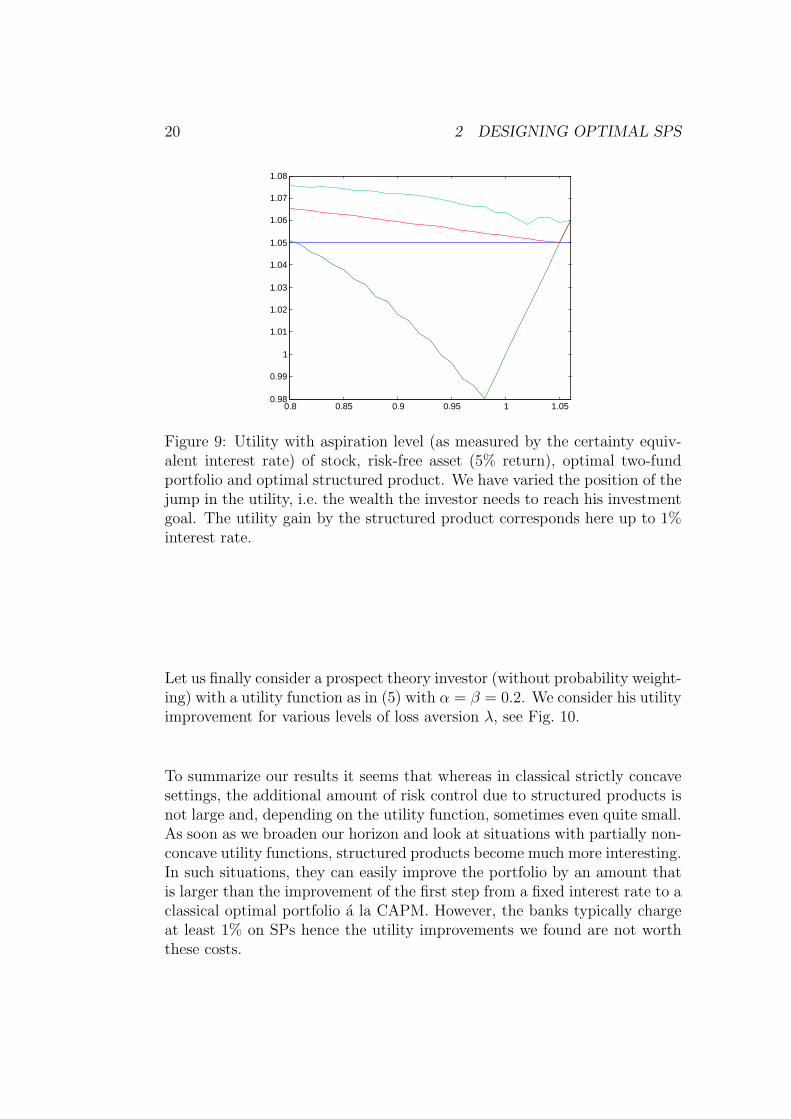
Let us consider the third example, the quadratic utility with aspiration level.Here, finally, the improvement due to structured products is considerable aswe see in Table 2.5. In fact, the improvement is as big (or bigger) than the“first step improvement” done by the classical mean-variance theory! Theimprovement is similar for various “aspiration levels” as Fig. 9 illustrates.
Investment Certainty equivalentFixed interest (4%) 4.00%Market portfolio 3.74%Optimal classical 4.06%(8% market portfolio, 92% fixed interest)Optimal structured product 4.30%
Table 4: Improvement of a structured product for an investor with an aspi-ration level as compared to the improvement by classical portfolios.
20 2 DESIGNING OPTIMAL SPS
0.8 0.85 0.9 0.95 1 1.050.98
0.99
1
1.01
1.02
1.03
1.04
1.05
1.06
1.07
1.08
Figure 9: Utility with aspiration level (as measured by the certainty equiv-alent interest rate) of stock, risk-free asset (5% return), optimal two-fundportfolio and optimal structured product. We have varied the position of thejump in the utility, i.e. the wealth the investor needs to reach his investmentgoal. The utility gain by the structured product corresponds here up to 1%interest rate.
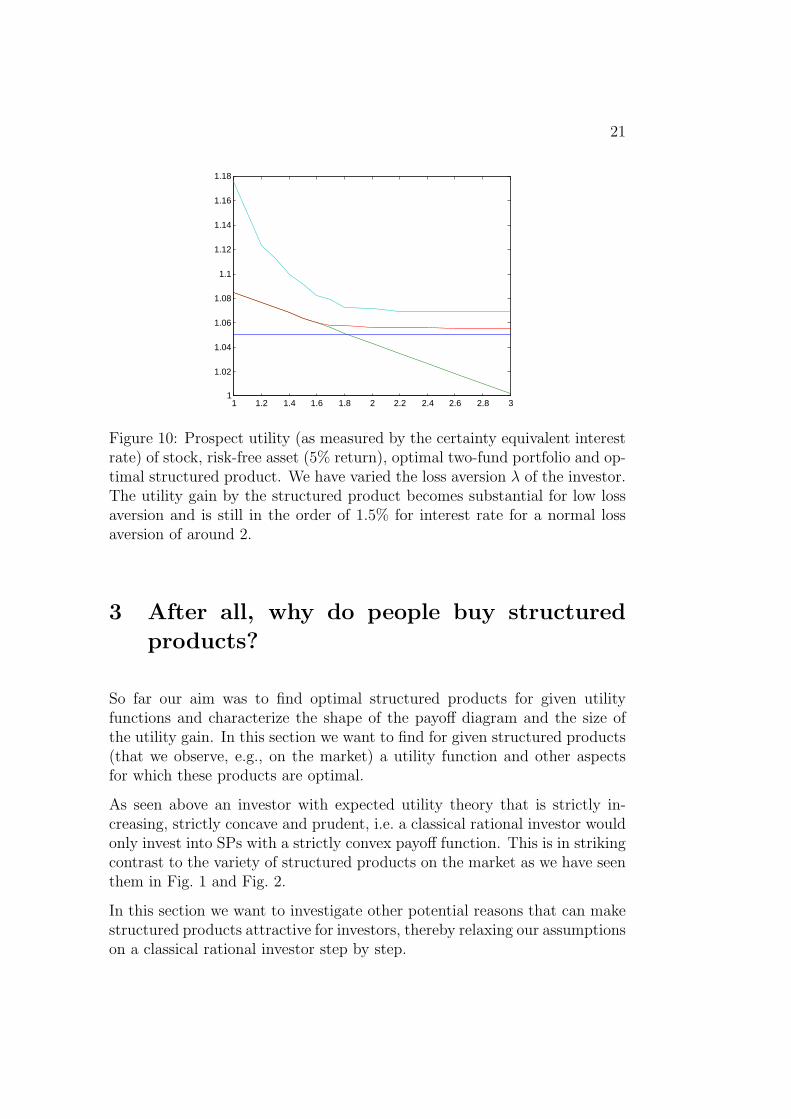
Let us finally consider a prospect theory investor (without probability weight-ing) with a utility function as in (5) with α = β = 0.2. We consider his utilityimprovement for various levels of loss aversion λ, see Fig. 10.
To summarize our results it seems that whereas in classical strictly concavesettings, the additional amount of risk control due to structured products isnot large and, depending on the utility function, sometimes even quite small.As soon as we broaden our horizon and look at situations with partially non-concave utility functions, structured products become much more interesting.In such situations, they can easily improve the portfolio by an amount thatis larger than the improvement of the first step from a fixed interest rate to aclassical optimal portfolio a la CAPM. However, the banks typically chargeat least 1% on SPs hence the utility improvements we found are not worththese costs.
21
1 1.2 1.4 1.6 1.8 2 2.2 2.4 2.6 2.8 31
1.02
1.04
1.06
1.08
1.1
1.12
1.14
1.16
1.18
Figure 10: Prospect utility (as measured by the certainty equivalent interestrate) of stock, risk-free asset (5% return), optimal two-fund portfolio and op-timal structured product. We have varied the loss aversion λ of the investor.The utility gain by the structured product becomes substantial for low lossaversion and is still in the order of 1.5% for interest rate for a normal lossaversion of around 2.
3 After all, why do people buy structured
products?
So far our aim was to find optimal structured products for given utilityfunctions and characterize the shape of the payoff diagram and the size ofthe utility gain. In this section we want to find for given structured products(that we observe, e.g., on the market) a utility function and other aspectsfor which these products are optimal.
As seen above an investor with expected utility theory that is strictly in-creasing, strictly concave and prudent, i.e. a classical rational investor wouldonly invest into SPs with a strictly convex payoff function. This is in strikingcontrast to the variety of structured products on the market as we have seenthem in Fig. 1 and Fig. 2.
In this section we want to investigate other potential reasons that can makestructured products attractive for investors, thereby relaxing our assumptionson a classical rational investor step by step.

223 AFTER ALL, WHY DO PEOPLE BUY STRUCTURED PRODUCTS?
3.1 Background risk
Let us relax our initial assumptions that an investor only invests into astructured product (or considers the investment in SPs separately from otherinvestments) and allow the investor instead to hold additionally to the SP aportfolio of classical assets – a combination of the market portfolio and risk-free assets. In order to conclude that also in this setting optimal structuredproducts are convex, suppose the contrary, i.e. that the return of the SP isdescribed by a function y which is non-convex. Then the overall portfoliocan be described by the function
y(x) = λ1R + λ2x+ (1− λ1 − λ2)y(x),
where λ1 > 0 is the proportion of total wealth invested in risk-free assets andλ2 > 0 is the proportion of wealth invested in the market portfolio such that1 − λ1 − λ2 > 0. According to Theorem 1 the function y is strictly convex,but y′′(x) = y′′(x), thus we have a contradiction to the assumption that y isnon-convex.We conclude that a non-convex SP for a classical rational investor wouldonly be useful if he already has assets with a strictly convex payoff functionin his portfolio. Mixing his assets in this way seems unrealistic, but ignoringthis, if we consider such assets as SPs and study the sum of all SPs, thestatements about optimal SPs are still true, but apply to the sum of the SPsin the investor’s portfolio.
3.2 Investors with PT-type utility function
There is ample experimental and empirical evidence in favor of non-classicaldecision theories like prospect theory. In the next step, we will thereforeimplement one of the key ingredients of prospect theory, namely the convex-concave structure of the utility function with respect to a reference point thatis in itself not fixed, but can, for instance, be the initial value of an asset.We have seen already that in this case loss-aversion can induce a non-convexpayoff function of an optimal structured product with a “plateau” at zeroreturn. This mimics a frequent feature of structured products, namely limitedcapital protection that is valid only up to a certain amount of losses.More popular structures, however, like the highly popular barrier reverseconvertibles can still not be optimal, since we have the following corollaryfrom the co-monotonicity results in [23]:
Corollary 2. If the decision model is given by an arbitrary utility function(possibly with reference point set by the initial wealth level), any optimal

3.3 Probability weighting 23
structured product in a CAPM market (or any market where the likelihoodratio is decreasing as a function of the return of the market portfolio) is amonotonically increasing function (or correspondence) of the market return.
In other words: the higher the return of the market portfolio at maturity,the higher the return of the structured product.
This is obviously violated for all types of barrier products or, more generally,all structured products whose return at maturity is not solely defined by thereturn of the underlying market portfolio at maturity. Thus the modifiedutility function of prospect theory can only explain the popularity of someof the structured products offered today. The most popular types cannot beunderstood within this model.
3.3 Probability weighting
Experimental studies have demonstrated that subjects systematically over-weight small probabilities, i.e. small probability events (e.g. large losses whendeciding about buying insurance or large gains when deciding about buyinga lottery ticket) tend to have more impact on the decision than they oughtto have [18]. This effect should not be mixed up with probability misesti-mation: probability weighting even affects decisions where the probabilitiesare known and do not have to be estimated. In this section we add proba-bility weighting and observe its effects on the qualitative features of optimalstructured products.
First, we need to distinguish two models of probability weighting:
1. We consider the return distribution of the structured product and applya probability weighting to it.
2. We apply probability weighting to the return distribution of the under-lying.
Both approaches are a priori reasonable, but lead to very different results. Inparticular, in the first case, the monotonicity result of Theorem 3 still holds,thus the payoff function is still monotonic. In the second case, however,this is no longer the case, since the utility becomes in a certain sense statedependent. With this form of probability weighting we can therefore explain,for instance, the attractiveness of constructions that give high payoffs forextreme events (which are overweighted by the probability weighting), inparticular straddles.
Nevertheless, the payoff is still (essentially) a function of the underlying:
243 AFTER ALL, WHY DO PEOPLE BUY STRUCTURED PRODUCTS?
Theorem 4. Assume that the return of the market portfolio is an absolutelycontinuous measure with a smooth distribution function p which is nowhereequal to zero. For an investor with a smooth utility function (possibly witha reference point depending on the initial wealth) and a probability weightingof the underlying with a smooth probability weighting function w, an optimalstructured product has a piecewise smooth payoff function14 of the underlyingmarket portfolio.
Proof. Let p∗ denote the return distribution of the market portfolio afterprobability weighting has been applied. More precisely, in cumulative prospecttheory we define15
p∗(x) :=d
dx
(w
(∫ x
−∞p(t) dt
)).
Similarly, in prospect theory (see [18, 19, 25]), we define for γ ∈ (0, 1]:
p∗(x) :=p(x)γ∫
R p(x)γ dx.
Now in both cases it is easy to see that p∗ is smooth and nowhere zero. Wedefine w∗(x) := p∗(x)/p(x). Then the optimal structured product maximizes
U(p) :=
∫Ru(y(x))p∗(x) dx,
subject to ∫Ry(x)
`(x)
w∗(x)p∗(x) dx = R. (6)
From the co-monotonicity result [23], we know that the maximizer y of thisproblem is a monotonic function (remember that p is absolutely continuous)of `(x)/w∗(x). Since w∗ is smooth, we can differentiate this expression andarrive at
d
dx
(`(x)
w∗(x)
)=`′(x)w∗(x)− `(x)w′∗(x)
w∗(x)2,
which is a smooth function, thus y is piecewise smooth.This result implies in particular that y is still a function of the market return.This has a strong consequence: some of the most popular classes of products,namely all products with path-dependent payoff (in particular barrier reverseconvertibles and bonus certificates), still cannot be explained by this model!
14This means that the payoff function can have finitely many jumps, but is smootheverywhere else.
15We could also use a decumulative function in gains as in the original formulationin [29], but both is mathematically equivalent if we choose w differently in gains andlosses.
3.4 Betting against the market 25
3.4 Betting against the market
We have seen from the results in the previous sections: if we want to under-stand why investors buy structured products like barrier reverse convertiblesor basket products, we need to take into account other factors than just riskpreferences.One such factor is disagreement with the market beliefs: so far we have al-ways assumed that investors don’t know better than the market and thusthe physical return distribution p is also used in their estimate of the util-ity. If both are different, we label this as “betting against the market” or“speculation”. Believing that the market will behave differently than theprobability distribution p forecasts might be wise in some circumstances, butit is probably much more frequently a sign of overconfidence – an all toocommon characteristics of private investors.First, we notice that the monotonicity result (Theorem 3) does not holdanymore, since it relied on the homogeneity of the beliefs. In fact, we haveto change our model. Fortunately, we can use essentially the same idea aswith probability weighting: let us denote the estimated probability of theinvestor by p, then his optimization problem becomes
Maximize U(y) :=
∫Ru(y(x))p(x) dx,
in L1(R, `p) subject to ∫Ry(x)`(x)p(x) dx = R. (7)
Defining w(x) := p(x)/p(x) and ˜(x) := w(x)`(x) we can transform thisproblem to
Maximize U(y) :=
∫Ru(y(x))p(x) dx,
subject to ∫Ry(x)˜(x)p(x) dx = R. (8)
This new problem can now be solved in the same way as above. As withprobability weighting, we do not necessarily have a monotonic payoff func-tion, but the fact that the optimal SP can be described by a payoff functionstill holds:
263 AFTER ALL, WHY DO PEOPLE BUY STRUCTURED PRODUCTS?
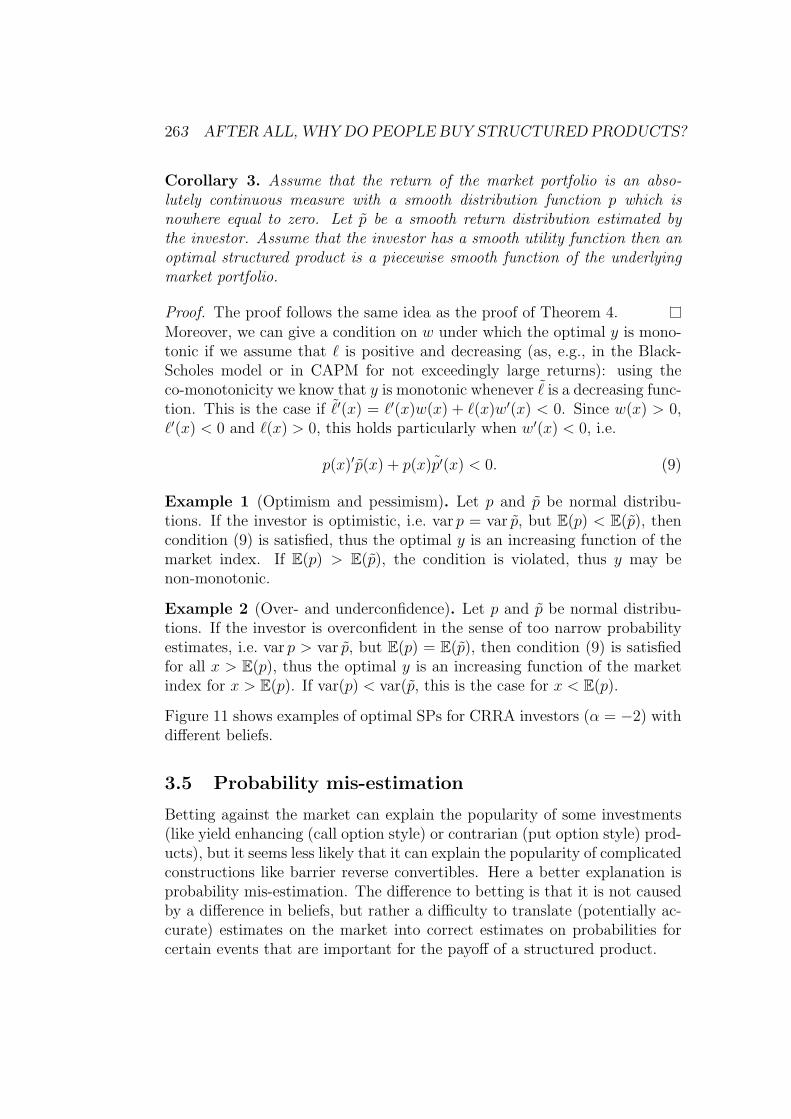
Corollary 3. Assume that the return of the market portfolio is an abso-lutely continuous measure with a smooth distribution function p which isnowhere equal to zero. Let p be a smooth return distribution estimated bythe investor. Assume that the investor has a smooth utility function then anoptimal structured product is a piecewise smooth function of the underlyingmarket portfolio.
Proof. The proof follows the same idea as the proof of Theorem 4.Moreover, we can give a condition on w under which the optimal y is mono-tonic if we assume that ` is positive and decreasing (as, e.g., in the Black-Scholes model or in CAPM for not exceedingly large returns): using theco-monotonicity we know that y is monotonic whenever ˜is a decreasing func-tion. This is the case if ˜′(x) = `′(x)w(x) + `(x)w′(x) < 0. Since w(x) > 0,`′(x) < 0 and `(x) > 0, this holds particularly when w′(x) < 0, i.e.
p(x)′p(x) + p(x)p′(x) < 0. (9)
Example 1 (Optimism and pessimism). Let p and p be normal distribu-tions. If the investor is optimistic, i.e. var p = var p, but E(p) < E(p), thencondition (9) is satisfied, thus the optimal y is an increasing function of themarket index. If E(p) > E(p), the condition is violated, thus y may benon-monotonic.
Example 2 (Over- and underconfidence). Let p and p be normal distribu-tions. If the investor is overconfident in the sense of too narrow probabilityestimates, i.e. var p > var p, but E(p) = E(p), then condition (9) is satisfiedfor all x > E(p), thus the optimal y is an increasing function of the marketindex for x > E(p). If var(p) < var(p, this is the case for x < E(p).
Figure 11 shows examples of optimal SPs for CRRA investors (α = −2) withdifferent beliefs.
3.5 Probability mis-estimation
Betting against the market can explain the popularity of some investments(like yield enhancing (call option style) or contrarian (put option style) prod-ucts), but it seems less likely that it can explain the popularity of complicatedconstructions like barrier reverse convertibles. Here a better explanation isprobability mis-estimation. The difference to betting is that it is not causedby a difference in beliefs, but rather a difficulty to translate (potentially ac-curate) estimates on the market into correct estimates on probabilities forcertain events that are important for the payoff of a structured product.
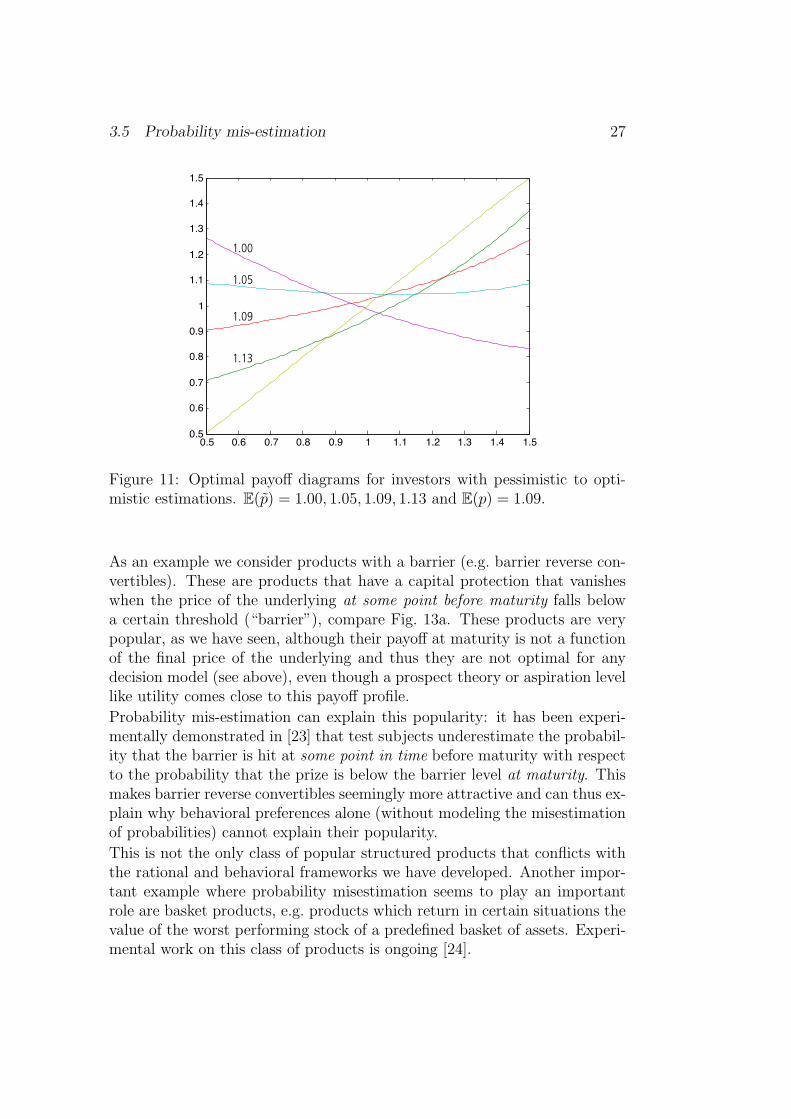
3.5 Probability mis-estimation 27
0.5 0.6 0.7 0.8 0.9 1 1.1 1.2 1.3 1.4 1.50.5
0.6
0.7
0.8
0.9
1
1.1
1.2
1.3
1.4
1.5
1.00
1.05
1.09
1.13
Figure 11: Optimal payoff diagrams for investors with pessimistic to opti-mistic estimations. E(p) = 1.00, 1.05, 1.09, 1.13 and E(p) = 1.09.
As an example we consider products with a barrier (e.g. barrier reverse con-vertibles). These are products that have a capital protection that vanisheswhen the price of the underlying at some point before maturity falls belowa certain threshold (“barrier”), compare Fig. 13a. These products are verypopular, as we have seen, although their payoff at maturity is not a functionof the final price of the underlying and thus they are not optimal for anydecision model (see above), even though a prospect theory or aspiration levellike utility comes close to this payoff profile.
Probability mis-estimation can explain this popularity: it has been experi-mentally demonstrated in [23] that test subjects underestimate the probabil-ity that the barrier is hit at some point in time before maturity with respectto the probability that the prize is below the barrier level at maturity. Thismakes barrier reverse convertibles seemingly more attractive and can thus ex-plain why behavioral preferences alone (without modeling the misestimationof probabilities) cannot explain their popularity.
This is not the only class of popular structured products that conflicts withthe rational and behavioral frameworks we have developed. Another impor-tant example where probability misestimation seems to play an importantrole are basket products, e.g. products which return in certain situations thevalue of the worst performing stock of a predefined basket of assets. Experi-mental work on this class of products is ongoing [24].
28 4 INVESTOR CHOICES
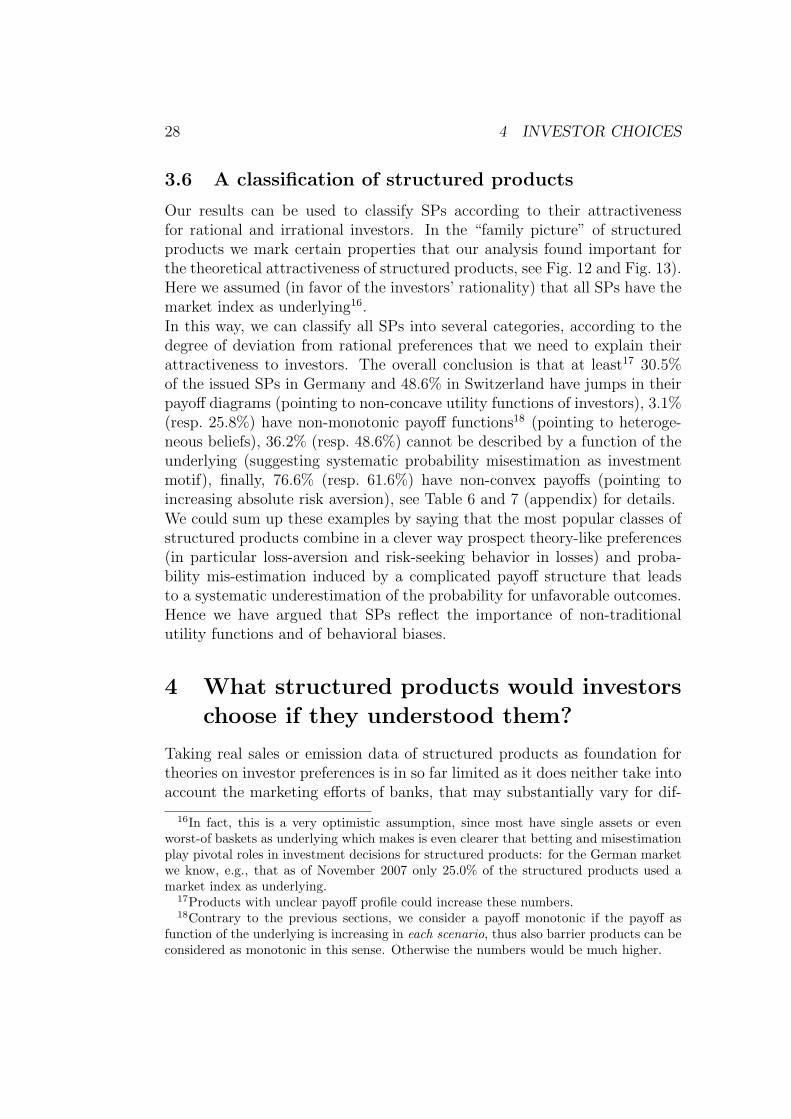
3.6 A classification of structured products
Our results can be used to classify SPs according to their attractivenessfor rational and irrational investors. In the “family picture” of structuredproducts we mark certain properties that our analysis found important forthe theoretical attractiveness of structured products, see Fig. 12 and Fig. 13).Here we assumed (in favor of the investors’ rationality) that all SPs have themarket index as underlying16.In this way, we can classify all SPs into several categories, according to thedegree of deviation from rational preferences that we need to explain theirattractiveness to investors. The overall conclusion is that at least17 30.5%of the issued SPs in Germany and 48.6% in Switzerland have jumps in theirpayoff diagrams (pointing to non-concave utility functions of investors), 3.1%(resp. 25.8%) have non-monotonic payoff functions18 (pointing to heteroge-neous beliefs), 36.2% (resp. 48.6%) cannot be described by a function of theunderlying (suggesting systematic probability misestimation as investmentmotif), finally, 76.6% (resp. 61.6%) have non-convex payoffs (pointing toincreasing absolute risk aversion), see Table 6 and 7 (appendix) for details.We could sum up these examples by saying that the most popular classes ofstructured products combine in a clever way prospect theory-like preferences(in particular loss-aversion and risk-seeking behavior in losses) and proba-bility mis-estimation induced by a complicated payoff structure that leadsto a systematic underestimation of the probability for unfavorable outcomes.Hence we have argued that SPs reflect the importance of non-traditionalutility functions and of behavioral biases.
4 What structured products would investors
choose if they understood them?
Taking real sales or emission data of structured products as foundation fortheories on investor preferences is in so far limited as it does neither take intoaccount the marketing efforts of banks, that may substantially vary for dif-
16In fact, this is a very optimistic assumption, since most have single assets or evenworst-of baskets as underlying which makes is even clearer that betting and misestimationplay pivotal roles in investment decisions for structured products: for the German marketwe know, e.g., that as of November 2007 only 25.0% of the structured products used amarket index as underlying.
17Products with unclear payoff profile could increase these numbers.18Contrary to the previous sections, we consider a payoff monotonic if the payoff as
function of the underlying is increasing in each scenario, thus also barrier products can beconsidered as monotonic in this sense. Otherwise the numbers would be much higher.
29
(a) Discount Certificates
co-monotone; non-convex;can be explained by in-creasing ARA
(b) Bonus-/partially pro-tected products
non-co-monotone; can onlybe explained by combina-tion of non-concave utilityand probability misestima-tion
(c) K.O. products withstop loss
can be explained by specu-lation
(d) K.O. products withoutstop loss
can be explained by specu-lation
(e) Reverse convertibles
co-monotone; non-convex;can be explained by in-creasing ARA
(f) Exotic leverage
co-monotone; non-convex;can be explained by in-creasing ARA
Figure 12: The list of the most popular structured products on the Germanmarket and an explanation of their attractiveness, based on our results.
ferent product types, nor the availability of structured products. Laboratoryexperiments on the other hand suffer from sample selection (typically theyare conducted with undergraduate students and not with real investors) andfrom a lack of real incentive. We had the unique chance to conduct a fieldstudy and to collect data in a rather unusual way: during the 175th anniver-sary event of our university a week-long exhibition at a central location indowntown Zurich took place where we presented a multi-touch table for thedesign of structured products.19 For a screenshot of the structured product
19The hardware and the user interface had been designed for us by the Swiss DesignInstitute for Finance and Banking. The core programming was done by the institute forcomputer science at the University of Zurich.
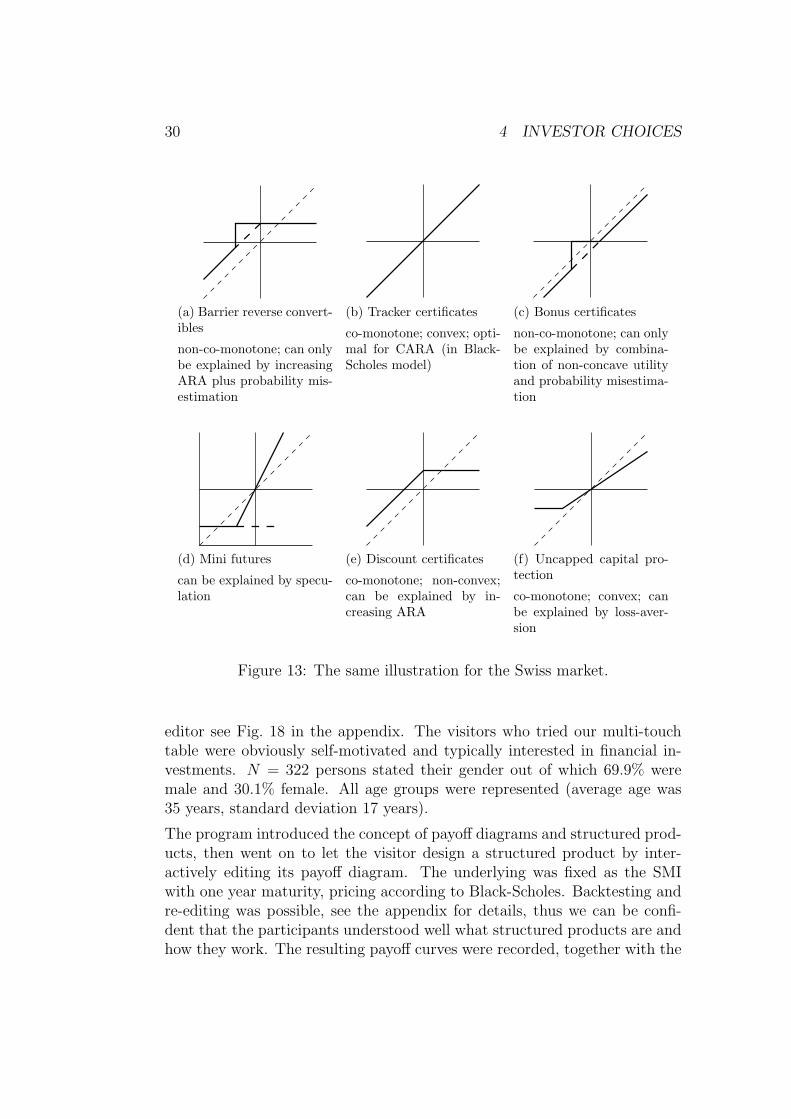
30 4 INVESTOR CHOICES
(a) Barrier reverse convert-ibles
non-co-monotone; can onlybe explained by increasingARA plus probability mis-estimation
(b) Tracker certificates
co-monotone; convex; opti-mal for CARA (in Black-Scholes model)
(c) Bonus certificates
non-co-monotone; can onlybe explained by combina-tion of non-concave utilityand probability misestima-tion
(d) Mini futures
can be explained by specu-lation
(e) Discount certificates
co-monotone; non-convex;can be explained by in-creasing ARA
(f) Uncapped capital pro-tection
co-monotone; convex; canbe explained by loss-aver-sion
Figure 13: The same illustration for the Swiss market.
editor see Fig. 18 in the appendix. The visitors who tried our multi-touchtable were obviously self-motivated and typically interested in financial in-vestments. N = 322 persons stated their gender out of which 69.9% weremale and 30.1% female. All age groups were represented (average age was35 years, standard deviation 17 years).
The program introduced the concept of payoff diagrams and structured prod-ucts, then went on to let the visitor design a structured product by inter-actively editing its payoff diagram. The underlying was fixed as the SMIwith one year maturity, pricing according to Black-Scholes. Backtesting andre-editing was possible, see the appendix for details, thus we can be confi-dent that the participants understood well what structured products are andhow they work. The resulting payoff curves were recorded, together with the
31
visitors’ answers to three lottery questions (as proxy for their risk attitudes),reasons why they might want to invest into structured products and somedemographic data (gender, age group and education).
The total data comprised N = 684 data sets, out of which N = 233 werecomplete (including answers to the demographical questions and the lotterytasks). Due to the uncontrolled situation at the exhibition it is not surprisingthat there were a few “playful” designs, so after data cleaning (taking outSPs with excessive fluctuations, i.e. volatility above 50) N = 219 out of the233 complete data sets remained.
What are the characteristics of the designed products? First, we checked forproperties that optimal SPs should satisfy according to the theory. Since weassumed a payoff function on the SMI we avoided a large class of non-optimalproducts. Nevertheless 47.7% of the self-designed SPs were non-monotonic(pointing to betting as motif) and 9.2% (4.7% of the monotonic products)showed a clear jump (pointing to non-concave utility functions). We alsoasked participants to state how much three potential reasons (diversifica-tion, portfolio insurance, speculation) would contribute to their decision tobuy structured products where we used the same questions as in [11]. Themost popular motif in our sample was portfolio insurance with an averagerate of 4.0 on a scale from 1 (not at all important) to 5 (very important).However, 45.2% of the participants gave 4 or more points to speculation, un-derlining the importance of betting for explaining attractiveness of structuredproducts.
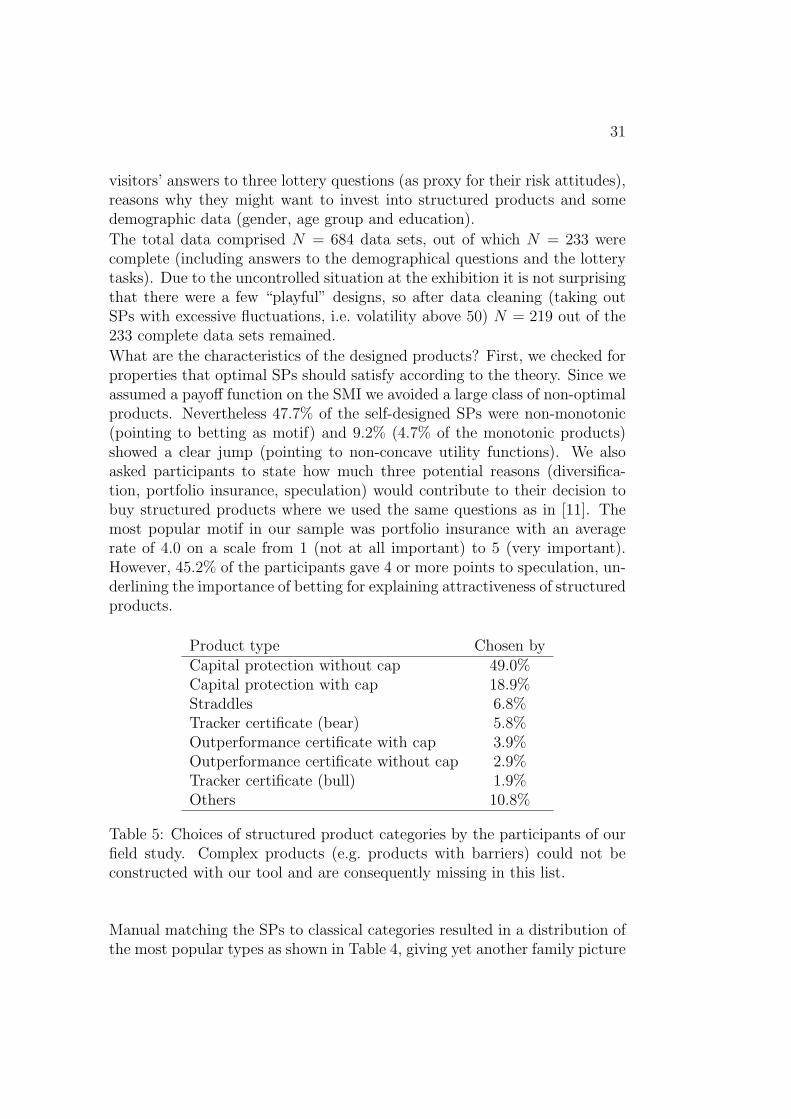
Product type Chosen byCapital protection without cap 49.0%Capital protection with cap 18.9%Straddles 6.8%Tracker certificate (bear) 5.8%Outperformance certificate with cap 3.9%Outperformance certificate without cap 2.9%Tracker certificate (bull) 1.9%Others 10.8%
Table 5: Choices of structured product categories by the participants of ourfield study. Complex products (e.g. products with barriers) could not beconstructed with our tool and are consequently missing in this list.
Manual matching the SPs to classical categories resulted in a distribution ofthe most popular types as shown in Table 4, giving yet another family picture

32 4 INVESTOR CHOICES
of structured products, that by construction excludes all barrier products andsimilarly complex structures.
In the next step, we averaged over all monotonic payoff functions to get asimple proxy for the favorite structured product of the “representative agent”(see Fig. 14) which looks similar to a capped capital protected product andhas features of a “covered call” which had been found to be popular amonginvestors buying options (compare [27] for an empirical study). The payoffpattern points to increasing absolute risk aversion in gains and decreasingabsolute risk aversion in losses (compare Theorem 2).
−0.4 −0.2 0.0 0.2 0.4
−0.
4−
0.2
0.0
0.2
0.4
Underlying
Opt
ion
●●●●●●●●●●●●●●●●●●●●●●●●●●●●●●●●●●●●●●●●●●●●●●●●●●
●●●
●●●
●
●
●●●●●●●●●●●●●●●●
●●●●●●●●●●●●●●●●●●●●●●●●●●●
●●●●●●●●●●●●●●●●●●●
●●●●
●●●●●●●●●●●●●●
●●●●●●●
●●●●●●●
●●●●●●●●●●●●●●●●●●●●●●
●●●●●●●●●●●●●●●●●●●●●●●●●●●●
Mean of Monotonous Structured Products
95% Confidence Interval
Figure 14: The average structured product as designed by the participants ofour experiment (line) with 95% confidence intervals (circles). Only productswith a monotonic payoff have been considered to take out obvious instancesof speculative motifs.
It is possible to compute the corresponding utility function (or more preciselyits concave envelope which we denote in the following for simplicity by u) forwhich this SP is optimal. To this end we need to take the inverse approachof the optimization procedure. We start from the derivation of (2) where we
33
had u′(y(x)) = λ`(x). Since the preferences of expected utility functions areinvariant under affine transformation, we can set λ = 1, thus we obtain thefollowing result:
Remark 1. Let y be the optimal structured product for an expected util-ity maximizer with market beliefs, then the concave envelope of his utilityfunction can be computed as
u′(z) = `(y−1(z)).
Assuming that `(x) is strictly decreasing in x and positive (as in Black-Scholes), we can derive that a jump in y corresponds to a convex part of u(i.e. u′ is constant). A capped y (i.e. y is constant above a certain thresholdx0) corresponds to u constant above y(x0).
In our experiment the pricing was computed with the Black-Schoels model,thus we assume `(x) = Ae−Bx with A,B > 0. It is now easy to computeu′ (and hence u) from y. As an example let us consider the case y(x) = x.Then u′(x) = Ae−Bx, i.e. u(x) = −(A/B)e−Bx, i.e. a direct investment in thestock market is optimal for an investor with CARA utility.20
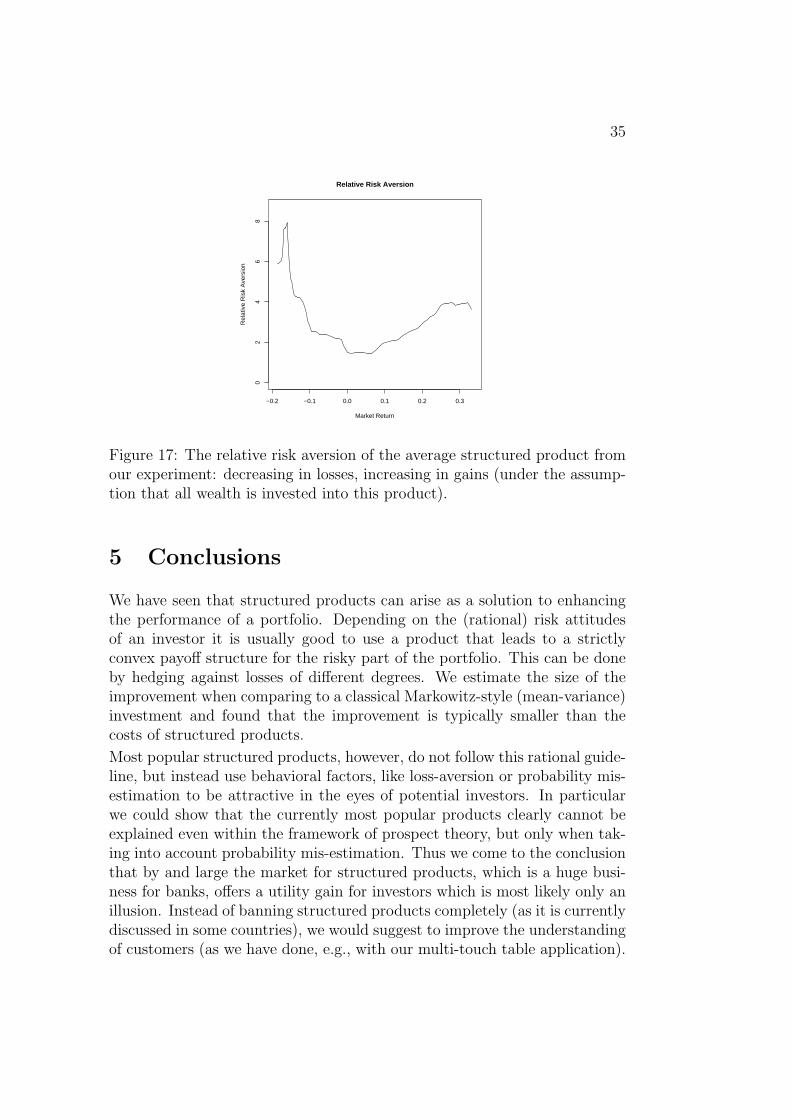
We can do the same computation for the average SP from our experimentand obtain the concave envelope of the utility as illustrated in Fig. 15. InFig. 16 we plot the corresponding Arrow-Pratt risk aversion −u′′(x)/u′(x)(scaling is return−1). It is decreasing for losses and increasing for gains –as expected by the convex-concave shape of the SP. Figure 17 shows therelative risk aversion −x · u′′(x)/u′(x) where we assume that the completewealth is invested into the structured product. It is decreasing in the lossdomain and increasing in the gain domain with a minimum value around 2.Assuming that only half of the wealth are invested in the structured productand the rest is invested risk-free would correspond to a minimum relativerisk aversion of around 4 (corresponding to α = −3 if u(x) = xα/α).
One might wonder whether the strict concavity of the utility that we com-puted does not imply that non-concave utility functions were not neededin our analysis. However, we remind that the concavity only holds for theaverage u where non-concavities of individuals average out.
20It is interesting to compare this result with the case of CAPM: there the optimalSP was an affine function of the market index for an investor with quadratic utility, i.e.mean-variance preferences.

34 4 INVESTOR CHOICES
−0.2 −0.1 0.0 0.1 0.2 0.3
−0.
2−
0.1
0.0
0.1
0.2
Utility Function
Market Return
U
Figure 15: The expected utility function implied by the average structuredproduct from our experiment where only products with monotonic payoffhave been considered.
−0.2 −0.1 0.0 0.1 0.2 0.3
02
46
810
Absolute Risk Aversion
Market Return
Abs
olut
e R
isk
Ave
rsio
n
Figure 16: The absolute risk aversion of the average structured product fromour experiment: decreasing in losses, increasing in gains.
35
−0.2 −0.1 0.0 0.1 0.2 0.3
02
46
8
Relative Risk Aversion
Market Return
Rel
ativ
e R
isk
Ave
rsio
n
Figure 17: The relative risk aversion of the average structured product fromour experiment: decreasing in losses, increasing in gains (under the assump-tion that all wealth is invested into this product).
5 Conclusions
We have seen that structured products can arise as a solution to enhancingthe performance of a portfolio. Depending on the (rational) risk attitudesof an investor it is usually good to use a product that leads to a strictlyconvex payoff structure for the risky part of the portfolio. This can be doneby hedging against losses of different degrees. We estimate the size of theimprovement when comparing to a classical Markowitz-style (mean-variance)investment and found that the improvement is typically smaller than thecosts of structured products.
Most popular structured products, however, do not follow this rational guide-line, but instead use behavioral factors, like loss-aversion or probability mis-estimation to be attractive in the eyes of potential investors. In particularwe could show that the currently most popular products clearly cannot beexplained even within the framework of prospect theory, but only when tak-ing into account probability mis-estimation. Thus we come to the conclusionthat by and large the market for structured products, which is a huge busi-ness for banks, offers a utility gain for investors which is most likely only anillusion. Instead of banning structured products completely (as it is currentlydiscussed in some countries), we would suggest to improve the understandingof customers (as we have done, e.g., with our multi-touch table application).
36 REFERENCES
Also it would be wise to introduce independent rankings that enable spe-cific types of investors to see whether structured products add value to theirportfolio or not.
Acknowledgement
We thank Bernhard Eckwert, Wolfgang Hardle, Frank Riedel and Hersh She-frin, for interesting discussions about this work. Urs Schweri assisted us onthe numerical computations of the implied utility function. AZEK providedthe survey data on structured products. We thank the Swiss Design Institutefor Finance and Banking and the institute of computer science of the Univer-sity of Zurich for their efforts regarding the structured product editor. Sup-port by the National Centre of Competence in Research “Financial Valuationand Risk Management” (NCCR FINRISK), Project A1, “Behavioural andEvolutionary Finance”, and by the University Priority Program “Finance andFinancial Markets” of the University of Zurich is gratefully acknowledged.
References
[1] Schweizer Verband fur strukturierte Produkte (Swiss structured prod-ucts association). http://www.svsp-verband.ch.
[2] Jennifer Bethel and Allen Ferrell. Policy issues raised by structuredproducts. Brookings-Nomura Papers on Financial Services, 2007.
[3] Fisher Black and Myron Scholes. Pricing of options and corporate lia-bilities. Journal of Political Economy, (81):637–654, 1973.
[4] Peter L. Bossaert. The paradox of asset pricing. Princeton UniversityPress, 2002.
[5] Jean-Marc Bottazzi, Thorsten Hens, and Andreas Loffler. Market de-mand functions in the capital asset pricing model. Journal of EconomicTheory, 79(2):192–206, 1998.
[6] Nicole Branger and Beate Breuer. The optimal demand for retail deriva-tives. Working paper, University of Munster, 2007.
[7] Wolfgang Breuer and Achim Perst. Retail banking and behavioral finan-cial engineering: the case of structured products. Journal of Bankingand Finance, 31:827–844, 2007.

REFERENCES 37
[8] Carl Chiarella, Roberto Dieci, and Xue-Zhong He. Heterogeneous expec-tations and speculative behavior in a dynamic multi-asset framework.Journal of Economic Behavior & Organization, 62(3):408–427, 2007.
[9] Kai Detlefsen, Wolfgang Hardle, and Rouslan Moro. Empirical pricingkernels and investor preferences. Discussion Paper 2007-017, HU Berlin,SFB 649, 2007.
[10] Philip H. Dybvig. Distributional analysis of portfolio choice. The Jour-nal of Business, 61(3):369–393, 1988.
[11] Rene Fischer. Do investors in structured products act rationally? Tech-nical report, European Business School, 2007.
[12] AZEK Training Center for Investment Professionals. Investor profilesurvey – analysis. Feldstrasse 80, 8180 Bulach, Switzerland, November2006.
[13] Anke Gerber and Thorsten Hens. Modelling alpha-oppurtunities withinthe CAPM. Technical report, SSRN working paper, 2006.
[14] Christian Gollier. The economics of risk and time. MIT Press, 2004.
[15] Andreas Grunbichler and Hanspeter Wohlwend. The valuation of struc-tured products: Empirical findings for the Swiss market. FinancialMarkets and Portfolio Management, 19(4):361–380, 2005.
[16] Brian J. Henderson and Neil D. Pearson. Patterns in the payoffs ofstructured equity derivatives. SSRN working paper, 2007.
[17] Jens Jackwerth. Recovering risk aversion from option prices and realizedreturns. Review of Financial Studies, 2(13):433–451, 2000.
[18] Daniel Kahneman and Amos Tversky. Prospect Theory: An analysis ofdecision under risk. Econometrica, 47:263–291, 1979.
[19] Uday S. Karmakar. Subjectively weighted utility: A descriptive exten-sion of the expected utility model. Organizational Behavior and HumanPerformance, 21:61–72, 1978.
[20] D. Kramkov and W. Schachermayer. The asymptotic elasticity of utilityfunctions and optimal investment in incomplete markets. The Annalsof Applied Probability, 9(3):904–950, 1999.

38 REFERENCES
[21] Harry M. Markowitz. Portfolio selection. The Journal of Finance,7(1):77–91, March 1952.
[22] J.-L. Prigent. Portfolio optimization and rank dependent expected util-ity. Draft, 2008.
[23] Marc Oliver Rieger. Co-monotonicity of optimal investments and thedesign of structural financial products. working paper, NCCR Finrisk,2007.
[24] Marc Oliver Rieger. Probability mis-estimation and structured products.in preparation, 2008.
[25] Marc Oliver Rieger and Mei Wang. Prospect Theory for continuousdistributions. Journal of Risk and Uncertainty, 2008. in press.
[26] Hersh Shefrin. A behavioral approach to asset pricing (2nd edition).Elsevier, 2008.
[27] Hersh Shefrin and Meir Statman. Behavioral aspects of the design andmarketing of financial products. Financial Management, 22(2):123–134,1993.
[28] Marta Szymanowska, Jenke Ter Horst, and Chris Veld. Reverse con-vertible bonds analyzed. SSRN working paper, 2007.
[29] Amos Tversky and Daniel Kahneman. Advances in Prospect Theory:Cumulative representation of uncertainty. Journal of Risk and Uncer-tainty, 5:297–323, 1992.
[30] John von Neumann and Oskar Morgenstern. Theory of Games andEconomic Behavior. Princeton University Press, Princeton, NJ, 1944.
[31] Martin Wallmeier and Martin Diethelm. Market pricing of exotic struc-tured products: The case of multi-asset barrier reverse convertibles inSwitzerland. Technical report, University of Fribourg, 2008.
[32] Sascha Wilkens, Carsten Erner, and Klaus Roder. The pricing of struc-tured products – an empirical investigation of the German market. TheJournal of Derivatives, 11(1):55–69, 2003.
[33] Valeri Zakalmouline and Steen Koekebakker. A generalization of themean-variance analysis. SSRN working paper, 2008.

39
A Screenshot of the SP editor
Figure 18: A screenshot of the structured product editor (a single-touch ver-sion can be accessed online at http://www.sdfb.ch/projects/2008/speditor/).The curve can be manipulated by dragging the little balls and is therebyauto-adjusted according to the Black-Scholes formula. Mean and standarddeviation (“Mittelwert” and “Standardabweichung”) of the underlying SwissMarket Index were displayed and explained. The test subjects could runsimulations for various years (2000–2007) to backtest their product beforesettling for a final design.

40 B ISSUED STRUCTURED PRODUCTS
B Number of issued structured products in
Germany and Switzerland
Category Issued
Increasing, convex function of underlying, no jumps
(risk optimization, non-increasing ARA)
Guarantee certificates 1,857
Index certificate 1,998
Outperformance certificates 2,219
Subtotal 3.5%
Same but not convex (risk optimization, increasing ARA)
Reverse convertible 6,155
Discount certificates 66,511
Subtotal 42.3%
Not necessarily increasing (potentially speculation)
Exotic leverage 5,319
KO products with stop loss 24,161
Subtotal 17.2%
Several scenarios, in each scenario increasing function of underlying
(probability misestimation)
Basket certificates 1,569
Bonus-/partial proetction cert. 52,321
Subtotal 31.4%
Not classifiable
KO product w/o stop loss 8,281
Others 1,434
Subtotal 5.7%
Table 6: Approximate distribution of structured products issued in Germany
according to normative and behavioral categories.

41
Category (according to SVSP classification [1].) Issued
Increasing, convex function of underlying, no jumps
(risk optimization, non-increasing ARA)
Tracker Certificate 8513
Outperformance Certificate 375
Uncapped Capital Protection 2983
Capital Protection with Coupon 170
Subtotal 25.4%
Same but not convex (risk optimization, increasing ARA)
Airbag Certificate 58
Discount Certificate 3750
Reverse Convertible 1376
Capped Outperformance Certificate 123
Capped Capital Protection 303
Subtotal 11.8%
Not necessarily increasing (potentially speculation)
Spread Warrant 61
Mini-Future 4335
Subtotal 9.3%
Several scenarios, in each scenario increasing function of underlying
(pointing to probability misestimation)
Knock-Out Warrant 2224
Bonus Certificate 4666
Barrier Discount Certificate 407
Barrier Reverse Convertible 14428
Capped Bonus Certificate 494
Subtotal 46.9%
Partially decreasing function of underlying (speculation)
Barrier Range Reverse Convertible 476
Twin-Win Certificate 342
Subtotal 1.7%
Not classifiable:
Diverse Leverage, Diverse Participation, Express Certificate,
Diverse Yield Enhancement, Diverse Capital Protection, Diverse Product
Subtotal 4.8%
Table 7: Approximate distribution of structured products issued in Switzer-
land according to normative and behavioral categories.