the dark side of valuation - new york...
TRANSCRIPT
Aswath Damodaran! 1!
The Dark Side of Valuation: ���Bias, Uncertainty and Complexity
Aswath Damodaran Email: [email protected] ���
Website: http://www.damodaran.com ���Blog: http://aswathdamodaran.blogspot.com
Twitter: @AswathDamodaran

Aswath Damodaran! 2!
The Bermuda Triangle of Valuation
Valuation First Principles & Good Sense !
Uncertainty & the Unknown!

Aswath Damodaran! 3!
I. Valuation Bias
Preconceptions and priors: When you start on the valuation of a company, you almost never start with a blank slate. Instead, your valuation is shaped by your prior views of the company in question.
• Corollary 1: The more you know about a company, the more likely it is that you will be biased, when valuing the company.
• Corollary 2: The “closer” you get to the management/owners of a company, the more biased your valuation of the company will become.
Value first, valuation to follow: In principle, you should do your valuation first before you decide how much to pay for an asset. In practice, people often decide what to pay and do the valuation afterwards.

Aswath Damodaran! 4!
Sources of bias
The power of the subconscious: We are human, after all, and as a consequence are susceptible to
• Herd behavior: For instance, there is the “market price” magnet in valuation, where estimates of intrinsic value move towards the market price with each iteration.
• Hindsight bias: If you know the outcome of a sequence of events, it will affect your valuation. (That is why teaching valuation with cases is an exercise in futility)
The power of suggestion: Hearing what others think a company is worth will color your thinking, and if you view those others as more informed/smarter than you are, you will be influenced even more.
The power of money: If you have an economic stake in the outcome of a valuation, bias will almost always follow.
• Corollary 1: Your bias in a valuation will be directly proportional to who pays you to do the valuation and how much you get paid.
• Corollary 2: You will be more biased when valuing a company where you already have a position (long or short) in the company.

Free Cashflow to FirmEBIT (1- tax rate)- (Cap Ex - Depreciation)- Change in non-cash WC= Free Cashflow to firm
Cost of Capital
Expected Growth in FCFF during high growth
Length of high growth period: PV of FCFF during high Stable GrowthWhen operating income and FCFF grow at constant rate forever.
Value of Operating Assets today+ Cash & non-operating assets- DebtValue of equity
Weighted average of cost of equity & cost of debt
If you want higher (lower) value, you can1. Augment (haircut) earnings2. Reduce(increase) effective tax rate3. Ignore (Count in) unconventional cap ex4. Narrow (Broaden) definition of working capital
If you want to increase (decrease) value, you can1. Use higher (lower) growth rates 2. Assume less (more) reinvestment with the same growth rate, thus raising (lowering) the quality and value of growth.
If you want to increase (decrease) value, you can1. Assume a higher (lower) debt ratio, with the same costs of debt & equity. You may be able to accomplish this by using book (market) value debt ratios.2. Use a lower (higher) equity risk premium for equity and a lower (higher) default spread for debt.3. Find a "lower" ("higher") beta for your stock.4. Don't add (add) other premiums to the cost of equity (small cap?)
If you want to increase (decrease) value, you can1. Assume a longer (shorter) growth period2. Assume more (less) excess returns over the growth period
If you want to increase (decrease) value, you can add (subtract) premiums (discounts) for things you like (dislike) about the company.Premiums: Control, Synergy, liquidityDiscounts: Illiquidity, private company
If you want to increase value, you can1. Use stable growth rates that are economically impossible (higher than the growth rate of the economy)2. Allow this growth to be accompanied by high positive excess returns (low reinvestment)If you want to decrease value, you can1. Use lower growth rates in perpetuity2. Accompany this growth with high negative excess returns
Biasing a DCF valuation: A template of "tricks"

Aswath Damodaran! 6!
Term yrEBIT (1-t) 9255- Reinv 1543FCFF 7713
Terminal Value10= 7,713/(.08-.02) = 128,546
Cost of capital = 11.19% (.988) + 1.59% (.012) = 11.07%
Operating assets 62,053+ Cash 1,512- Debt 1,219Value of equity 62,350 - Options 3,088Value in stock 59,262Value/share $25.39
Stable Growthg = 2%; Beta = 1.00;Cost of capital = 8%
ROC= 12%; Reinvestment Rate=2%/12% = 16.67%
Starting numbers
Cost of Equity11.19%
Cost of Debt(2%+0.65%)(1-.40)= 1.59%
WeightsE = 98.8% D = 1.2%
Riskfree Rate:Riskfree rate = 2% +
Beta 1.53 X
Risk Premium6%
Unlevered Beta for Sectors: 1.52
At 4.00 pm, May 17, the offering was priced at $38/share
Cost of capital decreases to 8% from years 6-10
D/E=1.21%
Facebook IPO: May 17, 2012This year Last year
Revenues 3,711.00$ 1,974.00$ Operating income or EBIT$1,695.00 1,032.00$ Invested Capital 4,216.11$ 694.00$ Tax rate 40.00%Operating margin 45.68%Return on capital146.54%Sales/Capital 88.02%
Revenue growth of 40% a year for 5 years, tapering down
to 2% in year 10
Pre-tax operating
margin declines to 35% in year
10
Sales to capital ratio of
1.50 for incremental
sales
Year 1 2 3 4 5 6 7 8 9 10Revenues 5,195$ 7,274$ 10,183$ 14,256$ 19,959$ 26,425$ 32,979$ 38,651$ 42,362$ 43,209$ Operating margin 44.61% 43.54% 42.47% 41.41% 40.34% 39.27% 38.20% 37.14% 36.07% 35.00%EBIT 2,318$ 3,167$ 4,325$ 5,903$ 8,051$ 10,377$ 12,599$ 14,353$ 15,279$ 15,123$ EBIT (1-t) 1,391$ 1,900$ 2,595$ 3,542$ 4,830$ 6,226$ 7,559$ 8,612$ 9,167$ 9,074$ - Reinvestment 990$ 1,385$ 1,940$ 2,715$ 3,802$ 4,311$ 4,369$ 3,782$ 2,474$ 565$ FCFF 401$ 515$ 655$ 826$ 1,029$ 1,915$ 3,190$ 4,830$ 6,694$ 8,509$

Term yrEBIT (1-t) 12078- Reinv 1208FCFF 10870
Terminal Value10= 10,870/(.08-.02) = 181,173
Cost of capital = 11.19% (.988) + 1.59% (.012) = 11.07%
Operating assets 94,564+ Cash 1,512- Debt 1,219Value of equity 94,861 - Options 3,088Value in stock 91,772Value/share $39.32
Stable Growthg = 2%; Beta = 1.00;Cost of capital = 8%
ROC= 20%; Reinvestment Rate=2%/20% = 10%
Starting numbers
Cost of Equity11.19%
Cost of Debt(2%+0.65%)(1-.40)= 1.59%
WeightsE = 98.8% D = 1.2%
Riskfree Rate:Riskfree rate = 2% +
Beta 1.53 X
Risk Premium6%
Unlevered Beta for Sectors: 1.52
At 4.00 pm, May 17, the offering was priced at $38/share
Cost of capital decreases to 8% from years 6-10
D/E=1.21%
Bias Up: Facebook IPO: May 17, 2012This year Last year
Revenues 3,711.00$ 1,974.00$ Operating income or EBIT$1,695.00 1,032.00$ Invested Capital 4,216.11$ 694.00$ Tax rate 40.00%Operating margin 45.68%Return on capital146.54%Sales/Capital 88.02%
Revenue growth of 40% a year for 5 years, tapering down
to 2% in year 10
Pre-tax operating
margin stays at 45.68%
Sales to capital ratio of
3.00 for incremental
sales
Year 1 2 3 4 5 6 7 8 9 10Revenues 5,195$ 7,274$ 10,183$ 14,256$ 19,959$ 26,425$ 32,979$ 38,651$ 42,362$ 43,209$ Operating margin 45.68% 45.68% 45.68% 45.68% 45.68% 45.68% 45.68% 45.68% 45.68% 45.68%EBIT 2,373$ 3,322$ 4,651$ 6,512$ 9,116$ 12,070$ 15,063$ 17,654$ 19,349$ 19,736$ EBIT (1-t) 1,424$ 1,993$ 2,791$ 3,907$ 5,470$ 7,242$ 9,038$ 10,592$ 11,609$ 11,841$ - Reinvestment 495$ 693$ 970$ 1,358$ 1,901$ 2,156$ 2,184$ 1,891$ 1,237$ 282$ FCFF 929$ 1,301$ 1,821$ 2,549$ 3,569$ 5,086$ 6,853$ 8,702$ 10,372$ 11,559$

Term yrEBIT (1-t) 8198- Reinv 2049FCFF 6148
Terminal Value10= 6,148/(.08-.02) = 102,469
Cost of capital = 11.19% (.988) + 1.59% (.012) = 11.07%
Operating assets 35,408+ Cash 1,512- Debt 1,219Value of equity 35,705 - Options 3,088Value in stock 32,616Value/share $13.97
Stable Growthg = 2%; Beta = 1.00;Cost of capital = 8%
ROC= 8%; Reinvestment Rate=2%/20% = 10%
Starting numbers
Cost of Equity11.19%
Cost of Debt(2%+0.65%)(1-.40)= 1.59%
WeightsE = 98.8% D = 1.2%
Riskfree Rate:Riskfree rate = 2% +
Beta 1.53 X
Risk Premium6%
Unlevered Beta for Sectors: 1.52
At 4.00 pm, May 17, the offering was priced at $38/share
Cost of capital decreases to 8% from years 6-10
D/E=1.21%
Bias Down: Facebook IPO: May 17, 2012This year Last year
Revenues 3,711.00$ 1,974.00$ Operating income or EBIT$1,695.00 1,032.00$ Invested Capital 4,216.11$ 694.00$ Tax rate 40.00%Operating margin 45.68%Return on capital146.54%Sales/Capital 88.02%
Revenue growth of 40% a year for 5 years, tapering down
to 2% in year 10
Pre-tax operating
margin drops to 31% over the next 10 years
Sales to capital ratio
stays at 0.75
Year 1 2 3 4 5 6 7 8 9 10Revenues 5,195$ 7,274$ 10,183$ 14,256$ 19,959$ 26,425$ 32,979$ 38,651$ 42,362$ 43,209$ Operating margin 44.21% 42.74% 41.27% 39.81% 38.34% 36.87% 35.40% 33.94% 32.47% 31.00%EBIT 2,297$ 3,109$ 4,203$ 5,675$ 7,652$ 9,743$ 11,675$ 13,116$ 13,754$ 13,395$ EBIT (1-t) 1,378$ 1,865$ 2,522$ 3,405$ 4,591$ 5,846$ 7,005$ 7,870$ 8,252$ 8,037$ - Reinvestment 1,979$ 2,771$ 3,879$ 5,431$ 7,603$ 8,622$ 8,738$ 7,563$ 4,947$ 1,130$ FCFF (601)$ (906)$ (1,358)$ (2,026)$ (3,012)$ (2,776)$ (1,733)$ 307$ 3,305$ 6,907$
Aswath Damodaran! 9!
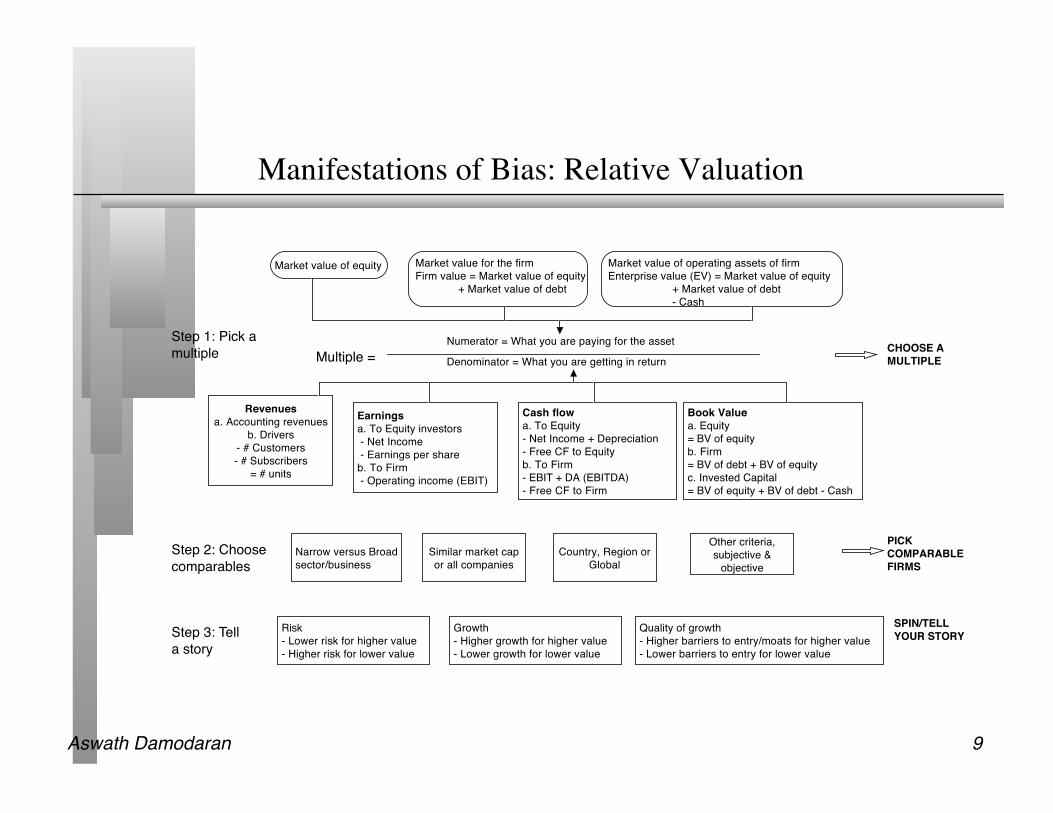
Manifestations of Bias: Relative Valuation
Book Valuea. Equity= BV of equityb. Firm= BV of debt + BV of equityc. Invested Capital= BV of equity + BV of debt - Cash
Cash flowa. To Equity- Net Income + Depreciation- Free CF to Equityb. To Firm- EBIT + DA (EBITDA)- Free CF to Firm
Earningsa. To Equity investors - Net Income - Earnings per shareb. To Firm - Operating income (EBIT)
Revenuesa. Accounting revenues
b. Drivers- # Customers- # Subscribers
= # units
Numerator = What you are paying for the asset
Denominator = What you are getting in return
Market value of equity Market value for the firmFirm value = Market value of equity
+ Market value of debt
Market value of operating assets of firmEnterprise value (EV) = Market value of equity
+ Market value of debt- Cash
Multiple =Step 1: Pick a multiple
Step 2: Choose comparables
Narrow versus Broad sector/business
Similar market cap or all companies
Country, Region or Global
Other criteria, subjective &
objective
CHOOSE A MULTIPLE
PICK COMPARABLE FIRMS
Step 3: Tell a story
Risk- Lower risk for higher value- Higher risk for lower value
Growth- Higher growth for higher value- Lower growth for lower value
Quality of growth- Higher barriers to entry/moats for higher value- Lower barriers to entry for lower value
SPIN/TELL YOUR STORY

Aswath Damodaran! 10!
Dealing with bias: The “bad” ways
I use only numbers: The easiest defense is to argue that you are only using numbers and that bias requires subjective judgments.
I am a “professional”: Valuation professionals point to the requirements of their professional groups (CPA, CFA, CVA etc.) that they be unbiased.
It is a “FAIR” value (with my lawyer/accountant’s imprimatur): The most common response to bias is to add legal or accounting cover.
• Legal fair value: In most countries, investment bankers have to sign a legal document that their value is a “fair” value.
• Accounting fair value: Accountants have jumped into the mix and have set up standards for fair value.

Aswath Damodaran! 11!
Healthy responses to bias
Build processes that minimize bias, not maximize it: To the degree that a significant portion of bias comes from reward/punishment mechanisms, we need to build processes that disassociate the valuation outcome from compensation.
Be honest (at least with yourself): Even if you may not want to reveal your biases to your clients, you should at least be honest with yourself.
Bayesian valuation: It may be a good idea to require anyone valuing a company to state what they believe that they will find in the valuation, before they actually do the valuation. Anyone using the valuation should then have access to both the analyst’s priors and the valuation.
Transparency about motives: All valuations should be accompanied with full details of who is paying for the valuation and how much, as well as any other stakes in the outcome of the valuation.

Aswath Damodaran! 12!
II. Valuation Uncertainty
What are the cashflows from existing assets?- Equity: Cashflows after debt payments- Firm: Cashflows before debt payments
What is the value added by growth assets?Equity: Growth in equity earnings/ cashflowsFirm: Growth in operating earnings/ cashflows
How risky are the cash flows from both existing assets and growth assets?Equity: Risk in equity in the companyFirm: Risk in the firm’s operations
When will the firm become a mature fiirm, and what are the potential roadblocks?

Aswath Damodaran! 13!
Current Cashflow to FirmEBIT(1-t)= 5344 (1-.35)= 3474- Nt CpX= 350 - Chg WC 691= FCFF 2433Reinvestment Rate = 1041/3474 =29.97%Return on capital = 25.19%
Expected Growth in EBIT (1-t).30*.25=.0757.5%
Stable Growthg = 3%; Beta = 1.10;Debt Ratio= 20%; Tax rate=35%Cost of capital = 6.76% ROC= 6.76%; Reinvestment Rate=3/6.76=44%
Terminal Value5= 2645/(.0676-.03) = 70,409
Cost of Equity8.32%
Cost of Debt(3.72%+.75%)(1-.35)= 2.91%
WeightsE = 92% D = 8%
Op. Assets 60607+ Cash: 3253- Debt 4920=Equity 58400
Value/Share $ 83.55
Riskfree Rate:Riskfree rate = 3.72% +
Beta 1.15 X
Risk Premium4%
Unlevered Beta for Sectors: 1.09
3M: A Pre-crisis valuationReinvestment Rate 30%
Return on Capital25%
Term Yr$4,758$2,113$2,645
On September 12, 2008, 3M was trading at $70/share
First 5 years
D/E=8.8%
Cost of capital = 8.32% (0.92) + 2.91% (0.08) = 7.88%
Year 1 2 3 4 5EBIT (1-t) $3,734 $4,014 $4,279 $4,485 $4,619 - Reinvestment $1,120 $1,204 $1,312 $1,435 $1,540 , = FCFF $2,614 $2,810 $2,967 $3,049 $3,079

Aswath Damodaran! 14!
Current Cashflow to FirmEBIT(1-t) : Rs 20,116- Nt CpX Rs 31,590 - Chg WC Rs 2,732= FCFF - Rs 14,205Reinv Rate = (31590+2732)/20116 = 170.61%; Tax rate = 21.00%Return on capital = 17.16%
Expected Growth from new inv..70*.1716=0.1201
Stable Growthg = 5%; Beta = 1.00Country Premium= 3%Cost of capital = 10.39%Tax rate = 33.99% ROC= 10.39%; Reinvestment Rate=g/ROC =5/ 10.39= 48.11%
Terminal Value5= 23493/(.1039-.05) = Rs 435,686
Cost of Equity14.00%
Cost of Debt(5%+ 4.25%+3)(1-.3399)= 8.09%
WeightsE = 74.7% D = 25.3%
Discount at Cost of Capital (WACC) = 14.00% (.747) + 8.09% (0.253) = 12.50%
Op. Assets Rs210,813+ Cash: 11418+ Other NO 140576- Debt 109198=Equity 253,628
Value/Share Rs 614
Riskfree Rate:Rs Riskfree Rate= 5% +
Beta 1.20 X
Mature market premium 4.5%
Unlevered Beta for Sectors: 1.04
Firmʼs D/ERatio: 33%
Tata Motors: April 2010 Reinvestment Rate 70%
Return on Capital17.16%
452782178523493
+ Lambda0.80
XCountry Equity RiskPremium4.50%
Country Default Spread3%
XRel Equity Mkt Vol
1.50
On April 1, 2010Tata Motors price = Rs 781
Rs Cashflows
Average reinvestment rate from 2005-09: 179.59%; without acquisitions: 70%
Growth declines to 5% and cost of capital moves to stable period level.
Year 1 2 3 4 5 6 7 8 9 10EBIT (1-t) 22533 25240 28272 31668 35472 39236 42848 46192 49150 51607 - Reinvestment 15773 17668 19790 22168 24830 25242 25138 24482 23264 21503FCFF 6760 7572 8482 9500 10642 13994 17711 21710 25886 30104

Aswath Damodaran! 15!
Forever
Terminal Value= 1881/(.0961-.06)=52,148
Cost of Equity12.90%
Cost of Debt6.5%+1.5%=8.0%Tax rate = 0% -> 35%
WeightsDebt= 1.2% -> 15%
Value of Op Assets $ 14,910+ Cash $ 26= Value of Firm $14,936- Value of Debt $ 349= Value of Equity $14,587- Equity Options $ 2,892Value per share $ 34.32
Riskfree Rate:T. Bond rate = 6.5% +
Beta1.60 -> 1.00 X Risk Premium
4%
Internet/Retail
Operating Leverage
Current D/E: 1.21%
Base EquityPremium
Country RiskPremium
CurrentRevenue$ 1,117
CurrentMargin:-36.71%
Sales TurnoverRatio: 3.00
CompetitiveAdvantages
Revenue Growth:42%
Expected Margin: -> 10.00%
Stable Growth
StableRevenueGrowth: 6%
StableOperatingMargin: 10.00%
Stable ROC=20%Reinvest 30% of EBIT(1-t)
EBIT-410m
NOL:500 m
$41,346 10.00% 35.00%$2,688 $ 807 $1,881
Term. Year
2 431 5 6 8 9 107
Cost of Equity 12.90% 12.90% 12.90% 12.90% 12.90% 12.42% 12.30% 12.10% 11.70% 10.50%Cost of Debt 8.00% 8.00% 8.00% 8.00% 8.00% 7.80% 7.75% 7.67% 7.50% 7.00%AT cost of debt 8.00% 8.00% 8.00% 6.71% 5.20% 5.07% 5.04% 4.98% 4.88% 4.55%Cost of Capital 12.84% 12.84% 12.84% 12.83% 12.81% 12.13% 11.96% 11.69% 11.15% 9.61%
Revenues $2,793 5,585 9,774 14,661 19,059 23,862 28,729 33,211 36,798 39,006 EBIT -$373 -$94 $407 $1,038 $1,628 $2,212 $2,768 $3,261 $3,646 $3,883EBIT (1-t) -$373 -$94 $407 $871 $1,058 $1,438 $1,799 $2,119 $2,370 $2,524 - Reinvestment $559 $931 $1,396 $1,629 $1,466 $1,601 $1,623 $1,494 $1,196 $736FCFF -$931 -$1,024 -$989 -$758 -$408 -$163 $177 $625 $1,174 $1,788
9a. Amazon in January 2000
Amazon was trading at $84 in January 2000.
Dot.com retailers for firrst 5 yearsConvetional retailers after year 5
Used average interest coverage ratio over next 5 years to get BBB rating. Pushed debt ratio
to retail industry average of 15%.
From previous years
Sales to capital ratio and expected margin are retail industry average numbers
All existing options valued as options, using current stock price of $84.

Aswath Damodaran! 16!
The sources of uncertainty
Estimation versus Economic uncertainty • Estimation uncertainty reflects the possibility that you could have the “wrong
model” or estimated inputs incorrectly within this model. • Economic uncertainty comes the fact that markets and economies can change over
time and that even the best medals will fail to capture these unexpected changes.
Micro uncertainty versus Macro uncertainty • Micro uncertainty refers to uncertainty about the potential market for a firm’s
products, the competition it will face and the quality of its management team. • Macro uncertainty reflects the reality that your firm’s fortunes can be affected by
changes in the macro economic environment.
Discrete versus continuous uncertainty • Discrete risk: Risks that lie dormant for periods but show up at points in time.
(Examples: A drug working its way through the FDA pipeline may fail at some stage of the approval process or a company in Venezuela may be nationalized)
• Continuous risk: Risks changes in interest rates or economic growth occur continuously and affect value as they happen.

Aswath Damodaran! 17!
Assessing uncertainty…
Rank the four firms in terms of uncertainty (least to most) in your estimate: q 3M in 2007 q Tata Motors in 2010 q Amazon in 2000 q Facebook in 2012
• With each company, specify the type of uncertainty that you face: Company Estimation or
Economic Micro or Macro
Discrete or Continuous
3M (2007) Tata Motors (2010) Amazon (2000) Facebook (2012)
Aswath Damodaran! 18!
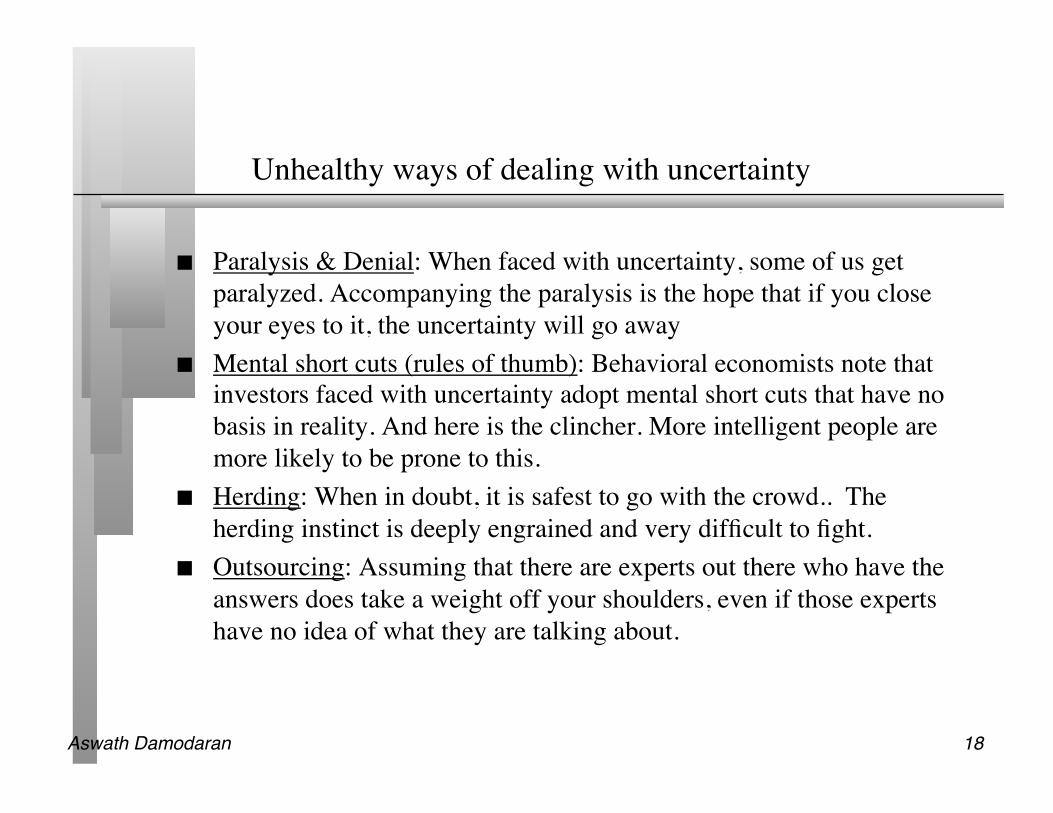
Unhealthy ways of dealing with uncertainty
Paralysis & Denial: When faced with uncertainty, some of us get paralyzed. Accompanying the paralysis is the hope that if you close your eyes to it, the uncertainty will go away
Mental short cuts (rules of thumb): Behavioral economists note that investors faced with uncertainty adopt mental short cuts that have no basis in reality. And here is the clincher. More intelligent people are more likely to be prone to this.
Herding: When in doubt, it is safest to go with the crowd.. The herding instinct is deeply engrained and very difficult to fight.
Outsourcing: Assuming that there are experts out there who have the answers does take a weight off your shoulders, even if those experts have no idea of what they are talking about.

Aswath Damodaran! 19!
Healthy responses to uncertainty
1. Less is more (the rule on detail….) (Revenue & margin forecasts) 2. Build in internal checks on reasonableness… (reinvestment and
ROC) 3. Use the offsetting principle (risk free rates & inflation at Tata Motors) 4. Draw on economic first principles (Terminal value at all the
companies ) 5. Use the “market” as a crutch (equity risk premiums, country risk
premiums) 6. Use the law of large numbers (Beta for all companies 7. Don’t let the discount rate become the receptacle for all uncertainties. 8. Confront uncertainty, if you can 9. Don’t look for precision

Aswath Damodaran! 20!
1. Less is more���Revenues & Margins for Amazon in 2000
Year !Growth rate!Revenues !Operating Margin !EBIT !!Tr12m !200% !$1,117 !-36.71% !-$410 !!1 ! !150% !$2,793 !-13.35% !-$373 !!2 ! !100% !$5,585 !-1.68% ! !-$94 !!3 ! ! 75% !$9,774 !4.16% ! !$407 !!4 ! ! 50% !$14,661 !7.08% ! !$1,038!5 ! ! 30% !$19,059 !8.54% ! !$1,628!6 ! ! 25.2% !$23,862 !9.27% ! !$2,212!7 ! ! 20.4% !$28,729 !9.64% ! !$2,768!8 ! ! 15.6% !$33,211 !9.82% ! !$3,261!9 ! ! 10.8% !$36,798 !9.91% ! !$3,646!10! ! 6.0% !$39,006 !9.95% ! !$3,883!TY(11) ! 6.0% !$41,346 !10.00%! !$4,135
!!
Be parsimonious: Estimate the big numbers (revenues and margin in year 10)!
Put intermediate numbers on autopilot!

Aswath Damodaran! 21!
2. Build in “internal” checks for reasonableness…���Reinvestment and Return on Capital
Comfortable with $41.3 billion in revenues! - Check against total market (and market share)! - Check against largest companies in the market!
Comfortable with ROC = 20.39% in year 10?!- Check against cost of capital!- Check against industry average !

Aswath Damodaran! 22!
3. Use consistency tests…���Tata Motors: In Rupees and US dollars
(1.125)*(1.01/1.04)-1 = .0925
Equity versus Firm: If cash flows are post-debt and to equity, you should discount at the cost of equity. Pre-debt cash flows should be discounted at the cost of capital.!!
Currency: The currency in which the cash flows are estimated should also be the currency in which the discount rate is estimated.!!

Aswath Damodaran! 23!
4. Draw on economic first principles and mathematical limits… ���The terminal value limits

Aswath Damodaran! 24!
5. Use the market as a crutch… ���Equity Risk Premiums
Historical premium!
! Arithmetic Average! Geometric Average! ! Stocks - T. Bills! Stocks - T. Bonds! Stocks - T. Bills! Stocks - T. Bonds!1928-2011! 7.55%! 5.79%! 5.62%! 4.10%! ! 2.22%! 2.36%! ! !1962-2011! 5.38%! 3.36%! 4.02%! 2.35%! ! 2.39%! 2.68%! ! !2002-2011! 3.12%! -1.92%! 1.08%! -3.61%! ! 6.46%! 8.94%! ! !
January 1, 2012S&P 500 is at 1257.60Adjusted Dividends & Buybacks for 2011 = 59.29
In the trailing 12 months, the cash returned to stockholders was 74.17. Using the average cash yield of 4.71% for 2002-2011 the cash returned would have been 59.29.
Analysts expect earnings to grow 9.6% in 2012, 11.9% in 2013, 8.2% in 2014, 4.5% in 2015 and 2% therafter, resulting in a compounded annual growth rate of 7.18% over the next 5 years. We will assume that dividends & buybacks will grow 7.18% a year for the next 5 years.
After year 5, we will assume that earnings on the index will grow at 1.87%, the same rate as the entire economy (= riskfree rate).
68.11 73.00 78.24 83.86
Expected Return on Stocks (1/1/12) = 7.91%T.Bond rate on 1/1/12 = 1.87%Equity Risk Premium = 8.03% - 3.29% = 6.04%
63.54 Data Sources:Dividends and Buybacks last year: S&PExpected growth rate: News stories, Yahoo! Finance, Bloomberg
1257.60 = 63.54(1+ r)
+68.11(1+ r)2
+73.00(1+ r)3
+78.24(1+ r)4
+83.86(1+ r)5
+83.86(1.0187)(r −.0187)(1+ r)5

Aswath Damodaran! 25!
Country Risk Premiums!June 2012!
Angola 10.88% 4.88% Botswana 7.50% 1.50% Egypt 13.50% 7.50% Mauritius 8.25% 2.25% Morocco 9.60% 3.60% Namibia 9.00% 3.00% South Africa 7.73% 1.73% Tunisia 9.00% 3.00% AFRICA 9.82% 3.82%
Bangladesh 10.88% 4.88% Cambodia 13.50% 7.50% China 7.05% 1.05% Fiji Islands 12.00% 6.00% Hong Kong 6.38% 0.38% India 9.00% 3.00% Indonesia 9.00% 3.00% Japan 7.05% 1.05% Korea 7.28% 1.28% Macao 7.05% 1.05% Malaysia 7.73% 1.73% Mongolia 12.00% 6.00% Pakistan 15.00% 9.00% New Guinea 12.00% 6.00% Philippines 10.13% 4.13% Singapore 6.00% 0.00% Sri Lanka 12.00% 6.00% Taiwan 7.05% 1.05% Thailand 8.25% 2.25% Vietnam 12.00% 6.00% ASIA 7.63% 1,63% WO JAPAN 7.77% 1.77%
Australia 6.00% 0.00% New Zealand 6.00% 0.00% AUS & NZ 6.00% 0.00%
Argentina 15.00% 9.00% Belize 9.00% 3.00% Bolivia 10.88% 4.88% Brazil 8.63% 2.63% Chile 7.05% 1.05% Colombia 9.00% 3.00% Costa Rica 9.00% 3.00% Ecuador 18.75% 12.75% El Salvador 10.13% 4.13% Guatemala 9.60% 3.60% Honduras 13.50% 7.50% Mexico 8.25% 2.25% Nicaragua 15.00% 9.00% Panama 9.00% 3.00% Paraguay 12.00% 6.00% Peru 9.00% 3.00% Uruguay 9.60% 3.60% Venezuela 12.00% 6.00% LAT AM 9.42% 3.42%
Albania 12.00% 6.00% Armenia 10.13% 4.13% Azerbaijan 9.00% 3.00% Belarus 15.00% 9.00% Bosnia 15.00% 9.00% Bulgaria 8.63% 2.63% Croatia 9.00% 3.00% Czech Republic 7.28% 1.28% Estonia 7.28% 1.28% Georgia 10.88% 4.88% Hungary 9.60% 3.60% Kazakhstan 8.63% 2.63% Latvia 9.00% 3.00% Lithuania 8.25% 2.25% Moldova 15.00% 9.00% Montenegro 10.88% 4.88% Poland 7.50% 1.50% Romania 9.00% 3.00% Russia 8.25% 2.25% Slovakia 7.50% 1.50% Slovenia [1] 7.50% 1.50% Ukraine 13.50% 7.50% E. EUROPE 8.60% 2.60%
Canada 6.00% 0.00% United States 6.00% 0.00% NORTH AM 6.00% 0.00%
Spain 9.00% 3.00% Austria 6.00% 0.00% Belgium 7.05% 1.05% Cyprus 10.88% 4.88% Denmark 6.00% 0.00% Finland 6.00% 0.00% France 6.00% 0.00% Germany 6.00% 0.00% Greece 16.50% 10.50% Iceland 9.00% 3.00% Ireland 9.60% 3.60% Italy 7.73% 1.73% Malta 7.73% 1.73% Netherlands 6.00% 0.00% Norway 6.00% 0.00% Portugal 10.88% 4.88% Sweden 6.00% 0.00% Switzerland 6.00% 0.00% Turkey 9.60% 3.60% United Kingdom 6.00% 0.00% W. EUROPE 6.80% 0.80%
Black #: Total ERP Red #: Country risk premium AVG: GDP weighted average
Bahrain 8.25% 2.25% Israel 7.28% 1.28% Jordan 10.13% 4.13% Kuwait 6.75% 0.75% Lebanon 12.00% 6.00% Oman 7.28% 1.28% Qatar 6.75% 0.75% Saudi Arabia 7.05% 1.05% UAE 6.75% 0.75% MIDDLE EAST 7.16% 1.16%

Aswath Damodaran! 26!
6. Draw on the law of large numbers…���A single regression beta is noisy…

Aswath Damodaran! 27!
But an average beta across companies is not…
There are 111 publicly traded companies, globally in the automobile business.
• Average beta across companies = 1.22 • Average D/E ratio across companies = 35% • Average tax rate across companies = 30% • Unlevered beta for automobile company = 1.22 / (1+ (1-.30)(.35)) = 0.98 • Standard error on “average” beta = 0.26/Sq root of 111 = 0.025
To estimate the beta for Tata Motors • Unlevered beta for automobile company = 0.98 • D/E ratio for Tata Motors = 33.87% • Marginal tax rate in India = 33.99% • Levered beta = 0.98 (1+ (1-.3399)(.3387)) = 1.20

Aswath Damodaran! 28!
7. Don’t let the discount rate become the receptacle for all uncertainty…���For instance, most young firms don’t make it…

Aswath Damodaran! 29!
And you can deal with it in one of two ways…
The Venture Capital approach: In the venture capital approach, you hike the “discount rate” well above what would be appropriate for a going concern and then use this “target” rate to discount your “exit value” (which is estimated using a multiple and forward earnings).
Value = (Forward Earnings in year n * Exit multiple)/ (1+ target rate)n
The decision tree approach: 1. Value the business as a “going concern”, with a rate of return appropriate for a
“going concern”. 2. Estimate the probability of survival (and failure) and the value of the business in
the event of failure. Value = Going concern value (Probability of survival) + Liquidation value (Probability of failure)

Aswath Damodaran! 30!
8. Confront uncertainty, if you can… ���Revisiting the Facebook valuation…

Aswath Damodaran! 31!
With the consequences…

Aswath Damodaran! 32!
9. Don’t look for precision.. ���My valuations of Amazon over time…
$0.00
$10.00
$20.00
$30.00
$40.00
$50.00
$60.00
$70.00
$80.00
$90.00
2000 2001 2002 2003Time of analysis
Amazon: Value and Price
Value per sharePrice per share

Aswath Damodaran! 33!
III. Complexity in valuation
Bigger, more complicated valuations
More complex companies- Operate in many businesses- Operate in many countries- More financing options- Different tax structures
Richer/ More Data- Cross sectional data- Historical data- Macroeconomic data
Bigger/more sophisticated models- Access to tools- More powerful devices- Analytical teams
Analyst induced complexity- Intimidation- Fog of "numbers"- Aura of knowledge
Legal induced complexity- Worry about "lawsuits"- Accountability

Aswath Damodaran! 34!
Sources of complexity
Globalization: As companies globalize, valuations are getting more complex for a number of reasons:
• Risk assessment has to factor in where a company operates and not where it is incorporated.
• Currency choices proliferate, since a company can be valued in any of a half a dozen currencies (often to value different listings)
Shifting and volatile macro economic risks have created changing risk premiums and strange interest rate/exchange rate environments.
More complex accounting standards have created longer, more complicated, more difficult to read financial statements.
More complicated holding structures (cross holdings, shares with different voting rights), motivated by tax and control reasons, make valuations more difficult.

Aswath Damodaran! 35!
Manifestations of complexity
Mysterious terms/acronyms: A feature of complex valuation is line items or terms that sound “sophisticated” but you do not know or not sure what they mean or measure. (For an added layer of intimidation, make them Greek alphabets…)
Longer, more detailed valuations: The level of detail that you see in valuations, with hundreds of line items and dozens of inputs, is staggering (and scary).
What if and scenario analysis: While there is a place for asking what if questions and scenario analysis in valuation, the ease with which it can be done has opened the door to abuse, with the primary objective becoming cover, no matter what happens.
Aswath Damodaran! 36!
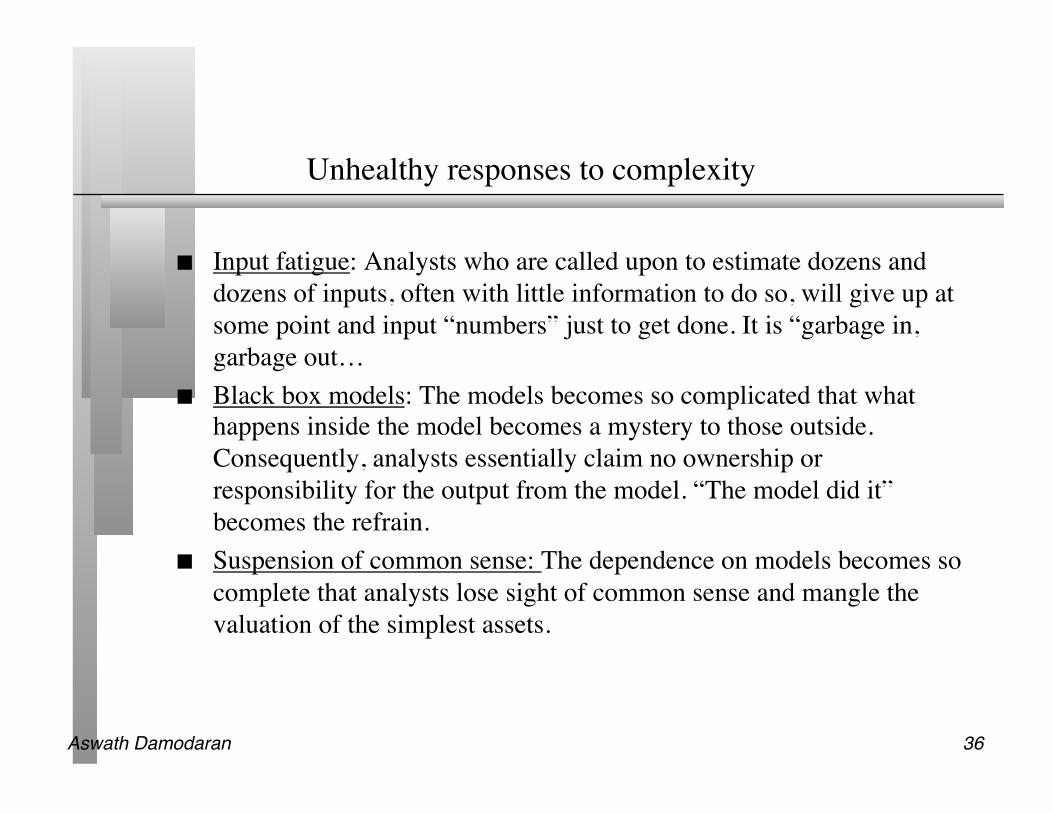
Unhealthy responses to complexity
Input fatigue: Analysts who are called upon to estimate dozens and dozens of inputs, often with little information to do so, will give up at some point and input “numbers” just to get done. It is “garbage in, garbage out…
Black box models: The models becomes so complicated that what happens inside the model becomes a mystery to those outside. Consequently, analysts essentially claim no ownership or responsibility for the output from the model. “The model did it” becomes the refrain.
Suspension of common sense: The dependence on models becomes so complete that analysts lose sight of common sense and mangle the valuation of the simplest assets.
Aswath Damodaran! 37!
Healthy responses to complexity
Parsimonious valuations: Never estimate more inputs than you absolutely have to. Less is more. When faced with the question of adding more detail/complexity, ask yourself whether it will make your valuation more precise (or just make it look more precise).
Go back to first principles: The fundamentals of valuation don’t change, just because you are faced with complexity. Always fall back on first principles.
Focus on key levers: Even when there are dozens of inputs in a valuation, the valuation itself is a function of three or four key value drivers (which may be different for different companies). Keep your focus on those variables