the decision to privatize: finance, politics, and patronage · 2006-07-13 · the decision to...
TRANSCRIPT

The Decision to Privatize:
Finance, Politics, and Patronage*
July 2006
I. Serdar Dinc
Kellogg School of Management
Northwestern University
Nandini Gupta
Kelley School of Business
Indiana University
Abstract
We investigate the role of financial and political factors in the decision to privatize government-
owned firms by using a unique firm-level data set from India. The results show that larger, more
profitable firms with smaller workforces are more likely to be privatized early. We also find that
the government is reluctant to privatize firms located in regions where the governing party faces
more political competition from parties in opposition. Further, no government-owned firm
located in the home state of the politician in charge of that firm is ever privatized. These results
are robust to firm-level characteristics such as sales growth and investment; the influence of
labor groups; political ideology; industry and time effects; and state-level differences in income,
education, and urbanization.
Key Words: Government Ownership, Political Economy, Emerging Markets, Economic
Reform, State-Owned Enterprise, Interest Groups, IPO.
* We thank Utpal Bhattacharya, Sugato Bhattacharyya, Mara Faccio, Ray Fisman, Rick Harbaugh, Gerard Roland, Anjan Thakor, and Gregory Udell for valuable comments. This paper has also benefited from the comments of participants in the NBER India Conference (2005), World Congress of the Econometric Society Meetings (2005), Indiana University, University of Michigan, and Northwestern University finance workshops. All remaining errors are our own.

1. Introduction
The sale of government-owned firms to private owners has yielded more than $1 trillion
in revenues for governments across the world (Megginson and Netter (2001)), has improved the
performance of government-owned firms (La Porta and Lopez-de-Silanes (1999), Gupta (2005)
among others), and facilitated the development of financial markets (Megginson, Nash, Netter,
and Poulsen (2004)). Yet, governments still own a substantial number of firms across the world
(Megginson (2005)). Given the documented benefits, why are there widespread delays in
privatization, with governments worldwide choosing to sell some firms but not others to private
owners?
To answer this question we investigate the role of firm-specific financial and political
factors in the selection of firms for share-issue privatization. Following the literature on the
decision to go public by private firms, we identify financial characteristics of firms that are likely
to influence the decision to privatize.1 However, the decision to sell government-owned firms is
likely to depend not only on financial considerations, but also on political costs and benefits. The
benefits of privatization, such as financial market development and efficiency gains, tend to be
dispersed across the population, while the costs of privatization, such as layoffs of surplus
workers and the loss of private benefits of control for politicians, tend to be geographically
concentrated among a small group. To understand how these concentrated costs can slow down
the process of privatization, we investigate the role of political competition and patronage in the
privatization decision.
Since the adverse effects of privatization are likely to be concentrated in the region where
a firm operates, the governing party may lose votes in that region because of opposition from
interest groups that are adversely affected, such as the employees of local government-owned
firms. Moreover, cross-country public opinion surveys suggest that the privatization of
government-owned firms may be perceived negatively by the population as an inequitable
transfer of publicly-owned assets to private owners (Nellis (2003)). Since any decrease in voter
support is likely to matter more for the governing party if it is in a competitive race with
opposition parties in a region, we expect the government to be least likely to privatize firms in
regions where the governing and opposition parties have comparable strength. Instead, we expect
1 Pagano, Panetta, and Zingales (1998) investigate the determinants of the decision to go public by private firms. For a recent survey of the IPO literature see Ritter and Welch (2002).
1

the government to privatize firms that are located in regions where the governing party is strong
enough to withstand the effects of a political backlash, or in regions where there is little hope of
victory.
To study the financial and political determinants of privatization we need firm-level data
not only on privatized firms but also on the government-owned firms that are never privatized.
Data on the latter companies are typically not available for many countries. We use a unique
firm-level database from India that includes both privatized firms and those that remain fully
government-owned. The data covers 80% of the firms owned by the federal government. Using
India as the empirical context has other advantages. First, it is a multi-party democracy with
robust political competition among its political parties. Second, since this is a single-country
study we can control for institutional differences across countries such as legal systems and
colonial legacies. Finally, by using India as the empirical context we can exploit regional
differences across the different Indian states. Most Indian states are more populous than the
average nation, and there is significant variation in voter support for the different political parties
across the states.
The results suggest that, similar to the IPO decision of private firms, larger and more
profitable firms are more likely to be privatized. However, unlike private firm IPOs, political
factors play an important role in privatization. We find that the rate of privatization is
significantly faster if the firm is located in a state where the governing party and its allies won a
large proportion of the seats in the federal parliamentary elections. Privatization is significantly
delayed if a firm is located in a state where the governing and opposition party alliances are in a
close race and won a similar proportion of seats to parliament. For example, the rate of
privatization is more than 4 times higher for a firm located in a state where the governing party
alliance won 100% of the seats to parliament, compared to a firm located in a state where the
governing and opposition party alliances each won 50% of the seats. Rather than rewarding a
supportive electorate, it appears that the government acts to minimize the effects of a political
backlash by delaying privatization in states where it has weak voter support or faces more
competition from the opposition. We also find that privatization is delayed for firms that have a
large wage bill and a large workforce, suggesting that labor groups may successfully oppose
privatization. Thus, the dispersed benefits and concentrated costs of privatization appear to
significantly influence the pattern of firm sales.
2

We check the robustness of our results in several ways. First, the specifications control
for firm-level characteristics such as sales, profitability, and workforce size, as well as year and
industry effects. Second, we show that the political results do not simply reflect the ideological
positions of the political parties. We find that the strength of anti-privatization leftist parties in a
state does not have a significant influence on the privatization decision, and political competition
continues to matter when we control for the strength of these parties. Third, the results are robust
to controlling for additional firm-level financial variables, including sales growth and
investment. Fourth, we show that our results are not a proxy for state-level demographic
characteristics such as income, education, and urbanization, which may affect popular support
for privatization. Finally, we show that our results are robust to alternative measures of political
competition and to alternative econometric specifications and samples.
Since politicians may obtain private benefits from controlling government-owned firms
(Shleifer and Vishny (1994), Boycko, Shleifer, and Vishny (1996), and Dinc (2005)), we also
investigate the role of political patronage in the privatization decision. For example, politicians
may influence the hiring and purchase decisions of government-owned firms so that they favor
political supporters. Retaining control over a firm is likely to be a greater priority for a politician
if the firm is located in the politician’s home state. In other words, catering to local supporters to
increase the chances of being reelected is likely to be more important in the politician’s home
state. We find that no firm is ever privatized if it is located in the state from which the minister
with jurisdiction over that firm is elected
The economic reforms of 1991 and the bulk of privatizations in the last decade were
undertaken by the federal government that was in power between 1991 and 1996. In all these
privatizations the government sold minority equity stakes on domestic and international stock
markets, which is a common strategy adopted by governments around the world (LaPorta, Lopez
de Silanes, and Shleifer (2002), Boubakri, Cosset, and Guedhami (2005), and Gupta (2005)).
Evidence from the existing literature and the subsequent pattern of majority sales suggests that
partial privatizations matter. In particular, Gupta (2005) shows that partial privatization has a
significant positive impact on the profitability of Indian government-owned firms, and that
partially privatized firms also are more likely to sell majority stakes later. Hence, politicians have
an incentive to resist partial privatizations because these firms are likely to be candidates for
eventual majority sales.
3

There is a growing theoretical and empirical literature on the role of political institutions
in privatization. In particular, Perotti (1995) develops a model to show that governments may
retain a passive stake in companies to signal to investors their commitment to not implement
policies adverse to the firm; and Biais and Perotti (2002) argue that conservative governments
are more likely to privatize to induce median class voters to buy enough shares to shift political
preferences away from left wing parties.
Among empirical studies of privatization, Jones, Megginson, Nash, and Netter (1999)
show that governments adopt strategic sale methods that are consistent with political objectives;
Megginson, Nash, Netter, and Poulsen (2004) examine the choice of privatizing through sales in
public versus private capital markets and find that share issue privatizations are more likely for
profitable firms, and in countries with less developed financial markets and more minority
shareholder protections; and Bortolotti and Pinotti (2006) find that privatization is delayed in
democracies with proportional electoral systems. These studies provide insight into how cross-
country differences in political institutions can explain why some countries privatize more than
others, or adopt different methods of privatization. However, our focus is different: we study
why governments choose to privatize some firms but not others.2
Our paper is related to Clarke and Cull (2002) who find that poor performance and
surplus employment increases the likelihood of bank privatization in Argentina, while the
political affiliation of the provincial government does not have a robust impact on the probability
of privatization. Our paper differs in several ways. First, we focus on the role of political
competition between governing and opposition parties in the privatization process. Second, we
investigate political patronage arguments in privatization by identifying and connecting
politicians to the firms they control. Third, we analyze all non-financial, government-owned
firms in India, rather than a single industry.
Our paper is also related to the literature on the politics of financial and economic
reforms. Kroszner and Strahan (1999) investigate the influence of interest groups on the pattern
of banking sector deregulation across U.S. states; and Brown and Dinc (2005) show the role of
politics in the government’s decision to intervene in failing banks in emerging markets.
Motivated by Grossman and Helpman (1994), empirical work by Goldberg and Maggi (1999)
2 The question of how a government maximizing revenues from privatization sales will sequence the sale of firms is investigated theoretically in an auction model by Chakraborty, Gupta, and Harbaugh (2004), and empirically by Gupta, Ham, and Svejnar (2005).
4

and Gawande and Bandyopadhyay (2000) investigates the relationship between the monetary
contributions to politicians and policy outcomes. Note that such a relationship cannot be
analyzed with our sample because corporate political contributions are illegal in India and tend to
be made under the table.
The paper is organized as follows: In section 2 we describe the privatization program and
the Indian political system, in section 3 we describe hypotheses based on the financial and
political factors likely to affect the privatization decision, in section 4 we describe the data, in
section 5 we present the results, in section 6 we provide robustness checks, and in section 7 we
conclude.
2. Background on Privatization and the Political System in India
2.1 Government-owned Firms
Government ownership of firms in India was originally justified by concerns that the
private sector would not undertake projects requiring large investments with long gestation
periods. In the late 1960s there was a period of rapid nationalization of firms in all sectors, so
that by the mid-seventies the public sector accounted for one-fifth of GDP (Goyal (2000)). The
size of the state sector has increased in recent years. In 2000 these firms accounted for
approximately one-fourth of GDP and more than two-fifths of the total capital stock in India.
Federal government-owned firms include departmental firms that are run directly by
government ministries, such as the railways, the postal service, telecommunications, and power,
as well as firms that have separate boards of directors. These firms are large employers
accounting for 10% of the total workforce in the organized sector.3 They also tend to be
overstaffed. According to the government’s own numbers, the average ratio of wages to sales
between 1990 and 1998 was 18.9% among government-owned manufacturing firms, more than
twice that of private manufacturing firms during the same period (Department of Disinvestment
(2001)). Over half the firms owned by the federal government are loss-making, and the majority
of these companies perform far worse in comparison to private firms in the same industry.
Between 1990 and 1998, while the ratio of profits after tax to sales averaged -4.4% for
3 The total workforce in registered companies was estimated at 27 million in 1997 (Department of Disinvestment, 2001).
5
government-owned manufacturing firms, profits after tax to sales averaged 6.7% among private
manufacturing firms (Department of Disinvestment (2001)).
Individual state governments own approximately 941 firms, primarily in the power and
agricultural sectors. Only a handful of state governments have launched privatization programs
and that too with limited success. We focus on firms owned by the federal government because
these account for about 85% of the total assets of all government-owned companies.
In response to a balance of payments crisis in 1991, India undertook sweeping economic
reforms that included deregulation and privatization. Out of 276 firms, 41 firms sold equity on
domestic and international capital markets between fiscal years 1991 and 1995.4 Though some of
these firms sold equity multiple times, we restrict our analysis to the first sale to avoid the
potential endogeneity that may arise if past equity sales affect the probability of subsequent
equity sales. The sale methods adopted by the government include auctions and public offerings
in domestic markets, and global depository receipt issues in international markets. Although the
government continued to hold the majority of shares, these firms became subject to monitoring
by minority shareholders and to the transparency and disclosure requirements of being listed on
the stock market (Gupta (2005)).
Following the defeat of the Congress party in the May 1996 federal elections, the
privatization program was in hiatus until the election of the Bharatiya Janata Party (BJP) to the
national government in 1999. About 16 firms sold majority stakes to private owners under the
BJP government. Eight of these 16 firms are included in our data as privatized firms because
they also sold equity stakes between the years 1991 and 1996. Due to the small number of
additional sales we focus on all the privatizations undertaken by the government that was in
power between 1991 and 1996.
2.2 Political System
The most populous democracy in the world, India has a British-style parliamentary
system where representatives are directly elected to the Lok Sabha, the lower house in the federal
government. Unlike the U.S. Senate, the upper house of the national government, the Rajya
Sabha, does not have legislative powers and its representatives are not directly elected by
citizens. Representatives to the Lok Sabha are elected from 543 single-member districts
4 Fiscal year t starts in April of calendar year t and runs through March of calendar year t+1.
6
distributed across 35 states, and the political party or alliance of parties that wins the majority of
districts forms the national government, headed by the Prime Minister and a cabinet of ministers.
Statewise distribution of seats in the Lok Sabha depends on the population in each state. Since
privatization began after the 1991 Lok Sabha elections, we base our analysis on the results of that
election.
Following India’s independence from the United Kingdom in 1947, the main political
party was the pro-independence, ideologically center-left Congress party. This party was in
power at the federal level for most of the years following independence. In the 1991 elections the
Congress party and its partners won the majority of districts and formed the government. The
economic reforms of 1991 were initiated, and the privatizations were carried out by the Congress
party-led government until it lost the elections in 1996.
Approximately 450 political parties participated in the 1991 elections. It is common for
national political parties to establish alliances with each other as well as smaller regional parties
before the elections in order to increase their chances of forming a majority government. A
political party may support another party’s candidate in the districts where the latter party is
strong. These candidates, in turn, support the national parties in parliament when they are elected
and are often represented in the government if the alliance wins the election. Hence, it is more
appropriate to study the electoral performance of political alliances rather than that of individual
parties.
3. Financial and Political Determinants of the Decision to Privatize
In this section we develop empirical predictions about the main financial and political
factors that are likely to affect the decision to privatize. To develop predictions about financial
factors that may influence the privatization process we draw upon the literature on why private
firms go public (Pagano, Paneta, and Zingales (1998) and Ritter and Welch (2002)). However, a
major difference between the IPOs of private firms and the privatization of government-owned
firms is that political factors are likely to play a significant role in the latter case. We develop
new hypotheses regarding the role of politics in the privatization decision, which we test using
firm-level data on both privatized firms and firms that are never privatized. The discussion below
is summarized in Table A1.
7

A. Financial Factors
A.1 Firm Size
If investors are less informed than issuers about the value of a company then there may
be adverse selection in the quality of firms that choose to go public (Leland and Pyle (1977)).
Chemmanur and Fulghieri (1995) have argued that the cost of adverse selection is likely to be
greater for younger and smaller firms, which is supported by the results of Pagano, Panetta, and
Zingales (1998) who find that smaller firms are less likely to go public. If adverse selection also
arises in the privatization context we expect a positive relationship between firm size and the
likelihood of privatization.
A.2 Firm Profitability
Since the late 1980s, governments have raised more than $1 trillion through privatization
sales (Megginson and Netter (2001)). The Indian government raised nearly 900 billion INR
between 1991 and 1995, or about $2.2 billion at the current exchange rate (Department of
Disinvestment (2001)). Moreover, proceeds from privatization generally flow to the divesting
government rather than being reinvested in the privatizing firms (Megginson (2005)). In India,
for example, the proceeds are used to pay down the budget deficit. It has also been shown in the
literature that privatizing profitable firms first may increase sale proceeds (Megginson, Nash,
Netter, and Poulsen (2004) and Gupta, Ham, and Svejnar (2005) Therefore, if raising money
from privatization sales is a motivating objective for the government, we expect a positive
relationship between firm profitability and the likelihood of privatization.
A government that has initiated a privatization program may also be concerned about
building popular support for the process. The financial success of initial privatization sales may
be especially important to build credibility and encourage investor participation in the future
(Dewenter and Malatesta (1997), Megginson, Nash, and van Randenborgh (1994), Megginson,
Nash, Netter, and Poulsen (2004), and Chakraborty, Gupta, and Harbaugh (2004)). Therefore, to
increase public and investor support for privatization, governments may prefer to privatize the
more profitable firms first (Megginson, Nash, Netter, and Poulsen (2004)).
Governments may also be interested in improving the efficiency of firms through
privatization. The majority of studies have found that privatization leads to efficiency
improvements in government-owned firms across the world (Megginson and Netter (2001)),
8

including India (Gupta (2005)). Moreover, it has also been shown that efficiency improvements
are greatest in the least efficient firms (Claessens, Djankov, and Pohl (1997) and Frydman, Gray,
Hessel, and Rapaczynski (1999)). If improving firm efficiency is a consideration in the
government’s decision to privatize then we expect a negative relationship between the
probability of privatization and firm profitability. Hence, the relationship between firm
profitability and the privatization decision is likely to depend on the relative emphasis placed by
the government on increasing sale proceeds and public support, as opposed to improving firm
efficiency.
B. Political Factors
Privatization is often opposed by interest groups such as workers of government-owned
firms who fear layoffs, and may be perceived negatively by the public as an inequitable or
corrupt transfer of publicly-owned assets to private owners (Nellis (2003)). As a result, political
considerations are likely to influence the government’s decision to privatize. We investigate the
role of politics using a political economy framework in which the benefits of privatization, such
as sale proceeds and efficiency gains, are likely to be dispersed across the population, while the
costs of privatization, such as layoffs and the loss of private benefits for politicians, tend to be
concentrated among a small group. To understand how these concentrated costs may slow down
privatization, we investigate the role of political patronage, political competition, and labor on
the decision to privatize.
B.1 Political Patronage
It is argued that one of the main causes of inefficiency in government-owned firms is
interference by politicians in the operations of the firm (Shleifer and Vishny (1994)). If
politicians obtain private benefits from controlling government-owned firms (Shleifer and
Vishny (1994), Boycko, Shleifer, and Vishny (1996), and Dinc (2005)), then any loss in these
benefits following privatization may influence the decision to privatize. For example, politicians
may influence the hiring and purchase decisions of government-owned firms so that they favor
political supporters. If the politician in charge of a firm is also elected from the state where the
firm is located, she may be reluctant to privatize that firm because the ability to secure campaign
contributions and reelection through political patronage is likely to matter more in the
9

politician’s home state. To test whether political patronage plays a role in the privatization
decision, we investigate whether privatization is less likely if a firm is located in the same state
from which the politician in charge of that firm is elected.
B.2 Political Strength
The potential costs of privatization, such as layoffs, are likely to be geographically
concentrated in the region where a firm operates. As a result, voter support for the governing
party in that region may decrease because of opposition from interest groups such as local
government-owned enterprise workers, or because of negative public perceptions about
privatization. It follows that the governing party may prefer to privatize firms that are located in
regions where it has more voter support and can withstand the effects of a potential political
backlash. Alternatively, the government may choose to ensure electoral victory and reward its
political supporters by not privatizing firms located in regions where it enjoys strong support.5
Hence, the question of the effect of the governing party’s political strength on the privatization
decision is an empirical one.
B.3 Political Competition
The effect of a political backlash on electoral outcomes is likely to be greater if the
governing and opposition parties face a close race in a state with similar levels of voter support.
When the governing party faces strong competition from opposition parties, a decrease in
support may cause the governing party to lose seats from that state. Correspondingly, if the
governing party is either far ahead or far behind the opposition in terms of voter support then a
political backlash may not have much impact on electoral outcomes. If political competition
matters in the privatization decision, it follows that the government may prefer to delay the
privatization of firms located in states where the governing party faces strong competition from
the opposition.
B.4 Influence of Labor
As in many other countries, government-owned firms in India tend to be highly
overstaffed. This may be due to advocacy by the powerful labor unions, which are aligned with 5 For example, Sapienza (2004) finds that government-owned banks in Italy provide loans with lower interest rates in the regions where the party that controls the banks enjoys strong voter support.
10

the political parties. These labor unions have been a vocal opponent to privatization because of a
higher likelihood of layoffs following privatization.6 Labor groups are more likely to oppose the
privatization of firms with a large workforce since these firms are likely to have more surplus
workers. Therefore, if the political costs to the government arising out of opposition from labor
groups are high, we expect a negative relationship between the likelihood of privatization and the
size of the firm’s workforce.
3. Data
We observe the identity of all the 276 manufacturing and non-financial service sector
companies owned by the federal government of India. Financial data is available for 246 firms
from which we exclude 31 firms with sales less than 10 million Indian National Rupees, about
$220,000 at the current exchange rate of 1 USD = 46 INR. The location of the main operations of
one firm could not be identified conclusively and we exclude it from the sample. The remaining
panel is unbalanced and not every data item is available for all the firms. The data was collected
by the Centre for Monitoring the Indian Economy (CMIE) from company reports. Since CMIE
does not report employment data for most companies, we supplement missing data on the
number of workers with information from the Public Enterprise Survey published by the
Department of Public Enterprises, Government of India.
The data start in fiscal year 1990, one year prior to the launch of the economic reforms of
1991 to allow a lag structure in the regression analysis, and end in March 1996 (fiscal year
1995), shortly before the 1996 national elections. Data on privatization transactions were
obtained from the Disinvestment Commission of the Government of India, the World Bank
Privatization Transactions Database, and from news sources. Data on the location of the main
operations or main plant of each firm is from CMIE and we supplement it with information
obtained directly from the companies. About 80% of companies have their main operations
located in only one state. For companies with multiple plants in different locations, we define the
main plant as the one with the largest asset base and use its location as the location for the firm.
6 Most major labor unions in India have organized massive protests opposing privatization. For example, quoting BBC News, May 21, 2003 (Millions strike against privatization), “The strike was called by trade unions including the All India Trade Union Congress (AITUC), Centre for Indian Trade Unions (CITU), and the Hind Mazdoor Sabha, who claimed about 40 million workers were participating in the walk-out. They are calling for a halt to the government's ongoing privatisation and plans to change labour laws.”
11

We observe financial data for 39 of the 41 companies privatized between 1991 and 1995
by the governing Congress party, which lost the national elections in 1996. Table 1 provides
sample statistics for the main variables used in the analysis and compares privatized firms with
firms that remain 100% government owned during this period. Here and in the regression
analyses below we include each privatized firm only until the year of privatization in order to
avoid capturing the effect of privatization on firm characteristics. All non-privatized firms are
followed until the end of fiscal 1995, or the latest year the data are available. In addition, all the
firm-specific variables are windsorized at the 5th and 95th percentiles to mitigate the effect of
outliers.
Comparing the pre-privatization characteristics of the privatized firms to firms that are
not privatized we note several differences. The average annual sales of privatized firms are
nearly four times larger than the average sales of firms not chosen for privatization, with the
difference being significant at the 1% level. Government-owned firms have an average ratio of
earnings before interest, tax, depreciation, and amortization (EBITDA) to Sales equal to -2%.
However, privatized companies have positive earnings with an average ratio of EBITDA to Sales
equal to 20.4% compared to -3.8% for companies that are not privatized, with the difference
being statistically significant at the 1% level. This comparison does not capture any performance
improvements due to privatization because the privatized companies are included in the sample
only until the year in which they first sell equity. Privatized companies are also, on average, less
labor-intensive than their fully government-owned counterparts as measured by the ratio of the
number of workers to sales and the ratio of the total wage bill to sales. Privatized companies
have higher sales growth and invest about twice as much per unit of sales as non-privatized
companies. We control for these differences by including firm characteristics in all the
regressions.
We collect state-level data on the electoral performance of all national and regional
political parties in the 1991 federal lower house elections from the Election Commission of
India, the regulatory agency in charge of conducting the elections.7 Information on which parties
belong to the main alliances is obtained from press sources and election websites.
7 Our analysis is at the state rather than the district level because we observe the location of the main operations of firms by state.
12
The Congress Party obtained the largest number of seats in the 1991 elections to the Lok
Sabha or the federal lower house of parliament and together with allied parties formed the
government. The largest opposition party was the Bharatiya Janata Party (BJP), which obtained
the second largest number of seats in the lower house of the federal parliament. While other
parties were also represented in parliament, we focus on the governing Congress party and its
allies and the opposition BJP and its allies.
India has a majoritarian electoral system in which the candidate in each district who
receives the plurality of votes is elected. As a result political parties are likely to care about both
their absolute electoral performance and their performance relative to that of opposition parties.
We create several variables to measure the political strength of the governing party and political
competition between the governing and opposition parties. First, as a measure of the political
strength of the governing party in a state, we use the proportion of seats in parliament won by the
Congress party alliance in that state (GovtSeatShare). To measure the political strength of the
largest opposition party in a state, we use the proportion of seats in parliament won by the BJP
alliance in that state (OppSeatShare). Specifically, these variables are constructed as the number
of seats won by a party alliance in a state divided by the total number of seats allotted to that
state in parliament. Note that although the two variables are related, OppositionSeatShare is not
equal to 1-GovtSeatShare because there are other political parties who contest and win seats
from each state.
To measure the extent of political competition between the governing and the main
opposition party alliances in a state we define AbsSeatShareDifference as the absolute value of
the difference between GovtSeatShare and OppositionSeatShare. A higher value of this variable
indicates that either the Congress Party alliance is far ahead or it is far behind the BJP alliance in
that state. The variable will take on a smaller value if the two party alliances win a similar
number of seats to Parliament from that state. Thus, a smaller value of AbsSeatShareDifference
indicates a more competitive race between the governing and opposition party alliances.
As a robustness check we also use several alternative measures of political strength and
competition. These include the difference between GovtSeatShare and OppositionSeatShare,
SeatShareDifference, which assumes a higher value in states where the governing party alliance
is ahead of the opposition party alliance; the vote shares received by the governing and
opposition party alliances in each state, GovtVoteShare and OppositionVoteShare, respectively;
13

and the difference and absolute value of the difference between these two variables,
VoteShareDifference and AbsVoteShareDifference, respectively.
Table 2 describes the value of the political variables in each of the states where the main
operations of the firms in our sample are located. In the 1991 federal parliamentary elections, the
Congress Party alliance won more seats than the BJP party alliance in 18 states, the BJP party
alliance won more seats in 4 states, and in one state both won the same number of seats. In Table
3 we report the sample statistics of the political strength and competition measures across firms,
where each firm is matched with a state based on the location of its main operations. The sample
statistics are suggestive. We find that privatized firms tend to be located in states where the
governing party alliance received a significantly higher share of seats, and in states where the
governing party alliance did not face a close race with the opposition.
To investigate the role of political patronage, we use annual data from the Comptroller
and Auditor General of India (the main auditing agency for government-owned firms) to match
each government-owned firm to the cabinet minister who has jurisdiction over that firm. The
identity and the home state of the cabinet ministers are obtained from the Election Commission
of India to determine whether a firm’s main operations are located in the home state of the
minister in charge of that firm. Up to 32 ministries are involved with the management of these
firms but the ministerial portfolios vary cross-sectionally. For example, the Department of Heavy
Industry controls the greatest number of firms – 51 firms out of 276, while the Ministry of
Petroleum and Natural Gas controls 21 companies.
4. Results
4.1 Political Patronage
If the politician with jurisdiction over a firm is elected from the state where the firm is
located, he may be reluctant to privatize that firm because the ability to secure campaign
contributions and reelection through political patronage is likely to matter more in the
politician’s home state. To test this hypothesis, the cabinet minister in charge of each firm is
identified for each firm-year observation. The minister’s home state is then compared with the
state where the firm’s main operations are located. Due to the lack of independence from one
year to the next if the same minister remains in charge of a given firm, an uninterrupted sequence
14

of the minister’s home state for that firm is taken as one minister-firm observation. The
industries in which no privatizations occur are excluded from the sample.
The results are presented in Table 4. During the tenure of the government in power
between 1991 and 1996, the home state of the cabinet minister in charge of a firm matches the
state where the firm’s main operations are located in 13 cases. Interestingly, not a single one of
these firms are privatized. The correlation between the incidence of privatization and the match
between a firm’s location and the minister’s home state is negative and significant at the 10%
level. While regression analysis is not possible because of the lack of heterogeneity, the results
suggest that political patronage plays an important role in the privatization decision.
4.2 Regression Results
In this section we use a regression framework to investigate the role of financial and
political factors on the likelihood of privatization. We use the Cox proportional hazard model
since it incorporates both the privatization of a given government-owned firm and the time of
privatization. More specifically, the hazard rate of privatization is given by
( )kk xxxthth βββ +++= ...exp)()( 22110 ,
where … are firm and state level explanatory variables, which include both time-varying
and time-constant variables. A description of the proportional hazard model may be found in
Wooldridge (2001) among others. The time of privatization is determined by the government’s
first sale of shares in the firm to the public. To account for firm-specific characteristics that can
have an effect on privatization we include annual profits, sales, and the ratio of the wage bill to
sales in the specifications, lagged one year. Notice that another advantage of the Cox
proportional hazard model is that the coefficient estimates are robust to any baseline hazard
function . This implies that the specification is robust to any time-specific common factors
so that year fixed effects are redundant. The regressions also include industry fixed effects. Thus,
the framework incorporates the fact that in some industries and in some years there are no
privatizations. Finally, the heteroskedasticity-robust standard errors are corrected for clustering
at the state level. Throughout the paper we report the coefficients, not the hazard ratios, from the
estimations.
1x kx
)(0 th
15

4.2.1 Financial Factors
We start by exploring the influence of firm-specific factors on the privatization decision.
In particular, we include the logarithm of Sales as a measure of size, the ratio of EBITDA to
Sales as a measure of profitability, and the ratio of Wages to Sales as a proxy measure of the size
of a firm’s workforce. From the results in column (1) of Table 5 we note that larger, more
profitable firms with lower wages are significantly more likely to be privatized early (at the 1
percent level). For example, we note that the rate of privatization is 26 times higher for a firm in
the 75th percentile of sales compared to a firm in the 25th percentile.8 In the case of profitability,
the rate of privatization is three times higher for a firm in the 75th percentile of EBITDA/Sales
relative to a firm in the 25th percentile, and in the case of wages, the rate of privatization is 79%
lower for a firm in the 75th percentile of Wages/Sales relative to a firm in the 25th percentile. The
size result is consistent with the hypothesis that larger firms face lower information costs and are
therefore more likely to issue equity. By selling profitable firms early it appears that the
government placed a greater emphasis on increasing sale proceeds and building public support
for privatization than on achieving efficiency improvements. The result that privatization is
likely to be significantly delayed for firms with a large wage bill suggests that employees of
firms with a large workforce may successfully oppose privatization.
4.2.2 Political Strength and Competition
Examining the role of political costs in the privatization decision, we note from column
(2) of Table 5 that the coefficient of GovtSeatShare, which is the proportion of seats in
parliament won by the governing party alliance in a state, is positive and statistically significant
at the 5 percent level. Thus, privatization is more likely to be delayed if the firm is located in a
state where the governing party has weak voter support. Consider the state of Tamil Nadu where
the governing party alliance won 100% of the seats, putting this state in the 75th percentile of
GovtSeatShare, as shown in Table 2. From column (2) of Table 5 we note that the rate of
privatization is 1.9 times higher for a firm located in Tamil Nadu compared to a firm located in
the state of Himachal Pradesh, which is in the 25th percentile of GovtSeatShare.
8 The value of Sales in the 75th percentile is equal to 2,594.5 million INR and in the 25th percentile is equal to 218.6 million INR. The value of EBITDA/Sales is equal to 0.139 in the 75th percentile and -0.09 in the 25th percentile. The value of Wages/Sales is equal to 0.387 in the 75th percentile and .088 in the 25th percentile.
16

From column (3) of Table 5 we note that AbsSeatShareDifference, which is the absolute
value of the difference between the proportion of seats won by the governing and opposition
party alliances in a state, has a positive coefficient that is statistically significant at the 10 percent
level. This result suggests that privatization is more likely to be delayed in states where the
governing party faces a close election, compared to states where the governing party enjoys
either strong or little support. From column (3) of Table 5 we note that the rate of privatization is
4.2 times higher for a firm located in Tamil Nadu, which is in the 75th percentile of
AbsSeatShareDifference, compared to a firm located in Himachal Pradesh where both the
governing and opposition party alliances won 50% of the seats as shown in Table 2, suggesting a
close race.
Our results suggest that rather than rewarding a supportive electorate, the government
acts to minimize the effect of a political backlash on electoral outcomes by privatizing firms that
are located in states where the governing party does not face a competitive race.9 Facing a trade-
off between the locally concentrated costs and the dispersed benefits of privatization, the
government’s decision to privatize some firms and not others appears to depend significantly on
the political strength of the governing party, and competition between the governing and
opposition parties in the state where the main operations of the firms are located.
4.2.3 Political Costs: Layoffs
We use several measures of worker influence to investigate whether labor plays a role in
the privatization decision. From columns (4)-(6) of Table 5 we note that the number of
employees divided by total sales, Workers/Sales, has a negative and statistically significant
coefficient in all the specifications. This result suggests that the employees of government-
owned firms may successfully delay or prevent privatization. Further, the results show that the
political factors are not a proxy for the influence of labor groups since all the political variables
retain their previous levels of statistical significance. Note that all the regressions include
industry dummies hence it is unlikely that this variable is a proxy for labor-intensive industries.
9 While the governing Congress party did lose its majority in parliament in the next elections, it is difficult to establish whether this was due to privatization because the privatization program was only one part of the economic reforms launched in 1991, and because non-economic factors were also important in the 1996 elections.
17

5. Additional Robustness Checks
5.1 Additional Measures of Political Competition
To check the robustness of the results to alternative definitions of political competition,
we also estimate the regressions in Table 5 using the seat share obtained by the opposition party
alliance in each state, OppositionSeatShare; the difference between the governing and opposition
party alliance seat shares in each state, SeatShareDifference; the vote share obtained by the
governing party alliance in each state, GovtVoteShare; the vote share obtained by the opposition
party alliance in each state, OppositionVoteShare; the difference between the vote share obtained
by the governing and largest opposition alliances in each state, VoteShareDifference; and the
absolute value of the difference between GovtVoteShare and OppositionVoteShare,
AbsVoteShareDifference. From the results reported in Table 6 we note that privatization is likely
to be significantly delayed in states where the proportion of seats won by the opposition party
alliance is high, and in states where the governing party alliance wins a lower proportion of seats
than the opposition party alliance. Using vote shares instead of seat shares in columns (3)-(6) we
note that with the exception of GovtVoteShare, the results are similar in sign and significance to
those reported in Table 5.
5.2 Political Ideology
The political ideology of the governing and opposition parties may play a role in the
privatization decision. For example, Biais and Perotti (2002) suggest that right-wing
governments are more likely to support widespread share ownership through privatization. Since
the ideology of the governing party does not vary in our analysis, we instead consider the
strength of the pro-worker leftist parties, which have consistently and vocally opposed
privatization, across the different states. The results are reported in columns (1)-(3) of Table 7.
LeftistSeatShare, defined as the proportion of seats won by the communist and socialist parties in
a state, does not have a significant impact on the likelihood of privatization. Note that the
coefficients of GovtSeatShare and AbsSeatShareDifference remain positive and statistically
significant, suggesting these results are not a proxy for the political ideology of the different
parties but instead reflect a secular role of political competition.
18

5.3 Regional Characteristics
We investigate whether the electoral results may be a proxy for state-level demographic
characteristics such as income levels (per capita state income), literacy (% of state population
that is literate), and urbanization (% of state population living in towns and cities).10 For
example, higher income, educated, or urban voters may be more in favor of market reforms than
rural voters. From the results reported in columns (4)-(6) of Table 7 we note that none of these
factors appear to play a statistically significant role in the privatization decision. However, the
political strength and competition results remain robust to these differences in regional
characteristics.
5.4 Firm Funding Needs
Private firms that grow fast and invest more are more likely to go public in order to
finance their growth (Pagano, Panetta, and Zingales (1998)). One reason we may not observe this
pattern for privatized firms is that unlike private IPOs, proceeds from privatization sales do not
accrue to the privatized firms but go instead to the general government budget. From the results
reported in Table 8 we note that the coefficients of sales growth and investment are not
statistically significant. However, the firm sales, profitability, and wages results remain robust,
indicating that these variables are not proxies for growth and investment in the privatization
decision.
5.5 Alternative Econometric Specifications and Samples
To investigate whether the main results are robust to alternative econometric
specifications, in columns (1)-(3) of Table 9 we report the results from a cross-sectional probit
specification where the dependent variable is equal to one if the firm is privatized between 1991
and 1995. One advantage of this specification is that the firm-specific variables are as of 1990,
before the 1991 elections analyzed in this paper. A disadvantage is that the cross-sectional
regression does not incorporate information on the timing of privatization sales. However, we
find that the results are similar to those obtained in Table 5, and the coefficients of the financial
and political variables retain their sign and significance in the probit model.
10 Since our analysis of the governing party’s political strength takes the state as the electoral unit, state-fixed effects cannot be included in the regressions.
19

Lastly, there may be stock market listing restrictions that prevent firms with negative
EBITDA to be considered for privatization. In the last three columns of Table 9 we report the
results from a Cox proportional hazard specification with the regression sample restricted to
firm-years with positive EBITDA. Once again, the results are robust to this alternative sample.
6. Conclusion
Based on the fact that most privatizing governments sell government-owned firms over
time rather than at once, we investigate whether firm-specific financial factors and the political
objectives of the government are likely to affect the pattern of privatization. Using a unique
dataset of Indian government-owned firms, which includes both privatized firms and firms that
are never privatized, we find that the decision to privatize depends on the financial
characteristics of firms, the influence of labor, and political factors.
Consistent with the findings of the literature on IPOs by private firms, the results suggest
that larger and more profitable firms are more likely to be privatized early. Unlike IPOs by
private firms, we find that political factors also play a major role in the decision to privatize
government-owned firms. While the benefits of privatization, such as efficiency improvements,
are dispersed across the population, the costs are likely to be geographically concentrated among
a small group, such as local employees of government-owned firms. The public too may perceive
privatization negatively as an inequitable transfer of publicly-owned assets to private owners.
Hence, opposition from interest groups and a public backlash could reduce voter support for the
governing party in the state where the privatized firm is located. The effects of a backlash on
electoral outcomes are likely to be more severe if the governing party faces a close race with
other political parties in that state.
The results show that privatization is more likely to be delayed if the main operations of a
firm are located in a region where the governing party alliance won fewer seats than the
opposition party alliance in the elections to the federal government, or in a region where the
governing and opposition party alliances face a close race. These results are consistent with the
hypothesis that the government may prefer to privatize firms located in regions where the
electoral effects of a political backlash can be minimized. In addition, privatization is more likely
to be delayed if a firm has a large workforce and high wage bill, suggesting that workers may
oppose privatization. We note that all the results are robust to firm-specific factors such as size,
20

income, wages, growth, and investment; industry and year effects; the influence of labor; the
strength of leftist parties; regional demographic characteristics such as income, education, and
urbanization; and alternative specifications.
The evidence also suggests that the private benefits that politicians obtain from
controlling government-owned firms can influence the decision to privatize. In particular, we
find that no government-owned firm located in the home state of the politician in charge is ever
privatized.
Lastly, our work has implications for the literature on privatization that studies the post-
privatization period by assuming (often implicitly) that firms are selected randomly for
privatization. This paper shows that selection for privatization is not a random decision but
reflects a political equilibrium as well as firm characteristics.
21
References
Biais, Bruno and Enrico C. Perotti (2002). “Machiavellian Privatization,” American Economic
Review, 92, 240-258.
Bortolotti, Bernardo and Paolo Pinotti (2006). “Delayed Privatization,” FEEM Working Paper
Series.
Boubakri, Narjess, Jean-Claude Cosset, and Omrane Guedhami (2005). “Post-privatization
Corporate Governance: The Role of Ownership Structure and Investor Protection,”
Journal of Financial Economics, 76, 369-399.
Boycko, Maxim, Andrei Shleifer, and Robert Vishny (1996). “A Theory of Privatization,”
Economic Journal, 106, 309-319.
Brown, Craig and Serdar Dinc (2005) “The Politics of Bank Failures: Evidence from Emerging
Markets,” Quarterly Journal of Economics, 120 (4), 1413-1444.
Chakraborty, Archishman, Nandini Gupta, and Rick Harbaugh (2004). “Best Foot Forward or
Best for Last in a Sequential Auction?” forthcoming RAND Journal of Economics.
Chemmanur, Thomas J. and Paolo Fulghieri (1994). “Reputation, Renegotiation, and the Choice
Between Bank Loans and Publicly Traded Debt,” Review of Financial Studies, 7, 475-
506.
Claessens, Stijn, Simeon Djankov, and Gerhard Pohl (1997). “Determinants of Performance of
Manufacturing Firms in Seven European Transition Economies,” William Davidson
Institute Working Paper, No. 74.
Clarke, George and Robert Cull (2002). “Political and Economic Determinants of the Likelihood
of Privatizing Argentine Public Banks,” Journal of Law and Economics, 45, 165-197.
Department of Disinvestment, Government of India (2001). “Presentation on Disinvestment,”
New Delhi, India: The Government of India.
Department of Public Enterprises (1990-1999). Public Enterprise Survey, New Delhi, India: The
Government of India.
Dewenter, Kathryn L. and Paul H. Malatesta (1997). “Public Offerings of State-Owned and
Privately Owned Enterprises: An International Comparison,” Journal of Finance, 52,
1659-1679.
Dinc, Serdar (2005). “Politicians and Banks: Political Influences on Government-Owned Banks
in Emerging Markets,” Journal of Financial Economics, 77, 453-479.
22

Frydman, Roman, Cheryl W. Gray, Marek Hessel, and Andrzej Rapaczynski (1999). “When
Does Privatization Work? The Impact of Private Ownership on Corporate Performance in
Transition Economies,” Quarterly Journal of Economics, 114, 1153-91.
Gawande, Kishore and Usree Bandyopadhyay (2000). “Is Protection for Sale? A Test of the
Grossman-Helpman Theory of Endogenous Protection,” Review of Economics and
Statistics, 89, 139-152.
Goldberg, Pinelopi and Giovanni Maggi (1999). “Protection for Sale: An Empirical
Investigation,” American Economic Review, 89, 1135-1155.
Goyal, Sudhir K. (2000). “Privatization in India,” in Gopal Joshi, ed.: Privatization in South
Asia: Minimizing negative social effects through restructuring, New Delhi, India:
International Labour Organization.
Grossman, Gene M. and Elhanan Helpman (1994). “Protection for Sale,” American Economic
Review, 84, 833-850.
Gupta, Nandini (2005). “Partial Privatization and Firm Performance,” Journal of Finance, 60,
987-1015.
Gupta, Nandini, John Ham, and Jan Svejnar (2005). “Priorites and Sequencing in Privatization:
Evidence from Czech Firm Panel Data,” William Davidson Institute Working Paper.
Jones, Steven L., William L. Megginson, Robert C. Nash, and Jeffry M. Netter (1999). “Share
Issue Privatizations as Financial Means to Political and Economic Ends,” Journal of
Financial Economics, 53, 217-253.
Kroszner, Randall and Philip E. Strahan (1999). “What Drives Deregulation? Economics and
Politics of the Relaxation of Bank Branching Restrictions in the United States,”
Quarterly Journal of Economics, 114, 1437-1467.
La Porta, Rafael and Florencio Lopez-de-Silanes (1999). “The Benefits of Privatization:
Evidence from Mexico,” Quarterly Journal of Economics 114, 1193-1242.
La Porta, Rafael, Florencio Lopez-de-Silanes, and Andrei Shleifer (2002). “Government
Ownership of Banks,” Journal of Finance, 57, 265-301.
Leland, Hayne E. and David H. Pyle (1977). “Informational Asymmetries, Financial Structure,
and Financial Intermediation,” Journal of Finance, 32, 371-387.
Megginson, William L., and Jeffry M. Netter (2001). “From State to Market: A Survey of
Empirical Studies on Privatization,” Journal of Economic Literature, 39, 321-389.
23
24
Megginson, William L., Robert C. Nash, Jeffry M. Netter, and Annette B. Poulsen (2004). “The
Choice of Public versus Private Capital Markets: Evidence from Privatizations,” Journal
of Finance, 59, 2835-2870.
Megginson, William L., Robert C. Nash and Matthias van Randenborgh (1994). “The Financial
and Operating Performance of Newly Privatized Firms: An International Empirical
Analysis,” Journal of Finance, 49, 403-452.
Megginson, William L., 2005. The Financial Economics of Privatization, Oxford University
Press: New York.
Nellis, John (2003). “Privatization in Latin America,” Center for Global Development Working
Paper Number 31.
Pagano, Marco, Fabio Panetta, and Luigi Zingales (1998). “Why do Companies Go Public? An
Empirical Analysis,” Journal of Finance, 53, 27-64.
Perotti, Enrico C. (1995). “Credible Privatization,” American Economic Review, 85, 847-859.
Ritter, Jay R. and Ivo Welch (2002). “A Review of IPO Activity, Pricing, and Allocations,”
Journal of Finance, 57, 1795-1828.
Prowess Database, 1990 to 2003 (Center for Monitoring the Indian Economy, Bombay, India).
Sapienza, Paola (2004). “The Effects of Government Ownership on Bank Lending,” Journal of
Financial Economics, 72, 357-384.
Shleifer, Andrei and Robert Vishny (1994). “Politicians and Firms,” Quarterly Journal of
Economics, 109, 995-1025.
Wooldridge, Jeffrey M. (2001). Econometric Analysis of Cross Section and Panel Data,
Cambridge:The MIT Press.

25
Table A1: Summary of Hypotheses and Predictions Theory Prediction Financial Factors Size Costs due to asymmetric information between investors and the firm are
likely to be lower for larger firms (Chemmanur and Fulghieri, 1995; Pagano et al., 1998).
Larger firms are more likely to be privatized.
Profitability Sale proceeds from privatization may be higher if the firms are more profitable (Gupta et al., 2005).
Profitable firms are more likely to be privatized.
To build support for privatization the government may prefer to sell better performing firms (Dewenter and Malatesta, 1997; Megginson et al., 1994; Megginson et al., 2004; Chakraborty et al., 2004).
Profitable firms are more likely to be privatized.
Efficiency improvements are highest for the least efficient firms (Claessens et al., 1997; Frydman et al., 1999).
Less profitable firms are more likely to be privatized.
Political Factors Political Patronage
Politicians obtain private benefits from controlling government-owned firms, such as securing jobs for supporters (Shleifer and Vishny, 1994; Boycko et al., 1996; and Dinc, 2005). These benefits may be a greater priority if a firm is located in the state from which the politician with jurisdiction over that firm is elected.
Firms located in the home state of the Cabinet Minister with jurisdiction over that firm are less likely to be privatized.
Political Strength
The adverse effects of privatization, such as layoffs, are concentrated in the region where a firm operates. The public too may perceive privatization negatively as a transfer of assets to private owners (Nellis, 2003). So the government may lose votes in the region where the privatized firm is located.
Firms located where the governing party has strong voter support are more likely to be privatized.
Political Competition
The effect of a backlash on voter support is likely to be greater if the governing and opposition parties face a close race with similar levels of voter support.
Firms located where the governing and opposition parties are not in close competition are more likely to be privatized.
Labor Labor unions oppose privatization because it can lead to layoffs of surplus workers. Opposition from labor may be higher in firms with a large workforce because these firms are likely to have more surplus workers.
Firms with a large workforce or a large wage bill are less likely to be privatized.

26
Table 1. Comparing Privatized and Not Privatized Firms
This table presents average values of the firm-specific financial variables used in the analysis for fiscal years 1991 to 1995. Privatized denotes the companies in which the government sold shares during this period. It includes firm-years until privatization but not after. Sales is the total sales of the firm; EBITDA is the income before interest, taxes, and depreciation; Wages is the firm’s total wage expenses; Workers is the number of firm’s employees; SalesGrowth is the inflation-adjusted rate of annual sales growth; Investment is the capital investment made that year. Standard deviations are in parentheses. *, **, *** denote statistical significance at the 10, 5, and 1% levels, respectively, in a two-sided equality of means test comparing privatized firms to firms that are not privatized.
Variables Privatized Not Privatized All Sales 992.73*** 281.79 333.42 (785.33) (549.90) (598.86) Number of Firm-years 65 830 895 Number of Firms 39 175 214 EBITDA/Sales (%) 20.4*** -3.8 -2.0 (12.9) (32.5) (32.1) Number of Firm-years 65 830 895 Number of Firms 39 175 214 Wages/Sales (%) 10.4*** 29.9 28.5 (10.3) (28.3) (27.9) Number of Firm-years 65 830 895 Number of Firms 39 175 214 Workers/Sales 12.73*** 59.90 56.59 (13.15) (75.58) (73.95) Number of Firm-years 56 741 797 Number of Firms 32 163 195 SalesGrowth (%) 8.2*** -3.0 -2.2 (22.3) (27.1) (26.9) Number of Firm-years 65 808 873 Number of Firms 39 172 211 Investment/Sales (%) 16.3*** 8.1 8.7 (17.2) (15.0) (15.3) Number of Firm-years 65 804 869 Number of Firms 39 170 209

Table 2. Proportion of Seats in the Federal Parliament Won by the Governing and the Largest Opposition Party Alliances by State
This table compares by state the representation of the governing party alliance led by the party to win the largest number of seats (Congress Party) and of the opposition party alliance led by the party to win the second largest number of seats (BJP) in the main chamber of the Indian Federal Parliament after the 1991 federal elections. It provides the proportion of seats won by a party alliance out of the total number of seats allocated to each state in the parliament. The states are determined by where the main operations of the firms in our sample are located. The proportions do not add up to 100 if other political parties have won seats from that state.
Share of Members of Parliament (%)
State Governing Party Alliance
(GovtSeatShare) Opposition Party Alliance
(OppositionSeatShare) Difference
(SeatShareDifference)
Absolute value of Difference
(AbsSeatShareDifference)Andaman & Nicobar 100.0 0.0 100.0 100.0 Andhra Pradesh 59.5 2.4 57.1 57.1 Assam 57.1 14.3 42.9 42.9 Bihar 1.9 9.6 -7.7 7.7 Delhi 28.6 71.4 -42.9 42.9 Goa 100.0 0.0 100.0 100.0 Gujarat 23.1 76.9 -53.8 53.8 Haryana 90.0 0.0 90.0 90.0 Himachal Pradesh 50.0 50.0 0.0 0.0 Karnataka 82.1 14.3 67.9 67.9 Kerala 65.0 0.0 65.0 65.0 Madhya Pradesh 67.5 30.0 37.5 37.5 Maharashtra 79.2 18.8 60.4 60.4 Meghalaya 100.0 0.0 100.0 100.0 Orissa 61.9 0.0 61.9 61.9 Pondicherry 100.0 0.0 100.0 100.0 Punjab 92.3 0.0 92.3 92.3
27

28
Table 2 continued Rajasthan 52.0 48.0 4.0 4.0 Sikkim 100.0 0.0 100.0 100.0 Tamil Nadu 100.0 0.0 100.0 100.0 Tripura 100.0 0.0 100.0 100.0 Uttar Pradesh 6.0 60.7 -54.8 54.8 West Bengal 11.9 0.0 11.9 11.9

Table 3. Comparing Political Data Across Privatized and Not Privatized Firms This table presents the sample averages and standard deviations of the political variables for the federal elections held in 1991. Privatized denotes the companies in which the government sold shares during this period. Govt denotes the governing party and its allies and Opposition denotes the largest opposition party and its allies. GovtSeatShare is the proportion of seats won from a state by the governing party out of all the seats allocated to that state, where the state is determined by the location of the firm’s main operations; OppositionSeatShare is the proportion of seats won by the main opposition party alliance; SeatShareDifference is the difference between GovtSeatShare and OppositionSeatShare; AbsSeatShareDifference is the absolute value of SeatShareDifference. GovtVoteShare, OppositionVoteShare, VoteShareDifference, and AbsVoteShareDifference replace the proportion of seats won with the proportion of votes won by the two party alliances. Standard deviations are in parentheses. *, **, *** denote statistical significance at the 10, 5, and 1% levels, respectively, in a two-sided test of the mean with the privatized firms and the other government-owned firms.
Variables Privatized Not Privatized All GovtSeatShare (%) 58.0*** 41.7 44.7 (29.4) (32.1) (32.2) OppositionSeatShare (%) 27.9 25.8 26.2 (29.6) (29.1) (29.1) SeatShareDifference (%) 30.1 16.0 18.5 (55.5) (49.5) (50.8) AbsSeatShareDifference (%) 59.4*** 44.4 47.2 (19.7) (26.8) (26.2) GovtVoteShare (%) 42.3*** 39.1 39.7 (10.2) (11.9) (11.6) OppositionVoteShare (%) 24.4 23.4 23.6 (15.4) (13.6) (13.9) VoteShareDifference (%) 17.9 15.6 16.1 (21.1) (19.4) (19.7) AbsVoteShareDifference (%) 21.3 18.9 19.4 (17.5) (16.2) (16.4) Number of Firms 39 175 214
29

Table 4. The Role of Political Patronage in the Decision to Privatize The table presents a two-way tabulation and correlation analysis between the decision to privatize a firm and the home state of the Cabinet Minister who has jurisdiction over that firm. It excludes the industries in which no privatizations occur. Each minister-firm pair is taken as a single observation regardless of the time length the firm remains under that minister’s jurisdiction. Plant in Home State is a dummy variable that is equal to one if the state where the firm’s main plant is located is the same as the state from which the cabinet minister who has jurisdiction over that firm is elected. Privatized is a dummy variable that is equal to one if the firm is privatized while under the jurisdiction of a given minister. Once a firm is privatized it is dropped from the sample. * denotes statistical significance at the 10% level.
Privatized Plant in Home State No Yes Total
No 176 39 215 Yes 13 0 13
Total 189 39 228 Correlation -0.112*
30

Table 5. The Role of Financial Factors, Political Strength, and Political Competition in the Decision to Privatize
The table presents the results from estimating a Cox proportional hazard regression of the government’s decision to privatize. Ln (Sales) is the natural logarithm of total sales; EBITDA is income before interest, taxes and depreciation; Wages is the firm’s total wage expenses. These variables are windsorized at the 5th and 95th percentiles and are lagged one year. Workers is the total number of workers, windsorized at the 5th and 95th percentiles. GovtSeatShare is the proportion of seats in the federal parliamentary elections of 1991 won by the governing party and its allies from a state out of all the seats allocated to that state, where the state is determined by the location of the firm’s main operations; AbsSeatShareDifference is the absolute value of the difference between GovtSeatShare and the proportion of seats won by the main opposition party alliance. Heteroscedasticity-robust standard errors, clustered at the state level, are in parentheses. *, **, *** denote statistical significance at the 10, 5, and 1% level, respectively. (1) (2) (3) (4) (5) (6) Ln(Sales) 1.242*** 1.321*** 1.226*** 1.213*** 1.477*** 1.288*** (0.200) (0.215) (0.208) (0.207) (0.321) (0.257) EBITDA/Sales 4.729*** 4.902*** 4.698*** 4.446*** 4.649*** 4.308*** (1.625) (1.444) (1.569) (1.362) (1.211) (1.302) Wages/Sales -5.574*** -5.274*** -5.103*** (1.711) (1.770) (1.896) Workers/Sales -0.028** -0.025** -0.024*** (0.012) (0.011) (0.009) GovtSeatShare 1.243*** 1.688** (0.480) (0.676) AbsSeatShareDifference 1.427* 2.094** (0.742) (0.899) Industry Fixed-Effects Yes Yes Yes Yes Yes Yes Observations 891 891 891 787 787 787
31
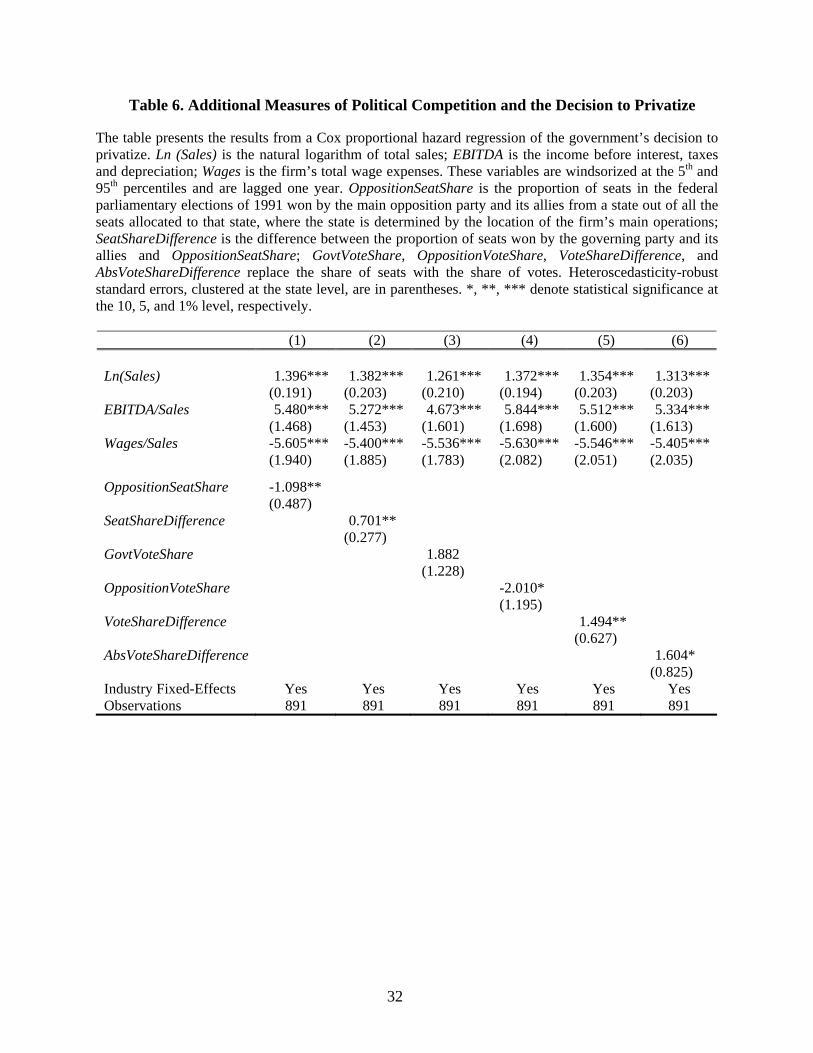
Table 6. Additional Measures of Political Competition and the Decision to Privatize The table presents the results from a Cox proportional hazard regression of the government’s decision to privatize. Ln (Sales) is the natural logarithm of total sales; EBITDA is the income before interest, taxes and depreciation; Wages is the firm’s total wage expenses. These variables are windsorized at the 5th and 95th percentiles and are lagged one year. OppositionSeatShare is the proportion of seats in the federal parliamentary elections of 1991 won by the main opposition party and its allies from a state out of all the seats allocated to that state, where the state is determined by the location of the firm’s main operations; SeatShareDifference is the difference between the proportion of seats won by the governing party and its allies and OppositionSeatShare; GovtVoteShare, OppositionVoteShare, VoteShareDifference, and AbsVoteShareDifference replace the share of seats with the share of votes. Heteroscedasticity-robust standard errors, clustered at the state level, are in parentheses. *, **, *** denote statistical significance at the 10, 5, and 1% level, respectively.
(1) (2) (3) (4) (5) (6) Ln(Sales) 1.396*** 1.382*** 1.261*** 1.372*** 1.354*** 1.313*** (0.191) (0.203) (0.210) (0.194) (0.203) (0.203) EBITDA/Sales 5.480*** 5.272*** 4.673*** 5.844*** 5.512*** 5.334*** (1.468) (1.453) (1.601) (1.698) (1.600) (1.613) Wages/Sales -5.605*** -5.400*** -5.536*** -5.630*** -5.546*** -5.405*** (1.940) (1.885) (1.783) (2.082) (2.051) (2.035)
OppositionSeatShare -1.098** (0.487) SeatShareDifference 0.701** (0.277) GovtVoteShare 1.882 (1.228) OppositionVoteShare -2.010* (1.195) VoteShareDifference 1.494** (0.627) AbsVoteShareDifference 1.604* (0.825) Industry Fixed-Effects Yes Yes Yes Yes Yes Yes Observations 891 891 891 891 891 891
32

Table 7. The Effect of Political Ideology and State-Level Characteristics on the Decision to Privatize
The table presents the results from estimating a Cox proportional hazard regression of the government’s decision to privatize. Ln (Sales) is the natural logarithm of total sales; EBITDA is income before interest, taxes and depreciation; Wages is the firm’s total wage expenses. These variables are windsorized at the 5th and 95th percentiles and are lagged one year. LeftistSeatShare is the share of seats won by the leftist party alliance in a state; Ln (IncomePerCapita) is the natural logarithm of per capita income in a state; Literacy is a state’s literacy rate in 1991; Urbanization is the proportion of the state’s population that lived in urban areas in 1991; GovtSeatShare is the proportion of seats in the federal parliamentary elections of 1991 won by the governing party and its allies from a state out of all the seats allocated to that state, where the state is determined by the location of the firm’s main operations; AbsSeatShareDifference is the absolute value of the difference between GovtSeatShare and the proportion of seats won by the main opposition party alliance. Heteroscedasticity-robust standard errors, clustered at the state level, are in parentheses. *, **, *** denote statistical significance at the 10, 5, and 1% level, respectively.
(1) (2) (3) (4) (5) (6) Ln(Sales) 1.228*** 1.351*** 1.256*** 1.298*** 1.441*** 1.274*** (0.203) (0.208) (0.214) (0.248) (0.257) (0.266) EBITDA/Sales 4.640*** 5.049*** 4.887*** 4.578** 5.388*** 4.728** (1.618) (1.443) (1.567) (2.161) (1.789) (2.121) Wages/Sales -5.512*** -5.318*** -5.130*** -4.658** -3.941* -4.203* (1.706) (1.793) (1.943) (2.014) (2.288) (2.326) LeftistSeatShare -0.299 0.538 0.731 (0.345) (0.397) (0.674) Ln(IncomePerCapita) -0.170 -1.272 -0.637 (0.877) (0.896) (0.976) Literacy 0.018 0.002 0.011 (0.013) (0.013) (0.012) Urbanization -0.614 2.213 0.413 (1.679) (1.796) (1.655) GovtSeatShare 1.347** 1.904*** (0.537) (0.337) AbsSeatShareDifference 1.694* 1.282* (0.901) (0.764) Industry Fixed-Effects Yes Yes Yes Yes Yes Yes Observations 891 891 891 786 786 786
33

Table 8. Funding Needs of Firms and the Decision to Privatize The table presents the results from estimating a Cox proportional hazard regression of the government’s decision to privatize. Ln (Sales) is the natural logarithm of total sales; EBITDA is income before interest, taxes and depreciation; Wages is the firm’s total wage expenses; SalesGrowth is the inflation-adjusted rate of annual sales growth; Investment is capital investment. These variables are windsorized at the 5th and 95th percentiles and are lagged one year. GovtSeatShare is the proportion of seats in the federal parliamentary elections of 1991 won by the governing party and its allies from a state out of all the seats allocated to that state, where the state is determined by the location of the firm’s main operations; AbsSeatShareDifference is the absolute value of the difference between GovtSeatShare and the proportion of seats won by the main opposition party alliance. Heteroscedasticity-robust standard errors, clustered at the state level, are in parentheses. *, **, *** denote statistical significance at the 10, 5, and 1% level, respectively.
(1) (2) (3) (4) (5) (6) Ln(Sales) 1.201*** 1.277*** 1.182*** 1.232*** 1.318*** 1.216*** (0.196) (0.210) (0.203) (0.204) (0.221) (0.211) EBITDA/Sales 4.814*** 4.943*** 4.757*** 4.152** 4.325*** 4.272** (1.663) (1.541) (1.655) (1.812) (1.633) (1.723) Wages/Sales -5.652*** -5.479*** -5.258*** -5.645*** -5.228*** -5.104*** (1.500) (1.567) (1.650) (1.650) (1.834) (1.886) SalesGrowth 0.173 -0.237 -0.021 (0.538) (0.594) (0.561) Investment/Sales 0.844 0.976 0.648 (0.683) (0.669) (0.701) GovtSeatShare 1.246** 1.301*** (0.489) (0.462) AbsSeatShareDifference 1.383* 1.378** (0.712) (0.671) Industry Fixed-Effects Yes Yes Yes Yes Yes Yes Observations 862 862 862 864 864 864
34

Table 9. Alternative Econometric Specifications The first three regressions are cross-sectional probit estimations where the dependent variable is equal to one if the firm is privatized during 1991-1996. Columns (4)-(6) presents the results from estimating a Cox proportional hazard regression of the government’s decision to privatize with the regression sample restricted to firm-years with positive EBITDA. Ln (Sales) is the natural logarithm of total sales; EBITDA is income before interest, taxes and depreciation; Wages is the firm’s total wage expenses. These variables are windsorized at the 5th and 95th percentiles, are as of 1990 in the probit regressions, and are lagged one year in the Cox analysis. GovtSeatShare is the proportion of seats in the federal parliamentary elections of 1991 won by the governing party and its allies from a state out of all the seats allocated to that state, where the state is determined by the location of the firm’s main operations; AbsSeatShareDifference is the absolute value of the difference between GovtSeatShare and the proportion of seats won by the main opposition party alliance. Heteroscedasticity-robust standard errors, clustered at the state level, are in parentheses. *, **, *** denote statistical significance at the 10, 5, and 1% level, respectively.
Estimation Method Probit Cox Proportional Hazard Sample Full EBITDA>0 (1) (2) (3) (4) (5) (6) Ln(Sales) 1.322*** 1.401*** 1.325*** 1.191*** 1.270*** 1.172*** (0.267) (0.279) (0.245) (0.186) (0.202) (0.192) EBITDA/Sales 7.046*** 6.773*** 6.860*** 4.000** 4.202*** 3.949** (1.645) (1.497) (1.569) (1.634) (1.466) (1.566) Wages/Sales -3.923*** -3.883*** -3.914*** -5.293*** -5.109*** -4.931** (1.019) (1.176) (1.223) (1.866) (1.840) (1.969) GovtSeatShare 1.112*** 1.194** (0.422) (0.464) AbsSeatShareDifference 1.504** 1.476** (0.601) (0.721) Constant -6.223*** -6.920*** -6.884*** (1.247) (1.337) (1.114) Industry Fixed-Effects Yes Yes Yes Yes Yes Yes Observations 141 141 141 547 547 547
35