the decline of venetian food stores as a gauge for social ...€¦ · the decline of venetian food...
TRANSCRIPT

The Decline of Venetian Food Stores as a Gauge for Social Change
in the City
An Interactive Qualifying Project Report submitted to the Faculty of WORCESTER POLYTECHNIC INSTITUTE
In partial fulfillment of the requirements for the Degree of Bachelor of Science
Project Center: Venice, Italy Term: B ‘06
Project Advisors: Scott Jiusto Fabio Carrera On-Site Liaison: Settemari Rowing Club Submitted by: Lesley Bright Sara Duran Stephen Parsons Luis M. Rodriguez Project website: http://users.wpi.edu/~sparsons/Venice_retail.html
0

Acknowledgments Although our names are the only ones on the cover page, our project was a collaborative effort between us and several people that ever so graciously volunteered their time in order to helps us. We would like to thank all of those persons without whom our project would not have been possible. Bepi and Steval for feeding us lunch most every day. Many thanks to the Settemari rowing club for allowing us to be part of their organization, if only for a few dinners. In particular we would like to thank the society’s helpful volunteers. Giamberto, for sharing the history of Dorsoduro with us, as well as letting us see his beautiful home. Sergio, for being so willing to share his “Mestre insights” with us. We would like to especially thank Umberto for going above and beyond. We owe most of the most valuable information we obtained to him. In particular, we would like to thank him for being the intermediary between our group and the various city offices we contacted. Chris Wayman, for inviting us into his home and for his eloquent insights and suggestions. Umberto, Giamberto and Sergio, for patiently teaching us how to row, an experience we will always cherish. Mario, for always being friendly and for sharing his photo collection with us. Wilma, for being so willing to help, for introducing us to Spritzes and for arranging the meeting with Luisa, who was such an excellent interviewee with so much interesting information to share. Daniela and Andrea, grazie mille for lending us a helping hand on more than one occasion and for being understanding. Last but not least, we would like to thank our advisors. Professor Jiusto for standing by our project through its change of focus, for his great ideas, for believing in the validity of perception, for his sense of humor, for his positive encouragement and for making us feel that we accomplished something special. Professor Fabio Carrera for his guidance, for being hard on us, for pushing us to the limit to make our project the best it could be and for being the voice of our documentary.
i

Abstract
This project explored various dimensions of change in the availability of food in Venice using a triangulated research method, with the purpose of developing a comprehensive understanding of the variables affecting the transformation of retail within the last fifty years. By contrasting and complementing empirical data in the form of charts, maps, and databases with the oral and written testimonies of Venetian citizens, a greater awareness of the existing dynamics was obtained and presented through a documentary video.
ii

Table of Contents Acknowledgments......................................................................................... i Abstract.......................................................................................................... ii Chapter 1: Introduction and Summary of Findings ............................... 1 Chapter 2: Background ............................................................................... 7
2.1 A Quick History of Venice ................................................................................................7 2.2 The Community of Venice ................................................................................................9 2.3 Large-Scale Tourist and Economic Developments ..........................................................11
2.3.1 Italian/Venetian Economy .......................................................................................11 2.3.2 Venetian Festivals and World Events........................................................................12
2.4 Related Research .............................................................................................................13 2.4.1 Evolution in city centre retailing: the case of Utrecht (1974-2003) ............................13 2.4.2 Consumer Disadvantage Case ...................................................................................14 2.4.3 The Venetian Dilemma.............................................................................................15
2.5 Commerce Departments of Venice .................................................................................16 2.6 Government Regulations Pertaining to Retail Change .....................................................17
2.6.1 General history of retail laws.....................................................................................17 2.6.2 Government Assistance for Stores............................................................................18
Chapter 3: Methodology ...........................................................................19 3.1 Developing and analyzing quantitative data .....................................................................20
3.1.1 Validating Previous WPI Store Data .........................................................................21 3.1.2 Gathering and organizing other relevant quantitative data.........................................21
3.2 Complementing quantitative data with qualitative data ..............................................21 3.2.1 Interviewing and Surveying local citizens ..................................................................22 3.2.2 Triangulation of Research .........................................................................................23
3.3 Compiling a video documentary ................................................................................23 Chapter 4: Results ......................................................................................25
4.1 The Development and Examination of Quantitative Data ...............................................25 4.1.1 Validation of Previous WPI Data..............................................................................25 4.1.2 The Gathering and Organization of Relevant Quantitative Data ...............................26
4.2 The Complementing of Quantitative Data with Qualitative Data ....................................32 4.2.1 Demographic information ........................................................................................32 4.2.2 Where Venetians shop for food ................................................................................34 4.2.3. Reasons why Venetians shop where they do ............................................................35 4.2.4 Shopping Convenience: Past and Present..................................................................36
Chapter 5: Analysis41..................................................................................37 5.1 Hypothesis 1: Tourism has overtaken food stores ...........................................................37 5.2 Hypothesis 2: Supermarkets drive out small food stores and are rejected by the population38 5.3 Hypothesis 3: Venetians prefer small food stores.............................................................38 5.4 Hypothesis 4: The aging Venetian population is inconvenienced .....................................38 5.5 Findings ..........................................................................................................................39
iii

Chapter 6: Conclusions and Recommendations ...................................41 6.1 Conclusions.....................................................................................................................41 6.2 Recommendations ...........................................................................................................42
6.2.1 Government Assistance ............................................................................................42 6.2.2 Methods of Tracking Retail Evolution ......................................................................43 6.2.3 Other Solutions ........................................................................................................43
Chapter 7: Bibliography ............................................................................44 Appendix A: Annotated Bibliography ....................................................46 Appendix B: English Survey.....................................................................48 Appendix C: Italian Survey.......................................................................49 Appendix D: List of Interviewees ...........................................................50 Appendix E: List of Useful Terms..........................................................51
iv

Table of Figures
Figure 1: All stores open today and stores that have closed and not reopened ................................ 4 Figure 2: Number of tourists per year in Venice from 1949 to 2005.................................................. 5 Figure 3: Population of Venice (Centro Storico) vs. the population of the mainland (terraferma) from 1871 to 2000 ...................................................................................................................................... 5 Figure 4: Most important factors for Venetians..................................................................................... 6 Figure 5: Gondolier and passenger wearing gas masks ......................................................................... 7 Figure 6: Piazzetta di San Marco under water, 4 November 1966 ...................................................... 8 Figure 7: The Comune di Venezia................................................................................................................ 9 Figure 8: Michela Scibilia and her sons.................................................................................................. 15 Figure 9: Danilo Palmieri outside his stand .......................................................................................... 15 Figure 10: Roberto D'Agostini, deputy mayor ..................................................................................... 16 Figure 11: Paolo Lanapoppi .................................................................................................................... 16 Figure 12: Map of Venice ........................................................................................................................ 20 Figure 13: Screen shot of '05 database................................................................................................... 25 Figure 14: All stores opened since approximately 1970...................................................................... 27 Figure 15: All stores currently open ....................................................................................................... 27 Figure 16: All stores open today and stores that have closed and not reopened ............................ 28 Figure 17: All food stores opened since approximately 1970 ............................................................ 29 Figure 18: All food stores currently open.............................................................................................. 29 Figure 19: All food stores today and food stores that have closed and not reopened ................... 30 Figure 20: Population of Venice (Centro Storico) vs. the population of the mainland (terraferma) from 1871 to 2000 .................................................................................................................................... 31 Figure 21: Number of tourists per year in Venice from 1949 to 2005 ............................................. 32 Figure 22: Frequency of use of supermarkets or small stores by Venetian citizens ....................... 34 Figure 23: Types of stores that Venetians can or cannot easily access to buy their food: small stores vs. supermarkets........................................................................................................................................ 35 Figure 24: Most important factors for Venetians................................................................................. 35 Figure 25: Convenience level of shopping for food in Venice .......................................................... 36 Figure 26: How food shopping in Venice compares today to the past ............................................ 36
v

Table of Tables Table 1: Stores in S. Elena in 1950 and 2006........................................................................................ 10 Table 2: Sestieri of residence breakdown .............................................................................................. 33 Table 3: Age breakdown .......................................................................................................................... 33
vi

Chapter 1: Introduction and Summary of Findings
Whereas tourism is a powerful driver of many countries’ economies, in many Italian cities it has come to be scorned as a plague- at times alienating the population from its own home. Every year over 34 million tourists visit Italy.3 However, Italy is not the only European country affected by tourism. In the European Union, the tourism core business is conducted by over two million enterprises, mostly of small and medium sizes.4 To top off the fact that over half of the people in Italy during the year are tourists, the masses are not projected to get any smaller. Most of Europe is also struggling with an ever aging populace and shrinking birth rate, and Italy’s numbers top many other countries in the charts. In Italy, there has been an eight percent growth in people over the age of 64 over the last 20 years, the fertility rate is down to 1.2 children per mother, and the expected growth in population is a mere 0.07% per year.3 In many cases the situation is like a double-edged sword, where on one side the population is on some level feeling displaced by the seemingly endless stream of tourists, while on the other side many have come to depend on it for their livelihood. The situation in Venice is a prime example of what happens when all of these factors collide.
“Venice is dying. Again. In 1966 it was images of a submerged city that horrified the world; this time it is not death by drowning that is feared but death by desertion” 1
“This lordly city, which once dominated the Mediterranean world, faces an expensive, complicated struggle to escape physical and economic decadence and reduction to the status of a museum” (Doty, Robert C)
–New Statesman, 24 January 1997 -New York Times, 23 May 1965 “[T]oday a rising tide of troubles is more likely to swamp the city. . . Businesses have moved out; the population has shrunk over the past 30 years from 138,000 to a mere 70,000…” 2
“Should the trend continue, newspapers fretted recently, by 2030, authentic Venetians could disappear here and the historic center could be reduced to a shell subsisting only on tourism” (Provoledo, Elizabeta)
–National Geographic, February 1995 -New York Times, 1 October 2006 “Venice is on course to become a city virtually without residents within the next 30 years, turning it into a sort of Disneyland - teeming with holidaymakers but devoid of inhabitants” (Hooper, John)
“As Venice becomes a tourist-oriented Disneyland, a common belief among the locals is that even if the city survives as a physical entity, emigration to the mainland, where two-thirds of Venetians already live, will eventually put an end to the traditional Venetian way of life” 5–The Guardian, 26 August 2006 –Royal Geographical, July 2000
1 Paula Weideger., “Death or Transfiguration?”, The New Statesman, January (1997), <http://www.jstor.org/> (20 October 2006). 2 Erla Zwingle, “Venice More Than a Dream,” National Geographic 187, no. 2 (1995), <http://www.jstor.org/> (20 October 2006) 3 Nation Master, <www.nationmaster.com> (21 September 2006). 4 European Travel and Tourist Action Group < http://www.etag-euro.org/ > (21 September 2006). 5 Roderick Conway Moris, "The Rise and Fall of Venice," Royal Geographic. July (2000), <http://www.jstor.org/> (20 October 2006).
1

There is no lack of newspaper clippings, scholarly articles, books, or documentaries that
speak of the Italian city’s demise. It has been a topic of conversation for decades, centuries according to some. Yet after so many years, Venice is still here. Venice is exceptional, without a doubt; the unique physical structure of Venice has allowed it to remain somewhat frozen in time. And although somewhat unwittingly, it is this museum-like quality that attracts an exceptionally large number of visitors to its beautiful neighborhoods, as it has done for centuries. So yes, more than a millennium after it was founded, and centuries after the grand Republic of Venice finally fell to the French in 1797, the city remains, but the condition of its existence is debatable. All of the visible splendors in the world, however, do not change the fact that it is still (arguably) a living, breathing city, and one with real crises at hand. Sightseers often forget that the city they visit, although emptier than before, is still home to about 60,000 Venetians trying to exist normally in a place that they are obliged to share with the world. The declining population, coupled with the island’s small area, makes the steady flow of tourists even more concentrated and overwhelming. Both national and local newspapers will periodically write articles on the city’s dilemmas, citing cries of outrage among its citizens about the tourist epidemic, the high price of living, and numerous other issues. It would seem that troubles are always in the back of people’s minds. While many give their support to the city, the drastic changes in the commercial market in Venice are not usually the first thing to be taken into account. Efforts have been made in many parts of the city to keep its architecture and history from deteriorating. These are great for the physical structure, the façade of the city, but more people are realizing that it is the citizens of Venice that need help. Nobody wants to see a city so rich with history and beauty lose the people who are such a vital part of it.
Awareness of store closures has also come in the form of intermittent newspaper articles. These would generally appear on the front page, with dramatic titles that run along the lines of “Another Store Closed! (Insert generic angry comment)” or “If trends continue like this, in less than fifty years Venice is dead”. In the past, these would be clear and consistent indicators of the restless sentiments toward the steady transformation of the city. However, in more recent years, the number and prominence of articles documenting store closures has decreased. The reasons for this are uncertain, but it does seem to indicate that after so many years of closures, people (or at least the writers) have become indifferent.
Fortunately, groups are becoming more aware of this problem; there have been several studies already conducted on the issues affecting the citizens’ daily lives. The store transformations, in particular have been the focus of research done by Worcester Polytechnic Institute students for two years. Through their efforts, there are now databases filled with population and census information, maps laying out the city’s retail, residential, and tourist areas as well as some information about store histories. Their intent was to catalog the changes in retail over the years in order to find exactly how much the basic necessity stores have been becoming endangered. They explored stores and their histories, population demographics, and created a rough “comfort index” to statistically determine the convenience with which Venice’s citizens could shop for retail goods. . Also, the City of Venice has its own version of a cataloging system for store which we used to compare with the oral recollections. Because they have had to regulate and keep track of the licenses for opening stores, their records have information for the opening dates for shops since 1970. The details of these are described further in the report.
Even though there is some consciousness and past research on this topic, not enough has been done. Because of time constraints for previous projects, the evolution of the retail sector has
2

not been gathered for all six of Venice’s districts, or sestieri. In the mean time, food stores are still closing and leaving either a tourist shop or nothing in its place. This is where our team was called in to continue the task. Up until we began our field-work, most groups had only collected empirical data in order to determine a)which types of stores are currently available to citizens, b)how these stores have changed over time, and c)how the comfort level (of shopping for various items) of Venetians has changed over time. After using the previously established comfort index as a reference, weighing the age and transportation factors, we were left to assume that having one’s groceries a short distance away was of utmost importance to a person living in Venice. However, we came to believe that the whole story was not being told. As we spoke with residents, shopkeepers, and local experts, we were exposed to a more complex scenario than we originally envisioned. This is how our project’s focus emerged. At the beginning of our endeavors, we had a series of impromptu hypotheses and suppositions about the relationships between factors, many of which were either invalidated or proven more complicated. The following were our major theories:
1. Tourism has overtaken food shops 2. The aging population is inconvenienced by the food situation 3. Supermarkets drive out the small stores and are rejected by the general population 4. People prefer small stores
While it was these hypotheses that guided us in the beginning of our on-site research, the discoveries we made kept shifting the purpose of our project. Originally, we wished to simply compile an oral record of the Venetians’ perceived changes in the retail sector. These records were to be compared with the currently available data on the evolution of the retail sector. After acknowledging the sheer complexity of the transformations, we decided it was important to better understand the different dimensions involved.
Thus, the objective of our project became: to develop a rich, multidimensional understanding of the dynamics of the retail sector in Venice and how the effects of its transformation have been perceived by the local shopkeepers and citizens. The explicit objectives that we developed to achieve this goal are listed here:
• To develop and analyze quantitative data in order to understand how store evolutions relate
to tourism, population change, and other cultural variables • To complement quantitative with qualitative data in order to create a more holistic picture of
the effects of retail change in Venice by a) Interviewing locals b) Triangulation of research
• To compile a video documentary to use as a medium through which our research findings can be articulated
A great part of our project was based on the tenets of triangulation in research, a theory by which we could plausibly analyze and integrate both quantitative and qualitative data in the absence of adequate time and resources. So while independently our analysis of the limited qualitative data acquired may not merit much validity in the social science world, it is through the triangulation, or
3

complementing of various methods and information types with this qualitative data that our study draws its strength.
As previously mentioned, two previous Interactive Qualifying Project (IQP) groups had already done research on the subject of our project. Through their efforts, there are now databases filled with population and census information, maps laying out the city’s retail, residential, and tourist areas as well as some information about store histories. In order to verify the reliability of previously collected store histories, we repeated a sample of the neighborhood walkthroughs used to obtain the prior results. This method consisted of systematically going through a neighborhood with one of its residents (preferably someone who’s lived there for over 25 years) as they dictated to us any changes in retail that they could remember; what each store used to be and the dates of any openings/closings they could remember. For our purposes, we also requested an account how the developments had personally affected them.
As an additional source of validation, we requested databases of store records from city
offices such as the Camera di Commercio di Venezia and the Comune di Venezia. The latter provided us with the most useful store database. It listed all addresses that had been issued a commercial license since about 1970 as well as what type of shop each location housed at each time. An example of one of the maps we created using this database in conjunction with MapInfo can be seen in Figure 1. The blue dots represent all stores open today, while the red dots pinpoint locations that used to house stores but that no longer do. We also created similar maps for food stores. These maps created a visual and effective medium through which we could effectively depict the evolution of retail in the city.
Figure 1: All stores open today (blue) and stores that have closed and not reopened (red)
We conducted additional research on quantitatively assessable factors which we thought
could affect Venice’s retail sector. We obtained tourism databases from the Città di Venezia website that enabled us to create a graph representing the number of visitors to island from 1950 to 2005 (see Figure 21). We also studied the change in population in both the historic center of Venice and
4

on the mainland through another set of graphs (e.g. Figure 20). These graphs were created using data we obtained from city’s Statistical Office.
0
200,000
400,000
600,000
800,000
1,000,000
1,200,000
1,400,000
1,600,000
1,800,000
2,000,000
1949
1951
1953
1955
1957
1959
1961
1963
1965
1967
1969
1971
1973
1975
1977
1979
1981
1983
1985
1987
1989
1991
1993
1995
1997
1999
2001
2003
2005
Figure 2: Number of tourists per year in Venice from 1949 to 20056
0
50000
100000
150000
200000
250000
1871
1901
1921
1936
1952
1954
1956
1958
1960
1962
1964
1966
1968
1970
1972
1974
1976
1978
1980
1982
1984
1986
1988
1990
1992
1994
1996
1998
2000
Centro StoricoTerraferma
Figure 3: Population of Venice (Centro Storico) vs. the population of the mainland (terraferma) from 1871 to 20007
6 Città di Venezia, <http://www.comune.venezia.it/flex/cm/pages/ServeBLOB.php/L/IT/IDPagina/1523> 7 Città di Venezia, “Serie Storica della Popolazione Residente nel Comune di Venezia”. Informazioni Statistiche. Anuario 2000. (Servizio Statistica e Ricerca. Sistema Statistico Nazionale, 2001), p. IX
5

In order to do bring another dimension to our research we also collected qualitative data. This data was collected in the form of surveys and interviews from several Venetians. We distributed our surveys (see Appendix C: Italian Survey) to a total of 58 local citizens. Through these we attempted to answer three major questions:
• Where do Venetians shop?
Quality30%
Variety23%
Price27%
Distance14%
Personal6%
• Why do Venetians shop where they do?
• How convenient is it for them to shop?
Once we had collected all of the results, we produced graphs (e.g. Figure 24) that enabled us to visually analyze the results and draw educated deductions.
Figure 4: Most important factors for Venetians when choosing a food store to shop at
Lastly, through interviews with local citizens, we compiled the perceived changes and
complemented the empirical data that showed concrete changes. The decision was made to illustrate our findings in the form of a short film. Our film is intended to present the different issues that we were confronted with and to offer our interpretation of the situation. It aims to illustrate how much of an issue the inability to obtain food actually is to the people, while offering a more lucid understanding of change in the retail sector.
Although time constraints finally obligated us to cease research and begin preparing results,
we were able to recognize that the matter of retail change is incredibly dynamic. We began our undertaking by reflecting over how people complained about the changes in their city through the newspapers, and how consequently store closures must be affecting them greatly. What we came to find is that although people were indeed upset by the drastic transformations that have befallen their neighborhoods, small store closures were not the only concern (or even necessarily a primary one). The connections between basic necessity stores and other greater problems were intricate and at times, startling. Population loss, housing, politics, employment, and even Chinese organized crime all surfaced (although the last was only one particular resident’s conspiracy theory) as issues that either affected or were affected by the small stores. It was even suggested that because of its focal relationship to so many issues, the status of retail in Venice should be considered a way to gauge the condition of other more complicated matters. The evidence that we have found indicates that this may not be an implausible idea, and maybe one that should be investigated further. We suggest possible solutions to many of the problems and issues that we describe and recommend potential steps for follow-through. More importantly, we hope that through our groundwork, other researchers can have a better basis through which they can approach the many issues affecting the inhabitants of the city.
6

Chapter 2: Background This chapter is intended to give readers a foundation for some of the topics that will be covered at some point within the context of this report. Included in these topics are brief overviews of the following:
• Relevant Venetian history • The geopolitical constraints of the Venetian province • Tourism in Venice and greater Italy • Research that was used as a reference for our own methods • Relevant city agencies that served as sources of data and information • Important legislation that affects retail within the scope of our research
While each section provides only an introduction of the topics, the purpose is to form a basis by which later discussions or references can be better understood.
2.1 A Quick History of Venice
The 15th century saw the height of Venetian power. During this time, Venice attained the class of a nation, comparable to countries such as England, Austria and France9. This century, coinciding with the early Renaissance, was one of artistic splendor. The finishing of the Basilica di San Marco, the Campanile and the Doge’s Palace are further signs of the magnificence of this period10. Venice’s government was admired all over the known world. While the rest of Italy was run by totalitarian regimes, Venice, partly due to its constitution, remained a strong Republic11.
Figure 5: Gondolier and
passenger wearing gas masks8
8 Margaret Plant, Venice Fragile City (New Haven: Yale University Press, 2002), 312. 9 John Julius Norwich, A History of Venice (New York: Random House Inc. , May 1989), 280. 10 Norwich, A History of Venice, 280-281. 11 Ibid., 282.
7

The situation is quite different for the time frame that pertains to our project. The Second World War ended in 1945,13 shortly after the fall of the fascist regime in 194314. After years of repression, Venice expressed its new found freedom with the return of the Biennale, a celebration of culture and art containing five separate festivals, in 194815. The end of the war also meant the return of tourism16. After a long period of absence, the infusion of revenue from the new surge of visitors was probably very welcome. The city was later faced with a different type of flood on November 3rd 1966. Venice was inundated with over two meters of water that remained stagnant for twenty hours17 and caused considerable damage. Many people consider this one of the most concrete turning points for the depopulation of Venice, a phenomenon which will be described further in another section. Historically, Venice has always been a city that draws attention to itself. The fact that the “Golden Days” of Venetian society were long gone was a well known fact, and the likelihood of another “renaissance” was talked about but not necessarily expected. After the Great Flood of 1966 however, the possibility that the actual structure of the city might be in danger of vanishing forever triggered a rush of international agencies and groups to come to the rescue. The focus of everyone’s interest became to restore and preserve the physical beauty of this majestic city. Suddenly, many people wanted to go appreciate the city “just in case it wasn’t there the next day”. Unfortunately, with increased concern for the material state of the city, very few have taken care to protect the destiny of those who still call Venice home.
Figure 6: Piazzetta di San Marco under water,
4 November 196612
12 Plant, Venice Fragile City, 356. 13 Ibid., 311. 14 Idem. 15 Ibid., 317. 16Ibid., 319. 17Ibid., 356.
8

2.2 The Community of Venice
When people speak of the City of Venice, few outside of the region know that politically, it comprises more than just the main conglomerate of islands, and even those that know of the island are not always aware that it is divided within itself. As seen in Figure 7, the Comune di Venezia is the region consisting of the Historical Center (the main island), the Estuary (includes the Lido and all other islands), and the Mainland (the town of Mestre and industrial Porto Marghera). All three regions are grouped and governed within one political category, with one mayor responsible for the entire area. Recognizing this distinction is essential for several reasons. For example, because the area under study is not independent, many laws that affect the commercial dynamics of the island were not tailored to consider the special characteristics of the Historical Center. This could be particularly relevant when regarding the laws that may have affected basic necessities stores over the years. Also, much of the data that are available through the statistical offices of the city were difficult to apply toward our purposes because the datasets synthesized information from all three regions, whereas we required the data for the historical center exclusively. Politics aside, acquaintance with the mainland areas is functional because of their close relationship with and influence on the historical center’s functions.
Figure 7: The Comune di Venezia18
The city of Venice is divided into six sestieri, or districts. The six sestieri are Cannaregio, Castello, Dorsoduro, Santa Croce, San Marco, and San Polo. Each of these sestieri is different demographically and therefore the citizens of each sestiere are affected differently when it comes to food shopping. While due to time constraints we were not able to analyze the changes in all of the city’s neighborhoods in great detail, our research did expose us to them to some degree. Therefore, we found it appropriate to describe each neighborhood briefly along with any information that might help to better put them into the context of our project.
18 Photograph (photo?) by John Brunton. “Rise and Fall of Venice”Royal Geographical Society.
9

Cannaregio is Venice’s second largest sestiere. Its name most likely derives from the phrase Canal Regio, signifying that it is the main canal, or connection, to the mainland.20 The connection probably refers to the train station, located there. It is also recognized as the place where most ordinary Venetians live. Although the population throughout Venice has been decreasing throughout the recent decades, Cannaregio seems to have staved off some of this decline. In fact, from 1981 to 1991, the population increased from 19,846 to 20,623. However, the population has continued its decline since that point and in 2005 was at 17,108. The number of stores in Cannaregio decreased significantly, out of tune with the slight population decline in the area. The number of bread, fish fruit and meat stores has fallen from 291 in 1971 to 84 in 2005.21 Although the accessibility to stores is decreasing, Cannaregio seems to be doing better in this regard than other sestieri.
Castello is Venice's largest sestiere,
extending from the Rialto to Sant'Elena at eastern trip of the city. Its name is believed to derive from a fortress on the island of San Pietro, one of the earliest inhabited sites in the lagoon. A sestiere of two very different halves, Castello's grander northern and western area, around Santi Giovanni e Paolo and San Zaccaria, was closely linked with the centres of power, while the districts around the Arsenale to the east were home to Venice's most important industries. This was one of the earliest parts of Venice to be settled (5th to 6th centuries). Some of our interviewees are residents of this neighborhood. More than one person explained that the changes that have occurred in Sant’Elena’s stores have been sweeping. Table 1 is depicts the anecdotal change that one such interviewee recollected. Because of its proximity to the highly-trafficked sestiere of San Marco, the other half of Castello has less of an exclusively residential feel to it. The Bridge of Sighs marks the border between the sestieri of San Marco and Castello, so the quaint Museo Diocesano di Arte Sacra and stately San Zaccaria although closely associated with San Marco, actually belong to Castello.
Number in 1950 Number in 2006Population 4500 2500
Store ----- ----- Fruit and Vegetable 7 - Furnace (bread maker) 3 1* Food coop 1 1* General Food Store 3 1* Fresh Pasta 1 - Barber 2 - Florist 1 - Shoe repair 1 - Fish Vendor 2 - Carpenter 2 - Doctor 3 - Hair stylist 2 - Farmacy 1 1 Cleaning materials 3 - Tabacco 2 2 Haberdashery 4 - Deli 1 1* Bar 3 2 Milk and dairy 2 - News stand 1 - Restaurants 2 2 Pizzeria 1 - Butcher 2 1 Carabinieri office - 1 Hotel - 1 Post office - 1 Dry cleaners - 1 * Same store
Table 1: Stores in S. Elena in 1950 and 200619
Dorsoduro occupies the southern portion of Venice and is one of the most favored areas among foreigners. It gives a much quieter impression than other sestieri and exudes a tranquil charm. Its
19 Anecdotal. Interview with Wilma Barbieri 20 Suitecom. “Venice’s Six Sestieri”,2000, <http://www.veniceclick.net/Guide/Sestieri-Venice.htm> (19 September 2006) 21 Danielle Modeste, Freddy Jervis, Ta Karra Greene, and Benjamin Isabella, Residential Comfort Level: An Analysis of the Venetian Retail Sector (Worcester Polytechnic Institute, 2005),
10

popularity among visitors, however, does not reflect its appeal towards residential living. In 2005, Dorsoduro’s had an estimated population of 6,70022. Despite the fact that Cannaregio is larger than Dorsoduro, the latter is far less densely populated. Santa Croce is the easternmost neighborhood of the city, and home to the only place on the island with cars. The Piazzale Roma bus station, located there, is the only other physical link to the mainland and allows busses to drop a surplus of people onto the city. The area in Santa Croce is highly mixed, consisting of both residential and tourist areas. Our project does not focus much on this particular region of the island. San Marco is probably the most trafficked and recognizable area of the city. It is home to the famous Saint Mark’s Basilica, as well as one side of the Rialto Bridge. Now mostly overrun by tourist shops, at one time it was the heart of the city and the location of the seat of government. Few people actually live in the neighborhood, and conveniently-priced amenities are limited. San Polo is the sestiere with the smallest area. “In this district it was customary to 'live over the shop', i.e. dwellings and workplaces were often combined. . . This sestiere runs to the east of the Rio di San Polo to the Rialto. San Polo has been the liveliest quarter of Venice since the 11th century when it became the center for the city's markets, when the market was moved here from Campo San Bartolomeo.” Although it has the tourist pressure from the Rialto Bridge, San Polo also houses the Rialto Food Market, a large, open-air cluster of stands that sell fruit, vegetables, fish and meat that caters mostly to the citizens of the city. It is not unheard of for people from the mainland to travel to this location just to get their produce and fish. The market at the Rialto is one of the few places on the island where high-quality ingredients can still be purchased at a decent price; a symbolic bastion for the permanence of traditional Venetian life.
2.3 Large-Scale Tourist and Economic Developments Before attempting to understand the dynamics of change in the retail sector of Venice,
several basic pieces of the foundation must be acknowledged. One major issue to look at is large scale tourism/economic movements. For the purpose of our project we will not use such events in our analysis, but it is important to have a general knowledge of any economic recessions or booms as well as major events such as festivals, Olympics, and so forth that were hosted. These events leave an impression on the economy and affect the number of tourists who visit the city.
2.3.1 Italian/Venetian Economy
Information about the changing economic state of Italy as a whole gives valuable insight on the way to comprehending specific retail trends in the cities. Since World War II, Italy has shifted from having a largely agriculturally-based economy to an industrial one. It is now the world’s sixth largest market economy23. Because Italy is not very well-suited for farming it has to import food as well as natural resources used for industry. Venice, because it is an island, consumes doubly-imported goods: once from outside the country and once again from the mainland to the shops in the city. Italy’s economy is also largely affected by all of the street vendors, which create a “large
22 Modeste, Jarvis, Greene and Isabella, Residential Comfort 23 US Department of State, <http://www.state.gov/r/pa/ei/bgn/4033.htm > (20 September 2006)
11

underground economy”. Almost 27% of Italy’s gross domestic product is not accounted for due to lack of taxation24. In Venice, street vendors can be seen at almost all of the major walkways between the popular sites. Accordingly, it can be assumed that this activity does not contribute to the city’s well-being.
Naturally, goods will be more expensive in places where there is a lot of tourism. In Venice
though, tourism is rampant. This makes everything more expensive for Venetians. While commodities were originally pricey relative to the mainland, the high cost of goods was magnified in 2002 when the Euro was adopted. The adoption of the euro in 2002 has had a large effect on many European countries, including Italy’s. When Italy switched from the lira to the euro prices increased drastically. Venetians already had to travel quite a distance for primary goods, but since the implementation of the Euro they have been forced to travel even farther to find affordable goods.
2.3.2 Venetian Festivals and World Events
Italy is rich in tradition and there is no lack of it in Venice. Every year it hosts many festivals and internationally attended events. All of these attract additional tourists from all over the world. Also, towns will spend extra money building new edifices and cleaning up their cities in order to make a good impression. Every year since 1932 Venice has held the Venice Film Festival, the oldest film festival still running today. This fair attracts hoards of people to behold the movies along with the actors and actresses starring in them. The film festival is only one of five festivals held during the end of the summer as part of the “Biennale di Venezia”, a century-old celebration of culture and art.
The biggest and most famous (or infamous) of the Venetian events is the Carnevale, or
Carnival. Carnival is a two week long festival that runs every year up until the Tuesday before Ash Wednesday. Historically, the purpose of Carnival (also known as Fat Tuesday, or Mardi Gras) was to use up all of the meat, eggs, and butter before lent. In Venice it began in 1162, after the Republic of Venice defeated the Patriarch of Aquileia. The first use of masks during carnival was documented in the year 1268. The peak of Carnival was reached during the 1700’s and then declined during Mussolini’s dictatorship, roughly 1930. Carnival was revived in 1979 and today attracts hundreds of thousands of tourists to Venice. The traditional Venetian masks were made famous during carnival and are one of the most popular souvenirs for tourists all year round.25
Along with these Venice-specific festivals, the country of Italy has also sponsored many
major sporting events that attracted an exceptional amount of tourists to all of its cities. Rome played host to the summer Olympics in 1960, as did the city of Turin, who hosted the 20th winter Olympics in 2006. Italy also held the World Cup in 1942 and 1990. Not only have these occasions brought a lot of money to Italy, but they have helped it keep its place as a top tourist destination. Italy is not an enormous country, and this facilitates quick and relatively inexpensive travel between sites. Hence any large event that draws large crowds to one city in Italy can be expected to lure some part of the flow into other areas, such as Venice.
24 US Department of State, <http://www.state.gov/r/pa/ei/bgn/4033.htm> (20 September 2006) 25 “Venice Carnival”, <http://www.visitvenice.co.uk/venice-carnival.html> (4 December 2006)
12

2.4 Related Research As guidance for our own project, we researched other studies pertaining to either retail or Venice. The three following studies were used to inform our methodology.
2.4.1 Evolution in city centre retailing: the case of Utrecht (1974-2003)26
When looking at the evolution of retail in Venice and the people’s perception of the changes
it is important to look at related research on the topic to see what has been done in similar situations. Because of Venice’s very unique geographic layout, it is difficult to relate previous research to Venice. However, previous case studies will give us a model of how to complete our research and give us ideas on how to solve any potential problems.
“Evolution in city centre retailing: the case of Utrecht (1974-2003)” is one such article
focusing on urban change and retail evolution. This article focuses on the city centre of Utrecht, in the Netherlands. The authors of the article reconstructed the history of the stores on the 45 commercial streets in the city centre containing. The data collected was used to find the annual number of shops, the annual sector variety, and the rise and fall of sectors over the given period of time. A system to determine the entropy of stores in each sector was then used to locate areas with greater and lesser retail diversity.
Their findings showed that over the 30 years studied the number of shops in the city centre
has remained consistent. There was a shift in the types of stores, from daily goods to more recreational goods. The results also revealed that the variety of stores in the centre of Utrecht has diminished. Shops selling recreational goods (clothing, accessories, footwear, gift shops, toy stores, etc.) have replaced many shops selling food, drink, flowers, plants, and pets.
Even though the amount of variety has slightly diminished the number of stores has stayed
fairly consistent. One possible explanation for this is a system used by the Dutch government placing strict restrictions on the types of large retail stores allowed to open in the areas just outside of the city centre. Only retailers selling cars, boats, furniture, “Do-It-Yourself” products, and building materials are allowed to open directly outside of the centre. These restrictions were implemented in 1973 and have prevented large super markets from opening and therefore keeping a need for the small-scale grocers, butchers, and bakers in the city centre. So far this plan has been relatively successful. In 1993 this policy was altered to allow stores with more than 1500 square meters of floor space to open up in the outlying areas of the city centre. So far only 13 of these stores have opened, but this new plan threatens the retailing in the city centre.
This article is pertinent to the situation in Venice and the research we would like to conduct.
The Venetians are concerned with the issue of the loss of daily goods stores in their city. These stores are being replaced by tourist or other recreational shops or are closed all together. Many large supermarkets are opening on the mainland, but it is difficult for Venetians to access these stores.
26 Atzema, Oedzge. and Frenken, Koen. and Jesse Weltevreden. 2005. Evolution in city centre retailing: the case of Utrecht (1974-2003). International Journal of Retail and Distribution Management. Vol 33. Issue 11. 824-841. (accessed September 24, 2006)
13

2.4.2 Consumer Disadvantage Case
Our objectives aim to cover not only a historical perspective on the changing retail situation in Venice, but also to use qualitative interview methods in order to determine the citizens’ attitudes, thoughts, and suggestions about the situation. While the Utrecht Case may have provided insights for the evolutionary element of our approach, another example from Great Britain helps define some of the missing components.
“Rethinking consumer disadvantage: the importance of qualitative research” fills many of the
methodological gaps that the previous case study left open. Surprisingly, it realizes these in a similar context to that of our project. Lucy Woodlife, the author, aspired to make connections between the behaviors and attitudes of disadvantaged consumers and the causes of the disadvantage in the town of Southampton. Specifically, the investigation focused on grocery accessibility. To find the connections, she carried out a series of interviews with ten subjects over a period of four weeks, instructing them to keep a “a four week diary survey to measure accessibility quantitatively, and semistructured interviews to collect qualitative data relating to an individual’s attitudes and expectations.” 27 Woodlife then used the major themes and points from the post-shopping interviews to complement other quantitative data that was collected.
Our project’s purpose is to lay the groundwork for future research on the subject of
Venetian retail and Woodlife’s article bestows support through precedent for our approach and methods. The clear format through which Woodlife’s article addressed her tactics is constructive to our mission because we can use the general outline to setting and confronting our own objectives. We drew the following key steps from her article:
1. Assess the complexity of the problem 2. Identify and declare dimensional goals within the larger problem 3. Justify the project’s rationalization with relation to the goals 4. Identify, dissect, and present hypothesis/hypotheses 5. Pose research questions to highlight objectives and focus study 6. Identify dimensional scope of research 7. Rationalize scope of research 8. Develop and present methods 9. Justify and explain methods 10. Interpret results
These steps are not explicitly stated in the article, but rather have been extracted and
generalized from the author’s description of the study. We have tried to reference these as guidelines when setting our own methods.
The case, which deals with grocery accessibility, also has a focus area similar to that of our
own project. Moreover, the author tackled her problem through a multi-pronged strategy, a research technique that we plan to pursue. “This mixed methodology approach, combining quantitative and
27 Lucy Woodlife, Rethinking consumer disadvantage: the importance of qualitative research, International Journal of Retail & Distribution Management, 2004. 523-531
14
qualitative approaches, is in keeping with some of the more recent research on disadvantage.”27 These factors give the content of the article great reference value for our purposes.
One of the most notable aspects of the study in this article is that like our project, it too was
performed under the presupposition that it was experimental and exploratory in nature. She very directly reminds the reader of the “exploratory nature of [the] paper, and the small sample size” and states that “the discussion does not therefore seek to present conclusive results, rather to highlight issues which may merit further investigation and confirmation.”27 While the author recognizes the lack of empirical validity of the size and scope of the study, she is still able to obtain convincing results. Due to the temporal limitations of our project, we will not be able to conduct data collection and analysis in an exhaustive and statistically appropriate fashion. What the example from Woodlife’s article shows however, is that the results from a short, well-structured, trial can still be very valuable as a basis for further research.
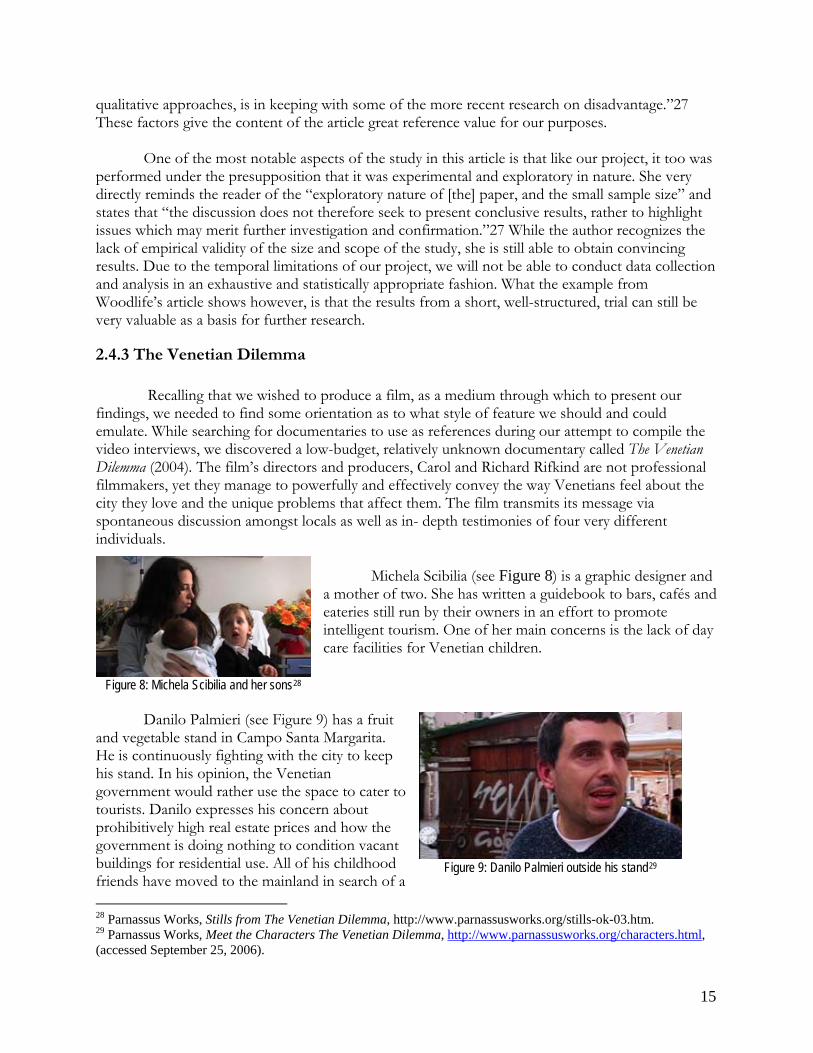
2.4.3 The Venetian Dilemma Recalling that we wished to produce a film, as a medium through which to present our findings, we needed to find some orientation as to what style of feature we should and could emulate. While searching for documentaries to use as references during our attempt to compile the video interviews, we discovered a low-budget, relatively unknown documentary called The Venetian Dilemma (2004). The film’s directors and producers, Carol and Richard Rifkind are not professional filmmakers, yet they manage to powerfully and effectively convey the way Venetians feel about the city they love and the unique problems that affect them. The film transmits its message via spontaneous discussion amongst locals as well as in- depth testimonies of four very different individuals.
Michela Scibilia (see Figure 8) is a graphic designer and a mother of two. She has written a guidebook to bars, cafés and eateries still run by their owners in an effort to promote intelligent tourism. One of her main concerns is the lack of day care facilities for Venetian children.
Figure 8: Michela Scibilia and her sons28
Danilo Palmieri (see Figure 9) has a fruit and vegetable stand in Campo Santa Margarita. He is continuously fighting with the city to keep his stand. In his opinion, the Venetian government would rather use the space to cater to tourists. Danilo expresses his concern about prohibitively high real estate prices and how the government is doing nothing to condition vacant buildings for residential use. All of his childhood friends have moved to the mainland in search of a
Figure 9: Danilo Palmieri outside his stand29
28 Parnassus Works, Stills from The Venetian Dilemma, http://www.parnassusworks.org/stills-ok-03.htm. 29 Parnassus Works, Meet the Characters The Venetian Dilemma, http://www.parnassusworks.org/characters.html, (accessed September 25, 2006).
15

more comfortable life but he remains in Venice where both his belongings and his heart are.
Roberto D’Agostini is the deputy mayor for strategic planning for the city of Venice. His department has various plans to modernize and revitalize the city including the construction of an underwater subway connecting Venice to the mainland, the redevelopment of Arsenale, the expansion of the university, the construction of a convention center and of cruise boat and ferry terminals. The most controversial of all these measures by far is the prospective underwater subway. The locals do not think this will benefit them. They
believe it will be used against them, increasing the number of day visitors to the city.
Figure 10: Roberto D'Agostini, deputy mayor30
Paolo Lanapoppi is a writer that moved back to Venice after living abroad for twenty years. His main concern is moto ondoso, that is, the structural damage caused by the waves produced by large motor boats. He is also fighting the implementation of the underwater metro.
Both the simple approach that the producers took in compiling this film, and the efficiency through which they conveyed their message on a relatively small budget, reinforced our ambitions to produce a piece of our own. Figure 11: Paolo Lanapoppi31
2.5 Commerce Departments of Venice32
In Venice, all stores are regulated by several different government agencies. In a city where street vendors, outdoor markets, and tourist shops are widespread it is important to control what types of stores open and where they open. Three different examples of these governing bodies are the Camera di Commercio di Venezia, the Comune di Venezia (sometimes referred to as the Municipio), and CONFCommercio.
The Comune di Venezia handles all laws relating to stores and regulates what stores can open and where they can open. They control the licensing process and other laws pertaining to protected areas and government assistance. The Commune also holds all of the store records and distributes statistics dealing with retail. The Camera di Commercio di Venezia is the main organization that manages stores and restuarants/bars. All businesses except for professional agencies (doctors, attorneys, architects, etc.) need to register with this organization. When a new business wants to open or expand they need to
30 Parnassus Works, Stills from The Venetian Dilemma, http://www.parnassusworks.org/stills-ok-03.htm, (accessed September 25, 2006). 31 Parnassus Works, Meet the Characters The Venetian Dilemma, http://www.parnassusworks.org/characters.html, (accessed September 25, 2006). 32 Information extracted from interviews with Sabrina Zancarello and Luca Destro, city officials working in the Comune di Venezia and the Statistics Office of the Camera di Commercio respectively
16

go through the Camera di Commercio. In one sense, Comune di Venezia sets the laws while the Camera di Commercio ensures that businesses abide by the commercial ones. CONFCommercio is an example of a membership-based organization that informs stores of law changes and new regulations. Many of the shops around Venice will have a CONFCommercio certificate hanging visibly inside or will have an adhesive label fixed on the window or door. When a store is registered with CONFCommercio it gives the store a certain degree of accreditation. Buyers know that if a store is a member of this association the store is reputable and held accountable for its quality. Because it is only one of several agencies that serve this purpose, and because membership is optional, we were not able to obtain adequate information comprising the entirety of basic necessity stores in the market.
2.6 Government Regulations Pertaining to Retail Change When studying the history of retail in Venice, it is important to have a working knowledge of the laws affecting it. In order collect this valuable information we visited both the Camera di Commercio and the Comune di Venezia. A summary of our findings is outlined in the following sections.
2.6.1 General history of retail laws
The retail sector of Venice is greatly affected by the many laws that govern it. As the laws have been changing, so have the stores. Up until 1971 the system in which licenses for stores were issued was very informal. The city issued these licenses and the stores were separated into categories by what they sold (salumeria, latteria, frutivendolo, etc.)33. There were no limits on the number or types of stores that could open in any given area. Each store, though, could only sell those products which they were licensed to sell (a latteria could sell only dairy products). On June 11, 1971 Law 426 was put into effect and changed the entire licensing scheme. The passing of this law transformed the licensing process from one that was very casual to one that is much more formal. At this time all food stores were placed into one category; they were no longer labeled by the types of food they sold. Because of this law food stores were now able to expand the variety of products that they sold. In 1971 restrictions were also placed on the surface areas of stores. This surface area constraint prevented supermarkets from opening. In 1979 the city of Venice developed a new limit for large structures and raised the maximum surface area. By raising the surface area maximum for stores, large supermarkets were now able to open. These laws stayed fairly stable until March of 1998 when law 114 was approved. As of this date a “silent approval” system was put into place, meaning that a store under 250 square meters does not need a license in order to open. If you plan to open a store whose size is less than 250 square meters you only need to notify the commune of your opening and your plans. If after thirty days no further word is received, you have been approved to open. In Venice the majority of stores are under 250 square meters and therefore do not need a license. While this could have hindered our ability to collect opening and closure dates, stores are still tracked through their notifications.
33 For a complete glossary of relevant Italian terms and their respective English translations see Appendix E.
17

2.6.2 Government Assistance for Stores
When a city’s economy relies mostly on tourism, the proliferation of the industry can easily get out of control unless some limits are placed on it. It is vital that steps are taken to preserve the residential areas and food stores so the Venetian citizens can still live a somewhat normal life. The Venetian government has taken steps to help regulate tourist shops in certain areas as well as giving incentives to shop owners in four specific residential areas.
The strictest laws regulating tourist shops are placed on two of Venice’s most famous areas, the Rialto Bridge and St. Mark’s Square. In these areas you cannot transfer a store license from an outside area into one of these two areas. This limit does not apply exclusively to tourist shops in these areas, but bars and restaurants as well. If a shop closes in this area then one is able to move in, but the absolute number of stores in these areas is fixed.
Along with regulating the stores in the two previously mentioned tourist areas the government has measures to protect and preserve the most residential areas of Venice. There are four zones that are sheltered from tourism. The four areas included are Santa Margherita in Dorsoduro, San Leonardo in Cannaregio, Via Garibaldi in Castello, and the Rialto in San Polo/San Marco. In these areas it is illegal to open a store that falls within the tourist category. Also, the government offers incentives (however trivial they may be) for people who open a food store in one of these four zones. For example, in these areas, food shop owners are only required to pay 50% of the price for trash removal. In addition, these store owners are exempt from paying the tax for the parts of their store that are protruding into public space (signs, awnings, etc.). However, in light of difficulties mentioned later in the report, this assistance hardly seems appropriate if one wishes to preserve the concept of small stores in the city. Possible improvements to these are discussed in the recommendations section of the paper.
After having been properly introduced to some fundamental background for the city’s inner workings, we continued on to get more details about the condition of the city and its people. The next chapter explains what specific objectives we developed as well as the processes by which we attained them.
18

Chapter 3: Methodology
The purpose of this endeavor was to develop a rich, multidimensional understanding of the dynamics of the evolution of the retail sector in Venice and how the effect of this evolution has been perceived by the local shopkeepers and citizens. The nature of our goal required that we attack the task from a variety of different angles, all within the constraints that may have an effect on its timely and adequate completion. Because this project had both social and personal qualities, a general familiarity with social psychology was useful. Social psychology is the "scientific field that seeks to understand the nature and causes of individual behavior and thought in social situations"34. There are many strategies in the field of social psychology that can be applied to a situation similar to the Venetian perception scenario. Three main ones listed by Baron et al. (2004) are systematic observation, the survey method, and the correlational method.35 All three were implemented in some form throughout our processes of data collection and analysis. The explicit objectives of this project were to:
• Develop and analyze quantitative data in order to understand how store evolution relates to tourism, population change, and other cultural variables
• Complement quantitative data with qualitative data in order to create a more holistic picture of the effects of retail change in Venice by
o Interviewing locals o Triangulation of research
• Compile a video documentary to use as a medium through which our research findings can be articulated
From our experiences, when almost any Venetian is asked about their city their response is
very passionate. According to Cohen et al., "the more emotionally loaded an event is (for whatever reasons) for an individual, the greater the tendency for perceptual distortion to occur". For this reason, we tried to keep an objective mindset when interviewing the local citizens. In order to support the opinions and perceptions expressed in these interviews, we also collected official documents such as store histories from the Comune di Venezia and newspaper articles.
We originally thought local citizens would be resistant to sharing their thoughts with us. We
expected that some would believe that foreigners should not meddle with issues not pertaining to them. Because of this, we considered the sensitivity of Venetian citizens whenever we interacted with them. However, what we found was that when we were accompanied by our Venetian liaisons, most natives were very willing to share their thoughts, opinions and anecdotes with us. A general scheme for how we approached our interviewees is outlined in section 3.2.1 Interviewing and Surveying local citizens. However, interviewing is not the only process by which we accumulated our data. An intensive collection of historical data on the stores of the city had already been commenced by previous student researchers as well as government organizations.
34 Robert A. Baron and Donn Bryne. Social Psychology. 10th ed. (New York: Pearson Education Inc. 2004) 34 35 Baron and Bryne. Social Psychology. 34
19

Our project focused on the evolution of food stores, or “basic necessity” stores, in Venice. Due to the fact that we still used data collected by a previous project group, “Residential Comfort Level: An Analysis of the Venetian Retail Sector” (2005), we initially mirrored their data collection methodology and used their definition of a “basic necessity” store. This allowed us to keep the data consistent throughout. The aforementioned project defines a store and, more specifically, a “basic necessity” store as follows:
A store will be from here on defined as an establishment that sells items to the public. A basic necessity store will be classified as any store that sells basic food necessities which are the elements needed to create a meal in a residence. Examples of basic necessity stores are bakeries supermarkets or butcheries. Following the principles of our definition, we are eliminating restaurants and bars because they provide the meal, not the basic elements needed to create one.36
The WPI project completed in
2005 focused mainly on the sestieri of Dorsoduro and Cannaregio (see Figure 12) when compiling the store evolutions and therefore when organizing and validating their data we concentrated on these two sestieri. When conducting our interviews and surveys we wanted a large and varied sample size. For that reason, and for limited comparative purposes, we attempted to expand the scope of our project to the entire city of Venice, as well
as the surrounding areas. In doing this we gathered a wide range of thoughts, opinions, and quantitative data about the change in retail and availability of food.
Figure 12: Map of Venice (Cannaregio in yellow,
Dorsoduro in red).
Some of the previously gathered evolutions date back to the end of World War II. The years shortly following the end of the war (approximately 1950) mark the start of the decline in the Venetian population as well as the beginning of the tourist “boom”. Because of this the interview questions were limited to perceived changes within this time frame. Also, our contact with storeowners was mostly limited to the stores’ hours of operation, typically 9am to 1pm and 3pm to 7pm.
3.1 Developing and analyzing quantitative data In addition to the data from previous IQP groups, we collected other quantitative data we thought was relevant to our project. This data collection process is briefly outlined in the following two sections.
36Modeste, Jarvis, Greene and Isabella, Residential Comfort, 21.
20

3.1.1 Validating Previous WPI Store Data
In order to create a multidimensional understanding of the dynamics of the evolution in the retail sector of Venice we first validated and organized the previous data. This process enabled us to identify what was useful to us and also where there were gaps in the information. We attempted to validate the data collected by the past two IQP groups in three different ways.
The first of these ways was the neighborhood walkthrough. This method consisted of
systematically going through a neighborhood with one of its residents (preferably someone who’s lived there for over 25 years) as they told us about any changes in retail that they could remember; what each store used to be, the dates of any openings/closings they could remember and how it had personally affected them. If we found that several of those interviewed in this manner contradicted the data we already had we concluded that the previously collected data was incorrect.
In addition, we requested databases of store records from the Comune di Venezia as well at the
Camera di Commercio di Venezia. The most useful database we received was from the Comune di Venezia. This database listed all stores that have been issued a license from about 1970 to today. It listed what type of store each physical location had housed at point in time. Using MapInfo in conjuction with this database we created maps showing the location of any store ever issued a commercial license in Venice as well as specific maps for food stores. On these maps, one can see what type of store each location housed at each point in time by simply clicking on one of the dots. This will allow future researchers to easily see what data is available without having to sift through databases. We considered these records to portray the most truthful evolution because these official records are more accurate than personal recollections.
3.1.2 Gathering and organizing other relevant quantitative data Along with data on store evolutions we found it necessary to collect data on changes in
population, tourism, prices, and other demographics. These databases were retrieved from previous WPI IQPs, newspaper and magazine articles, official city of Venice websites, and official city books and documents. These sources are cited as discussed throughout the report. Microsoft Excel was used to create graphs in order to allow us to see the changes over time and to compare the changes in these different factors over the same period of time.
3.2 Complementing quantitative data with qualitative data
In the previous section, 3.1 Developing and analyzing quantitative data, we explained our methods of gathering, validating, and organizing quantitative data. In order to create a more comprehensive image of the changes in retail and to better understand its effects we found it necessary to gather qualitative data as well. Through surveys and several different types of interviews we were able to gather the Venetians perceptions of retail change. The technique of research triangulation was then used to put the two types of data together and produce a more complete picture of the changes that have occurred.
21

3.2.1 Interviewing and Surveying local citizens
It was our intention to gather Venetian’s perspectives on causes and effects of the changes in the availability of food in Venice from WWII to today. We accomplished this through four different methods: three different types of interviews and a survey.
The first way involved finding citizens on the street or other places in which Venetians would congregate. We would then try to engage them in conversation using questions that would quickly get them emotionally involved. All of these interviews were of a somewhat standard format, that is, we attempted to ask each participant the same questions in the same order37. We tried to limit our questions to those outlined in the survey (which can be found in Appendix B: English Survey and Appendix C: Italian Survey), however, our interviewees’ answers sometimes provoked further questioning. They were short (about 5 to 10 minutes) and aimed to quickly get the citizen’s main thoughts and ideas on food availability and retail change.
The second method of interviewing citizens was an in-depth qualitative interview. These
were usually by appointment. In addition to the questions mentioned in the previous interview type, we asked each of them a different set of questions depending on their background. For example, we interviewed Sergio Bagarotto to get the perspective of someone who used to live in Venice but then moved to Mestre. While shorter interviews enabled us to easily group together all participants’ answers to one particular question, these more in-depth answers allowed us to better understand our subjects’ perspectives instead of just statistically analyzing their answers. These interviews were much longer (30+ minutes) and enabled us to not just get a citizen’s main thoughts, but also personal anecdotes, insights on food availability and other Venetian issues as well as basic information such as when, where, and why they shop. The third method of gathering citizens’ perceptions was the neighborhood walk-through described in section 3.1.1 Validating Previous WPI Store Data.
All of these interactions with locals were videotaped. This served a dual purpose: it allowed
us to replay the interviews as many times as we needed to fully understand them as well as giving us the raw material we needed for our documentary. The details of our documentary are outlined in section 3.3 Compiling a video documentary.
The final way in which we gathered perceptions and information about the shopping habits
of Venetians is through a survey which we distributed to 58 citizens. We attempted to distribute surveys on the streets of the city, but because we lacked fluency in the Italian language it was difficult to approach and explain ourselves to people. However, even when we had an Italian translator, we found that attempting to grab people without a good system was very time- consuming and scarcely fruitful. A more successful way to distribute our surveys resulted through use of our liaisons and their cooperation. After explaining and administrating the test to these volunteers, they would then distribute a reasonable number of surveys to their friends and families. The trial-and-error factors involved in the process led us to be left with a lower number of surveys than we had originally wished for. However, they were still useful as a tool to get more exposure to people’s opinions in a short amount of time. The information gathered from this survey told us the citizens’ behaviors (where they shop), their motives (why they shop there), and their attitudes on 37James K. Doyle, Handbook for IQP Advisors and Students, Chapter 11, http://www.wpi.edu/Academics/Depts/IGSD/IQPHbook/ch11a.html, (accessed September 25, 2006).
22

shopping (how convenient it is to shop). The data collected from the survey gave us semi-statistical data that we used to create graphs and figures that add another dimension to our story. The two versions of the survey can be found in Appendix B: English Survey and Appendix C: Italian Survey.
3.2.2 Triangulation of Research
This project had an unconventional approach in the sense that there was not exclusively numerical data being collected and analyzed. This data was complemented by the human factors that come with the personal statements and interviews conducted on-site. Because the previously collected data on which we based our comparisons was not flawless, and because time constraints and our limited expertise prevented us from performing statistically verifiable studies, the attempt to correlate, and to some degree, validate the data was of a more holistic nature.
We undertook the task of triangulating our research in order to obtain a clearer picture of
the effects of the evolution of retail in Venice. Triangulation of research "refers to the use of multiple techniques for gathering and/or handling data within a single study"38. According to Denzin and Lincoln “the combination of multiple methods, empirical stands, perspectives and observers in a single study is best understood as a strategy that adds rigor, breadth and depth to any investigation".39 What is implied is that through the combined backing of a variety of data types and sources, a greater comprehension of the situation under question can be achieved. It is important to note that the interpretation of "triangulation in research for completeness" is not universally accepted, but was used regardless under the assumption that it would aid, rather than hinder, our project.
The concept of triangulation was useful for our intents and purposes mainly because our
limitations required us to achieve some ground for relevance and soundness for our results without relying on statistical methods. In a case where more time and a thorough preparation of standardized processes are present, the use of inferential statistics and meta-analysis can be used to validate information. Our circumstances required that we present a persuasive and comprehensive picture of the retail situation and its effects on the city. Therefore, as Knafl and Breitmayer argue, we used triangulation in research “for completeness purposes rather than to confirm existent data, [where the] extra data are expected to contribute 'an additional piece to the puzzle”40.
3.3 Compiling a video documentary
Due to the fact that we used a multimedia approach to data and perception collection we needed a way to unify and present them in a cohesive way. We achieved this by creating a documentary-style film. A documentary allowed us to put together the highlights from our
38 Maria Fenech Adami. "The Use of Triangulation for Completeness Purposes." Nurse Researcher (2005): 19 (accessed September 25, 2006). 39 NK Denzin and YS Lincoln, “Introduction: Entering the field of qualitative research”. Handbook of Quahta n tive Research. (Thousand Oaks: Sage Publications,1994) 40 K Knafi K and B Breitmayer, “Triangulation in qualitative research: issues of conceptual clarity and purpose”. In Morse J (Ed) Qualitative Nursing Research A Contemporary Dialogue. (California: Sage Publications, 1991)
23

interviews. Those highlights, accompanied by statistical data produced a rich portrayal of the changes in Venice’s retail and how citizens and shopkeepers are affected by this.
Because we videotaped every interaction we had with the locals, we were left with an
abundance of footage to compile. We watched every single video and documented all interviews by making note of every statement relevant to our mission as well as at exactly what point in the video, down to the second, each statement was made. This was very time consuming process, but was essential to creating a cohesive and entertaining product to present our findings. What we were left with was a substantial amount of of scarcely organized information.
The answers interviewees provided to similar questions were arranged together to get the
opinions of several Venetians on one topic. The video relied on an in depth look at the opinions of a few interviewees. This allows the viewer to get a more comprehensive presentation of a few individuals, creating a more emotional connection. Once all the videos were catalogued, and the clips arranged by categories, we created a storyline that would make the documentary fluid and cohesive. The storyline is composed of a brief introduction followed by a series of hypotheses and “findings”. The hypotheses are a series of common assumptions about retail in Venice that are either supported or contradicted in the documentary. We referred to other useful insights as “findings”. We used Adobe Premiere Pro 2.0 to create the final product. This was also an extremely time consuming process: we had to choose appropriate audio and video transitions, add background music, write a script and then insert the narration as well as learn how to use certain features of the program that were unknown to us. Since our viewers are be mostly Italian the video is in their mother tongue. Interviewees that speak in English were dubbed over in Italian.
24

Chapter 4: Results41
After following the methods discussed in the previous chapter we were left with a variety of quantitative and qualitative data. These data came in the forms of databases, survey results, and “digested” interview excerpts. Sections 4.1 and 4.2 explore the products created from the raw data.
4.1 The Development and Examination of Quantitative Data This section covers the quantitative data that was acquired and the resulting products. A series of maps was generated, along with several graphs of population and tourism data. These will later be used to support arguments made in the analysis section.
4.1.1 Validation of Previous WPI Data After examining the databases created by the 2004 and 2005 IQP retail teams we were impressed by the amount of data they had collected in such a short amount of time. However, it was apparent that they were somewhat incomplete. For many addresses the only data shown was that of the store currently open there. For the addresses where an evolution was actually given it was evident that the years of opening/closing were estimated; the majority of dates were approximated to either the nearest decade or half decade. By inspecting the ’05 database, which is an updated version of the ’04 database, it became apparent that the method of using oral histories alone is not the most accurate of documenting retail evolution (see Figure 13).
Figure 13: Screen shot of '05 database
41 Throughout the Results and Analysis sections we refer to opinions expressed by our interviewees. The statements they made are referenced. A complete list of interviewees can be found in Appendix D.
25

In order to separate the accurate information from the more imprecise data, we conducted
neighborhood walkthroughs, following the method explained in section 3.1.1 Validating Previous WPI Store Data, with members of the Settemari rowing club. To obtain additional validation we asked Settemari members who had volunteered to help the previous teams walk through the same areas to see not just if the ’05 database was correct, but also to test if they could actually replicate the information that they gave in ‘05. The first method of validating data has shown that the information that was already collected is, for the most part, correct. This does not mean that the information is reality; this only tells us that the information is reliable. This indicates that the same person can accurately recall their version of the history from year to year. When the majority of discrepancies were found it was not a result of misinformation, but result of a store closing between the time of the ’05 project and today. Along with the walkthroughs we were able to acquire a database from the Comune di Venezia. When we created maps of the change in food stores over time we used this database. This database gave us the closest to actual retail history that we were able to obtain and became the basis for our analysis. We subscribed to an online database of the Venetian newspaper La Nuova. This database allowed us to access all newspaper articles dating back to 2003. We were only able to acquire a few articles giving specific dates of store openings/closings. These dates were checked against the data from the Comune di Venezia as well as the databases created by the ’05 WPI retail group. These documents further mirrored the information given in the database from the Comune di Venezia and matched the majority of the approximate dates in the ’05 retail database.
4.1.2 The Gathering and Organization of Relevant Quantitative Data The Comune di Venezia’s database allowed us to produce maps indicating the number of
stores, and more specifically food stores, at various points in time. Additionally, we created charts and graphs presenting information on factors such as population and tourism that we felt had an effect on the change in retail in Venice.
General Retail
Using MapInfo software, we were able to map all of the stores ever opened in Venice since
approximately 1970 (see Figure 14). We also mapped all stores open today (see Figure 17).
26

Figure 14: All stores opened since approximately 1970
Figure 15: All stores currently open
In order to determine the number of stores that have closed and not re-opened we
superimposed the map of all stores open today and the map of all stores opened since approximately 1970 (see Figure 16). The blue dots represent stores open today, while the red dots represent stores that closed and did not reopen. When these maps are opened in MapInfo they are linked to the Comune di Venezia databases and if one clicks on a dot, the history of each address is displayed. These maps allow us to quickly see the changes in the location and number of all stores and, more specifically, food stores.
27

Figure 16: All stores open today (blue) and stores that have closed and not reopened (red)
28

Food stores
In addition to the maps that reflect the change in all stores in Venice, we created more specific maps for food stores: one of all food stores open since around 1970 (see Figure 17), one of all food stores currently open (see Figure 18) and one that combines the previous two, that is a map of all food stores open today as well as all food stores that closed and have not reopened (see Figure 19).
Figure 17: All food stores opened since approximately 1970
Figure 18: All food stores currently open
29
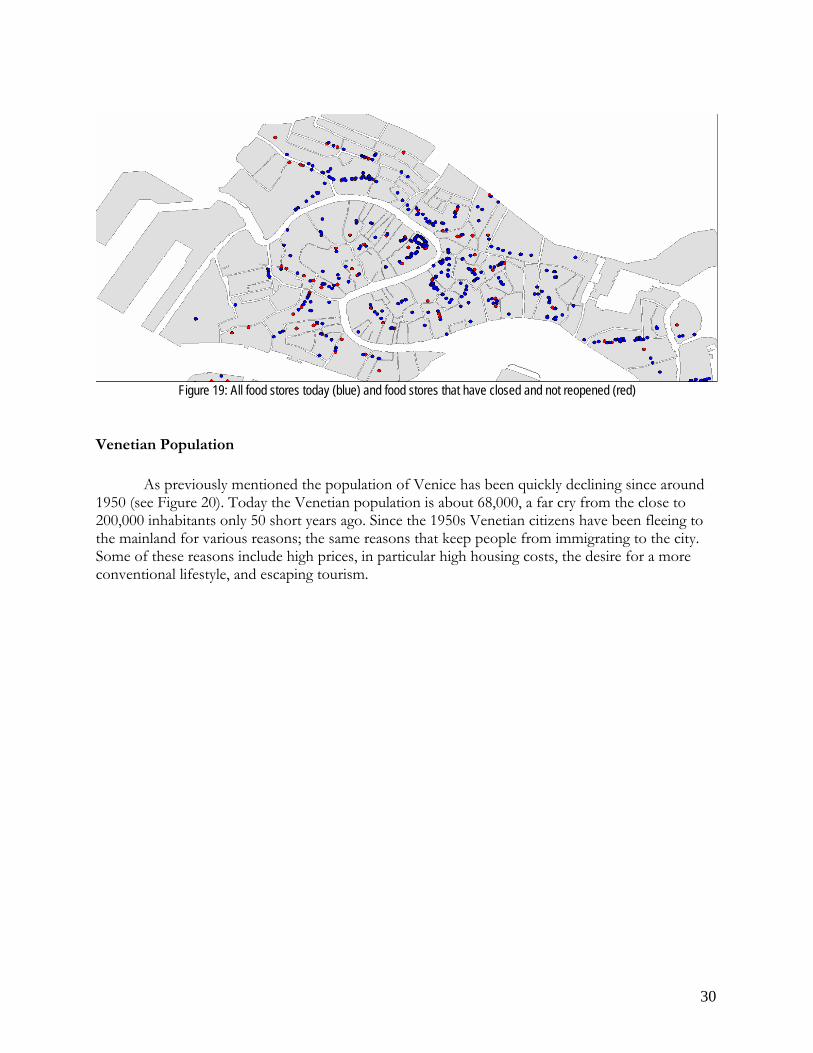
Figure 19: All food stores today (blue) and food stores that have closed and not reopened (red)
Venetian Population
As previously mentioned the population of Venice has been quickly declining since around 1950 (see Figure 20). Today the Venetian population is about 68,000, a far cry from the close to 200,000 inhabitants only 50 short years ago. Since the 1950s Venetian citizens have been fleeing to the mainland for various reasons; the same reasons that keep people from immigrating to the city. Some of these reasons include high prices, in particular high housing costs, the desire for a more conventional lifestyle, and escaping tourism.
30

0
50000
100000
150000
200000
250000
1871
1901
1921
1936
1952
1954
1956
1958
1960
1962
1964
1966
1968
1970
1972
1974
1976
1978
1980
1982
1984
1986
1988
1990
1992
1994
1996
1998
2000
Centro StoricoTerraferma
Figure 20: Population of Venice (Centro Storico) vs. the population of the mainland (terraferma) from 1871 to 200042
As the housing prices and living costs in Venice increase it is impossible for the native youth to remain and start a family in the city. The younger generations are also reluctant to stay in Venice because the unique structure of the city prevents them from leading a life that the mainland offers. As younger people leave, those left in the city tend to be the more elderly who already own their own homes and thus are not preoccupied about paying their monthly rent. Because of this, “[t]oday, 25 percent of the Venetian population is over the age of 64”, stated a recent article by John Hooper in London’s The Guardian (August 26, 2006). In the year 2000, there were 498 births in Venice, while the number of deaths was more than double, 112143.
Tourism
It is no secret that Venice’s economy relies heavily on tourism. While at times the citizens may feel alienated from their own home by this phenomenon, they need it to survive. Understandably, a city’s politics are likely to support the industries that sustain it. This seems to be what most Venetians think is happening in their city; they believe the politicians that represent them encourage tourism growth and neglect local citizens. In recent years the number of tourists eager to experience uniqueness of Venice has risen (see Figure 21). One way to gauge the tourist thermometer is to look at the alberghi, or hotel, situation. In 1950 there were approximately 300 hotels and today there are around 450. The majority of this increase occurred after 1999 when the laws regulated what types of buildings could be hotels were modified, allowing more hotels to open in preparation for the Roman Catholic Jubilee Year44. Additionally, a new direct flight is expected to start running next year from Shanghai to Venice’s Marco Polo airport. This flight is projected to
42 Città di Venezia, “Serie Storica della Popolazione Residente nel Comune di Venezia”. Informazioni Statistiche. Anuario 2000. (Servizio Statistica e Ricerca. Sistema Statistico Nazionale, 2001), p. IX 43 Città di Venezia, “Nati/Morti nel 2000 per sesso e Quartiere”. Informazioni Statistiche. Anuario 2000. (Servizio Statistica e Ricerca. Sistema Statistico Nazionale, 2001), p. 4, 6 and 7. 44 Interview with Franco Maschietto
31

bring at least 400,000 extra tourists to Venice each year45. In short, this all makes it clear that Venice’s attractiveness is not waning; therefore it is unlikely that tourism will decrease.
0
200,000
400,000
600,000
800,000
1,000,000
1,200,000
1,400,000
1,600,000
1,800,000
2,000,000
1949
1951
1953
1955
1957
1959
1961
1963
1965
1967
1969
1971
1973
1975
1977
1979
1981
1983
1985
1987
1989
1991
1993
1995
1997
1999
2001
2003
2005
Figure 21: Number of tourists per year in Venice from 1949 to 200546
4.2 The Complementing of Quantitative Data with Qualitative Data
After following the methods outlined in 3.2.1 Interviewing and Surveying local citizens we found that many shopkeepers and citizens had strong thoughts about how the change in retail has affected them. These feelings were grouped together and enabled us to create distinct educated assumptions about retail change in Venice. These findings are explained in Chapter 5: Analysis41. The perceptions and quantitative data we obtained form various official sources were fused together in our documentary.
The following sections present the information we obtained through our survey (found in
Appendix C: Italian Survey) as well as some demographic information about the 58 Venetians we surveyed. The information obtained through the surveys was used to create graphs about the shopping habits and preferences of Venetians.
4.2.1 Demographic information 45 Interview with Sergio Bagarotto 46 Città di Venezia, <http://www.comune.venezia.it/flex/cm/pages/ServeBLOB.php/L/IT/IDPagina/1523>
32
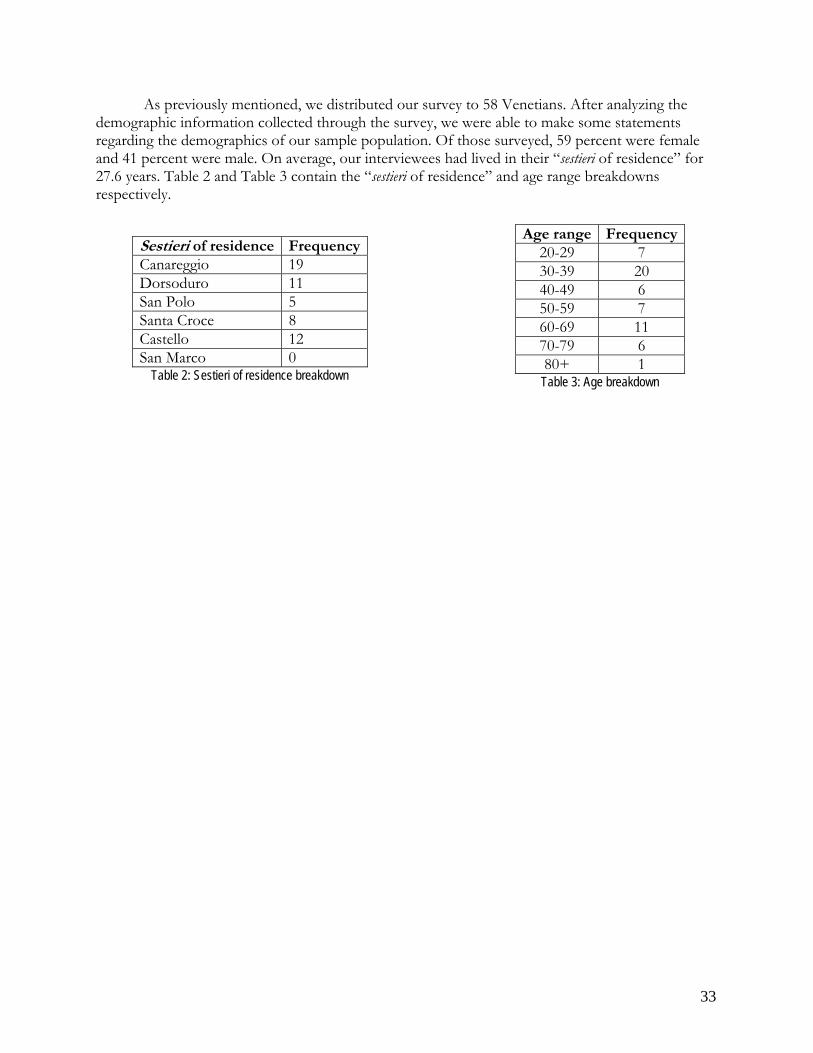
As previously mentioned, we distributed our survey to 58 Venetians. After analyzing the demographic information collected through the survey, we were able to make some statements regarding the demographics of our sample population. Of those surveyed, 59 percent were female and 41 percent were male. On average, our interviewees had lived in their “sestieri of residence” for 27.6 years. Table 2 and Table 3 contain the “sestieri of residence” and age range breakdowns respectively.
Age range Frequency
20-29 7 30-39 20 40-49 6 50-59 7 60-69 11 70-79 6 80+ 1
Sestieri of residence FrequencyCanareggio 19 Dorsoduro 11 San Polo 5 Santa Croce 8 Castello 12 San Marco 0
Table 2: Sestieri of residence breakdown Table 3: Age breakdown
33

4.2.2 Where Venetians shop for food The first issue explored through the survey was where Venetians shop for food. We wanted
to find out how often citizens frequented supermarkets versus small stores (see Figure 22). We found that the people of Venice most often use supermarkets to complete their food shopping. Approximately 93 percent of the citizens surveyed said that they go to supermarkets either often or always, while roughly only 25 percent said they go to small stores either often or always.
0
5
10
15
20
25
30
35
40
Never Rarely Some Often Always
Figure 22: Frequency of use of supermarkets (blue) or small stores (green) by Venetian citizens
34

4.2.3. Reasons why Venetians shop where they do
After finding out where Venetians shop we wanted to know why they shop there. On way that we accomplished this was by seeing what types of stores they can easily access. Approximately 86 percent of those surveyed said they can easily access supermarkets whereas only about 25 percent of people said they can easily access small food stores (see Figure 23). Approximately 71 percent of people said they cannot easily access the small food stores and only 12 percent
stated that they cannot easily access supermarkets.
0
5
10
15
20
25
30
35
40
45
50
Can Easily Access Cannot Easily Access
Figure 23: Types of stores that Venetians can or cannot easily access to buy their food: small stores (blue) vs. supermarkets (green)
When asked directly which type of store Venetian shoppers prefer, roughly 55 percent favored supermarkets while 45 percent favored the small food stores. Considering our relatively small sample size, 58 is not a large enough percentage to state that Venetians prefer the supermarkets over small stores. However, we were able to get an idea of what some people had to
say about the subject. We also asked Venetians what factors are most important in choosing a food store to shop at. Those surveyed chose factors relating to supermarkets, such as variety and price, over small-store traits, such as quality and personal connection (see Figure 24). All these results led us to believe that Venetians shop at supermarkets over small food stores because they both embrace them and are easier to access.
Quality30%
Variety23%
Price27%
Distance14%
Personal6%
Figure 24: Most important factors for Venetians
when choosing a food store to shop at
35

4.2.4 Shopping Convenience: Past and Present
We also tried to gain Venetians’ perceptions on how convenient it is to shop in Venice. Our surveys show that 81 percent of those surveyed think the shopping situation in Venice is satisfactory, good, or very good (see Figure 25).
Very Good5%
Good39%
Satisfactory37%
Poor14%
Very Poor5%
The final issue explored through our survey was how the convenience level of shopping today compares to that of the past. Our survey results show that 71 percent of citizens think the food shopping situation in Venice is the same, easier, or much easier than it was in the past (see Figure 26). Figure 25: Convenience level of shopping for food in Venice
These figures gave us some insight into how the typical Venetian feels about the food shopping situation in the city. These numbers and charts were used in our documentary and allowed us to make more concrete educated assumptions about the effects of retail change in the city.
Much Easier20%
Easier33%
Same18%
Much More Difficult
0%More Difficult29%
Figure 26: How food shopping in Venice compares today to the past
36

Chapter 5: Analysis After conducting and videotaping a number of interviews with several local citizens, we were left with a surplus of qualitative data to analyze. We carefully reviewed all of the interviews and extracted the main themes. These, along with our survey data, were used to support or disprove the four hypotheses that we had developed about how the citizens of Venice feel about their city and more specifically about shopping. These hypotheses are:
1. Tourism has overtaken food stores 2. Supermarkets drive out small food stores and are rejected by the population 3. Venetians prefer small food stores 4. The aging Venetian population is inconvenienced Once we either supported or contradicted these four hypotheses we were left with other valuable information. We referred to these new pieces of information as “findings” and used them to tie together our storyline as well as to make educated generalizations about the city of Venice and its people.
5.1 Hypothesis 1: Tourism has overtaken food stores
Our first hypothesis was that tourism is driving out the small food stores. We have found that tourism is in no way solely to blame for the decline in stores. We were told that oftentimes, when a food store would close, if a souvenir shop did not open in its place, it would simply remain empty. Rarely would another food store take its place. We have also found that tourism partly supports the small food stores, filling the void left by the lack of local population. Through our surveys we found that approximately 93 percent of the citizens surveyed said that they shop at supermarkets either often or always, while roughly only 25 percent said they go to small stores either often or always. It is a fact that Venetians are not supporting small stores the way they used to and are thus contributing to their closure. Small food stores are becoming very few and far between. This may be part of the reason Venetians no longer shop there: it is too time consuming to visit all the small stores they need to in order to buy all their food.
We asked many small food shop owners in residential, tourist, and mixed areas
approximately what percent of their clientele is composed of Venetians versus what percent is composed of tourists. In areas such as the Rialto and St. Mark’s Square shop owners said that usually only tourists shop there. In the mixed areas, such as Strada Nuova and Ghetto, shop owners said that the proportion is about 60% tourists and 40% Venetians. They also stated that during the holiday and summer seasons the number of tourists that shop there heavily outweighs the number of locals. In the residential areas, such as Santa Elena, shop owners said that their customers are usually only Venetian. When asked why no tourists shop at their stores they responded that it is only because there are almost no tourists in their area. We also observed that in the residential areas the number of small food stores was far lower than the number in the tourist and mixed areas. This leads us to think that tourists may be playing a role in keeping small stores open. We found that bread and pastry shops have the highest percentages of tourist shoppers. Tourists usually eat at restaurants or buy pre-made food and therefore are less likely to shop at a butcher or fish shop.
37

Several shop owners stated that they appreciate the tourists that shop at their stores. They said that it shows that the tourists are interested in preserving the small stores and traditional Venetian heritage.
5.2 Hypothesis 2: Supermarkets drive out small food stores and are rejected by the population Our second hypothesis was that supermarkets drive out small stores. We have found that supermarkets are partly responsible for the decline in small stores, but it is because the people actually support them. Many citizens look back nostalgically on the days when small stores were the only option, but they prefer the convenience and variety that supermarkets offer. One of our interviewees stated that a number of Venetians complain about the closing of the small stores, but then they shop at the Billa or Coop47, two local supermarkets. Supermarkets allow the shoppers to buy everything that they need in one stop. Surprisingly, there are more stores per capita in Venice than the mainland48. This may also be a reason behind the closure of small stores: there is a lack of local citizens and thus insufficient business to support all of the small stores.
As previously stated, since there are not many small food stores remaining people have to invest even more time and effort into buying what they need from them. While the quality of the products sold in small stores tends to be higher, they are also usually more expensive than in supermarkets. Luisa, owner of a small shop in Santa Elena, said that today people just buy the goods that are cheapest49. They are not concerned with the quality of their bread, fruit, or meat anymore, as long as it is inexpensive. This sheds more light on why Venetians shop at supermarkets over small food stores.
5.3 Hypothesis 3: Venetians prefer small food stores
This leads to the third hypothesis which was that the citizens of Venice prefer small stores. Our survey results show that this is not true. As explained in the results chapter, people prefer the convenience, price, and variety of supermarkets over the quality and personal connection of small food stores.
We have found that this idea does not apply to just food, but other goods as well.
Traditional artisan goods are becoming extinct as well. People will go to a store and buy a picture frame or piece of furniture that is mass produced instead of going to the traditional artisan shop. We suspect that the reasons for this are the same as those for why people choose supermarkets over small food stores: it is faster, easier, and cheaper to buy a mass produced product than it is to buy a high-quality product from an artisan.
5.4 Hypothesis 4: The aging Venetian population is inconvenienced
47 Interview with Chris Wayman 48 Città di Venezia, “Residenti per punto vendita al 31.12.1990 e 31.12.1995 e 31.12.2000”, Informazioni Statistiche. Anuario 2000. (Servizio Statistica e Ricerca. Sistema Statistico Nazionale, 2001), p. 270-272. 49 Interview with Luisa
38

With the state of affairs balanced towards the tourist population, for the privileged minority of Venetians that manage to cope with housing costs and linger on the island, staying appears to be less of a privilege and more of a burden. Like the rest of Italy, Venice’s remaining population is aging significantly. A quick look at the physical attributes of the city will reveal that there are no cars to transport people around; only a maze of alleys, bridges, and canals. Venice is not a city built for the aging or handicapped, and although there are public transportation boats, walking is usually the quickest form of transportation. Almost any visitor to the city is left impressed by the distances that must be traversed on foot to get from place to place. It seemed logical to assume that if it is tiring for young tourists that come for day trips to the city, then for the older people that live here day after day it must be incredibly inconvenient. Our fourth and final hypothesis was that the aging population of Venice is inconvenienced by the current shopping situation and that they find Venice an uncomfortable place to live. When interviewing older citizens we found that it is just the opposite. Many Venetians say that Venice is “the perfect place to retire”50. For a foreigner who is not used to all of this it may seem like a nuisance, but it is the Venetian way of life. We have been told that Venice’s slow pace and quiet lifestyle are perfect for the retired community. There are many beautiful parks and campos, or squares, to sit and relax in. As stated by one of our interviewees, “If it takes an older citizen twice as long to walk up the stairs as it used to, it is fine with them”51. From what we have found, Venetians love and are proud of their city and are not about to abandon it just because they are getting older.
5.5 Findings While investigating the aforementioned hypotheses we stumbled upon other findings that gave us added insight to the issues resulting from retail change. While speaking to citizens about the availability of food, we discovered that for many people food it is not hardest thing to obtain. Food is often focused on because it is an absolute necessity, something people need to acquire at least every few days. We have discovered that Venetians must travel to the mainland in order to purchase other little things that most people do not give any thought to. In our survey we asked people to list three things, other than food, that are difficult to obtain on the island. Some of the most frequent responses to this question were electronics, house ware items, movies and other entertainment items as well as affordable clothes. These inconveniences are forcing many people to go to the mainland not only to shop, but also to establish their residence. One of our interviewees, Sergio Bagarotto, moved to Mestre from Venice because he and his wife worked on the mainland and thus had to commute for over two hours a day. He would like to move back to Venice as soon as possible, but as of now he cannot afford it. Housing in the city is so expensive that many people, especially those that are younger, cannot afford to live there. Many young people choose to move out of Venice for this reason, but also in search of an easier, more typical lifestyle. They want to drive cars, go to clubs, and own their own homes.
Society is changing, and Venice is no exception. The Venetian youth is leaving in search of a more modern lifestyle. They are choosing to go to college instead of staying at home to take over
50 Interview with Umberto Angelin and Sergio Bagarotto 51 Interviews with Umberto Angelin and Sergio Bagarotto
39

the family business. When the owner of one such shop retires, it is customary for him to hand over his store to the next generation. Younger Venetians tend not to be interested in the small shop owner life; working 12 hour days, 6 days a week52.This phenomenon is also contributing to the closure of small food stores. In tune with the majority of “modern” society, family dynamics are also changing. Families are smaller today than in the past and eating habits have also changed. In the past families would all eat together; this was often easier because people worked closer to home53. With commuting distances increasing, workers no longer come home for lunch; it is much easier to eat out. All of these insights appear to be connected in some way with the closing of small Venetian stores. However, these are merely a few outward conclusions extracted from a relatively cursory overview of the situation. Each relationship merits further research by anyone interested in the deeper connections.
52 Interview with Luisa 53 Interview with Giamberto Siebezzi
40
Chapter 6: Conclusions and Recommendations
Whereas our project began by trying to simply finish mapping the evolution of food stores in the city of Venice while adding the perspective of the people around the city, we acquired much more than we expected. After extensive investigation and numerous interactions with the city folk, our team developed a much better understanding of not only how the stores have changed, but also inklings of why and to what end. As the title implies, this chapter sums up the major conclusions that were arrived at and what suggestions we deem appropriate for the future.
6.1 Conclusions After exhaustively reviewing video and analyzing data we have come to the conclusion that retail change and its effects are multi-dimensional issues and there are many variables that influence them. We have determined that the process of tracking retail change through oral recollection alone is not the most efficient method. Applying triangulation in research and using many different factors to envelop and evaluate the subject, we have found, is the best approach when attacking an issue such as this one. However, the many issues that we have unearthed through our process can and should be explored individually by more systematic and thorough means. We have determined that the reasons Venetians shop for food at different types of stores is unique to each individual shopper. Those that still consider quality and personal connection indispensable tend to still use the small food stores, while those who favor lower prices and variety frequent the supermarkets. Overall, most Venetians that we interviewed use the supermarkets to purchase their food. It is true that many citizens complain about the closing of small food stores and are very nostalgic for the days in the past when one would visit the same butcher or bakery every day. For many, supporting the butchers, bakers, and fruit vendors by simply shopping at these stores is within their means but they still choose the convenience of the supermarket. To a certain degree, the indifference to quality exhibited by many Venetians mirrors the general trend in many other parts of the world. The fact that many people tend to value convenience highly is a characteristic of modern society. Another suggestive discovery was that contrary to our (and many people’s) expectations, the older Venetian people who we talked with do not seem to be very inconvenienced by the distances that they have to travel on foot. Instead they are steadfast, and often exceptionally enthusiastic about their daily journeys. The Venetians that we were able to interview were proud of their heritage, their home, and their fine physical condition. Regardless of the fact that the situation in the city is not ideal, many are happy and feel privileged to still call Venice their home. Finally, we realized after all was said and done that the matter of retail change is incredibly dynamic. We began on this topic by reflecting over how much people complained about the changes in their city through the newspapers, and consequently how store closures must be affecting them greatly. What we came to find is that although people were indeed upset by the drastic transformations that have befallen their neighborhoods, small store closures were not the primary concern. The connections between basic necessity stores and other greater problems were intricate and at times, startling. Population loss, housing, politics, employment, and even Chinese organized
41

crime all surfaced (although the last was only one particular resident’s conspiracy theory) as issues that either affected or were affected by the small stores. It was even suggested that because of its focal relationship to so many issues, the status of retail in Venice should be considered a way to gauge the condition of other more complicated matters. The evidence that we have found indicates that this may not be an implausible idea, and maybe one that should be investigated further.
6.2 Recommendations Through our research and interviews with the Venetian people we were able to extract and consolidate many suggestions for everything from “how to increase the number of small food stores”, and “how to recuperate the Venetian population”, to “how to better track store evolution”. Although they may appear whimsical at times, it is our aim to reveal some of the ideas that we thought useful, so that they may be examined and possibly developed further. Together with proposals we also received many opinions on whether or not there is a solution to the situation in Venice at all.
6.2.1 Government Assistance One very common suggestion, referring to the opening and closing of small food stores as well as the housing crisis, was that the government can do much more to help. As mentioned in section 2.6.2 the government does offer help for new stores to open, but this is restricted to only certain areas and the help given is very limited. Offering a fifty percent break on garbage removal as well as waiving the tax for awnings and other things protruding into public space is not that helpful when you are fighting to keep your store open or struggling to open a new store. Also, these benefits only apply to small food stores opened in one of the four protected areas mentioned in 2.6.2. If the number and size of the protected areas were expanded it would ease some of the difficulty linked to opening a small food store.
Along with expanding the protected areas, some suggested that the government should purchase buildings in these areas in order to regulate rents. They could either regulate the rent and give shop owners a fixed reasonable rate or charge a progressively increasing rent. For example, the rate could be very accessible when a shop first opens and as a shop gains its footing, the rent could then slowly rise to a reasonable price.
Along with regulating store rents, if the government purchased buildings it could regulate
apartment prices. By regulating apartment rents it would make it easier for young people to afford living in Venice. This would increase the population, especially the percentage of younger inhabitants, living in Venice. If the percentage of young people living in the city was greater, the fertility rate would probably increase, and instead of slowly dying as it is now, the city would receive a new rush of productive life. With a higher population to cater to, more stores could open and presumably succeed.
The effects of tourism on real estate can also be further investigated, as there are many
aspects that factor into this particular issue. In particular, government incentives that promote the occupancy of apartments by full-time residents instead of intermittent ones would contribute to the local economy of the island.
42

6.2.2 Methods of Tracking Retail Evolution We have found that the method of using oral histories to track the changes in retail, particularly store openings and closings, is not the best technique to use. It is a lengthy process and, as discussed in section 4.1.1 Validation of Previous WPI Data, the results are not always complete. One suggestion is to create a self-propagating online system. This online system would allow Venetians to upload pictures of old stores along with any information they may have regarding what stores used to be. We know that the change in retail is a major issue in Venice, and consequently do not foresee too many difficulties gaining public support for such a system. An additional suggestion is to modify the way in which retail registration is documented. The database we obtained from the Comune di Venezia lists the licenses issued since roughly 1970, but when a store closes they do not mark the closing date; the license is just marked as cessata, or ceased. A more descriptive classification technique would also be useful. The current database only marks each store as a food store or a non-food store. If the type of store was more descriptively recorded it would allow for a more in-depth analysis of the effects of the closing of stores. By knowing the specific type of each store one could explore and see how the closing of a specific type of store affects the opening or closing of the other stores in the area.
6.2.3 Other Solutions
While interviewing, we asked our volunteers their viewpoint on not only the decline in food stores, but also all the other issues discussed throughout this report, and if they envisioned any possible solutions. Among many Venetians, especially older ones, the sentiment that there is not a solution to alleviate all of the issues in Venice is common. One interviewee stated that like the cycle of life, cities rise and cities fall, and that Venice is unfortunately and inexorably falling54. They feel that people should just let the city die in peace.
Others though, still have a more positive outlook on the situation. One hopeful person said that each new generation that comes is more intelligent and more capable. He has faith that these individuals can determine a solution to Venice’s problems55. There are many people that love this city and care for it; this is proven by those who stay, by those who visit, and by all of the organizations in existence whose prime objective is to rescue it. Not everyone is ready to throw in the towel just yet. An especially good point was made in one of our many discussions. This particular resident noted, quite shrewdly, that “The situation is dynamic and still changing, and this means that it can change for the better; it is when a condition stops changing that there is truly no hope”56. We certainly hope that he is right.
54 Interview with Umberto Angelin 55 Interview with Loris Volpato 56 Interview with Chris Wayman
43

Chapter 7: Bibliography
Atzema, Oedzge. and Frenken, Koen. and Jesse Weltevreden. 2005. Evolution in city centre retailing: the case of Utrecht (1974-2003). International Journal of Retail and Distribution Management. Vol 33. Issue 11. 824-841. (September 24, 2006)
Cohen, Allan R., and Stephen L. Fink. Effective Behavior in Organizations. 7th ed. Boston: McGraw-
Hill/Irwin, 2001
Conway Moris, Roderick. "The Rise and Fall of Venice". Royal Geographic. July, 2000. <http://www.jstor.org/> (20 October 2006).
Denzin NK and Lincoln YS. “Introduction: Entering the field of qualitative research”. Handbook of Quahtative Research. (Thousand Oaks: Sage Publications, 1994)
European Travel and Tourist Action Group < http://www.etag-euro.org/ > (21 September 2006). Fenech Adami, Maria. "The Use of Triangulation for Completeness Purposes." Nurse Researcher
(2005): 19 (September 25, 2006) Greene, Ta Karra et al. Residential Comfort Level: An Analysis of the Venetian Retail Sector. Worcester
Polytechnic Institute, 2005.
Knafi K, Breitmayer B, “Triangulation in qualitative research: issues of conceptual clarity and purpose”. In Morse J (Ed) Qualitative Nursing Research A Contemporary Dialogue. (California: Sage Publications, 1991)
Nation Master, <www.nationmaster.com> (21 September 2006). Norwich, John Julius. A History of Venice. New York: Random House Inc., May 1989. Piazzano, Piero. “Venice: Duels Over Troubled Waters”. UNESCO Publishing 2000. <http://www.unesco.org/courier/2000_09/uk/planet.htm> (20 September 2006) Plant, Margaret. Venice Fragile City. New Haven: Yale University Press, 2002. Suitecom. “Venice’s Six Sestieri”, 2000, <http://www.veniceclick.net/Guide/Sestieri-Venice.htm>
(19 September 2006) US Department of State, <http://www.state.gov/r/pa/ei/bgn/4033.htm > (20 September 2006) Weideger, Paula. “Death or Transfiguration?”. The New Statesman.. January, 1997.
<http://www.jstor.org/> (20 October 2006).
44

Woodlife, Lucy. Rethinking Consumer Disadvantage: The Importance of Qualitative Research. International Journal of Retail & Distribution Management,2004. 523 (04 October 2006).
Zwingle, Erica. “Venice More Than a Dream”. National Geographic 187, no. 2 (1995). <http://www.jstor.org/> (20 October 2006)
45
Appendix A: Annotated Bibliography
Italian Culture and History
“Background Note: Italy”. July 2006, September 19, 2006.
<http://www.state.gov/r/pa/ei/bgn/4033.htm>
This source provides reliable basic information on many different aspects of Italian government, history, economy, and politics.
Tourism
Davis, Robert C. Venice, the Tourist Maze : A Cultural Critique of the world’s most Touristed City. Berkeley: University of California Press, 2004.
The title speaks for itself in many ways. This text has a very comprehensive introduction that contains many facts and figures about Venice as a whole, and the author’s perspective on the tourist issue. The book itself paints a history of tourism in Venice and gives interpretations as to why it has been so successful at attracting people. It contains maps and pictures of the different tourist areas, something that could be of much use to us. More importantly, it talks about recent initiatives to help alleviate the congestion that can be found in the major areas of the city (i.e. Piazza San Marco).
Lubbock, Jules. TLS. Times Literary Supplement; Letter from...Venice.(Housing and Tourism-Created
Problems in Venice, Italy, Described). Times Supplements Ltd, 2002.
Venice is suffering a population decline due to migration of population and a low birth rate. Property owners are also converting dwellings into hotels or small apartments rented by the week to profit from the millions of tourists who spend at least one night in Venice. Venice now recognizes a need to preserve its vernacular housing and maintain population; the article gives some ideas on how this might be accomplished.
Russo, Antonio Paolo. "The "Vicious Circle" of Tourism Development in Heritage Cities." Annals
of Tourism Research 29.1 (2002/1): 165-82.
This paper explores the manifold relations among the spatial organization of tourism, the quality of tourism products in heritage cities, and the dynamics of the regional economies. The concept of "vicious circle" describes the self-feeding linkage between the emerging class of
46

excursionist tourists in the later stages of a destination lifecycle, and the decline in a city's attractiveness. Reference is made to the case of Venice. According to this scheme, effective policies for sustainable tourism should attack the critical points where the vicious circle feeds, such as the quality and accessibility of cultural resources.
Urban Planning
Goetze, Rolf. Understanding neighborhood change : the role of expectations in urban revitalization. Cambridge, Mass.: Ballinger Pub. Co., 1979.
This book talks about the importance of taking the mobility of citizens into account when trying to revitalize a city and plan it better. This will be useful since we are dealing with a city that has no cars and an aging population.
Witten, Karen, Daniel Exeter, and Adrian Field. "Urban Studies; the Quality of Urban
Environments: Mapping Variation in Access to Community Resources.(Development of a
Community Resource Accessibility Index)." 40.1 (2003): 161(17).
Venetian Culture and History
De Vecchi, Antonio. “Venetian Culture” <http://www.doge.it/cultura/cultmeni.htm> 1995. 2006.
This site has a wealth of information about the history and culture of Venice. It will be useful when writing the paper’s background and discovering what living in the city is like.
Howells, William Dean. Venetian Life. 20th ed. New York: AMS Press Inc., 1971.
This 20th edition of an apparently classic book can give us much background in the Venetian culture. It lays out many of the traditions that the Venetians have, and more importantly, paints a picture of the Venetian people as they were before WWII. This can be essential for our background information and maybe for the background section of our report, where we can paint a picture of a successful and vibrant Venice, before the dramatic fall in population.
47

Appendix B: English Survey
SURVEY QUESTIONS 1. My family regularly buys food from supermarkets (please circle one):
Never -- Rarely -- Sometimes -- Often -- Always
2. My family regularly buys food from small stores (please circle one): Never -- Rarely -- Sometimes -- Often -- Always
3. My family could easily buy all our food from small stores: YES NO
4. My family could easily buy all our food from a supermarket: YES NO 5. Please list the longest ____ and shortest ____ time, in minutes, that you travel to any food
store that you shop at regularly. 6. The two most important considerations in choosing a food store to shop at are (please circle
2): Price Variety of goods Quality Personal Connection Location Other:_____________
7. Overall, my family prefers to shop at: Supermarkets -- Small shops
8. Compared to the past, do you think that shopping for food is:
Much Easier -- Easier -- Same -- More Difficult -- Much More Difficult
9. Overall, the convenience of our food shopping experience is: Very Poor -- Poor -- Satisfactory -- Good -- Excellent
10. Besides food, please list the three things that are hardest for you to find in Venice: (1)________________ (2)________________ (3)________________
11. Gender: Male / Female
12. Age: (20-29) (30-39) (40-49) (50-59) (60-69) (70-79) (80+)
48

13. My home is located in the following sestiere: _______________________
14. I have lived in this sestiere for _______ years.
Appendix C: Italian Survey INDAGINE sull’EVOLUZIONE delle “BOTTEGHE” 1. Con che frequenza la Sua famiglia acquista generi alimentari nei supermercati?
(barrare la voce più appropriata) mai -- raramente -- a volte -- spesso -- sempre 2. A cos’è dovuta tale frequenza? ______________________________________
3. Con che frequenza la Sua famiglia acquista generi alimentari dalle piccole botteghe (barrare) mai -- raramente -- a volte -- spesso -- sempre 4. A cos’è dovuta tale frequenza? ______________________________________
5. La Sua famiglia potrebbe facilmente acquistare tutti i generi alimentari di cui necessita nelle piccole botteghe? SI - NO
6. La Sua famiglia potrebbe facilmente acquistare tutti i generi alimentari di cui necessita nei supermercati? SI - NO
7. Per cortesia, indichi il tempo (in minuti) più lungo _____ e il più breve _____ che impiega per raggiungere botteghe dove acquista regolarmente generi alimentari.
8. La preghiamo di barrare i due fattori più importanti che tiene in considerazione nella scelta del negozio sono (cerchiarne due):
Prezzo varietà di prodotti
qualità dei prodotti cortesia del personale
distanza da casa
altro: _____________________________________________________
9. In generale, la Sua famiglia preferirebbe fare le proprie spese:
al supermercato -- nelle piccole botteghe
10. Rispetto al passato, pensa che oggi fare le spese per prodotti alimentari sia:
molto più facile -- più facile -- uguale -- più difficile -- molto più difficile
11. In generale, la comodità nell’effettuare le spese alimentari è:
molto bassa..--.. bassa..--..soddisfacente..--..buona..--..eccellente
12. Oltre ai prodotti alimentari, ci indichi i tre prodotti o servizi che usa regolarmente che Lei trova più difficili da reperire a Venezia: (1)________________ (2)________________ (3)________________
49

13. Sesso: maschio/femmina Età: (20-29) (30-39) (40-49) (50-59) (60-69) (70-79) (80+)
14. La mia abitazione è localizzata nel seguente sestiere:________________
15. Vivo in questo sestiere da_____ anni
Appendix D: List of Interviewees BRIEF INTERVIEWEE PROFILES
1. Sergio Bagarotto – retired, male, Venetian, lives in Mestre
2. Franco Maschietto – Presidente A.V.A (Assoziazione Veneziana Alberghi), male,
Venetian
3. Andreoli – retired, male, Venetian
4. Wilma Barbieri – retired, female, Venetian, (Castello)
5. Rizzo – Pasta maker, male, Venetian
6. Federico Giugie – Restaurant owner, male, Venetian
7. Luisa – small shop owner, female, Venetian
8. Mario Berti – small shop owner, male, Venetian
9. Loris Volpato – jeweler, male, Venetian
10. Franco Rocelli – Ex Vice Minister of Foreign Trade, 15 years in Italian Parliament, male,
Venetian
11. Ricardo Baretton – Small shop owner, male, Venetian
12. Chris Wayman -- finance, male, British, has lived in Venice for 3 years, (Cannaregio)
13. Giamberto Siebezzi – retired, male, Venetian, (Dorsoduro)
14. Umberto Angelin – retired, male, Venetian, (Cannaregio)
15. Sabrina Zancarello – works at the Servizio Reglamentazione e Contenzioso Commerciale della Città di
Venzia, female.
16. Luca Destra – employed at the Statistical Office of the Camera di Commercio di Venezia, male.
50

Appendix E: List of Useful Terms English Italian Access Accesso Answer Rispondere/ risposto Antiques Antiquariati Art Arte Ask Domandare Attitude Atteggiamento Awareness Conscio Bags Borse Bakery Pasticceria Bank Banca/bancomat Bar Bar Boat Barca Bookstore Libreria Bread Panificio Butcher Macelleria Camera di Commercio di Venezia Comerce Department of Venice Carpentry Falegnameria Change Cambiamento/ Cambio Cheap Economico/ poco costoso Close Vicino/a Closed Chiuso/a Clothing Abbigliamento Comfortable Comodo/a Convenient Conveniente Convince Convincere Cosmetics Cosmetica Dairy Caseificio Dairy Products (store) Latteria Deli Salumeria Deposit Deposito Difficult Difiale Distance Distanza Easy Facile Electricity/ Water Elettricità Electronics Elettronica/ Elettrodomestici Employee Impiegato Expensive Costoso Herbalist shop Erboristeria Exchange Cambio Far Lontano/a Feelings Sentimento
51

Fish Pescheria Florist Fioraio Foods Alimentari/ Cibo Force Forzare Fruit Fruta Fruit/ Vegetable Stand Fruttivendolo Frustrated Frustato Gas Station Stazione di Gas Gym Palestra Hair Salon Parruccheria Happy Felice/ contento/a Hotel Albergo Household Appliances Elettrodomestico Household Textile (sheets, curtains) Shop Merceria Ice Cream Gelateria Ice Factory Frigorifero Ignore Ignorare/Non fare caso Inconvenience Disturbare/ disturbo Information Informazione Interview Intrevistare/ intrevista Ironing Incollarina Jewelry shop Gioielleria Large Grande Laundry Service Lavanderia Make Obbligare Meat Carne Metal Work Lavorazione del Metallo Miscellaneous Assortilo Money Denaro Mortuary Obitorio Old Vecchio/a Opinion Opinione Optical Store Occhiali Orthopedic Ortopedico Owner Titolare Percentage Percento Perception Percezione Persuade Persuadire Pet Accessories Alimenti/accessori per animali Pharmacy Farmacia Photo Shop Foto Postal Service Servizo Postale Prejudice Pregiudizio Price Prezzo Primary Goods Bieni
52

Problem Problema Purchase (verb) Comprare Question Domanda Real Estate Agency Agenzia Immobiliare Repair Riparazione Report (verb) Dare informazione Restaurant Ristorante Sell Vendere Sestiere On of Venice’s six boroughs Shoes Calzoleria Shopping (verb) Fare la spesa Small Piccolo/a Souvenirs Ricordi Stationary Cartoleria Supermarket Supermercato Sweets Dolci/Dolciumi Textiles Tessili Think Pensare Tobacco Store Tabaccheria/Tabachaio Toy Store Giocattoli Travel Viaggare Travel Agency Agenzia di Viaggi Unfair Ingiusto Utilities Servizii Vegetable Verdure Video Rental Video Wine Cellar Cantina Wood/ Coal Legna/Carbone Young Giovane
53

54