the demand for post-katrina disaster aid: sba disaster ... · the demand for post-katrina disaster...
TRANSCRIPT
The Demand for Post-Katrina Disaster Aid: SBA
Disaster Loans and Small Businesses in Mississippi∗
Anna Josephson1 and Maria I. Marshall1
1Department of Agricultural Economics, Purdue University, West Lafayette, IN
Forthcoming: Journal of Contingencies and Crisis ManagementIssue 25, Number 2†
Abstract
Following Hurricane Katrina, the United States government provided billions of dollars in loans
in order to repair the damage caused by the hurricane. However, the specifics surrounding
demand for these loans and the process of application and approval for Small Business Admin-
istration (SBA) loans has yet to be fully examined. We analyze the demand of small businesses
for such loans and delve into the factors which are associated with success in obtaining loan
funds following disaster. Results indicate several factors are important in all of the stages of the
loan process: the income of the business, whether the business had insurance or received money
in an insurance claim, and the gender of the business owner.
∗This article is based upon material from the Purdue University Project “Small Business Survival and Demise aftera Natural Disaster”, supported by NSF Grant no. 0856221-CMMI and “Small Business Disaster Recovery Process:An Analysis of Rural Communities in Mississippi” supported by USDA-NIFA grant no. 2011-67023-30609.†Early view available online.
1
1 Introduction
When Hurricane Katrina hit the south-eastern United States in August of 2005, it became the
costliest hurricane in the history of the country, with more than $108 billion in damages and over
1,800 lives lost (FEMA, 2013). The recovery effort was similarly unprecedented: over 13 million
Americans donated money as individuals, the Red Cross provided $2 billion in emergency aid, and,
in addition to $75 billion in immediate relief, the United States government promised $45 billion in
loans and rebuilding funds (FEMA, 2013). However, despite the tremendous damage experienced
in many areas, it is not clear what demand existed for reconstruction assistance. In particular,
the process of application and acceptance for Small Business Administration (SBA) loans by small
businesses has yet to be fully examined.
We investigate the application for and acceptance of SBA disaster loans following Hurricane
Katrina for small businesses in Mississippi. With this research, we seek to determine: 1) the
characteristics of businesses and owners associated with SBA loan application; 2) the characteristics
of businesses and owners associated with SBA loan receipt; and 3) the characteristics of businesses
and owners associated with SBA loan size. A truncation model framework is used to understand
the SBA disaster loan process using data from approximately 500 small businesses.
The SBA has a stated mission to “aid, counsel, assist and protect the interests of small business
concerns, to preserve competitive enterprise and to maintain and strengthen the overall economy of
our nation (SBA, 2013).” Additionally, the SBA has a mission to support underrepresented groups,
in particular female business owners (SBA, nd). It is important to examine whether the SBA met
its goals following Hurricane Katrina. In this article, we attempt to investigate one aspect of these
goals, with respect to the application and receipt of small businesses in Mississippi for disaster
loans. In doing so, we contribute to the literature as the first study to examine the process of
application for and acceptance of SBA loans, as well as by evaluating the success of the SBA in
achieving its stated missions.
2 Small Business Administration Loans
The SBA provides disaster loans to businesses and individuals for disaster-related losses which are
not covered by insurance. These disaster loans are structured differently than commercial loans,
which are typically only guaranteed by the SBA. Conversely, disaster loans are provided directly
by the government. A business may apply for a disaster loan in order to repair or replace entities
damaged or destroyed in a declared disaster. These may include: real estate, personal property,
machinery or other equipment, inventory, or business assets.
Following a disaster, regions are designated as “declared disaster areas”. Businesses and indi-
viduals located within these regions are eligible for financial assistance from the SBA. Businesses
of any size, most private nonprofit organizations, and homeowners may apply to the SBA for a
2
loan. Loans are intended to cover losses not fully protected by insurance. Three primary loan
types exist, including: 1) home and personal property loans; 2) business physical disaster loans;
and 3) economic injury disaster loans.
Although SBA loans were available following Hurricane Katrina, evidence suggests that the
process was mismanaged and that many eligible applicants were rejected. The Associated Press
released a report based on SBA data, finding that 55 percent of homeowners and businesses that
applied for help did not receive assistance. Of 318,953 applications processed, 175,463 were rejected
and 143,490 were approved. Further, of the approved loans, only 60 percent ultimately reached
recipients. SBA officials claimed that many applicants never accepted the loans as they found other
ways to rebuild. But, many applicants indicated that applications were abandoned as the process
took too long and was overly complicated (Weiss, 2010).
3 Related Studies
Many previous studies have focused on the ability of individuals and communities to recover from
disasters. The process of recovery for small businesses is more limited and we seek to contribute to
this literature. In particular, the disaster loan literature is narrow and was described by Nigg and
Tierney (1990) as “uneven”. However, this previous literature does suggest that the loan application
processes following disasters are problematic. Nigg and Tierney (1990) examined granted loans after
the Whitter-Narrows earthquake of 1987, finding mixed results on characteristics which led to loan
receipt. Tierney (1990) further found that, even when available, as after the 1993 Midwest Floods
and the 1994 Northridge Earthquake, very few eligible parties applied for loans. The United States
Government Accountability Office reviewed the particulars of the SBA loan procedures, leading to
extensive testimony on the attempts to modify and improve the loan process, due to shortcomings
following Hurricane Katrina (USGAO, 2010).
Several socio-demographic characteristics have emerged from this literature, however; these
inform the use of some of our independent variables, which are described in greater detail later, in
the model specification section of this article. There is some evidence that income plays a large
role in loan application: lower income families are somewhat less likely to seek aid (Cochrane,
1975) as are more affluent families (Rossi et al., 1978; Bolin and Bolton, 1986). Vulnerability to
cash flow problems and other income fluctuations has also been shown to cause problems in the
loan process (Runyan, 2006). Further, gender and race play a role: women are less likely to receive
funds (Nigg and Tierney, 1990), while white families recover much more quickly and at higher rates
than non-white families (Bolin and Bolton, 1986). However, much of the previous work suggests
that recovery, and the associated need for loans, may be linked to a range of factors, including the
nature of the business, its location, its profitability, its age, as well as a variety of characteristics of
the business owner, including the owner’s level of education or marital status.
While the literature on disaster loans may be limited, the investigation of loans is not novel
3
of itself. Considering the hurdle model employed in this article, similar frameworks have been
undertaken considering loan defaults (Danis and Pennington-Cross, 2005; Moffatt, 2005) as well
as commercial bank operating loans (Ahrendsen et al., 2011). Moffatt (2005) assumed that the
process which results in non-default is not the same as that which results in default: the event
that a borrower is a potential defaulter and the extent of the default by that borrower are treated
separately. We adopt this framework, presuming that the process of application for a loan is
separate from the process of the receipt and actual amount of the loan received.
This study contributes to the disaster literature by determining which business and owner
characteristics are associated with applying for a SBA loan and, ultimately, the receipt and amount
of that disaster loan. We also contribute by examining whether the SBA meets their stated goals
with respect to disaster recovery and the objective to “maintain and strengthen” small businesses
in the United States.
4 Method
This article addresses three decisions made in the SBA loan process. The first is made by the
business owner, and the second and third are made by the SBA. We investigate factors influencing
these decisions, focusing on the characteristics of the business and owner:
1. What businesses and owner characteristics were associated with loan application?
2. What businesses and owner characteristics were associated with loan receipt?
3. Given that a loan is granted, what businesses and owner characteristics were associated with
loan size?
In this section we discuss the method employed in estimating the equations associated with each
question.
Though these three questions signify multiple elements which contribute to a single process
(receiving a loan from the SBA), not all decisions are made by the same decision-maker.1 Therefore,
we estimate our model in two stages: first, modeling question (1), where the decision is made by
the business owner, then modeling questions (2) and (3), where the decisions are made by the SBA.
We first use a probit model to estimate loan application, following question (1). We then use a
double-hurdle model to estimate loan receipt and the loan associated amount, following questions
(2) and (3). The double-hurdle model is an extension on the standard Tobit model, and assumes
separation between the first and second stages. This is more flexible than the standard Tobit, which
1Though these three questions signify multiple elements which contribute to a single process (receiving a loanfrom the SBA), not all decisions are made by the same decision-maker.
4
assumes that the receipt of a loan is identical to the effect on the amount of the loan received.2
The model is given by equation 4.
f(y3̄x) =
{Pr[d2 = 0 | x] if y3 = 0
Pr[d2 = 1 | x] f(y3 | d2 = 1, x) if y3 > 0(1)
Equation 4 signifies the hurdle from the first to the second stage, wherein an individual “hurdles”
to the second stage, if he or she received a SBA loan (given in d2). If the left-hand side is equal
to zero in the first stage, the individual does not make it to the second stage. Following notation
used later in this section, y3 is the amount, in dollars, of the loan received, x is a matrix of business
owner and business characteristics, and d2 is = 1 if the business receives a loan, = 0 if otherwise.
It is necessary to address some potential issues which may bias our results, including problems
of sample selection and heteroscedasticity. First, there is some concern of non-random sample
selection: the businesses that apply for loans may not be a random sample of the entire population
of businesses. We therefore use an inverse-Mills ratio (IMR) from the first stage (application) and
include it in the second (receipt) and third stages (amount) in order to adjust for non-random
selection. The IMR both tests and adjusts for any selection bias which may be present.3 Second,
we also address issues of potential heteroscedasticity, which may exist in both the probit and
double-hurdle models. In order to do so, we relax the Gauss-Markov homoscedasticity assumption,
allowing for the existence of different covariances across groups. We cluster on two levels, based on
if a business is coastal or not.4
5 Model Specification
In this section, the model specification is discussed, including the equations used in calculating each
regression and the variables included in each regression equation. The first regression is specified
as a standard probit model. The second model is specified as a double-hurdle model, based on
standard hurdle model specification. In this specification the initial decision stage modeled as a
probit and the final participation stages as log-normal regression. For these equations, we follow
Duan et al. (1983) and Cameron and Trivedi (2009).
In the first regression, we use a probit regression model to determine whether or not a business
2We test a standard Tobit model as one of the robustness checks included in the Appendix. The standard Tobitis used in Model R2 in A. Table 1.
3The IMR is often used in regression analysis to account for sample selection bias, in a method first proposedby Heckman (1979). It works as follows: first, a regression for observing a positive outcome of the dependentvariable is modeled with a probit model. Then, the estimated parameters (xb) are used to calculate the IMR using
the calculation: PDF(xb)CDF(xb)
. Finally, the calculated IMR is then included as an additional explanatory variable insubsequent estimations. Results are given in the appendix for the method used in the paper, without the IMRcorrection.
4Approximately 67 percent of businesses in the sample are coastal.
5
owner applied for a SBA loan. Therefore,
Pr (d1 = 1 | x1) = Φ(x′1β1) (2)
Equation 2 is a normally distributed probability function regression, where d1 is whether or not
the business applied for a loan (d1 = 1 if the business applies for a loan, = 0 if otherwise) and x1
includes business owner and business traits, discussed below.
Next we consider the double-hurdle model. In the first stage, we use a probit model to determine
whether or not the business owner was approved for the loan. The businesses considered in this
stage are those which applied for a loan, a subsample of 148 businesses. Therefore,
Pr (d2 = 1 | x2) = Φ(x′2β2) (3)
Equation 3 is a normally distributed probability function regression, where d2 is whether or not the
business received a loan (d2 = 1 if the business receives a loan, = 0 if otherwise) and x2 includes
business owner and business characteristics, discussed below.
The third equation is different as we use a continuous value in dollars for the amount of the
loan received. We use a log-normal least squares regression for loan funds received, given that the
business was approved for a loan, passing the second stage. Therefore, for the third stage:
(ln y3 | d2 = 1, x3) = N[x′3β3, σ
23] (4)
Equation 4 is a log-normal least squares regression, where y3 is the amount, in dollars, of the loan
received and x3 includes business owner and business characteristics, discussed below.
We use equations 2, 3, and 4 in order to estimate the relationship between loan application, loan
approval, and received loan amount with a variety of business and individual characteristics. The
variables included in each equation need to reflect and considerations which impact the respective
decision in each regression, as well as the relevant factors identified in the literature.
In the first regression, the decision to apply is made by the business owner, therefore, the
terms are characteristics of that owner or internal to the business (x1). These include: 1) whether
the business is home-based, 2) stress related to the business, 3) perceived success level of the
business, 4) experience with a past disaster (one which closed the business 24-hours or more),
5) the qualitative perceived damage following Hurricane Katrina (ranging from no to very little
damage to catastrophic damage), and 6) the percent of income the family receives from the business.
In the second and third stages, the decision for approval and the decision for the amount
received, the factors considered will relate to the business owner and the business itself, as these
decisions are made by the SBA (x2 and x3). These variables are information that would be available
to the SBA. These includes 1) if the business experienced cash flow problems quarterly or more
frequently; this may relate to previous loans granted and ability to repay future loans, as well as 2)
6
the number of employees. Further, 3) whether an insurance claim was paid for the business or 4)
home is also included, as this would be essential knowledge for the SBA, which only grants disaster
loans for losses not covered by insurance.
In all stages, however, we include some traits that will be influential for all three questions
considered. We include a series of business owner characteristics, including: 1) gender, 2) education,
3) race, 4) veteran status, 5) marital status, and 6) experience in the industry. We also include
several characteristics of the business, including: 1) copreneurial status, 2) age of the business, 3)
whether it is located on the coast, 4) the dollar amount of damage from Hurricane Katrina, 5)
whether it is a sole proprietorship (according to Beesley (2013) 70 percent of businesses in the US
are sole proprietors), 6) whether the business has insurance, 7) the revenue of the business (less
than $50,000, $50,000 to $500,000, $500,000 to $1 mil, greater than $1 mil), and 8) several industry
dummies. For a full list of variables used in each regression, see Table 1 and Table 2.
7
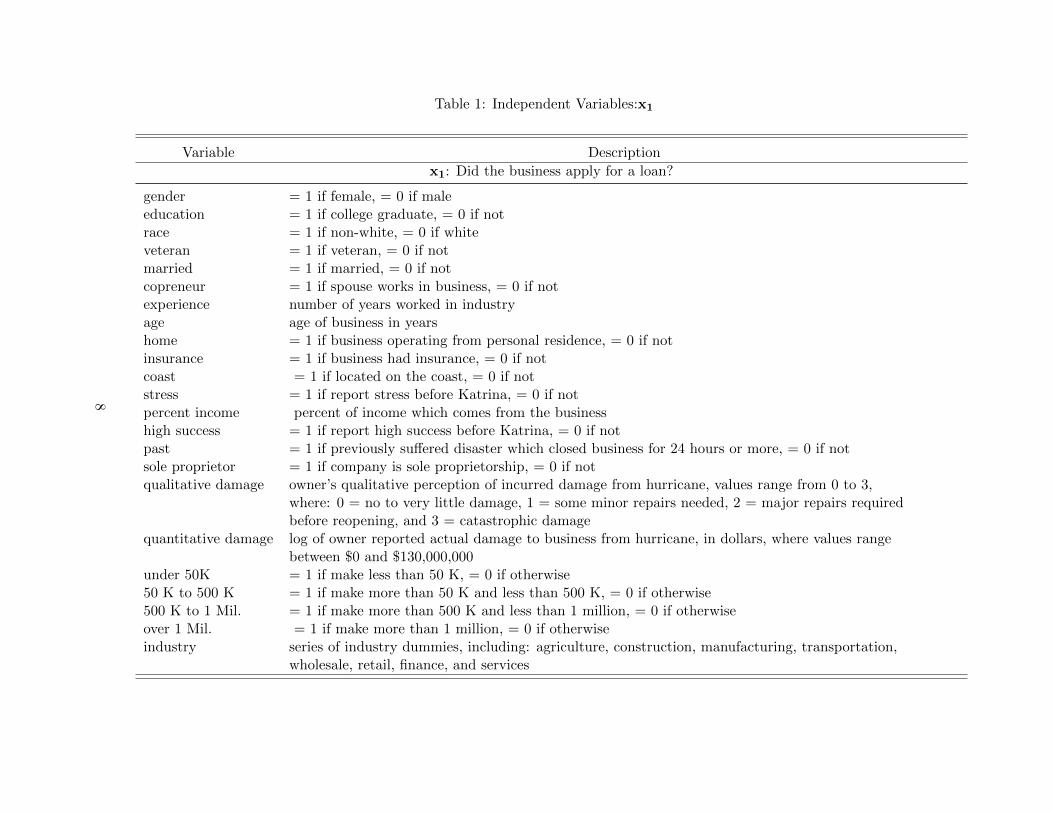
Table 1: Independent Variables:x1
Variable Description
x1: Did the business apply for a loan?
gender = 1 if female, = 0 if maleeducation = 1 if college graduate, = 0 if notrace = 1 if non-white, = 0 if whiteveteran = 1 if veteran, = 0 if notmarried = 1 if married, = 0 if notcopreneur = 1 if spouse works in business, = 0 if notexperience number of years worked in industryage age of business in yearshome = 1 if business operating from personal residence, = 0 if notinsurance = 1 if business had insurance, = 0 if notcoast = 1 if located on the coast, = 0 if notstress = 1 if report stress before Katrina, = 0 if notpercent income percent of income which comes from the businesshigh success = 1 if report high success before Katrina, = 0 if notpast = 1 if previously suffered disaster which closed business for 24 hours or more, = 0 if notsole proprietor = 1 if company is sole proprietorship, = 0 if notqualitative damage owner’s qualitative perception of incurred damage from hurricane, values range from 0 to 3,
where: 0 = no to very little damage, 1 = some minor repairs needed, 2 = major repairs requiredbefore reopening, and 3 = catastrophic damage
quantitative damage log of owner reported actual damage to business from hurricane, in dollars, where values rangebetween $0 and $130,000,000
under 50K = 1 if make less than 50 K, = 0 if otherwise50 K to 500 K = 1 if make more than 50 K and less than 500 K, = 0 if otherwise500 K to 1 Mil. = 1 if make more than 500 K and less than 1 million, = 0 if otherwiseover 1 Mil. = 1 if make more than 1 million, = 0 if otherwiseindustry series of industry dummies, including: agriculture, construction, manufacturing, transportation,
wholesale, retail, finance, and services
8
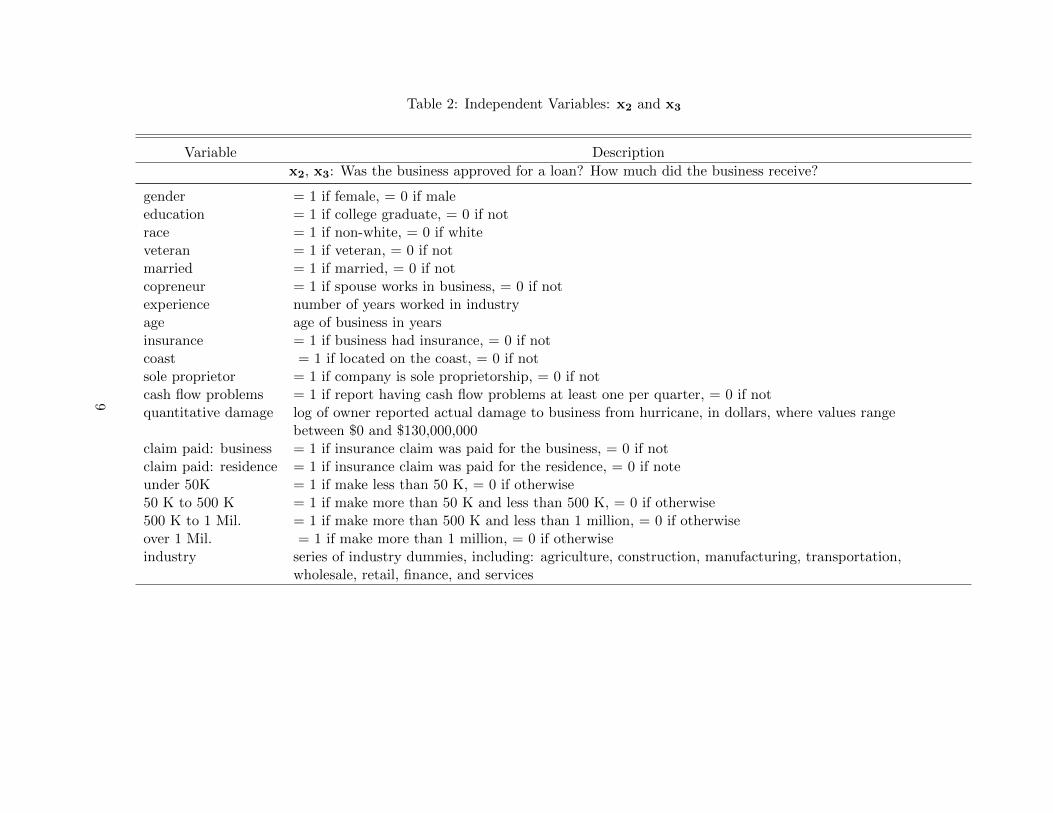
Table 2: Independent Variables: x2 and x3
Variable Description
x2, x3: Was the business approved for a loan? How much did the business receive?
gender = 1 if female, = 0 if maleeducation = 1 if college graduate, = 0 if notrace = 1 if non-white, = 0 if whiteveteran = 1 if veteran, = 0 if notmarried = 1 if married, = 0 if notcopreneur = 1 if spouse works in business, = 0 if notexperience number of years worked in industryage age of business in yearsinsurance = 1 if business had insurance, = 0 if notcoast = 1 if located on the coast, = 0 if notsole proprietor = 1 if company is sole proprietorship, = 0 if notcash flow problems = 1 if report having cash flow problems at least one per quarter, = 0 if notquantitative damage log of owner reported actual damage to business from hurricane, in dollars, where values range
between $0 and $130,000,000claim paid: business = 1 if insurance claim was paid for the business, = 0 if notclaim paid: residence = 1 if insurance claim was paid for the residence, = 0 if noteunder 50K = 1 if make less than 50 K, = 0 if otherwise50 K to 500 K = 1 if make more than 50 K and less than 500 K, = 0 if otherwise500 K to 1 Mil. = 1 if make more than 500 K and less than 1 million, = 0 if otherwiseover 1 Mil. = 1 if make more than 1 million, = 0 if otherwiseindustry series of industry dummies, including: agriculture, construction, manufacturing, transportation,
wholesale, retail, finance, and services
9
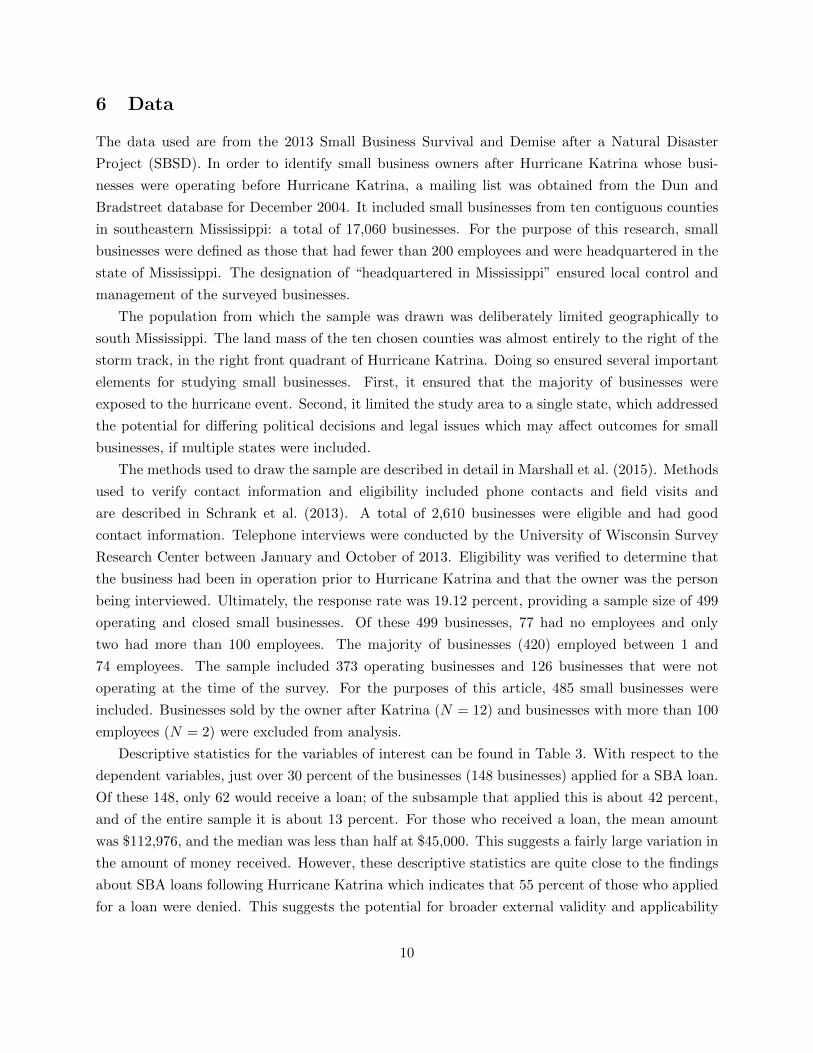
6 Data
The data used are from the 2013 Small Business Survival and Demise after a Natural Disaster
Project (SBSD). In order to identify small business owners after Hurricane Katrina whose busi-
nesses were operating before Hurricane Katrina, a mailing list was obtained from the Dun and
Bradstreet database for December 2004. It included small businesses from ten contiguous counties
in southeastern Mississippi: a total of 17,060 businesses. For the purpose of this research, small
businesses were defined as those that had fewer than 200 employees and were headquartered in the
state of Mississippi. The designation of “headquartered in Mississippi” ensured local control and
management of the surveyed businesses.
The population from which the sample was drawn was deliberately limited geographically to
south Mississippi. The land mass of the ten chosen counties was almost entirely to the right of the
storm track, in the right front quadrant of Hurricane Katrina. Doing so ensured several important
elements for studying small businesses. First, it ensured that the majority of businesses were
exposed to the hurricane event. Second, it limited the study area to a single state, which addressed
the potential for differing political decisions and legal issues which may affect outcomes for small
businesses, if multiple states were included.
The methods used to draw the sample are described in detail in Marshall et al. (2015). Methods
used to verify contact information and eligibility included phone contacts and field visits and
are described in Schrank et al. (2013). A total of 2,610 businesses were eligible and had good
contact information. Telephone interviews were conducted by the University of Wisconsin Survey
Research Center between January and October of 2013. Eligibility was verified to determine that
the business had been in operation prior to Hurricane Katrina and that the owner was the person
being interviewed. Ultimately, the response rate was 19.12 percent, providing a sample size of 499
operating and closed small businesses. Of these 499 businesses, 77 had no employees and only
two had more than 100 employees. The majority of businesses (420) employed between 1 and
74 employees. The sample included 373 operating businesses and 126 businesses that were not
operating at the time of the survey. For the purposes of this article, 485 small businesses were
included. Businesses sold by the owner after Katrina (N = 12) and businesses with more than 100
employees (N = 2) were excluded from analysis.
Descriptive statistics for the variables of interest can be found in Table 3. With respect to the
dependent variables, just over 30 percent of the businesses (148 businesses) applied for a SBA loan.
Of these 148, only 62 would receive a loan; of the subsample that applied this is about 42 percent,
and of the entire sample it is about 13 percent. For those who received a loan, the mean amount
was $112,976, and the median was less than half at $45,000. This suggests a fairly large variation in
the amount of money received. However, these descriptive statistics are quite close to the findings
about SBA loans following Hurricane Katrina which indicates that 55 percent of those who applied
for a loan were denied. This suggests the potential for broader external validity and applicability
10
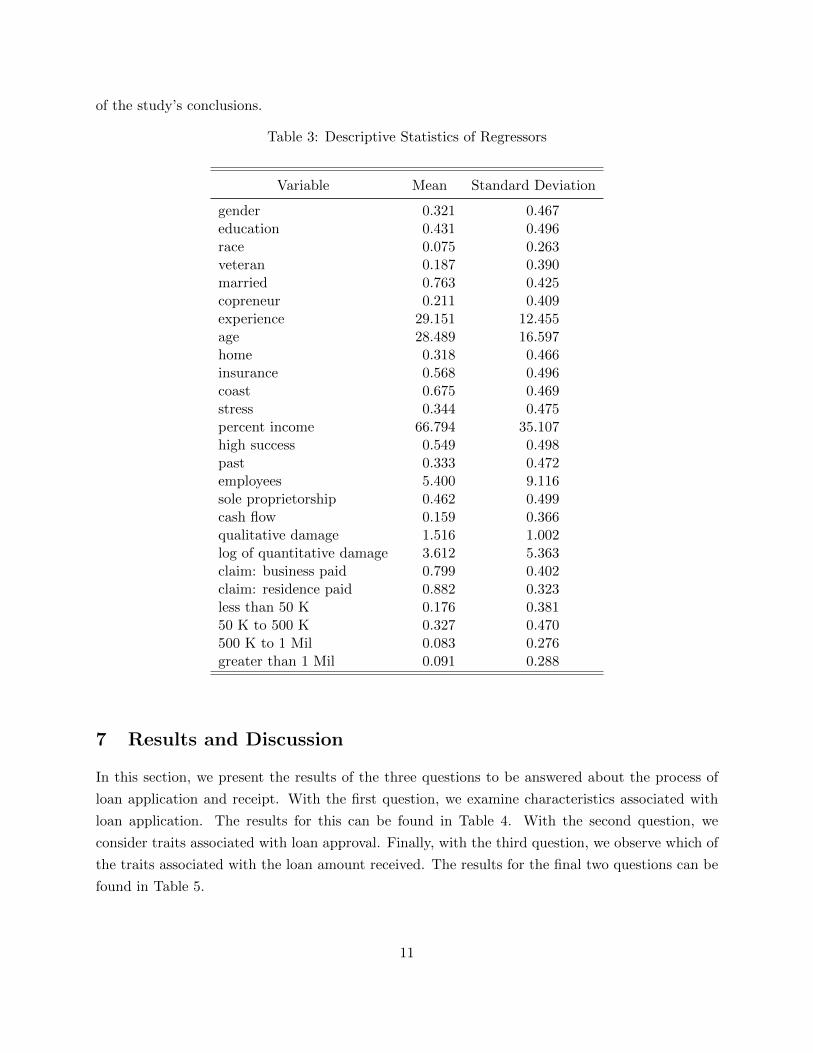
of the study’s conclusions.
Table 3: Descriptive Statistics of Regressors
Variable Mean Standard Deviation
gender 0.321 0.467education 0.431 0.496race 0.075 0.263veteran 0.187 0.390married 0.763 0.425copreneur 0.211 0.409experience 29.151 12.455age 28.489 16.597home 0.318 0.466insurance 0.568 0.496coast 0.675 0.469stress 0.344 0.475percent income 66.794 35.107high success 0.549 0.498past 0.333 0.472employees 5.400 9.116sole proprietorship 0.462 0.499cash flow 0.159 0.366qualitative damage 1.516 1.002log of quantitative damage 3.612 5.363claim: business paid 0.799 0.402claim: residence paid 0.882 0.323less than 50 K 0.176 0.38150 K to 500 K 0.327 0.470500 K to 1 Mil 0.083 0.276greater than 1 Mil 0.091 0.288
7 Results and Discussion
In this section, we present the results of the three questions to be answered about the process of
loan application and receipt. With the first question, we examine characteristics associated with
loan application. The results for this can be found in Table 4. With the second question, we
consider traits associated with loan approval. Finally, with the third question, we observe which of
the traits associated with the loan amount received. The results for the final two questions can be
found in Table 5.
11
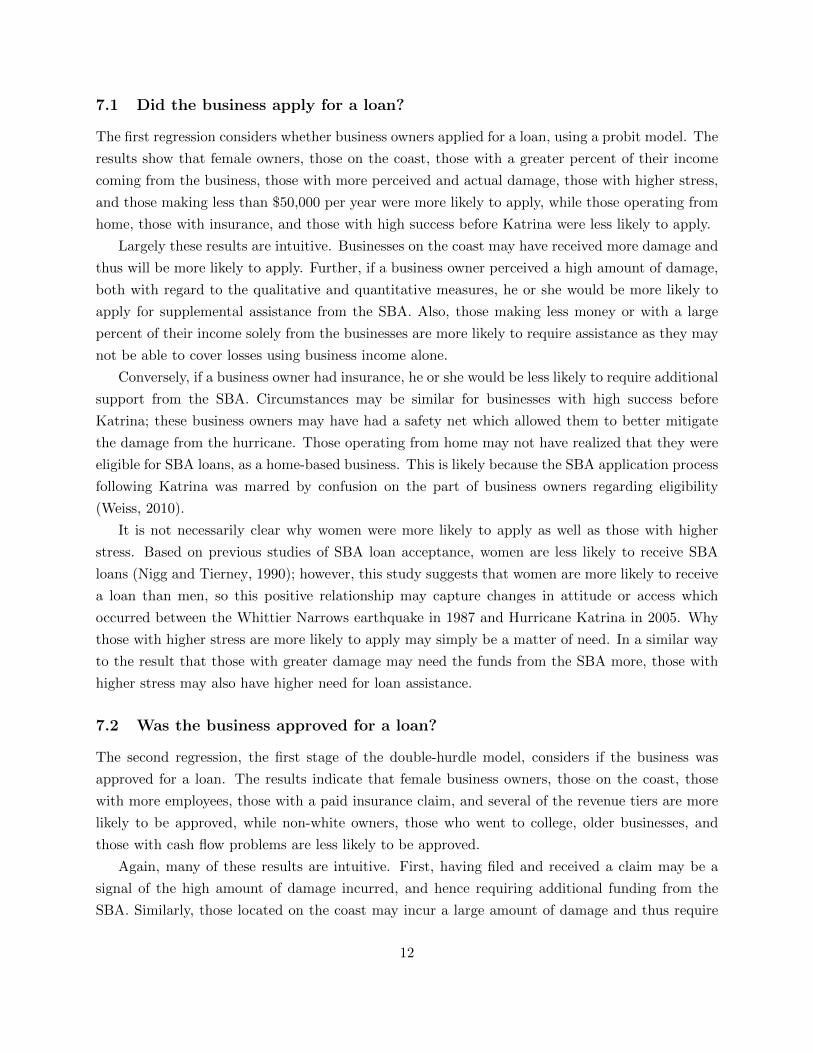
7.1 Did the business apply for a loan?
The first regression considers whether business owners applied for a loan, using a probit model. The
results show that female owners, those on the coast, those with a greater percent of their income
coming from the business, those with more perceived and actual damage, those with higher stress,
and those making less than $50,000 per year were more likely to apply, while those operating from
home, those with insurance, and those with high success before Katrina were less likely to apply.
Largely these results are intuitive. Businesses on the coast may have received more damage and
thus will be more likely to apply. Further, if a business owner perceived a high amount of damage,
both with regard to the qualitative and quantitative measures, he or she would be more likely to
apply for supplemental assistance from the SBA. Also, those making less money or with a large
percent of their income solely from the businesses are more likely to require assistance as they may
not be able to cover losses using business income alone.
Conversely, if a business owner had insurance, he or she would be less likely to require additional
support from the SBA. Circumstances may be similar for businesses with high success before
Katrina; these business owners may have had a safety net which allowed them to better mitigate
the damage from the hurricane. Those operating from home may not have realized that they were
eligible for SBA loans, as a home-based business. This is likely because the SBA application process
following Katrina was marred by confusion on the part of business owners regarding eligibility
(Weiss, 2010).
It is not necessarily clear why women were more likely to apply as well as those with higher
stress. Based on previous studies of SBA loan acceptance, women are less likely to receive SBA
loans (Nigg and Tierney, 1990); however, this study suggests that women are more likely to receive
a loan than men, so this positive relationship may capture changes in attitude or access which
occurred between the Whittier Narrows earthquake in 1987 and Hurricane Katrina in 2005. Why
those with higher stress are more likely to apply may simply be a matter of need. In a similar way
to the result that those with greater damage may need the funds from the SBA more, those with
higher stress may also have higher need for loan assistance.
7.2 Was the business approved for a loan?
The second regression, the first stage of the double-hurdle model, considers if the business was
approved for a loan. The results indicate that female business owners, those on the coast, those
with more employees, those with a paid insurance claim, and several of the revenue tiers are more
likely to be approved, while non-white owners, those who went to college, older businesses, and
those with cash flow problems are less likely to be approved.
Again, many of these results are intuitive. First, having filed and received a claim may be a
signal of the high amount of damage incurred, and hence requiring additional funding from the
SBA. Similarly, those located on the coast may incur a large amount of damage and thus require
12
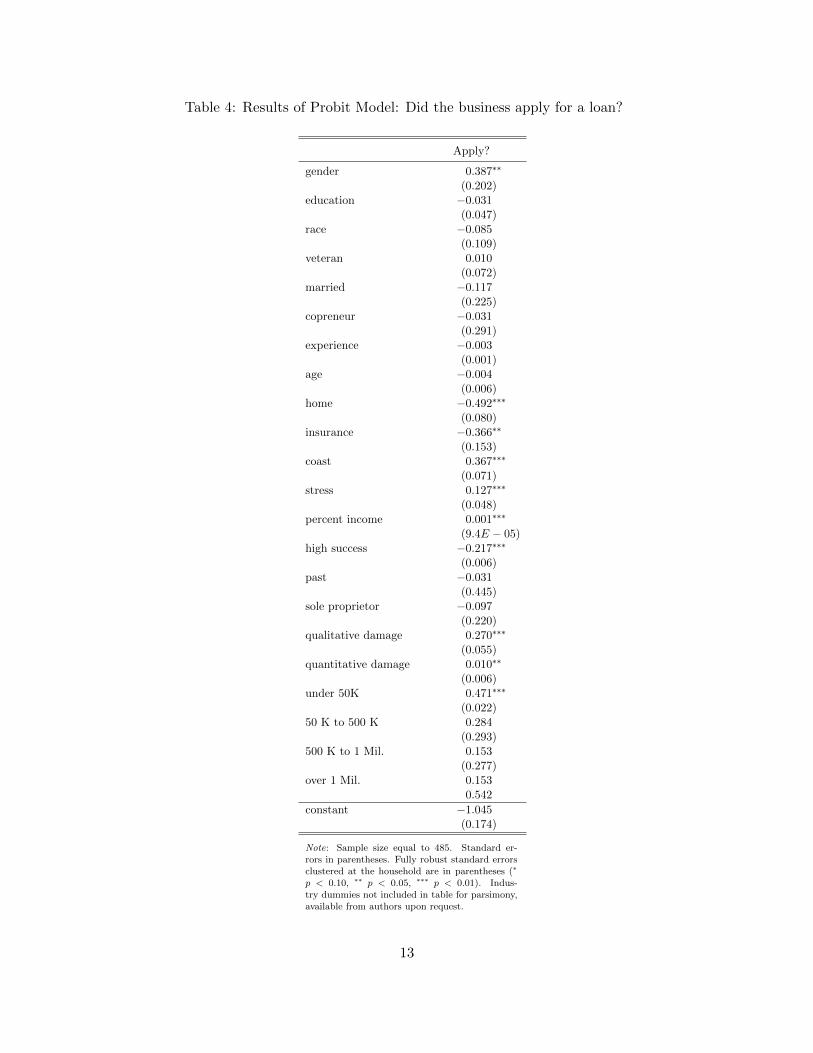
Table 4: Results of Probit Model: Did the business apply for a loan?
Apply?
gender 0.387∗∗
(0.202)education −0.031
(0.047)race −0.085
(0.109)veteran 0.010
(0.072)married −0.117
(0.225)copreneur −0.031
(0.291)experience −0.003
(0.001)age −0.004
(0.006)home −0.492∗∗∗
(0.080)insurance −0.366∗∗
(0.153)coast 0.367∗∗∗
(0.071)stress 0.127∗∗∗
(0.048)percent income 0.001∗∗∗
(9.4E − 05)high success −0.217∗∗∗
(0.006)past −0.031
(0.445)sole proprietor −0.097
(0.220)qualitative damage 0.270∗∗∗
(0.055)quantitative damage 0.010∗∗
(0.006)under 50K 0.471∗∗∗
(0.022)50 K to 500 K 0.284
(0.293)500 K to 1 Mil. 0.153
(0.277)over 1 Mil. 0.153
0.542
constant −1.045(0.174)
Note: Sample size equal to 485. Standard er-rors in parentheses. Fully robust standard errorsclustered at the household are in parentheses (∗
p < 0.10, ∗∗ p < 0.05, ∗∗∗ p < 0.01). Indus-try dummies not included in table for parsimony,available from authors upon request.
13
greater assistance. Second, the significance of the revenue tiers indicates that revenue makes a
difference in loan approval from the SBA; however, this seems to be based on need, as well as
ability to repay: those making $500,000 to $1 million have the largest coefficient, followed by those
making less than $50,000. This may also explain why those with cash flow problems may be less
likely to be approved, as they may have difficulty with repayment. Finally, that non-white business
owners are less likely to be approved for loans follows previous literature (Bolin and Bolton, 1986)
suggesting that non-white businesses may be disadvantaged in the disaster recovery process.
The result that female owners and businesses with more employees are more likely to be approved
while those who went to college and older businesses are less likely to be approved for loans are
somewhat puzzling. The first result, regarding female owners, is contrary to previous research (Nigg
and Tierney, 1990), though may indicate cultural shifts between the study periods. Second, the
larger number of employees may indicate a greater level of economic loss, and thus greater need
of assistance. The final results about education and age may suggest a relationship with need. It
may be that owners with a college education and older businesses are less likely to be approved for
loans due to a lack of need or the ability to receive loans from other sources. The SBA provides
loans based on the ability to find credit elsewhere, so if a business is able to find loans from another
bank, then, it is possible that they may not be approved for a loan from the SBA.
Finally, the IMR is also significant in this regression. As discussed above, this indicates that
businesses which apply for loans are not a random sample. However, the inclusion of the IMR
simultaneously corrects for the selection bias. We include the estimates of the double-hurdle model,
without the IMR in Table 4 for comparison. Without the IMR, fewer coefficients are statistically
significant. These include age of the business, whether the business is coastal, number of employees,
whether the business had cash flow problems, and one revenue tier. Similarly, one revenue tier
(the greater than $1 million tier) is now statistically significant. There is one change in sign:
with the IMR, whether a business had a claim paid is statistically significant and positive, while
without the IMR it is statistically significant and negative. Taken together, these differences in
results demonstrate the importance of the IMR adjustment in our regression in order to correct for
selection bias.
7.3 How much did the business receive as a loan?
The third regression, the second stage of the double-hurdle model, considers the loan amount
received by the business. The results of this stage indicate that married business owners, those
with more experience, those with previous cash flow problems, and those with a paid insurance
claim on their residence were more likely to receive a larger loan, while female owners, copreneurial
owners, businesses on the coast, those with a paid insurance claim on their business, and several
revenue tiers were less likely to receive a large loan.
These results are again largely intuitive. First, though those with cash flow problems receiving
14
larger amounts may be contrary to expectation, it may be due to the need these business owners
have for larger loans, due to these problems, that brings this result. Additionally, cash flow problems
may be associated with previous loan repayments that show an ability to repay loans, despite cash
flow issues. Similarly, business owners with more experience may have demonstrated an ability to
repay loans previously. Second, those on the coast may have alternative sources of income and thus
only require smaller loans. Third, the results of the revenue terms are intuitive. Those making less
in the lower revenue tiers may not have the ability to readily repay the loan, and therefore will
receive smaller loans, while those making more in higher revenue tiers may be unable to demonstrate
the same need for a loan.
It is an interesting result that those with a paid insurance claim on the home are more likely
to receive higher amounts while those with paid insurance claim on the business are more likely to
receive lower amounts. This may be because those with a paid claim for their home additionally have
a business property and separate damage on the business, thus requiring supplemental assistance
from the SBA. Conversely, those with a paid business insurance claim may have less damage still
not covered by insurance, and therefore receive lower loans.
The result that women and copreneurial couples receive lower loans, while married business
owners receive larger loans, is somewhat contrary to expectation. However, that women receive
lower loan amounts may be associated with the previous result by Nigg and Tierney (1990) that
women are less likely to receive a loan. We do not observe women getting fewer loans, but we instead
observe lower loan amounts for those which do receive a loan. The coprenerial result is puzzling,
particularly as marriage is a positive and significant factor in loan amount received. However, it
may be the case that those with a spouse working in the business may have better ability to access
credit or mitigate the effects of damage, and therefore require less loan support from the SBA.
Finally, the IMR is again significant in this regression. This indicates that businesses which
apply for loans are not a random sample, though the IMR corrects for this bias. We include the
estimates of the double-hurdle model, without the IMR in Table 4. Without including the IMR,
experience of the business owner, if a claim was paid (both business and residential), and the top
three revenue tiers are no longer statistically significant, while the age of the business and the
amount of quantitative damage are now statistically significant. There is also one change in sign:
with the IMR the coefficient on whether the business was coastal was statistically significant and
negative, while without the IMR it is statistically significant and positive. As in the previous stage,
these differences in results demonstrate the importance of the IMR adjustment, in order to correct
for selection bias.
Together, these results suggest that the characteristics which encourage a business owner to
apply for a loan are different from those which ultimately result in receipt of a loan. A few
important factors through all stages emerge, including: the income of business, whether the business
had insurance and whether an insurance claim was paid, and the gender of the business owner.
15
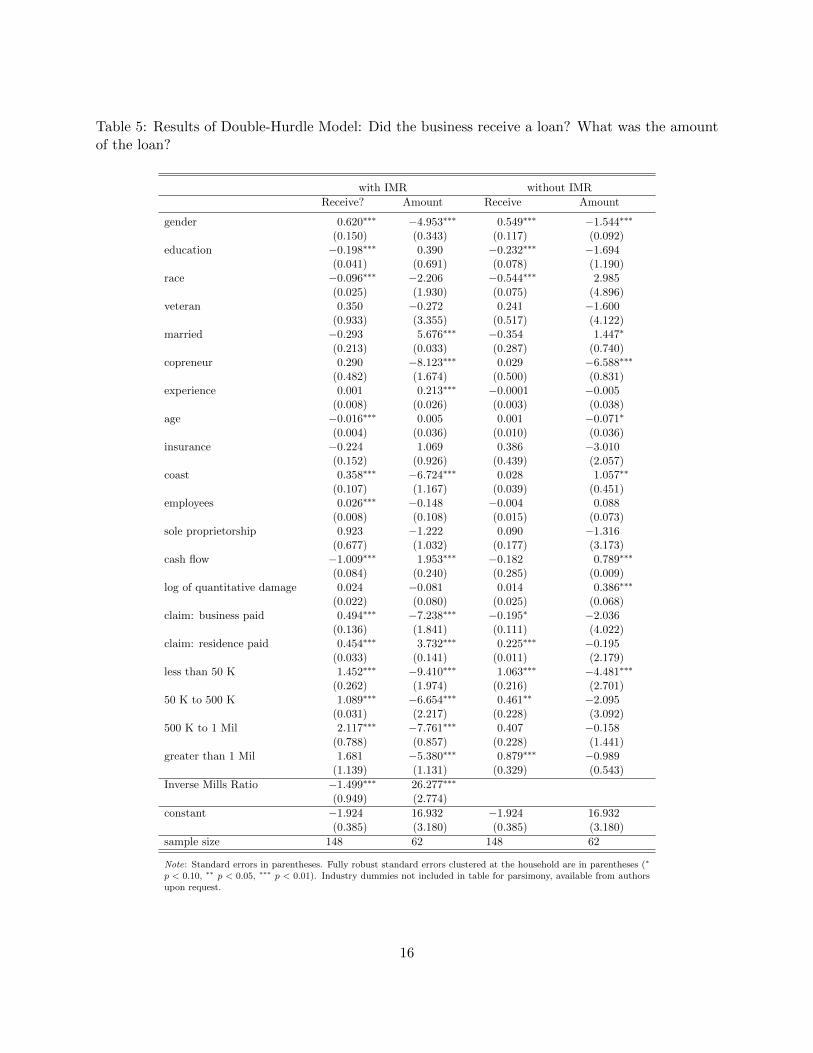
Table 5: Results of Double-Hurdle Model: Did the business receive a loan? What was the amountof the loan?
with IMR without IMR
Receive? Amount Receive Amount
gender 0.620∗∗∗ −4.953∗∗∗ 0.549∗∗∗ −1.544∗∗∗
(0.150) (0.343) (0.117) (0.092)education −0.198∗∗∗ 0.390 −0.232∗∗∗ −1.694
(0.041) (0.691) (0.078) (1.190)race −0.096∗∗∗ −2.206 −0.544∗∗∗ 2.985
(0.025) (1.930) (0.075) (4.896)veteran 0.350 −0.272 0.241 −1.600
(0.933) (3.355) (0.517) (4.122)married −0.293 5.676∗∗∗ −0.354 1.447∗
(0.213) (0.033) (0.287) (0.740)copreneur 0.290 −8.123∗∗∗ 0.029 −6.588∗∗∗
(0.482) (1.674) (0.500) (0.831)experience 0.001 0.213∗∗∗ −0.0001 −0.005
(0.008) (0.026) (0.003) (0.038)age −0.016∗∗∗ 0.005 0.001 −0.071∗
(0.004) (0.036) (0.010) (0.036)insurance −0.224 1.069 0.386 −3.010
(0.152) (0.926) (0.439) (2.057)coast 0.358∗∗∗ −6.724∗∗∗ 0.028 1.057∗∗
(0.107) (1.167) (0.039) (0.451)employees 0.026∗∗∗ −0.148 −0.004 0.088
(0.008) (0.108) (0.015) (0.073)sole proprietorship 0.923 −1.222 0.090 −1.316
(0.677) (1.032) (0.177) (3.173)cash flow −1.009∗∗∗ 1.953∗∗∗ −0.182 0.789∗∗∗
(0.084) (0.240) (0.285) (0.009)log of quantitative damage 0.024 −0.081 0.014 0.386∗∗∗
(0.022) (0.080) (0.025) (0.068)claim: business paid 0.494∗∗∗ −7.238∗∗∗ −0.195∗ −2.036
(0.136) (1.841) (0.111) (4.022)claim: residence paid 0.454∗∗∗ 3.732∗∗∗ 0.225∗∗∗ −0.195
(0.033) (0.141) (0.011) (2.179)less than 50 K 1.452∗∗∗ −9.410∗∗∗ 1.063∗∗∗ −4.481∗∗∗
(0.262) (1.974) (0.216) (2.701)50 K to 500 K 1.089∗∗∗ −6.654∗∗∗ 0.461∗∗ −2.095
(0.031) (2.217) (0.228) (3.092)500 K to 1 Mil 2.117∗∗∗ −7.761∗∗∗ 0.407 −0.158
(0.788) (0.857) (0.228) (1.441)greater than 1 Mil 1.681 −5.380∗∗∗ 0.879∗∗∗ −0.989
(1.139) (1.131) (0.329) (0.543)
Inverse Mills Ratio −1.499∗∗∗ 26.277∗∗∗
(0.949) (2.774)
constant −1.924 16.932 −1.924 16.932(0.385) (3.180) (0.385) (3.180)
sample size 148 62 148 62
Note: Standard errors in parentheses. Fully robust standard errors clustered at the household are in parentheses (∗
p < 0.10, ∗∗ p < 0.05, ∗∗∗ p < 0.01). Industry dummies not included in table for parsimony, available from authorsupon request.
16
Many of these results follow expectation and highlight the success of the SBA in assisting businesses
with the greatest need, balanced with the realities of loan repayment.
A particularly interesting result is that pertaining to female business owners. Our results are
somewhat contrary to previous research and indicate that women are more likely to receive loans,
though they are also more likely to receive smaller amounts. This is worthy of investigation in the
future, in particular due to the mission of the SBA to assist female business owners (SBA, nd).
8 Summary and Conclusions
Despite tremendous damage incurred in many regions following Hurricane Katrina, it is not clear
what demand existed for reconstruction assistance. Though many billions of dollars were pledged by
the United States government for rebuilding, how the funding was allocated to small businesses has
not been evident. Disaster relief assistance from the SBA is one of the methods of that provision.
In this study we investigated the factors that influence the application for, approval of, and receipt
of SBA disaster loans after Hurricane Katrina.
We are able to draw several important policy conclusions from the results. First, female business
owners are more likely to apply for and receive loans from the SBA. However, the loans that
they receive are more likely to be small. This result is different from that of previous literature,
which suggests that women are less likely to receive loans. This may signal a turn in attitude
or advantage for female business owners, who are underrepresented in small business ownership.
However, non-white business owners remain disadvantaged in the loan process, and are less likely
to be approved for loans; only 36 percent of non-white business owners who applied for loans
were approved by the SBA in our sample. This finding supports previous literature, and suggests
that not all underrepresented groups of small business owners are being effectively targeted for
loans. This indicates that there is room for improvement by the SBA for targeting these generally
underrepresented groups. Improving targeting of these groups may improve the success of the SBA
in meeting its mission of strengthening underrepresented groups with business development.
Additionally, we are able to conclude the importance of revenue and insurance in the SBA loan
process. Revenue is an important factor in application and approval for a loan, and need and
ability to repay influences the ultimately amount received. Similarly, results indicate that those
with insurance are less likely to apply and those with paid claims are less likely to receive loans.
This is logical and further suggests success on the part of the SBA in targeting those with the
greatest need which is uncovered by other sources.
Taken together, the results indicate achievement by the SBA in finding both those with need
and ability to repay, essential components of their mission, while still finding that there is room for
improvement in targeting unrepresented groups. These outcomes may be at odds with one another,
however, but is worthy of investigation in the future. Particularly the interaction between female
business owners and the ability to repay: this potential interaction may show whether women
17
receive smaller amounts because they have less ability to pay back, they ask for less, or due to some
bias in the SBA granting process.
Further, more work in the future should address the different types of SBA loans available, as
well as the impact of these different loans. While some previous work has determined that loans do
not increase the success of the business or probability of survival (Alesch et al., 2001; Haynes et al.,
2011), the specific impact of SBA loans has not been investigated. The disaggregation of demand
for types of loans could help to determine which loans were the most needed, following Hurricane
Katrina, as well as the relevant impact of each on the survival and success of the business in the
future.
18
References
Ahrendsen, B., B. Dixon, L. Settlage, S. Koenig, and C. Dodson (2011). A triple-hurdle modelof U.S. commercial bank use of guaranteed operating loans and interest assistance. AgriculturalFinance Review 71 (3), 310–328.
Alesch, D., J. Holly, E. Mittler, and R. Nagy (2001). Organization at risk: What happens whensmall businesses and not-for-profits encounter natural disasters. Public Entity Risk Institute.
Bolin, R. and P. Bolton (1986). Race, religion, and ethnicity in disaster recovery. Program on Envi-ronment and Behavior Monograph No. 42, Institute of Environment and Behavior, the Universityof Colorado.
Cameron, A. and P. Trivedi (2009). Microeconometrics: Methods and Applications. CambridgeUniversity Press.
Cochrane, H. (1975). Natural hazards and their distributive effects. Institute of Behavioral Science,University of Colorado.
Danis, M. and A. Pennington-Cross (2005). A dynamic look at subprime loan performance. TheJournal of Fixed Income 15 (1), 28–39.
Duan, N., W. Manning, C. Morris, and J. Newhouse (1983). A comparison of alternative modelsfor the demand of medical care. Journal of Business and Economic Statistics 1 (2), 114–126.
FEMA (2013). About Hurricane Katrina. http://www.fema.gov/response-recovery/
about-hurricane-katrina. Federal Emergency Management Agency. Accessed March 15, 2014.
Haynes, G., S. Danes, and K. Stafford (2011). Influence of federal disaster assistance on familybusiness survival and success. Journal of Contingencies and Crisis Management 19 (2), 86–98.
Heckman, J. (1979). Sample selection as a specification error. Econometrica 47 (1), 153–161.
Marshall, M., S. Sydnor, L. Niehm, and H. Schrank (2015). Predicting small business demise aftera natural disaster: An analysis of pre-existing conditions. Natural Hazards 79 (1), 331–354.
Moffatt, P. (2005). Hurdle models of loan default. Journal of the Operational Research Society 56,1063–1071.
Nigg, J. and K. Tierney (1990). Explaining differential outcomes in the small business disasterloan application process. Preliminary Paper No. 156, University of Delaware, Disaster ResearchCenter.
Rossi, P., J. Wright, S. Wright, and E. Weber-Burdin (1978). Are there long-term effects of americannatural disasters? Mass Emergencies 3 (197), 117–132.
Runyan, R. (2006). Small businesses in the face of crisis: Identifying barriers to recovery fromnatural disasters. Journal of Contingencies and Crisis Management 14 (1), 12–26.
SBA (2013). U.S. Small Business Administration. http://www.sba.gov. Small Business Admin-istration. Accessed January 12, 2014.
19
SBA (nd). U.S. Small Business Administration, Office of Women’s Business Ownership. https:
//www.sba.gov/offices/headquarters/wbo. Small Business Administration. Accessed March8, 2016.
Schrank, H., M. Marshall, A. Hall-Phillips, R. Wiatt, and N. Jones (2013). Small-business demiseand recovery after Katrina: Rate of survival and demise. Natural Hazards 65, 2353–2375.
Tierney, K. (1990). Impacts of recent U.S. disasters on businesses: The 1993 Midwest floods andthe 1994 Northridge earthquake. Preliminary Paper No. 230, University of Delaware, DisasterResearch Center.
USGAO (2010). Testimony before the Committee on Small of Business and Entrepreneurship, U.S.Senate. United States Government Accountability Office: Statement of William B. Shear, Direc-tor, Financial Markets and Community Investment: Small Business Administration ContinuedAttention Needed to Address Reforms to the Disaster Loan Program. May 19, 2010.
Weiss, M. (2010). No compassion for Katrina loan applicants. Associated Press.
20
Appendix
For completeness, we estimate three robustness checks. First, designated R1 and found in columns(1) and (2) in Table 6 below, we estimate stage 1 (application) and stage 2 (approval) as probitsand stage 3 (amount) using ordinary least squares (OLS). Second, designated R2 and found incolumns (3) and (4), we estimate stage 1 as a probit, stage 2 as a Tobit, and stage 3 as a truncatedregression. Finally, designated R3 and found in columns (5) and (6), we combine stages 1 and 2 (=1 if business applies for a loan and is accepted, = 0 otherwise) and estimate as a probit and thenestimate the next stage (amount) with OLS.
In R1 and R2, we do not include the first stage estimates, as they do not change from the resultsreported in Table 4.
21
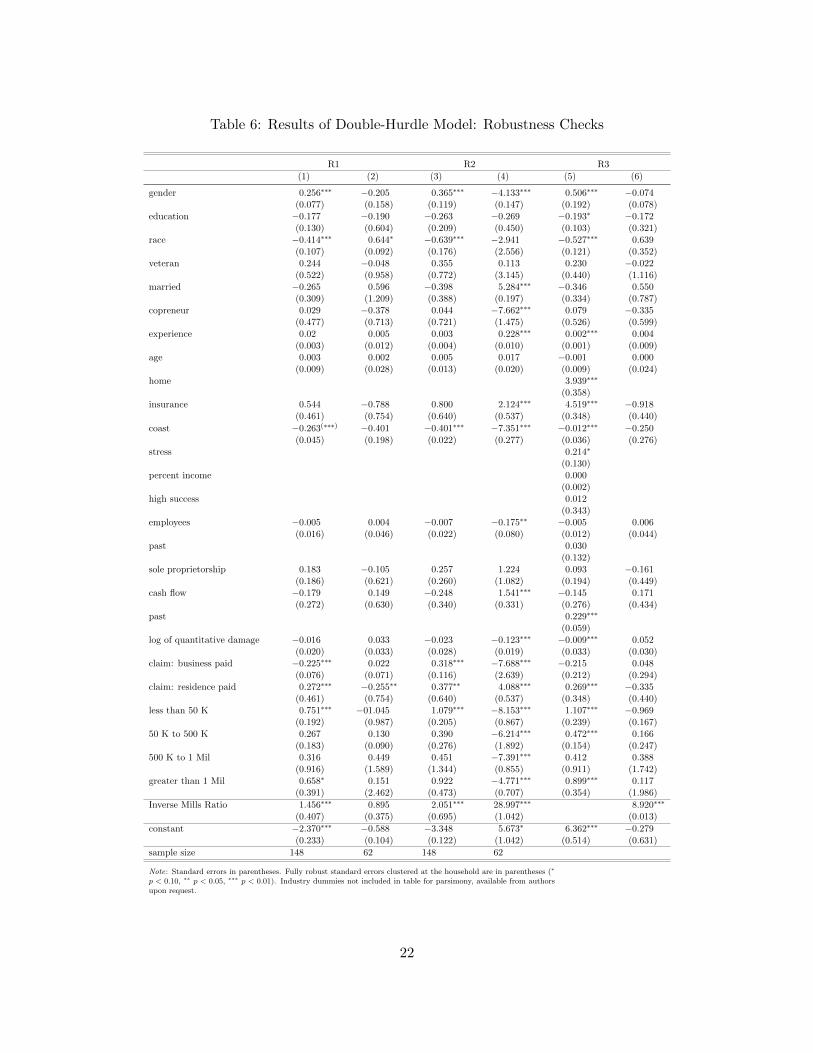
Table 6: Results of Double-Hurdle Model: Robustness Checks
R1 R2 R3
(1) (2) (3) (4) (5) (6)
gender 0.256∗∗∗ −0.205 0.365∗∗∗ −4.133∗∗∗ 0.506∗∗∗ −0.074(0.077) (0.158) (0.119) (0.147) (0.192) (0.078)
education −0.177 −0.190 −0.263 −0.269 −0.193∗ −0.172(0.130) (0.604) (0.209) (0.450) (0.103) (0.321)
race −0.414∗∗∗ 0.644∗ −0.639∗∗∗ −2.941 −0.527∗∗∗ 0.639(0.107) (0.092) (0.176) (2.556) (0.121) (0.352)
veteran 0.244 −0.048 0.355 0.113 0.230 −0.022(0.522) (0.958) (0.772) (3.145) (0.440) (1.116)
married −0.265 0.596 −0.398 5.284∗∗∗ −0.346 0.550(0.309) (1.209) (0.388) (0.197) (0.334) (0.787)
copreneur 0.029 −0.378 0.044 −7.662∗∗∗ 0.079 −0.335(0.477) (0.713) (0.721) (1.475) (0.526) (0.599)
experience 0.02 0.005 0.003 0.228∗∗∗ 0.002∗∗∗ 0.004(0.003) (0.012) (0.004) (0.010) (0.001) (0.009)
age 0.003 0.002 0.005 0.017 −0.001 0.000(0.009) (0.028) (0.013) (0.020) (0.009) (0.024)
home 3.939∗∗∗
(0.358)insurance 0.544 −0.788 0.800 2.124∗∗∗ 4.519∗∗∗ −0.918
(0.461) (0.754) (0.640) (0.537) (0.348) (0.440)
coast −0.263(∗∗∗) −0.401 −0.401∗∗∗ −7.351∗∗∗ −0.012∗∗∗ −0.250(0.045) (0.198) (0.022) (0.277) (0.036) (0.276)
stress 0.214∗
(0.130)percent income 0.000
(0.002)high success 0.012
(0.343)employees −0.005 0.004 −0.007 −0.175∗∗ −0.005 0.006
(0.016) (0.046) (0.022) (0.080) (0.012) (0.044)past 0.030
(0.132)sole proprietorship 0.183 −0.105 0.257 1.224 0.093 −0.161
(0.186) (0.621) (0.260) (1.082) (0.194) (0.449)cash flow −0.179 0.149 −0.248 1.541∗∗∗ −0.145 0.171
(0.272) (0.630) (0.340) (0.331) (0.276) (0.434)past 0.229∗∗∗
(0.059)log of quantitative damage −0.016 0.033 −0.023 −0.123∗∗∗ −0.009∗∗∗ 0.052
(0.020) (0.033) (0.028) (0.019) (0.033) (0.030)claim: business paid −0.225∗∗∗ 0.022 0.318∗∗∗ −7.688∗∗∗ −0.215 0.048
(0.076) (0.071) (0.116) (2.639) (0.212) (0.294)claim: residence paid 0.272∗∗∗ −0.255∗∗ 0.377∗∗ 4.088∗∗∗ 0.269∗∗∗ −0.335
(0.461) (0.754) (0.640) (0.537) (0.348) (0.440)less than 50 K 0.751∗∗∗ −01.045 1.079∗∗∗ −8.153∗∗∗ 1.107∗∗∗ −0.969
(0.192) (0.987) (0.205) (0.867) (0.239) (0.167)50 K to 500 K 0.267 0.130 0.390 −6.214∗∗∗ 0.472∗∗∗ 0.166
(0.183) (0.090) (0.276) (1.892) (0.154) (0.247)500 K to 1 Mil 0.316 0.449 0.451 −7.391∗∗∗ 0.412 0.388
(0.916) (1.589) (1.344) (0.855) (0.911) (1.742)greater than 1 Mil 0.658∗ 0.151 0.922 −4.771∗∗∗ 0.899∗∗∗ 0.117
(0.391) (2.462) (0.473) (0.707) (0.354) (1.986)
Inverse Mills Ratio 1.456∗∗∗ 0.895 2.051∗∗∗ 28.997∗∗∗ 8.920∗∗∗
(0.407) (0.375) (0.695) (1.042) (0.013)
constant −2.370∗∗∗ −0.588 −3.348 5.673∗ 6.362∗∗∗ −0.279(0.233) (0.104) (0.122) (1.042) (0.514) (0.631)
sample size 148 62 148 62
Note: Standard errors in parentheses. Fully robust standard errors clustered at the household are in parentheses (∗
p < 0.10, ∗∗ p < 0.05, ∗∗∗ p < 0.01). Industry dummies not included in table for parsimony, available from authorsupon request.
22