the department of commerce budget in brief department of commerce budget in brief fiscal year 2019...
TRANSCRIPT

The Department of Commerce
Budget in Brief Fiscal Year 2019
Wilbur Ross U.S. Secretary of Commerce


Contents
FY 2019 Budget in Brief
Contents DEPARTMENTAL OVERVIEW 1 BUREAU DESCRIPTIONS Departmental Management 3 Office of the Inspector General 13 Economic Development Administration 17 Bureau of the Census 23 Bureau of Economic Analysis 35 International Trade Administration 41 Bureau of Industry and Security 47 Minority Business Development Agency 53 National Oceanic and Atmospheric Administration 57 U.S. Patent and Trademark Office 91 National Institute of Standards and Technology 97 National Technical Information Service 107 National Telecommunications and Information Administration 109
SUMMARY TABLES AND GRAPHS Department of Commerce Funding 119 Positions and Full-Time Equivalent Employment 120 Budget Authority: FY 2017 – 2019 121 Outlays: FY 2017 – 2019 122 Direct Positions, FY 2017 – FY 2019 123 Full-Time Equivalent Employment: FY 2017 – FY 2019 123 Historical Summary of Resources 124 Bridge from 2018 and 2019 Appropriations to 2018 and 2019 Budget Authority 125 Comparison of 2019 Estimate with 2017 Actual and 2018 Enacted 126 Summary of Requirements with Detail of Adjustments to Base 127 Comparison by Bureau of Adjustments to Base 129 Budget Authority by Function 130 AUTHORIZING LEGISLATION REQUIRED FOR FY 2019 131
Note: A full-year 2018 appropriation was not enacted at the time the FY 2019 Budget was prepared; therefore, the Budget is built off of the Further Continuing Appropriations Act, 2018 (P.L. 115–120). The amounts included for 2018 reflect the annualized level provided by the continuing resolution. Unless otherwise noted, all dollar amounts are in thousands The total Full-Time Equivalent Employees (FTEs) reflect the total number of straight-time hours (i.e., not including overtime or holiday hours) worked by employees divided by the number of compensable hours applicable to each fiscal year. Annual leave, sick leave and compensatory time off and other approved leave categories are considered to be “hours worked” for the purposes of defining FTE employment.

FY 2019 Budget in Brief

Overview
FY 2019 Budget in Brief 1
Departmental Overview Promoting Job Creation and Economic Growth
The mission of the U.S. Department of Commerce is to create the conditions for long-term economic growth and opportunity. The Department accomplishes its mission by providing the data necessary to support commerce, promoting fair, reciprocal, and secure trade, ensuring America’s national security and technological leadership through export controls and an effective patent system, and fostering innovation by setting standards and conducting foundational research and development. FY 2019 BUDGET IN CONTEXT The U.S. Department of Commerce’s FY 2019 Budget requests $9.8 billion in discretionary funding, a $0.6 billion or 7 percent increase from the FY 2018 Annualized Continuing Resolution (CR) level1. The FY 2019 Budget Request prioritizes and protects investments in core Government functions such as preparing for the 2020 Decennial Census, providing the observational infrastructure and personnel to produce timely and accurate weather forecasts, enforcing laws that promote fair and secure trade, protecting intellectual property, and managing utilization of spectrum resources. In order to adequately fund these priorities, the Budget proposes targeted reforms to best leverage Federal funding, reduces funding for grants, eliminates duplicative or unnecessary programs, and consolidates others. Providing the Data Necessary to Support Commerce The Decennial Census is a constitutional requirement and the Department’s highest priority in 2019. The Budget provides $3.8 billion, an increase of more than $2.3 billion from the FY 2018 Annualized CR, for the U.S. Census Bureau. In 2019 major field operations for the 2020 Census will begin, which include in-field address canvassing to finalize the nation’s address list, the buildout of offices across the country to support field management and temporary staff, and final preparations and refinements to information technology investments for the collection of respondent data in 2020. These operations are essential to conducting a modern, efficient, and accurate 2020 Decennial Census. A full, fair, and accurate Decennial Census is imperative the Decennial Census governs the apportionment of seats in the House of Representatives. These data also play an important role in shaping policy and determining the distribution of government resources. In addition, Census data are used by governmental entities at the State and local levels for defining the representative boundaries for congressional districts, State legislative districts, school districts, and voting precincts. The Budget also includes $101 million for the Bureau of Economic Analysis (BEA) to provide timely, accurate, and relevant economic statistics in an objective and cost-effective manner. The National Oceanic and Atmospheric Administration’s (NOAA) FY 2019 Budget of $4.6 billion prioritizes core government functions that promote national security and public safety while fostering economic opportunity. This NOAA Budget supports: continuing to promote aquaculture development and rebuild fisheries; maintaining National Weather Service forecasting capabilities while promoting efficient and effective operations; recapitalizing the NOAA fleet to continue at-sea data collection; and fostering safe and efficient marine and coastal navigation. Advance notice provided by weather forecasts enables the Nation’s leaders, decision makers, and media to provide better warnings and advisories to first responders, the public, and businesses. Timeliness and accuracy reduce catastrophic loss of human life and property and damaging effects on the national economy. Polar-orbiting satellites are critical to this mission, providing space-based observations that improve the accuracy of weather predictions. In recognition of the value these satellites provide, the Budget includes $878 million for the NOAA Polar Weather Satellites. The Budget will allow NOAA to keep these satellites on track for planned launch dates and to maintain continuity of both the polar-orbiting and geostationary satellite constellations. Additionally, the Budget proposes to combine the current polar orbiting satellite program with the planned follow on to allow more efficient management, thereby lowering costs compared to prior estimates without impacting schedule. 1 A full-year 2018 appropriation was not enacted at the time the FY 2019 Budget was prepared; therefore, the Budget is built off of the Further Continuing Appropriations Act, 2018 (P.L. 115-120). The amounts included for 2018 reflect the annualized level provided by the continuing resolution. All other comparisons and discussions of the budget request and policy will use the Annualized CR as the base.

Overview
2 FY 2019 Budget in Brief
Ensuring Fair and Secure Trade
To support the Administration’s aggressive approach to a global market that allows U.S. businesses to compete fairly, the Budget provides $440 million for the International Trade Administration (ITA). Within ITA, the Budget requests slightly more than $90 million for ITA’s Enforcement and Compliance unit to expand and enhance the Department’s efforts to ensure trade is both fair and reciprocal, with a level playing field for U.S. workers and businesses. This would allow ITA to conduct robust investigations into alleged trade violations, aggressively advocate for U.S. businesses facing tariff and non-tariff barriers abroad, and, increase the capacity to closely review proposed foreign investments in U.S. businesses. Additionally, the Budget supports $121 million for the Bureau of Industry and Security (BIS). This funding will augment the Bureau’s work efforts to protect national security and safeguard American technology by preventing illegal exports of sensitive products while facilitating secure trade with U.S. allies and close partners. Fostering Innovation by Setting Standards and Conducting Foundational Research and Development With a request of $629 million, the FY 2019 Budget supports the National Institute of Standards and Technology’s (NIST) mission to promote U.S. innovation and industrial competitiveness by advancing measurement science, standards, and technology in ways that enhance economic security and improve our quality of life. Through the NIST Laboratories, the bureau will maintain its core capabilities in measurement science, continuing to provide the measurements and standards that accelerate innovation. The bureau will continue to play a unique role through its R&D capabilities that provide cutting edge measurement science solutions for the industries of the future; and measurement services on which government, industry and academia rely. The Budget continues to support the National Telecommunications and Information Administration (NTIA) in representing U.S. interests at multi-stakeholder forums on internet governance and digital commerce with a $34 million request. The Budget supports the commercial sector’s development of next generation wireless services, including 5G and the Internet of Things, by funding NTIA’s mission of ensuring the most efficient use of spectrum resources by Government users. Ensuring adequate access to scarce spectrum resources by both the commercial and Government sectors is a crucial factor for economic growth and national security. The $3.5 billion request (offset by fee collections) for the U.S. Patent and Trademark Office (USPTO) will help American entrepreneurs and businesses secure their intellectual property and bring their inventions to the marketplace. USPTO continues to reduce the number of patent applications awaiting review and the time it takes to issue a final decision. In addition, this Budget reflects the continued development and successful deployment of new IT capabilities to continue retiring legacy systems. Modernizing Support for Minority Owned Businesses Minority owned businesses face unique challenges in obtaining the capital and support necessary to start and operate businesses. The Minority Business Development Agency (MBDA) within the Department of Commerce is solely dedicated to addressing these challenges and helping minority businesses thrive. To further this mission, the Budget proposes $10 million to reform the operations of MBDA to expand its reach and better help it meet its programmatic objectives. These reforms would eliminate the business centers operated by MBDA, which are duplicative of programs operated by other Federal agencies, but, would establish MBDA as a policy office that is positioned to advocate for minority businesses across all Federal programs. Streamlining Government Operations and Improving Efficiency The Budget eliminates the Economic Development Administration (EDA), which provides small grants with limited measurable impacts and duplicates other Federal programs, such as Rural Utilities Service grants at the U.S. Department of Agriculture and formula grants to States from the Department of Transportation. By eliminating EDA, the Budget saves approximately $289 million from the FY 2018 Annualized CR level. The Budget also eliminates Federal funding for the Manufacturing Extension Partnership (MEP) program within NIST, which subsidizes up to half the cost of State centers that provide consulting services to small- and medium-sized manufacturers. This proposal saves $127 million from the FY 2018 Annualized CR level, and, directs MEP centers to transition solely to non-Federal revenue sources as originally intended when the program was established.

Departmental Management
FY 2019 Budget in Brief 3
Departmental Management The mission of Departmental Management (DM) is to develop and implement policy affecting U.S. and international activities as well as the internal goals and operations of the Department. DM serves as the primary liaison with the executive branch, legislative affairs, and private sector groups. DM also acts as the management and administrative control point for the Department.
DM accomplishes its mission through the following activities:
• The Salaries and Expenses (S&E) account provides funding for the Office of the Secretary, the Office of the Deputy Secretary, and support staff.
• The Renovation and Modernization account addresses major building infrastructure deficiencies and security weaknesses.
• The Working Capital Fund (WCF) finances, on a reimbursable basis, Department-wide administrative functions that are more efficiently performed on a centralized basis, such as legal, enterprise services, security, human resources, financial management, building management, information technology, and procurement services.
DM’s mission priorities are to provide overall leadership, policy direction, and coordination of bureau programs in furtherance of the Department’s mission. In addition, DM provides administrative oversight and operational support in the development, acquisition, deployment, operation and security of information technology, including Cybersecurity; ensures the effective management and security of the facilities and property; recruitment, training, retention, management of a diverse and highly effective workforce; and ensures effective management of fiscal resources as well as business processes to support the Department’s mission.
In 2019, DM continues to fulfill its mission by leveraging its highly effective workforce to find alternative solutions to work smarter while maintaining a high-level of customer service. The Salaries and Expenses appropriation provides funding for the development and implementation of Departmental policies, coordinates the bureaus’ program activities to accomplish the Departmental mission, and provides funds for the development and implementation of the Department’s internal policies, procedures, and other administrative guidelines.
The WCF’s mission is to provide central services to the Department’s bureaus in the most efficient and economical manner possible. The WCF provides administrative oversight and operational support to ensure effective management of fiscal resources and business processes by which the Department carries out its mission. It operates as a revolving fund and does not receive a yearly appropriation, but instead charges services directly to the customer bureaus.
Base funding is requested for the Renovation and Modernization of the Herbert C. Hoover Building (HCHB) to continue to support five positions and the associated costs to benefits, rent, utilities, supplies, and training. The renovation and modernization will upgrade infrastructure, modernize tenant spaces, remove safety hazards, and improve energy efficiency as Commerce optimizes utilization of HCHB space. The General Services Administration and Commerce are each responsible for certain aspects of the project’s costs. The request funds construction costs to complete design of Phase 5 and 6 activities and to include 21st Century Workplace Initiative tenant improvements, allowing the Department to maximize HCHB space by reducing the overall footprint.
62.0 61.6 61.8
205 198 198
100
200
300
40
60
80
100
120
2017 2018 2019
Posi
tion
s
Dol
lars
in
Mill
ions
Budget Authority and Positions
Funding Positions

Departmental Management
4 FY 2019 Budget in Brief
Summary of Appropriations
2017 2018 2019 IncreaseDiscretionary Appropriation Actual Annualized CR Estimate (Decrease)Salaries and Expenses $58,000 $57,606 $58,994 $1,388Renovation and Modernization 4,000 3,973 2,796 (1,177)Total, Appropriation 62,000 61,579 61,790 211
Budget AuthoritySalaries and Expenses 58,000 57,606 58,994 1,388Renovation and Modernization 4,000 3,973 2,796 (1,177)Total, Budget Authority 62,000 61,579 61,790 211
Mandatory Appropriation
Gifts & Bequests Trust Fund 3,188 3,500 3,500 0
Total, Mandatory Appropriation 3,188 3,500 3,500 0
PositionsSalaries and Expenses - Direct 200 193 193 0Salaries and Expenses - Reimbursable 77 78 78 0Renovation and Modernization - Direct 5 5 5 0Working Capital Fund - Reimbursable 672 665 665 0Total 954 941 941 0
Civilian Full-Time Equivalent EmploymentSalaries and Expenses - Direct 158 178 178 0Salaries and Expenses - Reimbursable 77 78 78 0Renovation and Modernization - Direct 5 5 5 0Working Capital Fund - Reimbursable 539 532 532 0Total 779 793 793 0

Departmental Management
FY 2019 Budget in Brief 5
Highlights of Budget Changes
Appropriation: Salaries and Expenses
Summary of Requirements
Detailed SummaryPositions Amount Positions Amount
2018 Annualized CR 193 $57,606Adjustments to BaseOther Changes
FY 2018 Pay raise $127 Civil Service Retirement System (CSRS) (32) Federal Employees' Retirement System (FERS) 49 Thrift Savings Plan (TSP) 16 Federal Insurance Contributions Act (FICA) - OASDI 32 Health insurance 89 Compensable Day 111 Employee Compensation (8) Travel - Per Diem 3 Rent payments to GSA 44 Printing and reproduction 3 Working Capital Fund (WCF) 657 General Pricing Level Adjustment: Transportation of things 1 Communications and miscellaneous 4 Other services 284 Supplies and materials 5 Equipment 3
Subtotal, other changes 0 1,388
Total, Adjustments to Base 0 1,3882019 Base 193 58,994Program Changes 0 02019 Appropriation 193 58,994

Departmental Management
6 FY 2019 Budget in Brief
Comparison by Activity
Direct Obligations Pos Amount Pos Amount Pos Amount Pos Amount
Operations and Administration 193 $57,663 193 $58,994 193 $58,994 0 $0
Total Direct Obligations 193 57,663 193 58,994 193 58,994 0 0
Reimbursable Authority 78 107,695 78 107,557 78 107,557 0 0
TOTAL OBLIGATIONS 271 165,358 271 166,551 271 166,551 0 0
FINANCING
Unoblig.bal. start of year (Direct) (57)
Unoblig.bal. start of year (Reimbur) (138)
Offsetting collections (78) (107,557) (78) (107,557)
Subtotal, financing (78) (107,752) (78) (107,557)
TOTAL BUDGET AUTHORITY / 193 57,606 193 58,994
APPROPRIATION
2018 Annualized CR 2019 Base 2019 Estimate Increase / Decrease
Highlights of Program Changes
Base Increase / Decrease Operations and Administration Positions Amount Positions Amount
0 0 0 0
Departmental Management is not proposing any program changes for this account in FY 2019.

Departmental Management
FY 2019 Budget in Brief 7
Appropriation: Renovation and Modernization
Summary of Requirements
Comparison by Activity
BUDGET AUTHORITY Pos Amount Pos Amount Pos Amount Pos Amount
Renovation & Modernization 5 $3,973 5 $924 5 $2,796 0 $1,872
TOTAL BUDGET AUTHORITY 5 3,973 5 924 5 2,796 0 1,872
2018 Annualized CR 2019 Base 2019 Estimate Increase / Decrease
Highlights of Program Changes Base Increase / Decrease Positions Amount Positions Amount
Renovation and Modernization Project 5 $924 0 +$1,872
This account funds the Commerce Department’s portion of expenses associated with renovating and modernizing the Herbert C. Hoover Building (HCHB). The renovation and modernization will upgrade infrastructure, modernize tenant spaces, remove safety hazards, and improve energy efficiency as Commerce optimizes utilization of HCHB space. The General Services Administration and Commerce are each responsible for certain aspects of the project’s costs. The request funds construction for the 21st Century Workplace Initiative improvements, allowing the Department to maximize HCHB space.
Detailed SummaryPositions Amount Positions Amount
2018 Annualized CR 5 $3,973Adjustments to BaseAdjustments Non-recurring Construction Base (3,109)
Other Changes FY 2018 Pay raise $4 Change in Compensable Days 3 Health insurance 1 General Pricing Level Adjustments: Other services 52
Subtotal, other changes 0 60
Total, Adjustments to Base 0 (3,049)2019 Base 5 924Program Change 0 1,872
2019 Appropriation 5 2,796

Departmental Management
8 FY 2019 Budget in Brief
Operating Fund: Working Capital Fund Summary of Requirements
Detailed SummaryPositions Amount Positions Amount
2018 Estimate 665 $223,803Adjustments to BaseOther Changes
FY 2018 Pay raise $444 Civil Service Retirement System (CSRS) (79) Federal Employees' Retirement System (FERS) 155 Thrift Savings Plan (TSP) 50 Federal Insurance Contributions Act (FICA) - OASDI 17 Health insurance 240 Compensable Day 354 Travel - Per diem 12 Rent payments to GSA 1,093 Printing and reproduction 7 General Pricing Level Adjustment: Transportation of things 3 Communications and miscellaneous 42 Other services 1,774 Supplies and materials 21 Equipment 49
Subtotal, other changes 0 4,182
Total, Adjustments to Base 0 4,182
2019 Base 665 227,985Program Changes 0 02019 Operating Level 665 227,985
Comparison by Activity
OPERATING LEVEL Pos Amount Pos Amount Pos Amount Pos Amount
Operations and Administration 665 $236,449 665 $227,985 665 $227,985 0 $0
TOTAL OPERATING LEVEL 665 236,449 665 227,985 665 227,985 0 0
FINANCING
Unobligated balance, start of year (12,646)
Offsetting collections from:
Federal funds (223,803) (227,985)
Subtotal, financing (236,449) (227,985)
TOTAL BUDGET AUTHORITY / 665 0 665 0
APPROPRIATION
2018 Estimate 2019 Base 2019 Estimate Increase / Decrease

Departmental Management
FY 2019 Budget in Brief 9
Highlights of Program Changes Base Increase / Decrease Positions Amount Positions Amount
0 0 0 0
Departmental Management is not proposing any program changes for this account in FY 2019.
Direct Costs by Office
Offices Positions AmountHuman Resources Management 61 $13,846Civil Rights 10 2,778Financial Management 62 33,119Security 124 29,354Facilities and Environmental Quality 69 19,091Acquisition Management 9 4,055Privacy and Open Government 4 1,022General Counsel 214 47,650Chief Information Officer 42 35,892Enterprise Services 52 36,789Executive Direction 18 4,389
Total Working Capital Fund 665 227,985
2019 Estimate
Distribution by BureauBureaus Amount
Departmental Management $13,036International Trade Administration 33,384Economic Development Administration 1,398National Telecommunications and Information Administration 7,473National Technical Information Service 1,834Bureau of the Census 43,000Bureau of Economic Analysis 3,321National Oceanic and Atmospheric Administration 55,249National Institute of Standards and Technology 26,317U.S. Patent and Trademark Office 20,124Minority Business Development Agency 4,593Bureau of Industry and Security 12,632Office of the Inspector General 2,933
Total Commerce Bureaus 225,294Other Agencies 2,691
Total Working Capital Fund 227,985

Departmental Management
10 FY 2019 Budget in Brief
Performance Indicators The following table shows the DM performance indicators. Additional details appear at the end of the DM section of the Department of Commerce budget.
2017 2017 2018 2019 Target Actual Target Target Score on the Employee Engagement index 69% 71% 71% 71%
Score on the New Inclusion Quotient 64% 66% 66% 66%
Percentage of high-volume processes with customer feedback elements 100% 100% 100% 100%
Score on the Results-Oriented Performance Culture Index 61% 62% 62% 62%
Cybersecurity Cross-Agency Priority Goal average for the Department 95% TBD TBD TBD
Provide accurate and timely financial information and conform to Federal standards, laws and regulations governing accounting and financial management
Eliminate any repeat significant deficiency
within 1 year of determination
Complete FY 2017 A-123 assessment of
internal controls
The significant deficiency (FISCAM) from FY 2016 remains and a material
weakness was identified.
Completed FY 2017 A-123 assessment of Internal
Controls
Eliminate any repeat significant deficiency within 1
year of determination
Complete FY 2018 A-123 assessment of internal controls
Eliminate any repeat significant deficiency within 1
year of determination
Complete FY 2019 A-123 assessment of internal controls
Unmodified Audit opinion Unmodified Unmodified Unmodified Unmodified For each administrative / business system, maintain compliance and alignment with OMB initiatives
Maintain compliance Maintained compliance Maintain compliance
Maintain compliance
Dollars awarded using high-risk contracting authorities
Maintain 10% reduction in the share of dollars obligated under new
contract actions that are awarded with high-risk contracting authorities
$222M
Maintain 10% reduction in the share of dollars obligated under
new contract actions that are
awarded with high-risk contracting
authorities
Maintain 10% reduction in the share of dollars obligated under
new contract actions that are
awarded with high-risk contracting
authorities
Savings achieve thru more effective acquisition practices (millions) $18 $36 $17 $31
Veteran Hires 26% 10.2% 23.2% TBD
Mission-Critical Occupation Staffing 5% 9% 5% 5%
Permanent Attrition 7% 7% 7% 7%
Hiring Timeline 65 89 65 65
Candidate Quality 70% 54% 70% 70%
Disability Hires 13.0% 21.9% 13.5% 14.0%

Departmental Management
FY 2019 Budget in Brief 11
2017 2017 2018 2019
Target Actual Target Target
Demonstrate effective management of information technology resources including cyber security
IT investments have cost
/schedule overruns and performance shortfalls
averaging less than 10%.
On average, for its major IT investments, the Department
was within a 20% positive variance (under budget) and was within a 30% schedule
variance.
IT investments have cost
/schedule overruns and performance
shortfalls averaging less
than 10%.
IT investments have cost
/schedule overruns and performance
shortfalls averaging less
than 10%.
Continuous Monitoring – ongoing near real-time
awareness and assessment of
information security risks to support risk
management decisions (95%)
The Enterprise Security Operations Center
implemented a Departmental Incident Management
System to report, track, and manage all Commerce cyber
incidents.
Hardware Asset Management:83%; Software
Asset Management: 81%; Vulnerability
Management: 92%; Configuration Management:
96%;
Continuous Monitoring –
ongoing near real-time awareness
and assessment of information
security risks to support risk
management decisions (95%)
Continuous Monitoring –
ongoing near real-time awareness
and assessment of information
security risks to support risk
management decisions (95%)
Strong Authentication - ensure only authorized
employees have access to federal information systems following the HSPD-12 Personal Identity Verification
standard (100% privileged users and
85% unprivileged users)
Privileged users: 97% Unprivileged users: 89%
Strong Authentication -
ensure only authorized
employees have access to federal
information systems following
the HSPD-12 Personal Identity
Verification standard (100% privileged users
and 85% unprivileged users)
Strong Authentication -
ensure only authorized
employees have access to federal
information systems following
the HSPD-12 Personal Identity
Verification standard (100% privileged users
and 85% unprivileged users)
Trusted Internet Connection
Consolidation – ensures external Internet traffic and
passing through a TIC or Managed Trusted Internet Protocol Services (MTIPS provider (100%)
TIC Consolidation is at 100% via MTIPs and TICAP for all
bureaus.
Trusted Internet Connection
Consolidation – ensures external Internet traffic and passing through a TIC or Managed Trusted Internet
Protocol Services (MTIPS provider
(100%)
Trusted Internet Connection
Consolidation – ensures external Internet traffic and passing through a TIC or Managed Trusted Internet
Protocol Services (MTIPS provider
(100%)
Trusted Internet Connection Capabilities
– ensure NOAA TIC service meets TIC 2.0 requirements (100%)
NOAA’s TIC 2.0 compliance at 98% (59/60) based on the
DHS FY17 TIC Capability Validation (TCV) report
critical controls
Trusted Internet Connection
Capabilities – ensure NOAA TIC service meets TIC
2.0 requirements
(100%)
Trusted Internet Connection
Capabilities – ensure NOAA TIC service meets TIC
2.0 requirements
(100%)
Perform IT Security compliance review of all
OUs and 20 assessments
Conducted 27 analyses, reviews, and assessments,
including an RMF Continuous Monitoring Check of all 270 Department of Commerce
FISMA-reportable systems.
Perform IT Security
compliance review of all OUs and 20
assessments
Perform IT Security
compliance review of all OUs and 20
assessments

Departmental Management
12 FY 2019 Budget in Brief

Office of the Inspector General
FY 2019 Budget in Brief 13
Office of the Inspector General The mission of the Office of the Inspector General (OIG) is to promote economy and efficiency in Department of Commerce programs and operations to prevent fraud, waste, and abuse. The OIG monitors and tracks the use of taxpayer dollars through audits, inspections, evaluations, and investigations. The Inspector General is required by law to keep the Secretary and Congress timely informed of problems and deficiencies relating to the administration of programs and operations and the need for corrective action.
OIG accomplishes this mission through the audit function which involves performance and financial audits and evaluations. Performance audits address the efficiency, effectiveness, and economy of the Department’s programs, activities, and information technology systems. Financial audits focus on compliance with generally accepted accounting principles, management’s responsibility for internal controls as defined by the Office of Management and Budget, and financial laws and regulations. Program evaluations are in-depth reviews of specific management issues, policies, or programs, while systems evaluations focus on system development, system acquisitions, operations, and policy of computer systems and other technologies.
The investigative function focuses on alleged or suspected improper and illegal activities involving employees, contractors, recipients of financial assistance, and others responsible for handling federal resources. OIG focuses on programs and operations with the greatest potential for identifying fraud, recovering funds, precluding unnecessary outlays, and improving management.
The OIG mission priorities are to provide a unique, independent voice to the Secretary of Commerce, the Department’s senior leaders, and to Congress. OIG combats fraud, waste, abuse, and mismanagement, and improves the efficiency, effectiveness, and economy of Department operations. The OIG has authority to inquire into all program and administrative activities of the Department, including individuals or organizations performing under contracts, grants, cooperative agreements, and other financial assistance awards. The Inspector General Act of 1978, as amended and other legislation authorizes the specific functions and programs that make up these broad activities.
In FY 2019, OIG requests a total of $40.9 million—$32.0 million in direct appropriations and transfers of $2 million from the U.S. Patent and Trademark Office, $1.3 million from National Oceanic and Atmospheric Administration for satellite oversight; and a transfer of $3.6 million from the Census Bureau, an increase of $1 million as well as $2.0 million from the Public Safety Trust Fund for the oversight of First Responders Network Authority (FirstNet). OIG’s base resources of $38.9 million will enable OIG to continue:
• Working on criminal and civil investigations. • Conducting annual audits of the Department’s financial statements and information security program and
practices. • Conducting annual risk-based audits/reviews of DOC offices, programs, and activities, in which reports and
recommendations for improving DOC’s operations are issued. • Maintaining the OIG Hotline to monitor and process allegations of waste, fraud, abuse, or mismanagement.
The additional $1 million from the Census Bureau and $2.0 million from the Public Safety Trust Fund would permit OIG to provide additional oversight to the 2020 decennial census and the First Responder Network Authority (FirstNet) without reducing oversight for DOC’s other programs. OIG currently has no dedicated FirstNet funding to conduct oversight. OIG’s budget request attempts to balance providing oversight for DOC’s 99 programs while increasing oversight of the 2020 decennial census and FirstNet.
38.6 38.4 40.9177 178 184
0
50
100
150
200
250
30
40
50
60
2017 2018 2019
Posi
tion
s
Dolla
rs in
Mill
ions
Budget Authority and Positions
Funding Positions

Office of the Inspector General
14 FY 2019 Budget in Brief
Summary of Appropriations 2017 2018 2019 Increase
Appropriation Actual Annualized CR Estimate (Decrease)
Operations and Administration $32,744 $32,522 $32,030 ($492)
Total, Appropriation 32,744 32,522 32,030 (492)
Transfer from Census 2,580 2,562 3,556 994
Transfer from NOAA 1,302 1,294 1,302 8
Transfer from USPTO 2,000 1,986 2,000 14
Transfer from FirstNet PSTF 0 0 2,000 2,000
Total, Budget Authority 38,626 38,364 40,888 2,524
PositionsOperations and Administration - Direct 177 178 184 6Operations and Administration - Reimbursable 2 2 2 0
Total 179 180 186 6
Civilian Full-Time Equivalent EmploymentOperations and Administration - Direct 162 177 181 4Operations and Administration - Reimbursable 2 2 2 0
Total 164 179 183 4

Office of the Inspector General
FY 2019 Budget in Brief 15
Highlights of Budget Changes Appropriation: Office of the Inspector General Summary of Requirements
Detailed SummaryPositions Amount Positions Amount
2018 Annualized CR 178 $32,522Adjustments to BaseOther Changes 2018 Pay raise $144 Civil Service Retirement System (CSRS) (15) Federal Employees' Retirement System (FERS) 30 Thrift Savings Plan 4 Federal Insurance Contributions Act (FICA) - OASDI 8 Health insurance 52 Compensable Day 101 Travel - Per diem 3 Rent payments to GSA 36 Working Capital Fund 122 General Pricing Level Adjustment Communications and miscellaneous 5 Other Services 54 Supplies and materials 2 Equipment 19
Subtotal, other changes 0 565
Total, Adjustments to Base 0 5652019 Base 178 33,087Program Change 6 (1,057)2019 Appropriation 184 32,030
Comparison by Activity 2018 Annualized CR 2019 Base 2019 Estimate
Direct Obligations Pos Amount Pos Amount Pos Amount Pos Amount
Inspector General 178 $44,668 178 $38,929 184 $40,888 6 $1,959
Total Direct Obligations 178 44,668 178 38,929 184 40,888 6 1,959
Reimbursable Authority 2 3,500 2 3,500 2 3,500 0 0
TOTAL OBLIGATIONS 180 48,168 180 42,429 186 44,388 6 1,959
FINANCING
Unobligated balance, start of year (6,304)
Offsetting collections (2) (3,500) (2) (3,500) (2) (3,500) 0 0
Subtotal, financing (2) (9,804) (2) (3,500) (2) (3,500) 0 0
TOTAL BUDGET AUTHORITY 178 38,364 178 38,929 184 40,888 6 1,959
Transfers from other accounts (5,842) (5,842) (8,858) 0 (3,016)
TOTAL APPROPRIATION 178 32,522 178 33,087 184 32,030 6 (1,057)
Increase / Decrease

Office of the Inspector General
16 FY 2019 Budget in Brief
Highlights of Program Changes
Base Increase / Decrease Positions Amount Positions Amount Office of the Inspector General 178 $38,929 +6 +$1,959
Increased Census Oversight +6 $1,016
OIG requests an increased transfer of $1,016,000 and 6 positions for increased oversight of 2020 Census activities for two years, for a total transfer from the Census Bureau of $3.556 million.
OIG will add six personnel to handle the short-term increased workload. Additional funding would allow for the necessary oversight of multiple 2020 decennial census operations, hotline and investigative support, and result in 5 to 10 additional oversight products each year. For the 2020 decennial census, OIG will identify potential problem areas by obtaining Bureau datasets (for example, production, payroll, and financial) throughout the operations to identify high-risk areas and take targeted action. By synthesizing information, OIG will analyze office performance across numerous variables, identify outliers, and visit offices with concerning trends.
To achieve these goals and provide targeted oversight of the Bureau without reducing the level of oversight to other areas of the Department, OIG will require an increase in audit and investigation staff in FY 2019, as 2020 decennial census operations are starting. This increase will position OIG to meet the extensive oversight demands of the census.
Increased FirstNet Oversight +7 $2,000
The U.S. Department of Commerce (DOC), Office of Inspector General (OIG) requests an increase of $2.0 million from the First Responder Network Authority (FirstNet) to fund dedicated oversight. Due to the scope, complexity, and financial magnitude for FirstNet—as well as the Department’s current lack of experience in this area—FirstNet requires more thorough oversight to ensure the Department successfully implements the Nationwide Public Safety Broadband Network (NPSBN). OIG requires this funding to ensure sufficient oversight of FirstNet.
Decreased General Oversight -7 -$1,057
OIG requests a program decrease of $1,057,000 from general oversight operations. This decrease will result in a personnel reduction of 7 positions and three audit products.
Performance Indicators The following table shows the OIG performance indicators. Additional details appear at the end of the OIG section of the Department of Commerce budget.
2017 2017 2018 2019 Target Actual Target Target
% of OIG recommendations accepted by Departmental and bureau management 95% 95% 95% 95%
Dollar value of financial benefits identified by OIG (millions) $70 $56.4 $70 $70
% of investigative cases completed within 365 days 70% 70% 70% 70%

Economic Development Administration
FY 2019 Budget in Brief 17
Economic Development Administration The Administration’s 2019 Budget prioritizes rebuilding the military and making critical investments in the Nation’s security. It also identifies the savings and efficiencies needed to keep the Nation on a responsible fiscal path. The Administration has made the necessary tradeoffs and choices inherent in pursuing these goals. This means changing the role and size of the Federal Government and prioritizing the programs that provide a good return for the taxpayer, as well as those that serve the most critical functions, while consolidating or eliminating duplicative, ineffective or less critical programs. Many difficult decisions were necessary to reach the funding level provided in this budget, and the elimination of the Economic Development Administration (EDA) is one of them.
In support of these goals, the EDA FY 2019 budget requests program decreases to provide offsets to rebuild the military and make critical investments in the Nation’s security. This budget requests $14.9 million to cover the costs associated with closing down the agency.
In light of the proposal to close down EDA, the Administration is also including in the general provisions for the Department of Commerce, specific language to allow for the defederalization of its Revolving Loan Fund grants. This language is necessary for the orderly close down of EDA’s operations. Without the authority, EDA or any successor operating unit within the Department, would have to administer and monitor these grants in perpetuity because the federal interest in this type of grant does not end.
Since EDA’s inception 52 years ago, EDA has led the federal economic development agenda by promoting innovation and competitiveness, preparing American regions for growth and success in the worldwide economy. EDA is proud of the investments it has made in economically distressed regions, based on their locally-driven strategies and needs, and the outcomes of those investments which spurred local innovation and entrepreneurship creating and saving jobs and leveraging private investments.
39.0 38.7
14.9
237.0225.5
0.0
190 190
64
0
50
100
150
200
250
(50)
0
50
100
150
200
250
300
350
2017 2018 2019
Posi
tion
s
Dolla
rs in
Milli
ons
Budget Authority and Positions
S&E EDAP Positions

Economic Development Administration
18 FY 2019 Budget in Brief
Summary of Appropriations
2017 2018 2019 IncreaseAppropriation Actual Annualized CR Estimate (Decrease)
Salaries and Expenses $39,000 $38,735 $14,937 ($23,798)
Economic Development Assistance Programs 237,000 235,458 0 (235,458)
Total, Appropriation 276,000 274,194 14,937 (259,257)Rescission (10,000) (40,000) (30,000)
Total, Budget Authority 276,000 264,194 (25,063) (289,257)
PositionsSalaries and Expenses - Direct 190 190 64 (126)Salaries and Expenses - Reimbursable 1 1 0 (1)Total 191 191 64 (127)
Civilian Full-Time Equivalent EmploymentSalaries and Expenses - Direct 184 184 58 (126)Salaries and Expenses - Reimbursable 0 0 0 0Total 184 184 58 (126)

Economic Development Administration
FY 2019 Budget in Brief 19
Highlights of Budget Changes Appropriation: Salaries and Expenses Summary of Requirements
Detailed SummaryPositions Amount Positions Amount
2018 Annualized CR 190 $38,735Adjustments to BaseOther Changes FY 2018 Pay raise $50 Civil Service Retirement System (CSRS) (6) Federal Employees' Retirement System (FERS) 23 Thrift Savings Plan 2 Federal Insurance Contributions Act (FICA) - OASDI 18 Health insurance 19 Compensable Day 43 Employee Compensation Fund (56) Travel - Mileage (2) Travel - Per diem 5 Rent payments to GSA 18 NARA 5 Working Capital Fund (2,650) General Pricing Level Adjustment Rental payments to others 3 Other Services 51 Supplies and materials 1
Subtotal, other changes 0 -2,477
Total, Adjustments to Base 0 -2,4772019 Base 190 36,258Program Change (126) (21,321)2019 Appropriation 64 14,937
Comparison by Activity
Direct Obligations Pos Amount Pos Amount Pos Amount Pos Amount
Salaries and Expenses 190 $38,735 190 $36,258 64 $14,937 (126) ($21,321)
Total Direct Obligations 190 38,735 190 36,258 64 14,937 (126) (21,321)
Reimbursable Authority 0 950 1 950 0 0 (1) (950)
TOTAL OBLIGATIONS 190 39,685 191 37,208 64 14,937 (127) (22,271)
FINANCING
Unoblig. balance, start of year 0
Offsetting collections 0 (950) 0 0
Subtotal, financing 0 (950) 0 0
TOTAL BUDGET AUTHORITY 190 38,735 64 14,937
APPROPRIATION
2018 Annualized CR 2019 Base 2019 Estimate Increase / Decrease

Economic Development Administration
20 FY 2019 Budget in Brief
Highlights of Program Changes
Base Increase / Decrease Positions Amount Positions Amount Salaries and Expenses 190 $37,208 -126 -$22,271
EDA proposes a program decrease of $22.3 million for a total of $14.9 million and a decrease of 126 positions for a total of 64 positions for the Salaries and Expenses Program. This funding level supports the elimination of EDA and covers the anticipated costs associated with closing down the agency such as severance payments, lump sum leave payments, termination fees, legal fees, and other costs. The close down plan includes the reduction of staff through involuntary separation and the transfer to another federal agency the monitoring and servicing of open grants and loans until their closeout date. EDA estimates it will take an additional six years to close the 2,387 open grants and loans remaining open as of November 2017. There will be continued costs to the organization monitoring and servicing EDA’s grants and loans until they are all closed. After the grants are closed, there is post-close-out work that will need to occur through the useful life of the projects, often up to 20 years. This monitoring will also need to be performed by the federal grant making organization designated to assume EDA’s grant and management functions
Appropriation: Economic Development Assistance Programs Summary of Requirements
SummaryPositions Amount
2018 Annualized CR 0 $225,458Adjustments to Base 0 02019 Base 0 225,458Program Changes 0 (225,458)2019 Appropriation 0 0
Economic Development Administration
FY 2019 Budget in Brief 21
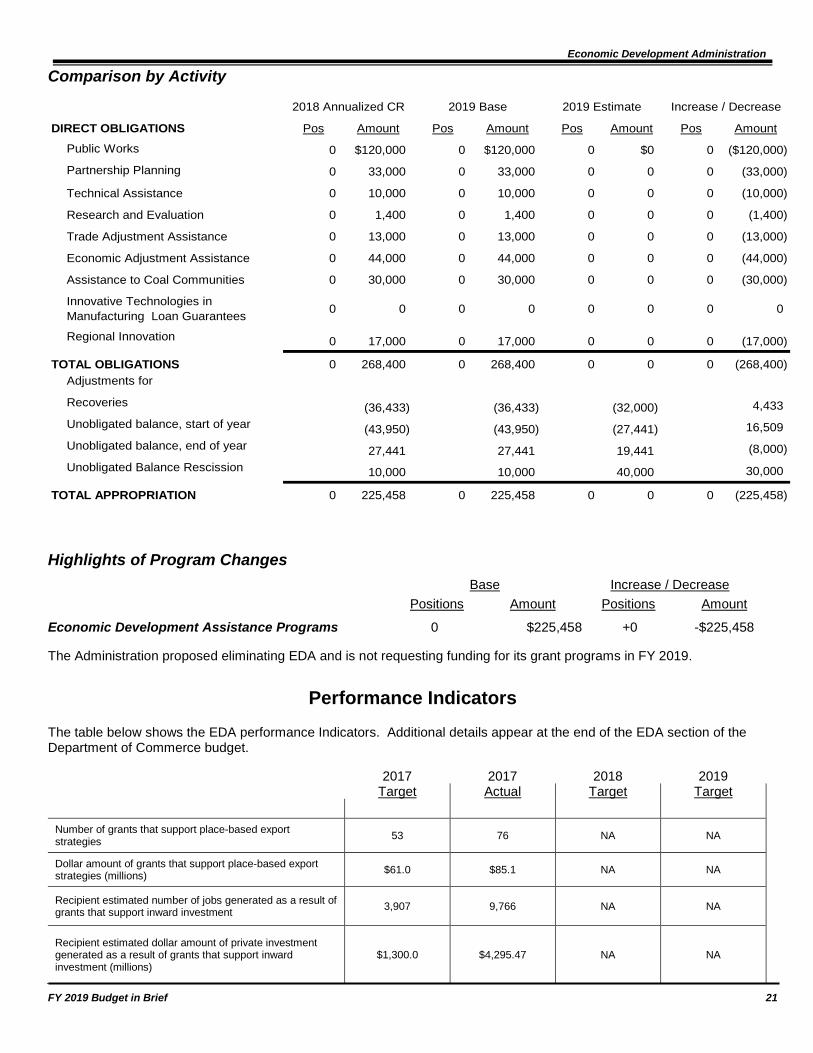
Comparison by Activity
2018 Annualized CR 2019 Base 2019 Estimate Increase / Decrease
DIRECT OBLIGATIONS Pos Amount Pos Amount Pos Amount Pos Amount
Public Works 0 $120,000 0 $120,000 0 $0 0 ($120,000)
Partnership Planning 0 33,000 0 33,000 0 0 0 (33,000)
Technical Assistance 0 10,000 0 10,000 0 0 0 (10,000)
Research and Evaluation 0 1,400 0 1,400 0 0 0 (1,400)
Trade Adjustment Assistance 0 13,000 0 13,000 0 0 0 (13,000)
Economic Adjustment Assistance 0 44,000 0 44,000 0 0 0 (44,000)
Assistance to Coal Communities 0 30,000 0 30,000 0 0 0 (30,000)
Innovative Technologies in Manufacturing Loan Guarantees 0 0 0 0 0 0 0 0
Regional Innovation 0 17,000 0 17,000 0 0 0 (17,000)
TOTAL OBLIGATIONS 0 268,400 0 268,400 0 0 0 (268,400)Adjustments for
Recoveries (36,433) (36,433) (32,000) 4,433Unobligated balance, start of year (43,950) (43,950) (27,441) 16,509Unobligated balance, end of year 27,441 27,441 19,441 (8,000)Unobligated Balance Rescission 10,000 10,000 40,000 30,000
TOTAL APPROPRIATION 0 225,458 0 225,458 0 0 0 (225,458)
Highlights of Program Changes Base Increase / Decrease Positions Amount Positions Amount
Economic Development Assistance Programs 0 $225,458 +0 -$225,458
The Administration proposed eliminating EDA and is not requesting funding for its grant programs in FY 2019.
Performance Indicators
The table below shows the EDA performance Indicators. Additional details appear at the end of the EDA section of the Department of Commerce budget.
2017 2017 2018 2019 Target Actual Target Target
Number of grants that support place-based export strategies 53 76 NA NA
Dollar amount of grants that support place-based export strategies (millions) $61.0 $85.1 NA NA
Recipient estimated number of jobs generated as a result of grants that support inward investment 3,907 9,766 NA NA
Recipient estimated dollar amount of private investment generated as a result of grants that support inward investment (millions)
$1,300.0 $4,295.47 NA NA

Economic Development Administration
22 FY 2019 Budget in Brief
2017 2017 2018 2019 Target Actual Target Target Number of grants that support innovation-based capacity building activities 209 354 NA NA
Dollar amount of grants that support innovation-based capacity building activities (millions) $100.0 $168.4 NA NA
Number of jobs generated as a result of infrastructure for industry-driven skills training 4,506 6,024 NA NA
Dollar amount of private investment generated as a result of infrastructure for industry-driven skills training (millions) $157.4 $70.4 NA NA
Number of grants that support resiliency in communities and regions 270 407 NA NA
Dollar amount of grants that support resiliency in communities and regions (millions) $71.3 $97.1 NA NA
Private sector dollars invested in distressed communities as a result of EDA investments
$176 M from FY 2014 funding
$793 M from FY 2014 funding
$323 M from FY 2015 funding
$346 M from FY 2016 funding
$561 M from FY 2011 funding
$199 M from FY 2011 funding
$525 M from FY 2012 funding
$391 M from FY 2013 funding
$1,223 M from FY 2008 funding
$4,233 M from FY 2008 funding
$2,186 M from FY 2009 funding
$1,303 M from FY 2010 funding
Jobs created or retained in distressed communities as a result of EDA investments
4,037 from FY 2014 funding
5,510 from FY 2014 funding
7,322 from FY 2015 funding
7,779 from FY 2016 funding
13,392 from FY 2011 funding
18,114 from FY 2011 funding
12,348 from FY 2012 funding
9,082 from FY 2013 funding
31,280 from FY 2008 funding
27,029 from FY 2008 funding
55,915 from FY 2009 funding
31,667 from FY 2010 funding
% of economic development districts and Indian tribes implementing projects from the CEDS process that lead to private investment and jobs
95% 73% 95% 95%
% of substate jurisdiction members actively participating in the economic development district program 89% 92% 89% 89%
% of University Center (UC) clients taking action as a result of UC assistance 75% 94% 75% 75%
% of those actions taken by UC clients that achieve the expected results 83% 89% 83% 83%
% of Trade Adjustment Assistance Centers (TAACs) clients taking action as a result of TAAC assistance 90% 81% 90% 90%
% of those actions taken by TAAC clients that achieve the expected results 95% 97% 95% 95%

Bureau of the Census
FY 2019 Budget in Brief 23
Bureau of the Census The mission of the Bureau of the Census (Census) is to serve as the leading source of quality data about the Nation’s people and economy.
To accomplish this mission, Census measures and disseminates information about the Nation’s dynamic economy, society, and institutions, fostering economic growth and advancing scientific understanding, and facilitating informed decisions. It does this through the following appropriations:
The Current Surveys and Programs appropriation provides for monthly, quarterly, and annual surveys, and other programs that are used for planning by both the public and private sectors. Census’s Current Economic Statistics programs include twelve principal economic indicators and profile U.S. businesses and government organizations. Current Demographic Statistics programs provide detailed and integrated information on the social, demographic, economic, and housing conditions of the United States, including measures of income, poverty, and health insurance.
The Periodic Censuses and Programs appropriation funds the Decennial Census, which is conducted every ten years, and the Economic Census, and the Census of Governments, which are conducted every five years. It also funds the American Community Survey (ACS), which produces annual, detailed community-level demographic socio-economic estimates, permitting the Decennial Census to collect only minimal demographic information; and the Geographic Support program, which provides the address lists, geospatial data products, and processing systems that support all Census Bureau programs, as well as local governments and businesses that use Census Bureau place-based data. Finally, the Enterprise Data Collection and Dissemination Systems programs provide critical systems infrastructure to Census Bureau surveys and censuses.
The Medicare, Medicaid, and State Children’s Health Insurance Program Bill (P.L. 106-113) established and funded (through mandatory appropriations) the State Children’s Health Insurance Program (SCHIP). The SCHIP produces statistically reliable annual state estimates on the number of low-income children who do not have health insurance coverage. Information from the SCHIP is used to allocate funds to states based on estimates from the March Income Supplement to the Current Population Survey (CPS). The SCHIP program was reauthorized by the Children’s Health Insurance Program Reauthorization Act of 2009 (P.L. 111-3).
The Working Capital Fund (WCF) is a revolving fund account funded by contributions from appropriated and reimbursable accounts used to finance services within Census, which are more efficiently performed on a centralized basis. The WCF also includes funds received by Census to perform work for other Federal agencies, state and local governments, foreign governments, and the private sector.
In the 2020 Census, the Census Bureau is concluding the operational design and implementation phase and entering the execution phase. The Census Bureau will release the final design and methodologies for the 35 census operations at the very end of FY 2018. The 2020 Census IT solution architecture will be finalized as well. Final refinements will be made to all systems to ensure they meet all requirements, are secured in line with best practices, tested, and are seamlessly integrated well in advance of the 2020 Census operations. The field offices and other nationwide field infrastructure must be stood up this year, with the first 40 offices opening between January and March of 2019. Key partnerships and other local relationships must be cultivated to ensure the Census Bureau can maximize self-response across all localities and
275.7 273.9 269.1
1,440
1,491
1,451
0
1,000
2,000
3,000
4,000
0
100
200
300
400
2017 2018 2019
Posi
tion
s
Dol
lars
in
Mill
ions
Current Surveys and ProgramsBudget Authority and Positions
Funding Positions
1,210.31,202.2
3,547.8
3,567 3,319
3,823
01,0002,0003,0004,0005,0006,0007,000
0
1,000
2,000
3,000
4,000
5,000
2017 2018 2019
Pos
itio
ns
Dol
lars
in
Mill
ions
Periodic Censuses and ProgramsBudget Authority and Positions
Funding Positions

Bureau of the Census
24 FY 2019 Budget in Brief
population groups. Several 2020 Census operations continue. The Redistricting Data Program, In-Office Address Canvassing, and the Local Update of Census Addresses, have been meeting critical milestones. In 2019, the Census Bureau will conduct its first major field operation – In-Field Address Canvassing – as it continues to build out the final address list, or frame, of the 2020 Census accurately and efficiently. Together, In-Office and In-Field Address Canvassing create the strong foundation that is required to conduct an accurate decennial census. The funding request for FY 2019 reflects the massive scope of work that must be completed prior to the start of FY 2020. At the start of FY 2019, the scope and design of the 2020 Census can no longer be altered. If the Census Bureau does not receive the funding requested for the entirety of this work, the quality of the 2020 Census will suffer. Executing a decennial census requires the proper integration of multiple IT systems with operational plans, methods, and procedures to be successful. If any of these elements fail or do not integrate properly, operations may be disrupted, costs could rise, data could be lost, or data quality could be compromised. To further emphasize the need to mitigate risk, the FY 2019 budget includes a risk reserve in line with Government Accountability Office best practices for a program of this importance and complexity. Mandated deadlines do not allow 2020 Census operations to be delayed; this makes appropriate contingency planning and funding even more critical.
A key piece of enabling technology that underpins the 2020 Census is the Census Enterprise Data Collection and Processing (CEDCaP) program. With CEDCaP, Census is creating an integrated and standardized suite of systems that offers shared data collection and processing services across the enterprise. Census will consolidate costs by retiring unique, survey-specific systems and redundant capabilities. The enterprise solution will be mature and proven for the 2020 Census, becoming a permanent enterprise data collection and processing environment. CEDCaP works in concert with the 2020 Census program, which funds several of the systems that, combined, move Census toward common enterprise solutions for data collection and processing functions.
With the Center for Enterprise Dissemination Services and Consumer Information (CEDSCI), the Census Bureau will meet its goal to unlock the potential of its data and products to better meet the needs of its users. This budget request includes funding that would create new products enabling users such as businesses, policy makers, and the American public to make better data-driven decisions based on credible statistics, easy-to-use tools, and standardized data elements. Broad dissemination of Census’s economic, demographic, and housing data, and the analysis that comes with those releases, fuels the world's largest economy; helps local planners project future needs for public services; measures and helps assess the performance of government programs; and empowers individuals to innovate, create jobs, and launch new enterprises. Keeping pace with increasing customer demands driven by technological innovation is important to the mission of disseminating data that helps measure the Nation’s progress, maintains oversight of government, and enables innovation that strengthens America’s economy. To accomplish these goals, Census has embarked upon a multiyear, innovative effort to transform and expand the dissemination of Census content. It empowers data users to find, access, connect, and use data in ways that better their lives and communities, and it stimulates economic invention and growth. Such a comprehensive transformation requires leadership and insight to achieve an efficient yet impactful outcome.
Finally, in FY 2019, the Census Bureau will continue implementation and begin data releases from the reengineered 2017 Economic Census and the 2017 Census of Governments. These important programs set the baseline for critical monthly, quarterly, and annual economic indicators. The design of 2017 censuses will reduce respondent burden through the use of Internet data collection and administrative records, automate operations to improve productivity, and improve data products to reflect the dynamic US economy. The first Economic Census data will be released in 2019 and the Census of Governments will release data on the finances of state and local governments.
The President’s FY 2019 budget request enables the Department of Commerce to achieve its goal of generating jobs, increasing trade, and advancing scientific understanding by providing timely, relevant, trusted, and accurate data needed by policymakers and public and private decision makers.

Bureau of the Census
FY 2019 Budget in Brief 25
Summary of Appropriations
2017 2018 2019 IncreaseDiscretionary Appropriations Actual Annualized CR Estimate (Decrease)Current Surveys and Programs $270,000 $268,166 $249,125 ($19,041)Periodic Censuses and Programs 1,200,000 1,191,868 3,551,388 2,359,520
Total Appropriation 1,470,000 1,460,034 3,800,513 2,340,479
Permanent AppropriationsState Children's Health Insurance Program 20,000 20,000 20,000 0Transfers from other accounts to Mandatory 0 0 0 0Sequestration from Mandatory (1,380) (1,320) 0 1,320Transfers from CS&P to other accounts (12,925) (12,925) 0 12,925Transfers from other accounts to PC&P 12,925 12,925 0 (12,925)Transfers from PC&P to other accounts (2,580) (2,580) (3,556) (976)
Budget AuthorityCurrent Surveys and Programs 275,695 273,921 269,125 (4,796)Periodic Censuses and Programs 1,210,345 1,202,213 3,547,832 2,345,619
Total Budget Authority 1,486,040 1,476,134 3,816,957 2,340,823

Bureau of the Census
26 FY 2019 Budget in Brief
Positions and Civilian Full-Time Equivalent Employment 2017 2018 2019 IncreaseActual Annualized CR Estimate (Decrease)
PositionsCurrent Surveys and Programs - Direct Discretionary, TotalFull Time Permanent 1,375 1,427 1,387 (40)Other Than Full Time Permanent 535 575 542 (33) Subtotal 1,910 2,002 1,929 (73)Periodic Censuses and Programs - Direct Discretionary, TotalFull Time Permanent 3,567 3,319 3,823 504Other Than Full Time Permanent 3,278 4,178 87,963 83,785 Subtotal 6,845 7,497 91,786 84,289
Total, Discretionary Positions 8,755 9,499 93,715 84,216
Current Surveys and Programs - Direct Mandatory, TotalFull Time Permanent 65 64 64 0Other Than Full Time Permanent 307 488 488 0 Subtotal 372 552 552 0Working Capital Fund - Reimbursable, TotalFull Time Permanent 1,424 1,424 1,607 183Other Than Full Time Permanent 3,914 3,745 5,304 1,559 Subtotal 5,338 5,169 6,911 1,742Total, Positions 14,465 15,220 101,178 85,958
Civilian Full-Time Equivalent EmploymentCurrent Surveys and Programs - Direct Discretionary, TotalFull Time Permanent 1,319 1,339 1,299 (40)Other Than Full Time Permanent 212 313 280 (33) Subtotal 1,531 1,652 1,579 (73)Periodic Censuses and Programs - Direct Discretionary, TotalFull Time Permanent 3,442 3,133 3,530 397Other Than Full Time Permanent 1,292 2,156 10,872 8,716 Subtotal 4,734 5,289 14,402 9,113
Total, Discretionary FTE 6,265 6,941 15,981 9,040
Current Surveys and Programs - Direct Mandatory, TotalFull Time Permanent 62 55 55 0Other Than Full Time Permanent 121 232 232 0 Subtotal 183 287 287 0Working Capital Fund - Reimbursable, TotalFull Time Permanent 1,374 1,169 1,592 423Other Than Full Time Permanent 1,539 1,556 1,976 420 Subtotal 2,913 2,725 3,568 843
Total, FTE 9,361 9,953 19,836 9,883

Bureau of the Census
FY 2019 Budget in Brief 27
Highlights of Budget Changes
Appropriation: Current Surveys and Programs Summary of Requirements
Detailed SummaryPositions Amount Positions Amount
2018 Annualized CR 1,427 $268,166Transfer to PC&P (12,925)Adjustments to BaseOther Changes
FY 2018 Pay raise $974 Civil Service Retirement System (CSRS) (171) Federal Employees' Retirement System (FERS) 335 Thrift Savings Plan (TSP) 326 Federal Insurance Contributions Act (FICA) - OASDI 154 Health insurance 459 Employees' Compensation Fund (251) Compensable Day 669 Travel - Per Diem 15 Travel - Mileage (24) Rent payments to GSA 211 Postage 56 Printing and reproduction 11 National Archives and Records Administration (NARA) (114) Other Services: Commerce Business System 99 Working Capital Fund (DM) 1,396 General Pricing Level Adjustment: Transportation of things 3 Rental payments to others 2 Communications, utilities and miscellaneous 10 Other services 609 Supplies and materials 13 Equipment 12
Subtotal, other changes 0 4,794
Total, Adjustments to Base 0 (8,131)2019 Base 1,427 260,035Program Changes (40) (10,910)2019 Appropriation 1,387 249,125

Bureau of the Census
28 FY 2019 Budget in Brief
Comparison by Activity 2018 Annualized CR 2019 Base 2019 Estimate
DISCRETIONARY BUDGET AUTHORITY Pos Amount Pos Amount Pos Amount Pos Amount
Current Surveys and Statistics
Current Economic Statistics 1,088 $171,891 1,079 $173,986 1,079 $173,986 0 $0 Current Demographic Statistics 339 83,350 348 86,049 308 75,139 (40) (10,910)
Total, Discretionary Budget Authority 1,427 255,241 1,427 260,035 1,387 249,125 (40) (10,910)
MANDATORY BUDGET AUTHORITY State Children's Health Insurance Program 64 18,680 64 20,000 64 20,000 0 0
Total, Mandatory Budget Authority 64 18,680 64 20,000 64 20,000 0 0
TOTAL BUDGET AUTHORITY / 1,491 273,921 1,491 280,035 1,451 269,125 (40) (10,910)
FINANCING
Transfers to other accounts 12,925 0
Sequestration 1,320 0
Less Permanent Appropriation (64) (20,000) (64) (20,000)
TOTAL APPROPRIATION 1,427 268,166 1,387 249,125
Increase / Decrease
Highlights of Program Changes
Base Increase / Decrease Current Demographic Statistics Positions Amount Positions Amount
Current Demographic Statistics 348 $86,049 -40 -$10,910
In FY 2019, the Current Demographic Statistics programs funding levels will allow for Current Population Survey data collection, the production of a Supplemental Poverty Measure (SPM), and the production of Small Area Health Insurance Estimates (SAHIE); and will allow the first wave of the new FY 2019 SIPP Panel to include approximately 31,900 households. In addition, the national population projections will be calculated once every four years, and outreach and benchmarking work for international migration will be prioritized to meet the most critical needs. Finally, the Census Bureau will also move from biannual to annual processing of MAF updates for current demographic surveys, reduce resources for hardware and software updates and maintenance, and prioritize research initiatives focused on reducing costs and increasing quality for the current demographic surveys.

Bureau of the Census
FY 2019 Budget in Brief 29
Appropriation: Periodic Censuses and Programs Summary of Requirements
Detailed SummaryPositions Amount Positions Amount
2018 Annualized CR 3,319 $1,191,868Transfer to OIG 0 (2,580)Transfer from CS&P 0 12,925Recoveries offsetting request for Base Budget Authority 0 (36,406)Adjustments to BaseOther Changes FY 2018 Pay raise $2,509
Civil Service Retirement System (CSRS) (512)
Federal Employees' Retirement System (FERS) 1,002
Thrift Savings Plan (TSP) 973
Federal Insurance Contribution Act (FICA) - OASDI 461
Health Insurance 1,160
Employees' Compensation Fund (540)
Compensable Day 1,958
Travel - Per Diem 18
Travel - Mileage (122)
Rent payments to GSA 850
Postage 498
Printing and reproduction 97
General pricing level adjustment:
Transportation of things 17
Rental payments to others 8
Communications, utilities, and miscellaneous charges 90
Other services 8,217
Supplies and materials 46
Equipment 722
Subtotal, other changes 0 17,452
Total Adjustments to Base 0 (18,954)2019 Base 3,319 1,183,259Program Changes 504 2,364,573Transfer to OIG 3,5562019 APPROPRIATION 3,823 3,551,388

Bureau of the Census
30 FY 2019 Budget in Brief
Comparison by Activity
2018 Annualized CR 2019 Base 2019 Estimate
BUDGET AUTHORITY Pos Amount Pos Amount Pos Amount Pos Amount
Periodic Economic Statistics 643 108,806 643 79,013 970 108,299 327 29,286
Decennial Census 2,269 982,255 1,957 880,991 2,164 3,226,551 207 2,345,560
Geographic Support 262 58,562 262 59,725 262 59,725 0 0
Enterprise Data Collection and Dissemination Systems 145 52,590 457 163,530 427 153,257 (30) (10,273)
TOTAL BUDGET AUTHORITY / 3,319 1,202,213 3,319 1,183,259 3,823 3,547,832 504 2,364,573
Transfer from CS&P (12,925)
Transfer to OIG 2,580 3,556
TOTAL APPROPRIATION 3,319 1,191,868 3,823 3,551,388
Increase / Decrease
Highlights of Program Changes
Periodic Economic Statistics
Base Increase / Decrease Positions Amount Positions Amount Economic Census 593 $72,885 +278 +$26,588
FY 2019 represents the fifth year of the six-year 2017 Economic Census cycle. Efforts in FY 2019 include continued collection and processing of the data as well as analytical review and initial publication of data. The Census Bureau will conduct follow-up activities to increase response, will finish data collection, close out the Business Register; begin analytical data review, and release advance data by late FY 2019. This work includes collecting the data via the Internet, follow-up reminders through mail and telephone, providing phone and web assistance for internet respondents, continuing to process the data, resolution of questionable data and edit referrals, and review of tabulated data. The Economic Census will leverage a new data dissemination system being developed for the Census Bureau. Additionally, work will continue on the development of standardized data review guidelines, continued improvement of data analysis systems, exploring the use of “big data” to supplement data received from businesses, and new strategies for publicizing and disseminating survey results. This will be followed in FY 2020 by continued data review and dissemination activities (micro and macro review of data at detailed levels, preparation for and actual release of data). In addition to the budget authority requested for the Economic Census, an additional $28.5 million in budgetary resources will be derived from recoveries of prior year obligations from programs across the Periodic Censuses and Programs account.
Census of Governments 50 $6,128 +49 +$2,698
FY 2019 is the fourth year of the five-year cycle for the 2017 Census of Governments. Efforts in FY 2019 shift from preparatory activities, like designing the operations and determining the content, to collection and processing of the data. In FY 2019, the Census Bureau will continue processing of the 2017 Census of Governments’ Organization and Finance components. The Census Bureau will also begin evaluations of the 2017 Census of Governments to inform planning for the 2022 Census of Governments. The Census Bureau will leverage enterprise solutions when feasible to increase cost-effectiveness. The Census Bureau will also continue to develop and implement more effective data editing strategies to increase efficiencies of data processing. In addition to the budget authority requested for the Census of Governments, an additional $2.9 million in budgetary resources will be derived from recoveries of prior year obligations from programs across the Periodic Censuses and Programs account.

Bureau of the Census
FY 2019 Budget in Brief 31
Base Increase / Decrease Decennial Census Positions Amount Positions Amount 2020 Census 1,062 $662,841 +240 +$2,352,303
After a decade of intensive research, testing, and operational planning, the Census Bureau is approaching the peak operations of the 2020 Census. In FY 2019, the 2020 Census will conduct its first major field operation – the in-field address canvassing operation – and thousands of temporary employees will be hired to carry out this crucial final update of the 2020 Census address list. Forty field offices will open to support this operation in January 2019 and the remainder of the planned 248 offices will open in the Summer. Key partnerships and other local relationships will be formed to ensure that the Census Bureau can maximize self-response throughout the Nation, and media buys for the 2020 Census will begin. Final refinements to each of the systems supporting 2020 data collection and processing operations will be completed and the systems will be secured to protect the data that the Nation provides. Decisions will be made about which households will get a paper 2020 Census questionnaire and which will be invited to respond over the Internet. Materials inviting households to respond will be printed, as will multi-language fact sheets and brochures that will enable all to respond. Finally, dozens of smaller operations, like the Local Update of Census Addresses, the Redistricting Data Program, the Group Quarters Operation, and 2020 Census data collection operations in Puerto Rico and the Island Areas, will either be underway or in the final planning stages. American Community Survey 895 $218,150 -33 -$6,743
In FY 2019, the ACS will use three modes of data collection (i.e., mail, internet, and Computer-Assisted Personal Interview). To improve the efficiency of the survey, the ACS is terminating the Computer-Assisted Telephone Interviewing (CATI) of nonresponse follow-up operations. In addition to the budget authority requested for the ACS, an additional $5.0 million in budgetary resources will be derived from recoveries of prior year obligations from programs across the Periodic Censuses and Programs account.
Enterprise Data Collection and Dissemination Systems
Center for Enterprise Dissemination Services and Consumer Information 97 $37,526 +22 +$19,287
The Census Bureau has embarked upon a multiyear, innovative effort to transform and expand the dissemination of datasets and statistics. Through the Center for Enterprise Dissemination Services and Consumer Innovation (CEDSCI), the initiative empowers data users to discover, to access, to connect, and to use data in new ways that better inform decision making. In FY 2019, the CEDSCI program will complete development of the Census Bureau’s new data dissemination platform in time to support dissemination of data from the 2020 Census, offering a vastly improved customer experience for data users. The legacy American Fact Finder will be retired and CEDSCI will become the primary data dissemination system for the Census Bureau.
Census Enterprise Data Collection and Processing 295 $103,477 -30 -$24,638
FY 2019 is the fifth year of the CEDCaP initiative. Timing and delivery of the CEDCaP components are sequenced to ensure readiness for use by the 2020 Census. Development of CEDCaP capabilities is funded by the Enterprise Data Collection and Dissemination Systems, while the scaling of systems for 2020 Census operational workloads is funded in the 2020 Census program. In FY 2019, the program will resolve the appropriate technical defects, bugs, or issues discovered during the 2018 Decennial Census End-to-End Test in preparation for the use of the systems during 2020 Census operations deliver capabilities in support of the 2020 Census Address Canvassing operation, and support the Decennial program with performance and integration testing. Administrative Records Clearinghouse 40 $9,446 -22 -$4,922
The Administrative Records Clearinghouse (Electronic Data Interface and Interchange (EDII), provides policymakers access to powerful new insights and evidence for sound decision-making. EDII will continue to expedite the acquisition of Federal and federally-sponsored administrative data sources by improving the techniques used to document and link the various data sets to each other, ensuring that the data are safeguarded and that use is closely monitored to ensure privacy and confidentiality. In FY 2019, planned enhancements to data management and analytic capacity will be reduced, although work will continue to progress on evidence building pilots involving veterans, manufacturing, employment, and student loans. EDII will also continue to prototype activities to acquire more data, improve infrastructure, and improve access.

Bureau of the Census
32 FY 2019 Budget in Brief

Bureau of the Census
FY 2019 Budget in Brief 33
Performance Indicators The following table shows the Census Bureau performance indicators. Additional details appear at the end of the Census Bureau section of the Department of Commerce budget.
2017 2017 2018 2019 Target Actual Target Target
2020 Decennial planned operational efficiencies and program milestones met
1) Complete the 2016 address canvassing test; 2) Conduct a nationwide
mail-out test of self-response 3) Begin
building a partnership database in FY 2017 and begin planning of 2020
Census Integrated Communications
1) Completed the 2016 address canvassing test;
2) Conducted a nationwide mail-out test
of self-response; 3) Began building a
partnership database in FY 2017 and began
planning of 2020 Census Integrated
Communications
1) Finalize the Language Support Plan and non-English questionnaire materials for the 2020
Census; 2) Implement the LUCA
for the 2020 Census; 3) Conduct Self
Response operations for the 2018 End-to-End
Census Test; 4)Deliver Census
Questions to Congress; 5) Open 2020 Regional
Census Centers; 6) Identify space, sign
leases, and design/buildout Wave 1
and 2 Area Census Offices;
7) Complete Authorization to Operate
process related to the 2020 Census as
scheduled with less than 15% of Plans of Action
and Milestones exceeding their completion date
1) Conduct the Address Canvassing Operations
for 2020 Decennial Census;
2) Open Area Census Offices;
3) Ensure that the final 2020 Census
Architecture and IT Roadmap reflects the latest Census system
design; 4) Deliver final 2020 Census Operational
Plan; 5) Complete
Authorization to Operate process related to the
2020 Census as scheduled with less than 15% of Plans of Action
and Milestones exceeding their completion date
Milestones met in developing Census IT enterprise to enhance collection, processing, and dissemination of data
1) Release CEDCaP capabilities for the 2017 Economic Census; 2)
Release CEDCaP capabilities for the 2017 Census test (Decennial);
3) Release CEDCaP capabilities for the 2018
Address Canvassing End-to-End Test
1) Released CEDCaP capabilities for the 2017
Economic Census 2) Released CEDCaP
capabilities for the 2017 Census test (Decennial);
3) Released CEDCaP capabilities for the 2018
Address Canvassing End-to-End Test
(Decennial)
1) Release CEDCaP capabilities for the 2018
End-to-End Test (Decennial)
2) Release 75% of American Fact Finder
datasets via the Census Enterprise Dissemination Services and Consumer Information (CEDSCI)
1) Release systems into production in support of the early 2020 Census Operations including Address Canvassing 2) Release 100% of
American Fact Finder dataset via CEDSCI and
10% of non-American Fact Finder datasets
released Percentage of key data products for Census Bureau programs released on time to support effective decision-making of policymakers, businesses and the public
1) 100% of Economic Indicators; 2) 90% of other key products
1) 100% of Economic Indicators; 2) 85% of other key products
85% of key products 85% of key products
Complete key activities in support of the Economic Census and Census of Governments on time (NEW)
Majority of key activities completed by the end of
the fiscal year: 1) Economic Census and 2) Census of Governments
Majority of key activities completed by the end of
the fiscal year: 1) Economic Census and 2) Census of Governments
Majority of key activities completed by the end of
the fiscal year: 1) Economic Census and 2) Census of Governments
Majority of key activities completed by the end of
the fiscal year: 1) Economic Census and 2) Census of Governments

Bureau of the Census
34 FY 2019 Budget in Brief
2017 2017 2018 2019 Target Actual Target Target Percentage of key activities for cyclical census programs completed on time to support effective decision-making by policymakers, businesses and the public
90% 100% Discontinued
Percentage of principal economic indicators released on time (NEW)
100% of Economic Indicators
100% of Economic Indicators
100% of Economic Indicators
100% of Economic Indicators
Percentage of key activities for cyclical census programs completed on time to support effective decision-making by policymakers, businesses, and the public
90% 100% Discontinued

Bureau of Economic Analysis
FY 2019 Budget in Brief 35
Bureau of Economic Analysis Bureau of Economic Analysis (BEA). Although a relatively small agency, BEA produces some of the most closely watched and influential economic indicators, such as gross domestic product (GDP) and the trade balance, that directly affect decisions made by policy makers, business leaders, and the American public. BEA is an independent, principal Federal statistical agency that promotes a better understanding of the U.S. economy by providing timely, relevant, and accurate economic accounts data in an objective and cost-effective manner. BEA’s national, industry, regional, and international economic accounts present valuable information on U.S. economic growth, regional economic development, inter-industry relationships, and the Nation's position in the world economy. Some of the widely used statistical measures produced by BEA include GDP, personal income and outlays, corporate profits, GDP by state and by metropolitan area, balance of payments, and GDP by industry. These statistics are used by Federal, state, and local governments for budget development and projections; by the Federal Reserve for monetary policy; by the business sector for planning and investment; and by the American public to follow and understand the performance of the Nation’s economy. BEA’s strategic vision is to remain the world’s most respected producer of economic accounts. Strategies for achieving this vision include improving the scope, timeliness and accuracy of BEA’s statistics, are described in the Bureau’s strategic plan.
In FY 2019, BEA will continue to fulfill its mission to preserve the timeliness, relevance, and accuracy of economic statistics while taking necessary steps to reduce duplication, streamline operations, and realize efficiencies. As part, BEA will continue to explore new and nontraditional data sources to improve the accuracy and coverage of its official statistics, research expanding the geographic detail of GDP to over 3,100 U.S. counties and work to accelerate key data sources for the initial estimates of GDP for more accurate early reads of U.S. economic growth.
Under Secretary for Economic Affairs. The FY 2018 Budget proposed the consolidation of the Economics and Statistics Administration’s (ESA) administrative functions within BEA, the Census Bureau, and the Office of the Under Secretary for Economic Affairs. The FY 2019 Budget carries forward this efficiency while also supporting 9 positions that directly assist the Under Secretary for Economic Affairs in carrying out official oversight responsibilities of BEA and the Census Bureau in recognition of the criticality of and heightened attention to major initiatives within these bureaus, such as the 2020 Decennial Census. The Under Secretary for Economic Affairs will continue to provide leadership and policy guidance to the Department’s economic and statistical community. As the chief economic advisor to the Secretary, the Under Secretary also provides analysis on economic developments, domestic fiscal and monetary policies, and analyzes economic conditions and policy initiatives of major trading partners.
107.3 106.6 101.0
522 522 502
400
500
600
700
020406080
100120140
2017 2018 2019
Posi
tions
Dol
lars
in
Mill
ions
Budget Authority and Positions
Funding Positions

Bureau of the Economic Analysis
36 FY 2019 Budget in Brief
Summary of Appropriations 2017 2018 2019 Increase
Appropriation Actual Annualized CR Estimate (Decrease)Salaries and Expenses $107,300 $106,571 $100,987 ($5,584)
Total Appropriation / Budget Authority 107,300 106,571 100,987 (5,584)
PositionsSalaries and Expenses - Direct 522 522 502 (20)Salaries and Expenses - Reimbursable 51 26 11 (15)
Total 573 548 513 (35)
Civilian Full-Time Equivalent EmploymentSalaries and Expenses - Direct 497 497 490 (7)Salaries and Expenses - Reimbursable 26 26 11 (15)
Total 523 523 501 (22)

Bureau of Economic Analysis
FY 2019 Budget in Brief 37
Highlights of Budget Changes Appropriation: Salaries and Expenses Summary of Requirements
Detailed SummaryPositions Amount Positions Amount
2018 Annualized CR 522 $106,571Adjustments to BaseOther Changes FY 2018 Pay raise $272
Civil Service Retirement System (CSRS) (82)Federal Employees' Retirement System (FERS) 150Thrift Savings Plan 23Federal Insurance Contributions Act (FICA) - OASDI 109Health insurance 20Compensable Day 283Employees' Compensation Fund (47)Travel: Per Diem 3Rental payments to GSA 203Printing and reproduction 1NARA (2)Other services:
Working Capital Fund (265)General Pricing Level Adjustments
Transportation of things 3Communications, utilities, and miscellaneous charges 14Other services 278Rental payments to othersSupplies 30Equipment 12
Subtotal, other changes 0 1,005
Total, Adjustments to Base 0 1,0052019 Base 522 107,576Program Changes (20) (6,589)2019 Appropriation 502 100,987

Bureau of the Economic Analysis
38 FY 2019 Budget in Brief
Comparison by Activity
Direct Obligations Pos Amount Pos Amount Pos Amount Pos Amount
Bureau of Economic Analysis 506 $103,121 506 $104,126 494 $97,987 (12) ($6,139)
Policy Support 16 3,450 16 3,450 0 0 (16) (3,450)Under Secretary for Economic Affairs 0 0 0 0 9 3,000 9 3,000
Total Direct Obligations 522 106,571 522 107,576 503 100,987 (19) (6,589)Reimbursable Authority 26 5,165 11 2,515 11 2,515 0 0
TOTAL OBLIGATIONS 548 111,736 533 110,091 514 103,502 (19) (6,589)
FINANCING
Ofsetting collections from:
Federal funds (25) (4,754) (10) (2,104)
Non-Federal sources (1) (411) (1) (411)
Subtotal, financing (26) (5,165) (11) (2,515)
TOTAL BUDGET AUTHORITY / 522 106,571 503 100,987 APPROPRIATION
2018 Annualized CR 2019 Base 2019 Estimate Increase / Decrease
Highlights of Program Changes
Base Increase / Decrease Positions Amount Positions Amount
Bureau of Economic Analysis 506 104,126 -12 -6,139
To realize budgetary savings at the FY19 funding level while preserving the timeliness, relevance, and accuracy of some of the Nation’s most critical economic statistics the budget proposes three programmatic reductions. BEA will discontinue efforts to separately measure the impact of small businesses on the U.S. economy; research aimed at incorporating new, improved measures of health care into the core Gross Domestic Product accounts; and provide more frequent and detailed trade in services data for some of the most dynamic industries of the U.S. economy.
Policy Support 16 3,450 -16 -3,450
In an effort to reduce duplication, streamline operations, and realize budget efficiency, the budget consolidates the Economics and Statistics Administration (ESA) as a Bureau within BEA, the Office of the Secretary, and the Census Bureau. Due to this consolidation, $0 is requested for Economic Policy Support in FY 2019.
Under Secretary for Economic Affairs 0 0 9 3,000
The Under Secretary for Economic Affairs will reside as a discrete office to directly support the Secretary to ensure that Commerce economic and statistical analysis programs align with Departmental goals and will provide program support, policy guidance, and oversight. The Under Secretary leads and has oversight of both BEA and the Census Bureau on high priority management, budget, employment, and risk management issues, integrating such work with the priorities and requirements of the Department and other government entities. Such support includes advising the Secretary and other Government officials on matters related to economic developments, and the development of positions relating to economic policy and participation in White House policy councils and the Secretary’s role on the Board of the Pension Benefit Guaranty Corporation (PBGC). The resources devoted to these efforts by BEA are shown in the functional table below under direct obligations.

Bureau of Economic Analysis
FY 2019 Budget in Brief 39
Performance Indicators
The following table shows BEA’s performance indicators. Additional details appear at the end of the Bureau of Economic Analysis section of the Department of Commerce budget.
2017 2017 2018 2019 Target Actual Target Target Reliability of delivery of economic data (number of scheduled releases issued on time)
74 74 74 74
Customer satisfaction with quality of products and services (mean rating on a 5-point scale)
4.0 4.2 4.0 4.0
Percent of GDP estimates correct 85% 88% 85% 85%
Improvement of GDP and the economic accounts
Successful completion of Strategic Plan
milestones Met
Successful completion of Strategic Plan
milestones
Successful completion of Strategic Plan
milestones
Milestones met to explore and examine future economic data sources
Evaluate effectiveness of agreements and
extend / modify / cancel as appropriate
Two agreements under Negotiation Discontinued N/A
Milestones met to explore and examine future economic products and datasets Execute POA&M POA&M Executed Discontinued N/A

Bureau of the Economic Analysis
40 FY 2019 Budget in Brief

International Trade Administration
FY 2019 Budget in Brief 41
International Trade Administration The mission of the International Trade Administration (ITA) is to create prosperity by strengthening the international competitiveness of U.S. industry, promoting trade and investment, and ensuring fair trade and compliance with trade laws and agreements.
ITA accomplishes its mission through the integrated efforts of four organizational units and their mission priorities:
Industry and Analysis: Industry and Analysis (I&A) provides unique sectoral and analytical expertise that underpins USG objectives on competitiveness, trade policy, and trade promotion. I&A also makes data, analytical tools, and market intelligence easily available to U.S. businesses and government agencies to empower informed decision-making on complex trade issues and level the playing field for U.S. firms. I&A plays a unique role in the U.S. Government by:
• Employing industry, standards, and economic expertise to advocate for the removal of the barriers to U.S. products and services in foreign markets;
• Providing expert economic analysis to model complex policy responses to unfair trade practices and ensure that policy responses to unfair foreign trade actions support U.S. companies and American workers;
• Coordinating the Department’s participation on the interagency Committee of Foreign Investment in the United States (CFIUS);
• Developing innovative market intelligence products that provide critical information directly to the public and businesses to inform decision making and help companies succeed in foreign markets; and,
• Ensuring that thousands of businesses can continue transferring data to foreign markets through the design and administration of the U.S.-EU and U.S.-Swiss Privacy Shield Programs and by preventing data localization rules that would unfairly disadvantage U.S. business in other markets.
Enforcement and Compliance: Enforcement and Compliance (E&C) takes prompt, aggressive action against unfair foreign trade practices and foreign-government imposed trade barriers by enforcing U.S. trade laws, monitoring and seeking compliance with existing trade agreements, and aiding in the negotiation of new trade agreements to address trade-impeding and trade-distorting practices. The E&C unit:
• Defends U.S. manufacturers, workers, and farmers against injurious dumped and unfairly subsidized imports by conducting investigations and reviews under the U.S. antidumping duty (AD) and countervailing duty (CVD) laws, and ordering the collection of duties to offset the unfair trading practices of foreign governments and exporters;
• Develops and executes other programs and policies designed to reduce the prevalence of market distortions in foreign government activities that can lead to unfair trade practices;
• Assists U.S. exporters and investors subject to foreign government trade and investment barriers by working to ensure foreign government compliance with international trade agreement obligations; and,
• Coordinates the representation of U.S. commercial interests in designated bilateral, multilateral, and regional trade and investment negotiations, in addition to overseeing the formulation and implementation of policies related to a wide range of trade agreement topics.
Global Markets: Global Markets (GM) provides a comprehensive suite of export promotion services and market access advocacy for U.S. firms, and promotes investment in the United States. GM delivers these services through a network of domestic, overseas, and headquarters offices, giving U.S. business and state and local entities unparalleled access to a network of international trade experts. The GM unit:
• Levels the international playing field for American exporters and workers; • Seeks to remove market barriers and unfair trading practices, so U.S. business can compete and win in the global
marketplace; • Links U.S. exporters to global opportunities and distribution channels, especially for small and medium-sized
enterprises (SMEs); and, • Attracts inward investment into the United States.
483.0 479.7 445.1
1,831 1,831 1,703
500
1,000
1,500
2,000
2,500
300
400
500
600
700
800
2017 2018 2019
Posi
tion
s
Dolla
rs in
Mill
ions
Direct Budget Authority and Positions
Funding Posit ions

International Trade Administration
42 FY 2019 Budget in Brief
GM is integral to the U.S. Government’s interagency effort to develop and implement market access and compliance strategies to remove foreign trade barriers, enforce trade agreements, and promote U.S. business growth in global markets.
Executive Direction and Administration: Executive Direction and Administration (ExAd) supports both enforcement and compliance with U.S. trade laws, and U.S. trade and investment expansion. ExAd does this through executive leadership; strategic planning to ensure efficient and effective execution and management of resources; and, the integration and coordination of policy and operations across ITA. ExAd directs information management and information technology strategy; provides development and maintenance services on the platforms that enable the ITA mission and management functions; and, ensures continuous operation and maintenance of the network infrastructure.
In FY 2019, ITA will strengthen trade enforcement and compliance including anti-dumping and countervailing duty investigations, while at the same time rescaling the agency’s export promotion and trade analysis activities. To complement these efforts, ITA is implementing plans to transform ITA operations to strengthen outcomes, improve efficiency, and meet trade and investment priorities. ITA’s transformational actions will be rooted in maximizing the delivery of ITA’s full value to clients, providing timely and actionable information and service to U.S. business (particularly SMEs), eliminating or reducing lower-priority functions and activities, strengthening higher priority activities, and modernizing information management.
Summary of Appropriations
2017 2018 2019 IncreaseAppropriation Actual Annualized CR Estimate (Decrease)
Operations and Administration $483,000 $479,720 $440,147 ($39,573)
Total, Appropriation 483,000 479,720 440,147 (39,573)Transfer 5,000
Reimbursable - Other 14,826 14,000 14,000 0
Reimbursable - Fees 11,000 11,000 11,000 0
Total, Budget Authority 508,826 504,720 470,147 (39,573)
PositionsOperations and Administration - Direct 1,831 1,831 1,703 (128)Operations and Administration - Reimbursable 49 49 49 0
Total 1,880 1,880 1,752 (128)
Civilian Full-Time Equivalent EmploymentOperations and Administration - Direct 1,615 1,647 1,530 (117)Operations and Administration - Reimbursable 36 36 36 0
Total 1,651 1,683 1,566 (117)

International Trade Administration
FY 2019 Budget in Brief 43
Highlights of Budget Changes
Appropriation: Operations and Administration Summary of Requirements
Detailed SummaryPositions Amount Positions Amount
2018 Annualized CR 1,831 $479,720
Adjustments to BaseOther Changes FY 2018 Pay raise $931 Civil Service Retirement System(CSRS) (114) Federal Employees' Retirement System(FERS) 206 Thrift Savings Plan 33 Federal Insurance Contributions Act (FICA) - OASDI 89 Health insurance 422 Compensable Day 866 Travel - Domestic per diem 22 Travel - Foreign per diem 63 Travel - Mileage (2) Rent payments to GSA 339 Postage 1 Printing and reproduction 27 NARA (15) Other services: Working Capital Fund 1,240 Commerce Business System 21 General Pricing Level Adjustment: Transportation of things 63 Rental payments to others 8 Other Services 840 Supplies 48 Equipment 140 Overseas price increases 472 Subtotal, other changes 0 5,700Total, Adjustments to Base 0 5,7002019 Base 1,831 485,420Program Changes (128) (40,273)2019 Appropriation 1,703 445,147Transfer from other accounts (5,000)
2019 NET APPROPRIATION 1,703 440,147

International Trade Administration
44 FY 2019 Budget in Brief
Comparison by Activity 2018 Annualized CR 2019 Base 2019 Estimate
Direct Obligations Pos Amount Pos Amount Pos Amount Pos Amount
Industry and Analysis 227 $54,977 227 $55,648 214 $52,286 (13) ($3,362)Enforcement and Compliance 351 84,877 351 85,798 379 90,610 28 4,812Global Markets 1,137 317,073 1,137 320,960 1,004 276,479 (133) (44,481)Executive Direction / Administration 116 22,793 116 23,014 106 20,772 (10) (2,242)Survey of International Air Travelers 0 0 0 0 0 5,000 0 5,000
Total Direct Obligations 1,831 479,720 1,831 485,420 1,703 445,147 (128) (40,273)
Reimbursable Authority 49 25,000 49 25,000 49 25,000 0 0
TOTAL OBLIGATIONS 1,880 504,720 1,880 510,420 1,752 470,147 (128) (40,273)
FINANCING
Offsetting collections from:
Federal funds (14,000) (14,000)
Non-Federal sources
Subtotal, f inancing (14,000) (14,000)
TOTAL BUDGET AUTHORITY 1,880 490,720 1,752 456,147
Less Transfers from other Accounts 0 0 0 (5,000)
Less Fee collections 0 (11,000) 0 (11,000)
TOTAL APPROPRIATION 1,880 479,720 1,752 440,147
Increase / Decrease
Highlights of Program Changes
Base Increase / Decrease Strengthen Trade Enforcement & Analysis Positions Amount Positions Amount
Industry and Analysis 227 $55,648 +10 +$1,963
Enforcement and Compliance 351 $85,798 +28 +$4,812
ITA will strengthen trade enforcement and analysis capacity to address unfair trade practices impacting U.S. business. A total of $3.2 million of new resources within I&A and E&C will be used to meet current/anticipated workload demands associated Committee on Foreign Investment in the United States (CFIUS) enforcement cases, as well as the support of Section 201 and Section 232 cases. Within these resources, E&C will establish a team specifically dedicated to enforcement and administration of Section 232 cases. ITA will also strengthen industry and economics analytical capacity to meet unfair competition within emerging industries critical to the U.S. economy.
A total of $3.6 million in new resources continues a proposal within the Administration’s priorities to enhance E&C capacity to assist U.S. manufacturers and their workers through self-initiation of anti-dumping (AD) and countervailing duty (CVD) investigations.

International Trade Administration
FY 2019 Budget in Brief 45
Base Increase / Decrease Efficiency, Reprioritization, and Rescaling Operations Positions Amount Positions Amount
Industry and Analysis 227 $55,648 -23 -$5,325
Global Markets 1,137 $320,960 -133 -$44,481
Executive Direction and Administration 116 $23,014 -10 -$2,242
ITA is implementing plans to transform ITA operations to strengthen outcomes, improve efficiency, and meet trade and investment priorities by maximizing the delivery of ITA’s full value to clients; providing timely and actionable information and service to U.S. business (especially small and medium-sized enterprises); eliminating or reducing lower-priority functions and activities; strengthening higher priority activities including trade enforcement and compliance; and, modernizing information management.
Within I&A, this effort primarily includes streamlining trade promotion and other programs, eliminating the Market Development Cooperator Program (MDCP), and replacing discretionary appropriations funding the Survey of International Air Travelers (SIAT) with fee revenue.
Within Global Markets this effort encompasses rescaling export promotion and trade analysis efforts by closing overseas and domestic offices and reducing both headquarters and field staff.
Within Executive Direction and Administration this effort encompasses reductions in proportion with the rescaling of operations being undertaken by other ITA program units. Base Increase / Decrease Survey of International Air Travelers Positions Amount Positions Amount
Survey of International Air Travelers (SIAT) 0 $0 0 $5,000
ITA will administer the SIAT, which provides data used by existing tourism marketing organizations to encourage increased travel and tourism to the United States, to reflect a transfer of funds from the Trade Promotion Act fee revenue maintained by the Department of Homeland Security, U.S. Customs and Border Protection.

International Trade Administration
46 FY 2019 Budget in Brief
Performance Indicators The following table shows the ITA performance indicators. Additional details appear at the end of the ITA section of the Department of Commerce budget.
2017 2017 2018 2019 Target Actual Target Target Number of foreign trade barriers removed, reduced or avoided 80 115 126 136
Number of commercial diplomacy / advocacy wins 330 459 240 240
Export impact of prevention, reduction or removal of trade barriers – Dollars of exports created or retained (millions) $1,800 TBD $1,800 $1,800
Dollar exports generated from Export Trading Companies (billions) $24.0 $23.5 $24.0 $24.0
Exports generated annually from public-private partnerships (millions) $138 $325 N/A N/A
Percentage of clients highly likely to recommend GM assistance 82% 86% 83% 83%
Number of clients assisted by GM 28,000 30,110 24,000 24,000
Percentage of GM clients that achieved their export objectives 75% 78% 74% 74%
Number of investment clients assisted 2,400 6,671 2,800 3,040
Percentage of Compliance and Market Access cases initiated that are reviewed for agreement relevancy within the established time frame
90% 100% 90% 90%
Percent of antidumping duty (AD) and countervailing duty (CVD) determinations issued with statutory and/or regulatory deadlines
91% 97% 91% 91%
Percent of AD/CVD cash deposit and liquidation instructions issued accurately to U.S. Customs & Border Protection (CBP)
86% 99% 86% 86%
Percent of AD/CVD cash deposit and liquidation instructions issued timely to CBP 88% 96% 88% 88%
Number of trade agreement compliance cases resolved successfully 34 36 35 36
Number of AD/CVD petition counseling sessions 298 1,038 343 343 Percent of identified unfair trade practices affecting U.S. parties addressed through informal/formal intervention or dispute settlement
22% 27% 22% 22%
Percent of identified foreign trade remedy proceedings affecting and of interest to U.S. parties that are addressed through informal/formal intervention or dispute settlement
90% 92% 90% 90%

Bureau of Industry and Security
FY 2019 Budget in Brief 47
Bureau of Industry and Security The Bureau of Industry and Security (BIS) advances U.S. national security, foreign policy, and economic objectives by ensuring an effective export control and treaty compliance system, and by promoting continued U.S. leadership in strategic technologies. BIS accomplishes its mission by maintaining and strengthening adaptable, efficient, effective export controls and treaty compliance systems, along with active leadership and involvement in international export control regimes. BIS administers and enforces controls on the export of: (1) dual-use items having chiefly commercial uses but which could be used in conventional arms, weapons of mass destruction, terrorism, or by others who engage in illegal activities or human rights abuses; (2) less sensitive military items, and (3) certain other items such as those controlled for short supply. Controls are implemented in coordination with several other agencies through the Export Administration Regulations (EAR). The EAR set forth license requirements and licensing policy for exports of these items, and incorporate controls established by the four major multilateral export control regimes: the Australia Group (chemical and biological nonproliferation), the Missile Technology Control Regime, the Nuclear Suppliers Group, and the Wassenaar Arrangement (conventional arms and related goods, software, and technologies). Enforcement of the EAR is an essential aspect of the BIS mission. Enforcement efforts serve to encourage compliance, prevent and deter violators, disrupt illicit activities, and bring violators to justice. BIS’s law enforcement approach evaluates not only the parties engaged in the export, re-export, and transfer of sensitive commodities, software, and technology, but also the proposed end uses, end users, and destinations of concern. BIS actively enforces prohibitions related to certain foreign boycotts. BIS carries out activities to support the U.S. defense industrial base, including: conducting industry sector surveys and analyses, investigating threats to national security from specific imports, participating in the interagency Committee on Foreign Investment in the United States (CFIUS) process, and administering the Defense Priorities and Allocation System (DPAS). BIS consults closely with industry on the development of regulatory policy through its Technical Advisory Committees (TACs). The TACs provide valuable industry and academic input on trends in technology, and the likely impact of export control developments. BIS also conducts numerous outreach events throughout the United States and overseas to educate and update the public on export controls, as well as on policy. The 2019 President’s budget increase of $7.1 million will ensure that BIS has the capacity to conduct comprehensive reviews of investment activities to protect against foreign control of critical U.S. businesses, and to complete effectively studies related to the U.S. defense industrial base, and investigations identifying the impacts imports may have on U.S. national security.
112.5111.7
120.6
370 450 467
0
100
200
300
400
500
600
60
80
100
120
140
160
2017 2018 2019
Posi
tion
s
Dol
lars
in
Mill
ions
Budget Authority and Positions
Funding Positions

Bureau of Industry and Security
48 FY 2019 Budget in Brief
Summary of Appropriations 2017 2018 2019 Increase/
Appropriation Actual Annualized CR Estimate DecreaseOperations and Administration $114,507 $111,736 $120,647 $8,911
TOTAL, Budget Authority / Appropriation 114,507 111,736 120,647 8,911
PositionsOperations and Administration - Direct 370 450 467 17Operations and Administration - Reimbursable 2 2 2 0
Total 372 452 469 17
Civilian Full-Time Equivalent EmploymentOperations and Administration - Direct 367 432 449 17Operations and Administration - Reimbursable 2 2 2 0
Total 369 434 451 17

Bureau of Industry and Security
FY 2019 Budget in Brief 49
Highlights of Budget Changes
Appropriation: Operations and Administration
Summary of Requirements Detailed Summary
Positions Amount Positions Amount2018 Annualized CR 450 $111,736Adjustments to BaseOther Changes FY 2018 Pay raise $275 Full year cost in 2019 of positions financed for part year in 2018 755 Federal Employees' Retirement System (FERS) 86 Thrift Savings Plan 12 Federal Insurance Contributions Act (FICA/OASDI) 38 Health insurance 133 Compensable Day 241 Employee Compensation Fund (35) Travel - Mileage 7 Travel - Per diem 9 Rent payments to GSA 123 Printing and reproduction 1 NARA 12 Working Capital Fund 472 General Pricing Level Adjustment Transportation of things 5 Rental payments to others 1 Other services 214 Supplies 44 Equipment 45 Activities in support of licensing programs 1,662 Subtotal, other changes 0 4,100
Total, Adjustments to Base 0 4,1002019 Base 450 115,836Program Changes 17 4,8112019 Appropriation 467 120,647

Bureau of Industry and Security
50 FY 2019 Budget in Brief
Comparison by Activity
Direct Obligations Pos Amount Pos Amount Pos Amount Pos Amount
Management & Policy Coordination 15 $5,963 15 $6,168 15 $6,168 0 $0
Export Administration 218 58,220 218 60,270 235 65,081 17 4,811
Export Enforcement 217 47,553 217 49,398 217 49,398 0 0
Total Direct Obligations 450 111,736 450 115,836 467 120,647 17 4,811
Reimbursable Authority 2 2,900 2 2,900 2 2,900 0 0
TOTAL OBLIGATIONS 452 114,636 452 118,736 469 123,547 17 4,811
FINANCING
Unoblig bal, start of year (Reimbursable) 0
Offsetting collections from:
Federal funds (2) (1,508) (2) (1,508)
Non-Federal sources (1,392) (1,392)
Subtotal, financing (2) (2,900) (2) (2,900)
TOTAL BUDGET AUTHORITY / 450 111,736 467 120,647 APPROPRIATION
2018 Annualized CR 2019 Base 2019 Estimate Increase / Decrease
Highlights of Program Changes
Base Increase / Decrease Positions Amount Positions Amount
Export Administration (EA) 218 60,270 +17 +$4,811
Foreign Investment Reviews (4 POS, +$640) -- This request will address increased workload associated with CFIUS, the interagency committee chaired by Treasury, which conducts national security reviews of mergers, acquisitions or takeovers that could result in foreign control of a U.S. business. Should a particular transaction raise national security concerns, CFIUS has the authority to mitigate those national security concerns, or it may recommend that the President prohibit or suspend the transaction. BIS, supports the Department of Commerce in its role as part of the interagency team that reviews all filings with CFIUS.
CFIUS cases increasingly are focused on areas within BIS-related responsibilities, including the purchase of companies that produce or trade in items subject to the Export Administration Regulations. The additional resources will ensure BIS is able to conduct comprehensive reviews of each transaction within the established statutory deadlines, and provide expert support and advice on national security issues during policy deliberations on complex cases. CFIUS experienced a 45 percent increased caseload in CY 2017 compared to the previous record caseload seen in FY 2016. The average number of CFIUS cases reviewed per fiscal year per BIS analyst has risen from approximately 15 in CY 2010 to 24 in FY 2014, to more than 33 per analyst in FY 2017. Since CY 2010, the number of cases reviewed per analyst dropped only once on a year-by-year basis—that was in CY 2012, 14 cases were reviewed per analyst.
Section 232 Import Investigations and Defense Industrial Base Studies (13 POS, +$4,171) -- This request will address the increased workload associated with the Section 232 investigations, under the Trade Expansion Act of 1962, that examine the effect imports of industry specific products have on U.S. national security. These are time sensitive investigations which require the Secretary to present findings and recommendations to the President for review and action, within an intensive 270-day period. From 2017 through late January 2018, BIS conducted two near simultaneous 232 investigations on the effects of steel and aluminum imports on U.S. national security. There will likely be additional 232s initiated either at the request of industry petitions filed with the Department or initiated by the Secretary.
BIS expects a steady flow of additional defense industrial base assessment requests from other agencies and new Section 232 investigations from various industry sectors, the heads of agencies, and as well as self-initiated investigations by the Secretary. For example, the President’s National Security Strategy calls for systematic evaluation of the U.S. Defense Industrial Base and the related supply chain essential to national security, with a focus on future investments and

Bureau of Industry and Security
FY 2019 Budget in Brief 51
workforce skills. BIS is undertaking on a similar industrial base assessment for the National Security Council’s Space Council Coordination Committee. BIS is also working to support an executive order on assessing and strengthening the manufacturing and defense industrial base and supply chain resiliency of the United States, which is assessing and tracking more than a dozen critical sectors which impact U.S. national security issues. Finally, there are increased requests from the Intelligence Community, Armed Services, NASA and other USG agencies for analytical support on national security issues that may affect the U.S. Defense Industrial Base.
Performance Indicators The table below shows the BIS performance indicators. Additional details appear at the end of the BIS section of the Department of Commerce budget.
2017 2017 2018 2019 Target Actual Target Target Number of exporters educated and trained through outreach activities related to Export Control Reform 48,000 28,000 25,000 20,000
Percent of licenses requiring interagency referral referred within nine days 98% 94% 98% 98%
Percent of attendees rating seminars highly 93% 94% 93% 93%
Number of actions that result in a deterrence or prevention of a violation and cases which result in a criminal and/or administrative charge
1,200 1,832 1,200 1,200
Number of End-Use Checks completed 850 1,089 850 850
Percent of licenses requiring ITU report referred by EE within ten Executive Order days 90% 96% 90% 90%
Median processing time for new regime regulations (months) 2 1 2 2
Percent of declarations received from U.S. industry in accordance with Chemical Weapons Convention timelines that are processed in time for the U.S. to meet treaty obligations
100% 100% 100% 100%
Number of export transactions completed under the new authority of Commerce export licenses and license exceptions
150,000 137,281 150,000 150,000
Percent of electronic export transactions reported in the Automated Export System in compliance with the Export Administration Regulations
99% 99% 99% 99%
Percent of defense industrial base assessments complete within the time frame set forth in the Memorandum of Understanding between the BIS and the survey sponsoring agency or entity
100% 96% 100% 100%

Bureau of Industry and Security
52 FY 2019 Budget in Brief

Minority Business Development Agency
FY 2019 Budget in Brief 53
Minority Business Development Agency The mission of the Minority Business Development Agency (MBDA) is to promote the growth of minority owned businesses through the mobilization and advancement of public and private sector programs, policy, and research. MBDA has accomplished this mission by funding a network of centers that provide Minority Business Enterprises (MBEs) a variety of business assistance services. Through its direct federal client services and its network of funded centers, MBDA: (1) fostered the expansion of opportunities for minority-owned businesses in the global marketplace; (2) identified sources of financial capital for minority-owned firms; (3) developed and upgraded electronic tools to provide access to growth markets through automated matching of MBEs to public and private sector opportunities; (4) provided management and technical assistance to minority-owned businesses; and (5) advocated for the increased use of electronic commerce and new technologies by MBEs.
In 2019, the Administration proposes to make a shift in its spending priorities and programmatic focus. This operational change, with a policy focus, will provide a new foundation to ensure that minority entrepreneurs have access to the resources they need to create jobs and dive our Nation’s prosperity.
Summary of Appropriations Appropriation Actual Annualized CR Estimate (Decrease)Minority Business Development $34,000 $33,769 $10,000 ($23,769)
Total Appropriation / Budget Authority 34,000 33,769 10,000 (23,769)
Positions - Direct 70 50 50 0
Civilian Full-Time Equivalent Employment - Direct 46 50 50 0
34.0
33.8
10.0
70
50 50
0
20
40
60
80
100
0102030405060
2017 2018 2019
Posi
tion
s
Dol
lars
in
Mill
ions
Budget Authority and Positions
Funding Positions

54 FY 2019 Budget in Brief
Minority Business Development Agency
Highlights of Budget Changes Appropriation: Minority Business Development
Summary of Requirements Detailed Summary
Positions Amount Positions Amount2018 Annualized CR 50 $33,769Adjustments to Base 2018 Pay raise 27 Federal Employees Retirement System (FERS) 7 Federal Insurance Contributions Act (FICA) - OASDI (1) Compensable Day 28 Employee Compensation (79) Rent payments to GSA 29 Working Capital Fund (WCF) (218) General Pricing Level Adjustments Communications, utilities and misc.Rental payments to others 1 Other services 144 Supplies 2 Equipment 1
Subtotal, other changes 0 (59)Total, Adjustments to Base 0 (59)2019 Base 50 33,710Program Changes 0 (23,710)2019 Appropriation 50 10,000
Comparison by Activity 2018 Annualized CR 2019 Base 2019 Estimate
BUDGET AUTHORITY Pos Amount Pos Amount Pos Amount Pos Amount
Minority Business Development 50 $33,769 50 $33,710 50 $10,000 0 ($23,710)
TOTAL BUDGET AUTHORITY/ 50 33,769 50 33,710 50 10,000 0 ($23,710)
APPROPRIATION
Increase / Decrease
Highlights of Program Changes
Base Increase / Decrease Positions Amount Positions Amount
Policy Re-Orientation 50 $33,769 0 -$23,710
MBDA requests a program change of -$23.7 million, leaving $10 million and 50 positions to make a shift in its spending priorities and programmatic focus. The funds will be used to cover the anticipated cost associate with a policy re-orientation of the agency. The President’s Budget does not include resources for orderly closure of grants awarded in FY 2018. The requested amount will cover the following costs:
• Personnel costs, including salaries and benefits; and, • Miscellaneous costs associated with operating the office, including overhead, travel, training, and printing.

Minority Business Development Agency
FY 2019 Budget in Brief 55
Performance Indicators The following table shows the MBDA performance indicators. Additional details appear at the end of the MBDA section of the Department of Commerce budget.
2017 2017 2018 2019 Target Actual Target Target Dollars leveraged through contract and financing awards by minority business export and manufacturing activity (millions)
624 1.6B NA NA
Number of jobs crated or retained through minority business export and manufacturing activity 1,325 2,090 NA NA

56 FY 2019 Budget in Brief
Minority Business Development Agency

National Oceanic and Atmospheric Administration
FY 2019 Budget in Brief 57
National Oceanic and Atmospheric Administration The mission of the National Oceanic and Atmospheric Administration (NOAA) is to provide daily weather forecasts, severe storm warnings, climate monitoring to fisheries management, coastal restoration, and the supporting of marine commerce. NOAA’s products and services support economic vitality and affect more than one-third of America’s gross domestic product. NOAA’s dedicated scientists use cutting-edge research and high-tech instrumentation to provide citizens, planners, emergency managers and other decision makers with reliable information they need when they need it. A full-year 2018 appropriation was not enacted at the time the FY 2019 Budget was prepared; therefore, the Budget is built off of the Extension of Continuing Appropriations Act, 2018 (P.L. 115-120). The amounts included for 2018 reflect the annualized level provided by the continuing resolution. All other comparisons and discussions of the budget request and policy will use the Annualized CR as the base.
NOAA accomplishes this mission through two primary accounts, Operations, Research and Facilities (ORF) and Procurement, Acquisition and Construction (PAC) and several lesser accounts, noted at the end of this section: ORF and PAC make up over 98 percent of the total FY 2019 NOAA Budget. In FY 2019, NOAA requests a total of $2,937.8 million for ORF and $1,623.0 million for PAC. ORF and PAC consist of the following seven activities and their corresponding mission priorities:
National Ocean Service (NOS): The NOS is preparing for a future of higher intensity coastal storms, increased demands on the marine transportation system, rapid changes in climate and marine ecology, and expanding offshore and coastal development. NOS observes, measures, assesses, and manages the Nation’s coastal, ocean and Great Lakes resources; protects marine and coastal areas; provides critical navigation products and services (e.g., real time observations, nautical charts); and prepares for and responds to natural disasters and emergencies. The benefits of NOS’ products and services include increased coastal economic activity, resilient coastal communities, and enhanced ecosystem services. The FY 2019 Budget requests $406.3 million for NOS (across all appropriations).
National Marine Fisheries Service (NMFS): NMFS uses sound science and an ecosystem-based approach to management to support productive and sustainable fisheries; safe sources of seafood; the recovery and conservation of protected species; and healthy ecosystems. NMFS manages 474 marine and anadromous fish stocks within the U.S. Exclusive Economic Zone (EEZ) as well as invertebrates, sea turtles, marine mammals, and other marine and coastal species and their habitats. The FY 2019 Budget requests $837.3 million for NMFS (across all appropriations).
Oceanic and Atmospheric Research (OAR): OAR seeks is to improve the understanding of changes in the Earth's environment. OAR’s science enables NOAA to fulfill its diverse mission, both today and into the future. OAR supports laboratories and programs across the United States and collaborates with external partners. OAR research contributes to accurate weather forecasts, enables communities to plan for and respond to climate events such as drought, and enhances the protection and management of the Nation’s coastal and ocean resources. The FY 2019 Budget requests $321.7 million for OAR.
National Weather Service (NWS): The NWS provides weather, water, and climate forecasts and warnings for the protection of life and property and enhancement of the national economy. NWS is the official and authoritative U.S. voice for issuing warnings during life-threatening weather situations. NWS forecasters issue public, aviation, marine, fire weather, climate, space weather, river and flood forecasts and warnings every day. Each year, NWS collects approximately 76 billion observations and issues approximately 1.5 million forecasts and 50,000 warnings. NWS data and products are publicly available through a national information database. The FY 2019 Budget requests $1,052.8 million for NWS.
National Environmental Satellite, Data, and Information Service (NESDIS): The NESDIS provides timely access to global environmental data from satellites and other sources to promote, protect and enhance the Nation's economy, security, environment and quality of life. NESDIS launches and operates NOAA’s satellites, and manages the product development and distribution of the corresponding data. NOAA satellites support the weather forecasting enterprise by providing the timely, high quality data upon which model outputs are based. While providing real-time operations and data services, NESDIS also develops the next generation of satellites in order to continue meeting its primary mission essential functions without incurring gaps in coverage. The FY 2019 Budget requests $1,640.0 million for NESDIS.
5,944 5,852
4,779
11,201 12,224
11,763
10,000
11,000
12,000
13,000
14,000
15,000
0
2,000
4,000
6,000
8,000
2017 2018 2019
Pos
itio
ns
Dolla
rs in
Mill
ions
Budget Authority and Positions
Funding Positions

58 FY 2019 Budget in Brief
National Oceanic and Atmospheric Administration
Mission Support (MS): Mission Support services provide the planning, administrative, financial, procurement, information technology, human resources, acquisitions and grants, and infrastructure services that are essential to safe, timely, and effective execution of the NOAA mission. NOAA Mission Services and Management and Executive Leadership provide centralized executive management, as well as policy formulation and direction, to all of NOAA’s Staff and Line Offices. The NOAA Facility Program is the focal point for facility planning, project planning formulation and development, and project management oversight to support critical NOAA mission requirements. The FY 2019 Budget requests $244.6 million for MS.
Office of Marine and Aviation Operations (OMAO): OMAO supports an array of specialized ships and aircraft that play a critical role in the in-situ collection of oceanographic, atmospheric, hydrographic, and fisheries data in support of NOAA's environmental and scientific missions. OMAO also administers the NOAA-wide Diving Program and Small Boat Program and is composed of civilians and the NOAA Commissioned Corps uniformed officers. The FY 2019 Budget requests $335.4 million for OMAO.
Other NOAA Accounts
The Pacific Coastal Salmon Recovery Fund finances state, tribal and local conservation initiatives to help recover threatened and endangered Pacific salmon populations. The FY 2019 Budget includes $0 funding for this program.
NOAA uses the Fishermen's Contingency Fund to compensate domestic fishermen for the damage or loss of fishing gear and resulting economic loss due to obstructions related to oil and gas exploration, development, and production in the Outer Continental Shelf. The funds come from fees collected annually by the Secretary of the Interior from the holders of leases, explorations, permits, easements, and rights of way. The FY 2019 Budget includes $0.35 million for this Fund.
The Foreign Fishing Observer Fund provides observer coverage of foreign fishing activities within the 200-mile U.S. EEZ using fees collected from owners and operators of foreign fishing vessels.
The Fisheries Finance Program Account promotes building sustainable fisheries by providing long-term, fixed- rate financing to U.S. citizens who otherwise qualify for financing or refinancing. Types of activities for financing include the construction, reconstruction, reconditioning, and, in some cases, the purchasing of fishing vessels, shoreside processing, aquaculture, mariculture facilities, and the purchase of individual fishing quota (IFQ).
The Promote and Develop American Fishery Products & Research Pertaining to American Fisheries Fund is derived from a transfer of thirty percent of duties on imported fisheries products from the Department of Agriculture. Funds from this account are transferred to offset some of the costs of fisheries research and management in the ORF account. The FY 2019 Budget transfers $154.9 million in P&D funds to ORF and eliminates funding for the S-K Grant Program.
The Damage Assessment and Restoration Revolving Fund (DARRF) receives proceeds from claims against responsible parties, as determined through court settlements or agreements, for damages to natural resources for which NOAA serves as trustee. NOAA uses the funds to respond to hazardous materials spills in the coastal and marine environments by conducting damage assessments, providing scientific support during litigation, and using recovered damages to restore injured resources.
The Federal Ship Financing Fund manages the loan guarantee portfolio that existed prior to the enactment of the Federal Credit Reform Act of 1990.
The Limited Access System Administration Fund (LASAF) uses fees to recover the incremental costs of management, data collection, and enforcement of Limited Access Privilege Programs. NOAA deposits these fees into the LASAF and are not to exceed 3 percent of the ex-vessel value of fish harvested under any such program. A Regional Council can consider, and may provide, a program to collect royalties for the initial or any subsequent distribution of allocations; revenues from these royalties are deposited in the LASAF. The LASAF shall be available, without appropriation or fiscal year limitation, only for the purposes of administrating the central registry system; and administering and implementing the Magnuson-Stevens Act in the fishery in which the fees were collected.
The Environmental Improvement and Restoration Fund provides grants to Federal, state, private, or foreign organizations or individuals to conduct research activities on or relating to the fisheries or marine ecosystems in the North Pacific Ocean, Bering Sea, and Arctic Ocean.
National Oceanic and Atmospheric Administration
FY 2019 Budget in Brief 59
Marine Mammal Unusual Mortality Event Fund provides funds to support investigations and responses to unusual marine mammal mortality events.
Medicare-Eligible Retiree Healthcare Fund finances the cost of TRICARE retirement health care benefits accrued by the active duty members of the NOAA Commissioned Corps. The Ronald W. Reagan National Defense Authorization Act for 2005 (P.L. 108-375) provided permanent, indefinite appropriations to finance these costs for all uniformed service members. In the FY 2018 President’s Budget, DoD proposed additional TRICARE consolidation and modernization initiatives. Those proposals would restore FY 2017 benefit change grand-fathering guidelines, increase co-pays for pharmaceuticals, and index future fees to National Health Expenditures vice COLA. If enacted, DoD’s legislative proposal would apply to the NOAA Corps but has negligible budget impact on NOAA.
NOAA Corps Commissioned Officers Retirement provides a measure of financial security after release from active duty for uniform service members and their survivors. It is an important factor in the choice of a career in the uniformed services and is mandated by Federal statutes under Title 10, United States Code. NOAA transfers retirement pay funds to the Coast Guard, which handles the payment function for retirees and annuitants. Health care funds for non-Medicare-eligible retirees, dependents, and annuitants are transferred to the U.S. Public Health Service, which administers the health care program.
The Western Pacific Sustainable Fisheries Fund can only be used to support the conservation and management objectives under a marine conservation plan developed for the region by the appropriate governor and the Western Pacific Regional Fishery Management Council. This fund receives amounts from any permit payment received for foreign fishing and fines and penalties from violations within the U.S. EEZ around Johnston Atoll, Kingman Reef, Palmyra Atoll, and Jarvis, Howland, Baker and Wake Islands.
The Fisheries Enforcement Asset Forfeiture Fund allows the Secretary of Commerce to pay certain enforcement-related expenses from fines, penalties, and forfeiture proceeds received for violations of the Magnuson-Stevens Act, or of any other marine resource law enforced by the Secretary. NOAA deposits fines, penalties, and forfeiture proceeds into this Fund, and subsequently uses them to pay for enforcement-related expenses.
The Sanctuaries Enforcement Asset Forfeiture Fund receives proceeds from civil penalties and forfeiture claims against responsible parties, as determined through court settlements or agreements, for violations of NOAA sanctuary regulations. NOAA holds these amounts in sanctuary site-specific accounts from year to year and spends them on resource protection within the sanctuary site where the penalty or forfeiture occurred. These actions may include all aspects of law enforcement (from equipment to labor), community oriented policing programs, and other resource protection and management measures such as the installation of mooring buoys or restoration of injured resources.
The North Pacific Observer Fund provides observer coverage for the North Pacific Groundfish Observer Program (NPGOP). This observer program places all vessels and processors in the groundfish and halibut fisheries off Alaska into one of two observer coverage categories: (1) a full coverage category, and (2) a partial coverage category. NOAA collects fees and uses them to pay for observer coverage on vessels and processors in the partial coverage category in the following year.
The Gulf Coast Ecosystem Restoration Science, Observation, Monitoring and Technology Fund provides funding for the NOAA RESTORE Act Science Program. This program initiates and sustains an integrative, holistic understanding of the Gulf of Mexico ecosystem and support, to the maximum extent practicable, restoration efforts and the long-term sustainability of the ecosystem, including its fish stocks, fishing industries, habitat, and wildlife through ecosystem research, observation, monitoring, and technology development.
In FY 2019, NOAA requests $4,562.7 million in total discretionary appropriations and $56.9 million in mandatory appropriations.

60 FY 2019 Budget in Brief
National Oceanic and Atmospheric Administration
Civilian and Military Positions
2017 2018 2019 IncreaseActual Annualized CR Estimate (Decrease)
CivilianOperations, Research & Facilities (ORF) - Direct 10,484 11,510 11,057 (453)Procurement, Acquisition & Construction (PAC) - Direct 315 329 326 (3)Promote & Develop American Fishery Products - Direct 3 3 0 (3)Pacific Coastal Salmon Recovery Fund - Direct 2 2 0 (2)Limited Access System Administration Fund - Direct 40 40 40 0Gulf Coast Ecosystem Restoration Fund Appropriation - Direct 1 1 1 0ORF Reimbursable 498 506 506 0Damage Assessment & Restoration Revolving Fund - Reimbursable 32 15 15 0
MilitaryORF - Direct 324 324 324TOTAL 11,699 12,730 12,269 (461)
Civilian and Military Full-Time Equivalent Employment
2017 2018 2019 IncreaseActual Annualized CR Estimate (Decrease)
Civilian Full-Time Equivalent EmploymentOperations, Research & Facilities (ORF) - Direct 10,438 10,965 10,653 (312)Procurement, Acquisition & Construction - Direct 313 296 293 (3)Promote & Develop American Fishery Products - Direct 3 3 0 (3)Pacific Coastal Salmon Recovery Fund - Direct 2 2 0 (2)Limited Access System Administration Fund - Direct 40 40 40 0Gulf Coast Ecosystem Restoration Fund Appropriation - Direct 1 1 1 0
ORF - Reimbursable 495 506 506 0Damage Assessment & Restoration Revolving Fund - Reimbursable 32 15 15 0
Military Full-Time Equivalent EmploymentORF - Direct 316 324 324 0TOTAL 11,640 12,152 11,832 (320)
Note: The Limited Access System Administration Fund and Damage Assessment & Restoration Revolving Fund are largely dependent on collections; thus actual FTE vary greatly from budget estimates.

National Oceanic and Atmospheric Administration
FY 2019 Budget in Brief 61
Summary of Appropriations 2017 2018 2019 Increase Appropriation Actual Annualized CR Estimate (Decrease) Operations, Research & Facilities (ORF) $3,367,875 $3,344,243 $2,937,753 ($406,490) Procurement, Acquisition & Construction (PAC) 2,242,610 2,227,423 1,623,006 (604,417) Fishermen's Contingency Fund 350 348 349 1 Fisheries Finance Program Account 0 0 0 0 Pacific Coastal Salmon Recovery 65,000 64,559 0 (64,559) Marine Mammal Unusual Mortality Event Fund 0 0 0 0 Medicare-Eligible Retiree Healthcare Fund 1,936 1,936 1,603 (333) Total, Appropriation 5,677,771 5,638,509 4,562,711 (1,075,798)
Transfers / Other: ORF: FROM PAC 13,072 0 0 0 ORF: FROM: Promote & Develop Fishery Products* 130,164 130,164 154,868 24,704 ORF: FROM PCSRF 65 0 0 0 ORF: RESCISSION (18,000) (18,000)
PAC: TO OIG (1,302) (1,302) (1,302) 0 PAC: TO ORF (13,072) 0 0 0 PAC: RESCISSION (5,000) (5,000) PCSRF: TO ORF (65)
P&D: TO: ORF (130,164) (130,164) (154,868) (24,704) P&D: FROM: Department of Agriculture (mandatory funds) 145,073 154,664 154,868 204 P&D: Previously unavailable and temporarily reduced 0 Subtotal, P&D 14,909 24,500 0 (24,500) Total, Transfers 120,771 130,362 153,566 204
Mandatory Accounts Damage Assessment & Restoration Revolving Fund 6,860 5,986 5,968 (18) Fisheries Finance Program Account 30,764 7,997 0 (7,997) Environmental Improvement and Restoration Fund 15,049 4,858 3,813 (1,045) Federal Ship Financing Fund 0 0 0 0 Foreign Fishing Observer Fund 0 0 0 0 NOAA Corps Retirement Pay 29,375 30,102 30,075 (27) Western Pacific Sustainable Fisheries 240 494 500 6 Limited Access System Administration Fund 13,632 13,732 13,988 256 Sanctuaries Asset Forfeiture Fund 13 120 120 0 Fisheries Asset Forfeiture Fund 2,497 4,157 4,155 (2) North Pacific Observer Fund 3,635 3,870 3,990 120 Spectrum Efficient National Surveillance Radar 20,627 0 0 0 Spectrum Pipeline 0 12,013 0 (12,013) Gulf Coast Ecosystem Restoration, Science, Observation, Monitoring and Technology Fund
0 0 0 0
Total Budget Authority 5,921,234 5,852,200 4,778,886 (1,096,314) Mandatory Funds 267,765 237,993 217,477 (20,516)

62 FY 2019 Budget in Brief
National Oceanic and Atmospheric Administration
2017 2018 2019 Increase Appropriation Actual Annualized CR Estimate (Decrease) Discretionary Budget Authority Operations, Research & Facilities (ORF) $3,493,176 $3,456,407 $3,092,621 ($363,786) P&D Net Transfers (130,164) (130,164) (154,868) (24,704) Procurement, Acquisition & Construction (PAC) 2,223,236 2,221,121 1,621,704 (599,417) Fishermen's Contingency Fund 350 348 349 1 Fisheries Finance Program Account 0 0 0 0 Pacific Coastal Salmon Recovery 64,935 64,559 0 (64,559) Marine Mammal Unusual Mortality Event Fund 0 0 0 0 Medicare-Eligible Retiree Healthcare Fund 1,936 1,936 1,603 (333)
Total Discretionary Budget Authority 5,653,469 5,614,207 4,561,409 (1,052,798)
Offsetting Receipts: Fisheries Finance Negative Subsidy Receipt Account (189) (2,557) (8,109) (5,552)
Total, Negative Subsidy (189) (2,557) (8,109) (5,552)

National Oceanic and Atmospheric Administration
FY 2019 Budget in Brief 63
Highlights of Budget Changes Appropriation: Operations, Research and Facilities Summary of Requirements
Detailed Summary Positions Amount Positions Amount
2018 Annualized CR
11,834 $3,344,243 Transfers From Promote & Develop Fishery Products & Research 130,164 Adjustments to Base Adjustments
Restoration of FY 2018 Deobligations
17,500
Technical ATB
23,697 Subtotal, Adjustments Other Changes 2018 Pay raise $6,980 2019 Pay raise (Military) 498 Civil Service Retirement System (CSRS) (1,424) Federal Employees' Retirement System (FERS) 2,595 Thrift Savings Plan 407 Federal Insurance Contributions Act (FICA/OASDI) 1,291 Health insurance 3,477 Compensable Day 5,789 Employee Compensation Fund (13) Travel - Per diem 323 Rent payments to GSA 5,368 Postage 1 Printing and reproduction 55 NARA 162 Working Capital Fund 1,282 General Pricing Level Adjustment Transportation of things 258 Rental payments to others 517 Communications, utilities, and miscellaneous 1,265 Other services 12,821 Supplies 1,613 Equipment 543 Grants 1,055 Subtotal, other changes 44,863
Total Adjustments to Base 86,060
2019 Base 11,834 3,560,467 Program Changes (453) (440,346)
2019 Total Requirements 11,381 3,120,121 Recoveries (27,500) Transfer from Promote & Develop Fishery Products & Research (154,868)
2019 Appropriation 11,381 2,937,753

64 FY 2019 Budget in Brief
National Oceanic and Atmospheric Administration
Comparison by Activity
2018 Annualized CR 2019 Base 2019 Estimate Increase / Decrease
Direct Obligations Pos Amount Pos Amount Pos Amount Pos Amount
National Ocean Service 1,121 $513,922 1,121 $518,964 1,121 $380,053 0 ($138,911)
National Marine Fisheries Service 3,062 845,819 3,062 856,351 3,060 810,484 (2) (45,867)
Oceanic & Atmospheric Research 806 474,514 803 477,917 724 295,651 (79) (182,266)
National Weather Service 4,494 973,193 4,494 987,333 4,139 935,196 (355) (52,137) National Environmental Satellite Service 586 221,095 589 237,070 590 239,310 1 2,240
Mission Support 769 253,652 769 270,113 751 243,574 (18) (26,539) Office of Marine and Aviation Operations 996 209,712 996 212,719 996 215,853 0 3,134
Total Direct Obligations 11,834 3,491,907 11,834 3,560,467 11,381 3,120,121 (453) (440,346)
Reimbursable Authority 506 242,000 506 242,000 506 242,000 0 0
TOTAL OBLIGATIONS 12,340 3,733,907 12,340 3,802,467 11,887 3,362,121 (453) (440,346)
FINANCING
Unobligated balance, start of year 0 0 0 0 0 0 0 0
Transfer of unobligated P&D balance 0 0 0 0 0 0 0 0
Offsetting collections (506) (242,000) (506) (242,000) (506) (242,000) 0 0
Deobligations 0 (17,500) 0 (27,500) 0 (27,500) 0 0
Rescission 0 (18,000) 0 0 0 0 0 0
Subtotal, Financing (506) (277,500) (506) (269,500) (506) (269,500) 0 0
TOTAL BUDGET AUTHORITY 11,834 3,456,407 11,834 3,532,967 11,381 3,092,621 (453) (440,346)
Transfers 0 (112,164) 0 (154,868) 0 (154,868) 0 0
APPROPRIATION, ORF 11,834 3,344,243 11,834 3,378,099 11,381 2,937,753 (453) (440,346)
Highlights of Program Changes
Base Increase / Decrease Positions Amount Positions Amount National Ocean Service 1,139 $547,343 0 -$141,046
NOAA requests the following increases for this activity. • An increase of 0 positions and $896 to boost the reliability and accuracy of foundational geospatial data and physical
oceanographic observations for myriad applications: safe navigation, coastal flood forecasting, emergency response, habitat restoration, fishing, recreation, coastal energy development, and many others.
• An increase of 0 postions and $131 to survey five additional square nautical miles to acquire critical hydrographic survey data.
• An increase of 0 positions and $773 bolster NOS’s emergency responses to coastal storms and other disasters through the Disaster Preparedness Program. Budgetary resources will support a multi-faceted and dedicated approach to ensure that commerce, communities and natural resources can recover as quickly as possible.
NOAA requests the following decreases for this activity: • A decrease of 0 positions and $1,987 to discontinue single-year cooperative agreements with academic institutions for
joint ocean and coastal mapping centers. NOAA will continue to support research and development of survey,

National Oceanic and Atmospheric Administration
FY 2019 Budget in Brief 65
geospatial data management, and cartographic technologies through the Joint Hydrographic Center, the Coast Survey Development Laboratory, and other Navigation, Observation and Positioning programs.
• A decrease of 0 positions and $5,960 to terminate the Regional Geospatial Modeling Grant program. NOAA will continue to support a range of other regional geospatial requirements through NOS’s Coastal Zone Management and Services and Navigation, Observations and Positioning program activities. These activities include height modernization, Continuously Operating Reference Stations (CORS), data access and capacity building.
• A decrease of 0 positions and $11,050 to reduce grants to 11 regional observing systems through a competitive merit-based grant process under the Integrated Coastal and Ocean Observation System Act of 2009. NOAA will continue to support the 11 IOOS Regional Associations at the reduced funding level.
• A decrease of 0 positions and $467 to its Marine Debris Program. NOAA would continue its important marine debris reduction, prevention, research, monitoring, and removal activity, while balancing its level of budgetary resources with other requirements in the Department.
• A decrease of 0 positions and $9,933 to eliminate the NCCOS Competitive Research program, which provides grants to academic institutions to conduct ecological research that advances NOAA’s missions. FY 2018 is scheduled to be the final year of funding for 35 of 50 open awards.
• A decrease of 0 positions and $2,290 to eliminate funding for the NOS portion of the Integrated Water Prediction Project. With this reduction, NOS would continue to engage in the NOAA Water Team, but would significantly curtail development of new products and services for end users.
• A decrease of 0 positions and $84,429 to eliminate grants to state governments under the Coastal Zone Management Program and grants to eligible applicants under the Regional Coastal Resilience Grant Program. NOAA will continue to support states’ participation in the National CZM program by reviewing and supporting implementation of states’ management plans, supporting Federal consistency reviews, and providing technical assistance services.
• A decrease of 0 positions and $23,342 to discontinue NOAA grants to state agencies and academic institutions that support operations of the National Estuarine Research Reserve System (NERRS). Under this proposal, NOAA will continue to provide national-level system coordination and in-kind support to state governments that choose to continue operating the reserves using state funds.
• A decrease of 0 positions and $1,750 to reduce scalable activities such as vessel operations for the Sanctuaries and Marine Protected Areas Program. NOAA will support the highest priorities of all its authorizations, maintain its unique capabilities, support continued implementation of management plans across the National Marine Sanctuary System, and continue engaging coastal communities and stakeholders to promote science-based stewardship of designated areas.
Base Increase / Decrease Positions Amount Positions Amount National Marine Fisheries Service (NMFS) 3,062 $856,351 -2 -$45,867
NOAA requests the following increases for this activity. There are no requested increases for this activity. NOAA requests the following decreases for this activity: • A decrease of 0 positions and $3,029 to eliminate funding for the the John H. Prescott Marine Mammal Rescue
Assistance Grants Program. This is the only Federal funding source for the marine mammal stranding network organizations; however, some network members may still operate in the absence of Prescott Grants, depending on the availability of private funding. NOAA will continue to support related activities such as the rescue of large whales entangled in fishing gear and the coordination of stranding network responses to unusual marine mammal mortality events.
• A decrease of 0 positions and $1,696 which represents the additional resources originally provided in the FY 2017 Appropriations Act to expedite the review of Hatchery Genetic Management Plans (HGMPs).
• A decrease of 0 positions and $5,000 to reduce funding for agency-independent reef fish assessments in the Gulf of Mexico. NOAA will continue to produce stock assessments for the Gulf of Mexico reef fish complex as part of its national stock assessment process.
• A decrease of 0 positions and $2,937 to reduce funding for the Cooperative Research program. The program will continue to execute cooperative research with industry, fishermen, and other stakeholders as available funding allows.
• A decrease of 0 positions and $5,111 to decrease support for implementation of new catch share programs; data collection improvements for recently implemented programs; and, national-level coordination to improve efficiency in

66 FY 2019 Budget in Brief
National Oceanic and Atmospheric Administration
the development and implementation of catch share programs. NOAA will reduce its investment in targeted lower priority tools, but will continue to provide support for the 16 programs currently under catch share management.
• A decrease of 0 positions and $1,835 which represents the additional funding originally provided in the FY 2017 Appropriations Act for genetic stock identification within the Mitchell Act hatchery program and implementation of the Pacific Salmon Treaty.
• A decrease of 2 positions and $2,984 for the Interjurisdictional Fisheries Grants program. The Interjurisdictional Fisheries Act of 1986 is a financial assistance program to promote state activities in support of the management of interjurisdictional resources. This reduction would eliminate funding for this grant program.
• A decrease of 0 positions and $17,837 for the Cooperative Enforcement Program (CEP), which would eliminate funding for Joint Enforcement Agreements (JEA) with 28 state and U.S. territory partners.
• A decrease of 0 positions and $4,837 for partnerships and grants provided through the Community-based Restoration Program (CRP) within the NOAA Restoration Center.
• A decrease of 2 positions and $64,599 to eliminate funding for the Pacific Coastal Salmon Recovery Fund grant program. NOAA will continue its Federal commitment to advancing Pacific salmon and steelhead recovery and Tribal treaty fishing rights through other NOAA programs to the extent possible.
Base Increase / Decrease Positions Amount Positions Amount Oceanic and Atmospheric Research (OAR) 803 $477,917 -79 -$182,266
NOAA requests the following decreases for this activity. • A decrease of 0 positions and $5,685 to eliminate Arctic research within the Office of Oceanic and Atmospheric
research. NOAA will terminate improvements to sea ice modeling and predictions that support the safety of fishermen, commercial shippers, cruise ships, and local community stakeholders.
• A decrease of 23 positions and $48,254 reduce competitively funded research that advances understanding of the Earth’s climate system and enhances regional decision-making capabilities. NOAA will reduce competitive research grants to cooperative institutes, universities, NOAA research laboratories, and other partners.
• A decrease of 34 positions and $4,377 to close the Air Resources Laboratory (ARL). Research on air chemistry, mercury deposition, and atmospheric dispersion of harmful materials will be curtailed. ARL’s headquarters in College Park, MD will be closed, as will satellite campuses in Idaho Falls, ID, Las Vegas, NV, and Mercury, NV. NOAA will also end upgrades to the Hybrid Single Particle Lagrangian Integrated Trajectory, which is a particle model that has emergency response applications ranging from tracking mercury deposition to anthrax bioterrorism.
• A decrease of 3 positions and $5,339 to close the Unmanned Aircraft Systems Program Office. NOAA will discontinue intramural grants to examine innovative UAS technologies to improve the efficiency and safety of observing operations across NOAA for weather prediction, earth system monitoring, and environmental research.
• A decrease of 0 positions and $4,966 to end the Vortex-Southeast (VORTEX-SE) project. Funding is being used to understand how environmental factors that are characteristic of the southeastern United States affect the formation, intensity, and storm path of tornadoes for this region.
• A decrease of 0 positions and $9,933 to terminate the Joint Technology Transfer Initiative (JTTI). Funding is being used to transition the latest technological advances due to weather research into products and services actively used by communities and businesses.
• A decrease of 0 positions and $479 to conclude infrasonic monitoring research. NOAA was able to complete and evaluation of this technology using funding in FY 2016 and FY 2017.
• A decrease of 0 positions and $1,923 to reduce support for an autonomous underwater vehicle (AUV) demonstration testbed. NOAA will maintain its fleet of autonomous vehicles and other alternative technologies, and will continue to support a competitive process open to NOAA laboratories and Competitive Institutes, but will eliminate funding available for ongoing development, test, and evaluation activities.
• A decrease of 0 positions and $1,803 to eliminate the environmental genomics program at the Atlantic Oceanographic and Meteorological Laboratory (AOML). Terminating this program will slow development of new DNA sampling tools and advances in other AOML research areas, including coral monitoring and restoration, fisheries assessments for species, such as Bluefin tuna larvae, and recruitment models of endangered species.
• A decrease of 14 positions and $72,131 to terminate the National Sea Grant College Program and end Federal support for the network of 33 Sea Grant programs located in coastal States and territories. With the termination of the NOAA Sea Grant Program, NOAA will explore options for addressing staffing issues, such as transfers, Voluntary Early Retirement Authority (VERA), and Voluntary Separation Incentive Payments (VSIP) will be requested. NOAA will also terminate the Sea Grant’s Marine Aquaculture Program.

National Oceanic and Atmospheric Administration
FY 2019 Budget in Brief 67
• A decrease of 0 positions and $16,319 will reduce mapping and exploration of unknown and poorly understood areas of the ocean. The OER program will reduce funding to the Cooperative Institute for Ocean Exploration, Research and Technology and the Global Foundation for Ocean Exploration, cutting exploration, education, and outreach activities, including exploration that could lead to discovery of new mineral deposits or medicinal resources. In addition, OER will limit funding for extramural grants and eliminate financial support for the interagency Biodiversity Observation Network.
Base Increase / Decrease Positions Amount Positions Amount National Weather Service 4,494 $987,333 -355 -$52,137
NOAA requests the following increases for this activity. • An increase of 0 positions and $11,622 to provide NWS additional resources to meet its labor and related costs,
specifically to meet the 2018 civilian pay raise. NWS requires this funding to maintain payroll requirements for its current workforce level. This increase is spread amongst all of NWS’ ORF PPA’s.
• An increase of 0 positions and $1,149 to cover high priority maintenance needs, as well as increased rent and utilities associated with new lease agreements at NWS field offices.
• An increase of 0 positions and $5,130 to fully fund the cyclical refreshment of Advanced Weather Interactive Processing System (AWIPS) Information Technology (IT) hardware. Without increased funding, NWS will induce risk by extending cyclical hardware replacement from three-to-five years out to six-to-eight years.
• An increase of 0 positions and $2,287 to fund upgrades and enhancements to operational applications on the Integrated Dissemination Program (IDP) systems in College Park, MD and Boulder, CO. Requested funding will help integrate targeted mission-critical applications into the dissemination infrastructure providing a higher level of redundancy and reliability than what exists currently to our partners and customers.
NOAA requests the following decreases for this activity. • A decrease of 0 positions and $15,489 in Observations to reduce the National Mesonet Program, Weather and
Oceans Platforms, and the Tropical Atmosphere Ocean (TAO). This reduction limits mesonets (mesoscale meteorological) observations to only the highest-priority geographic areas. This decrease also lessens marine observations that inform forecasts and warnings and reduces observations of global environmental patterns (such as El Niño) that inform seasonal forecasts.
• A decrease of 74 positions and $10,100 in Central Processing to reflect the the significant efficiencies that can be achieved by transitioning to a new IT service delivery model for the NWS forecast offices. In FY 2019, NWS proposes to initiate a phased consolidation of its 122 Information Technology Officer (ITO) full-time equivalents (FTE). Consolidating IT support functions is a critical part of evolving the NWS, including a right-sized workforce and appropriate organizational structure.
• A decrease of 0 positions and $2,000 in Central Processing to forgo the additional development needed to address science gaps and provide implementation support for the Hydrologic Ensemble Forecast Service (HEFS) and will limit future implementation of HEFS at Advanced Hydrologic Prediction Services forecast locations. As a result, more AHPS forecast locations will have a higher degree of uncertainty than previously planned.
• A decrease of 25 positions and $11,000 in Analyze, Forecast and Support to reduce or eliminate many components of NOAA’s Tsunami Research and Operational Warning program. The reductions will leave the U.S. with one operational Tsunami Warning Center. This will limit NOAA’s support for tsunami monitoring and reporting, modeling research, and support to partners. All supporting programmatic activities, education, and outreach for preparedness and innovation research will cease.
• A decrease of 0 positions and $1,806 in Analyze, Forecast and Support to eliminate NOAA’s aviation science research-to-operations (R2O) effort.
• A decrease of 8 positions and $1,200 in Analyze, Forecast and Support to consolidate functions at the National Centers for Environmental Prediction (NCEP) Climate Prediction Center (CPC) and Weather Prediction Center (WPC) in order to achieve some efficiency while preserving core capabilities to develop sub-seasonal to seasonal predictions and services and real-time blended weather observations including those related to the onset and duration of El Niño and La Niña events.
• A decrease of 248 positions and $15,000 to implement recommendations outlined in NWS’ Operations and Workforce Analysis (OWA), which will enable NWS to continue to evolve and build a Weather-Ready Nation. The OWA recognizes inherent inefficiencies associated with the rigid field office structure of NWS and provides various Impact-

68 FY 2019 Budget in Brief
National Oceanic and Atmospheric Administration
Based Decision Support Service (IDSS) recommendations to make the agency more effective and efficient to protect lives and property. Of these recommendations, OWA suggested increasing flexibility within NWS’ operating model.
• A decrease of 0 positions and $4,629 to terminate actions associated with the implementation of the Consumer Option for an Alternative System to Allocate Losses (COASTAL) Act of 2012. The COASTAL Act requires NOAA to produce detailed “post-storm assessments” in the aftermath of a damaging tropical cyclone that strikes the United States or its territories.
• A decrease of 0 positions and $5,000 to slow down the development of the Next Generation Global Prediction System (NGGPS), including reducing support to the unified data assimilation development; eliminate support to the development of the Unified Global Coupled System; reduce support to the collaborative research activities for the Hurricane Forecast Improvement Project (HFIP); and reduce support to NOAA’s testbeds.
• A decrease of 0 positions and $3,101 to reduce investment in the National Water Model delaying future model upgrades for centralized water prediction products and services at the National Water Center.
• A decrease of 0 positions and $2,000 as the Operations and Workforce Analysis (OWA) is completed and NOAA’s efforts shift to testing, evaluation and implementation phases. NOAA will prioritize field demonstrations aimed at supporting consistent implementation of Impact-Based Decision Support Services (IDSS)
• A decrease of 0 positions and $1,000 to terminate efforts to develop and implement key aviation tools and capabilities. NOAA will maintain the current level of operational aviation weather forecast products and services.
Base Increase / Decrease Positions Amount Positions Amount National Environmental Satellite, Data and Information Service (NESDIS) 589 $237,070 1 $2,240
NOAA requests the following increases for this activity.
• An increase of 0 positions and $4,915 for Satellite and Product Operations to improve data flow resiliency across NOAA’s critical Information Technology systems and infrastructure. This request specifically would support movement of NESDIS high impact systems to enterprise security services and automated patching and continuing monitoring through NOAA-wide enterprise services.
• An increase of 0 positions and $1,447 for Satellite and Product Operations to provide on-orbit support for the DSCOVR satellite through technical and engineering assistance. Anomalies on the DSCOVR satellite, which have been more frequent than anticipated, have resulted in an increase in the day to day anomaly support required to continue operations of the DSCOVR satellite.
• An increase of 0 positions and $1,274 for Satellite and Product for technical and engineering assistance, monitor U.S. instruments, and to conduct a planned system refresh on the current ground system, which was built and implemented as part of the Jason-2 mission. With Jason-3 in orbit and operational, the planned system refresh of this ground system is critical to ensure the continuity of ground operations from one satellite mission to the other.
• An increase of 0 positions and $543 to support replacement of outdated UPS (Uninterruptible Power Supply) modules, which are an essential part of providing continuous power to the data center to maintain 24/7 satellite operations. It will further be used to facilitate modifications to the data center power and cooling infrastructure in support of satellite technology refreshes, and other improvements essential to preserve the critical infrastructure that is required to ensure the availability and reliability of environmental satellite data.
• An increase of 1 position and $608 to enable the Commercial Remote Sensing Regulatory Affairs (CRSRA) statutory authority to regulate private remote sensing systems. Funding will allow CRSRA to implement a more efficient and effective regulatory structure for the commercial remote sensing industry, including a necessary increase in capacity to address the growing demand for commercial remote sensing licenses.
• An increase of 0 positions and $1,005 for the Office of Space Commerce to accelerate commercial opportunities for NOAA, including commercial data buys.
NOAA requests the following decreases for this activity. • A decrease of 0 positions and $3,469 to reduce the number of Product Development, Readiness & Application
Program (PDR&A) data products, applications, techniques and systems developed. PDR&A will continue, at a reduced pace, to identify new requirements for satellite data and environmental information, determine what information is necessary to meet those requirements, and conduct research to provide those answers and support new sensor technology, products and applications.
• A decrease of 0 positions and $2,399 to decrease funding under the Regional Climate Centers (RCC) Program to support other exisiting NOAA priorities. NOAA will continue to produce and deliver climate data for decision makers and other users at a reduced level.

National Oceanic and Atmospheric Administration
FY 2019 Budget in Brief 69
• A decrease of 0 positions and $1,686 to terminate the Big Earth Data Initiative within the National Centers for Environmental Information in order to fully support other existing NOAA data stewardship priorities in NOAA’s Environmental Data Management Framework. NOAA will leverage other existing programs and partnerships to continue to improve data discovery, access, compatibility and documentation.
Base Increase / Decrease Positions Amount Positions Amount Mission Support 769 $270,113 -18 -$26,539
NOAA requests the following decreases for this sub-activity. • A decrease of 18 positions and $19,360 to eliminate funding for the Office of Education. This will terminate
coordination activities provided by the Office of Education as well as the Competitive Education Grants Program and the Educational Partnership Program for Minority Serving Institutions.
• A decrease of 0 positions ad $7,450 to eliminate NOAA Bay-Watershed Education and Training which are used to promote place-based, experiential learning in K-12 Science, Technology, Education, & Mathematics (STEM) education.
Office of Marine and Aviation Operations 996 $212,719 0 $3,134
NOAA requests an increase for this program. • An increase of 0 FTE and $2,156 for increased lease and fuel costs for NOAA’s Aircraft Operations Center (AOC) at
Lakeland Linder Regional Airport. NOAA moved to this new AOC facility in 2017. Without increased funding, NOAA will reduce its aircraft variable operations budget to support lease payments and higher fuel costs.

70 FY 2019 Budget in Brief
National Oceanic and Atmospheric Administration
Detailed Comparison by Activity
2018 Annualized CR 2019 Base 2019 Estimate Increase / Decrease
Pos Amount Pos Amount Pos Amount Pos Amount NATIONAL OCEAN SERVICE Navigation, Observations and Positioning: Navigation, Observations and Positioning 540 $147,998 540 $150,408 540 $143,357 0 ($7,051) Hydrographic Survey Priorities/Contracts 13 26,818 13 26,818 13 26,949 0 131 IOOS Regional Observations 0 30,494 0 30,494 0 19,444 0 (11,050) Total, Navigation, Observations & Positioning 553 205,310 553 207,720 553 189,750 0 (17,970)
Coastal Science and Assessment: Coastal Science, Assessment, 254 72,112 254 73,269 254 74,042 0 773 Response and Restoration Competitive Research 0 9,933 0 9,933 0 0 0 (9,933)
Total, Coastal Science and Assessment 254 82,045 254 83,202 254 74,042 0 (9,160) Ocean and Coastal Management and Services: Coastal Zone Management and Services 118 42,214 118 42,779 118 40,489 0 (2,290) Coastal Zone Grants 0 84,429 0 84,429 0 0 0 (84,429) Coral Reef Program 19 25,925 19 26,003 19 26,033 0 30 Nat'l Estuarine Research Reserve System 0 23,342 0 23,342 0 0 0 (23,342) Ocean Management 177 50,657 177 51,489 177 49,739 0 (1,750)
Total, Ocean & Coastal Management & Services
314 226,567 314 228,042 314 116,261 0 (111,781)
TOTAL, NOS 1,121 513,922 1,121 518,964 1,121 380,053 0 (138,911)
NATIONAL MARINE FISHERIES SERVICE Protected Resources Science & Managemt 851 184,517 851 187,112 851 181,615 0 (5,497) Fisheries Science and Management 1,803 540,595 1,803 547,151 1,801 529,455 (2) (17,696) Enforcement 244 68,536 244 69,332 244 51,495 0 (17,837) Habitat Conservation & Restoration 164 52,171 164 52,756 164 47,919 0 (4,837)
TOTAL, NMFS 3,062 845,819 3,062 856,351 3,060 810,484 (2) (45,867)
OCEANIC & ATMOSPHERIC RESEARCH Climate Research 308 156,939 308 152,582 285 98,643 (23) (53,939)
Weather & Air Chemistry Research 262 112,994 262 119,837 224 91,730 (38) (28,107)
Ocean, Coastal and Great Lakes Research 221 191,526 221 192,430 203 93,144 (18) (99,286)
Innovative Research & Technology 15 13,055 12 13,068 12 12,134 0 (934)
TOTAL, OAR 806 474,514 803 477,917 724 295,651 (79) (182,266)
NATIONAL WEATHER SERVICE Observations 777 214,909 777 217,714 777 203,992 0 (13,722) Central Processing 235 92,166 235 92,886 161 86,620 (74) (6,266) Analyze, Forecast and Support 2,958 484,049 2,958 492,014 2,677 471,792 (281) (20,222) Dissemination 84 46,429 84 47,580 84 50,090 0 2,510 Science and Technology Integration 440 135,640 440 137,139 440 122,702 0 (14,437)
TOTAL, NWS 4,494 973,193 4,494 987,333 4,139 935,196 (355) (52,137)

National Oceanic and Atmospheric Administration
FY 2019 Budget in Brief 71
2018 Annualized CR 2019 Base 2019 Estimate Increase / Decrease
Pos Amount Pos Amount Pos Amount Pos Amount
NATIONAL ENVIRONMENTAL SATELLITE, DATA AND INFORMATION SERVICE Environmental Satellite Observing Systems 386 162,303 389 175,394 390 181,719 1 6,325 National Centers for Environmental Intelligence 200 58,792 200 61,676 200 57,591 0 (4,085)
TOTAL, NESDIS 586 221,095 589 237,070 590 239,310 1 2,240
MISSION SUPPORT Office of Education 18 26,750 18 26,810 0 0 (18) (26,810)
Executive Leadership 127 26,818 127 27,610 127 27,879 0 269
Mission Services and Management 610 147,392 610 150,417 610 150,417 0 0
IT Security 14 9,982 14 10,027 14 10,029 0 2
Payment to DoC Working Capital Fund 0 42,710 0 55,249 0 55,249 0 0
Total, Mission Support 769 253,652 769 270,113 751 243,574 (18) (26,539)
OFFICE OF MARINE AND AVIATIONS OPERATIONS (OMAO) Marine Operations and Maintenance 869 177,636 869 180,192 869 181,170 0 978
Aviation Operations 127 32,076 127 32,527 127 34,683 0 2,156
Total, OMAO 996 209,712 996 212,719 996 215,853 0 3,134
Total Direct Obligations 11,834 3,491,907 11,834 3,560,467 11,381 3,120,121 (453) (440,346)
Reimbursable Authority 506 242,000 506 242,000 506 242,000 0 0
TOTAL OBLIGATIONS, ORF 12,340 3,733,907 12,340 3,802,467 11,887 3,362,121 (453) (440,346)
FINANCING Unobligated balance, start of year 0 0
Transfer of unobligated P&D balance 0 0
Offsetting collections (506) (242,000) (506) (242,000) (506) (242,000) 0 0
De-obligations (direct) (17,500) (27,500) (27,500) 0 0
Rescission (18,000) 0 0 0 0
Subtotal, financing (506) (277,500) (506) (269,500) (506) (269,500) 0 0
TOTAL BUDGET AUTHORITY, ORF 11,834 3,456,407 11,834 3,532,967 11,381 3,092,621 (453) (440,346)
TRANSFERS: From PDF (130,164) (154,868) (154,868) 0 0
Rescission 18,000 0 0 0 0
Subtotal, Transfers 0 (112,164) 0 (154,868) 0 (154,868) 0 0
APPROPRIATION, ORF 11,834 3,344,243 11,834 3,378,099 11,381 2,937,753 (453) (440,346)

72 FY 2019 Budget in Brief
National Oceanic and Atmospheric Administration
Appropriation: Procurement, Acquisition and Construction Summary of Requirements
Comparison by Activity
2018 Annualized CR 2019 Base 2019 Estimate Increase / Decrease
Pos Amount Pos Amount Pos Amount Pos Amount
National Ocean Service Construction / Acquisition NERRS 0 $1,689 0 $1,689 0 $0 0 ($1,689) Marine Sanctuaries 2 1,987 2 1,987 2 1,541 0 (446) Total, NOS PAC 2 3,676 2 3,676 2 1,541 0 (2,135)
National Marine Fisheries Service Systems Acquisition / Construction 0 0 0 0 0 0 0 0
Total, NMFS PAC 0 0 0 0 0 0 0 0
Oceanic and Atmospheric Research Systems Acquisition 0 36,134 0 36,134 0 26,000 0 (10,134)
Total, OAR PAC 0 36,134 0 36,134 0 26,000 0 (10,134)
National Weather Service Systems Acquisition Observations 0 32,534 0 32,534 0 16,250 0 (16,284)
Central Processing 26 66,311 26 66,311 26 58,139 0 (8,172)
Dissemination 0 34,386 0 34,386 0 34,553 0 167
Construction Facilities Construction and Major Repairs 0 7,598 0 7,598 0 8,634 0 1,036
Total, NWS PAC 26 140,829 26 140,829 26 117,576 0 (23,253)
SummaryPositions Amount
2018 Annualized CR 329 $2,227,423Transfer
To OIG (1,302)Adjustments to BaseAdjustments
Technical Adjustments to Base (3) (12,440)
Restoration of FY 2017 deobligations 13,000
Financing Recoveries of prior year obligations (13,000)
Total Adjustments to Base (3) (12,440)2019 Base 326 2,213,681Program Changes 0 (591,977)Total Requirements 326 1,621,704Transfer to OIG 0 1,302
2019 Appropriation 326 1,623,006

National Oceanic and Atmospheric Administration
FY 2019 Budget in Brief 73
National Environmental Satellite, Data & Information Service:
Systems Acquisition
Geostationary Satellites - R 59 $747,713 59 $743,276 59 $408,380 0 ($334,896) Jason-3 1 4,328 0 0 0 0 0 0 Joint Polar Satellite System (JPSS) 65 781,951 2 0 2 0 0 0 Polar Follow-on 29 326,684 4 0 4 0 0 0 Polar Weather Satellites 0 0 88 1,108,635 88 877,991 0 (230,644) Cooperative Data and Rescue Services 0 497 0 497 0 500 0 3 DSCOVR 2 3,720 0 0 0 0 0 0 Space Weather Follow-on 1 4,966 1 4,966 1 10,000 0 5,034 COSMIC 2/GNSS RO 1 8,045 1 8,045 1 5,892 0 (2,153)
Satellite Ground Services 86 53,636 86 53,681 86 52,332 0 (1,349) System Architecture & Advanced Planning 12 3,903 12 3,903 12 4,929 0 1,026 Projects, Planning & Analysis 37 25,030 37 25,030 37 36,539 0 11,509 Commercial Weather Data Pilot 0 4,966 0 4,966 0 3,000 0 (1,966) Subtotal 293 1,965,439 290 1,952,999 290 1,399,563 0 (553,436) Construction 0 2,213 0 2,213 0 2,450 0 237 OIG Transfer 0 (1,302) 0 (1,302) 0 (1,302) 0 0
Total, NESDIS PAC 293 1,966,350 290 1,953,910 290 1,400,711 0 (553,199)
Mission Support / Construction NOAA Construction 0 6,016 0 6,016 0 998 0 (5,018)
Total, Mission Support Construction PAC 0 6,016 0 6,016 0 998 0 (5,018)
Office of Marine & Aviation Operations
Fleet Capital Improvements 1 11,621 1 11,621 1 12,878 0 1,257 New Vessel Construction 7 74,495 7 74,495 7 75,000 0 505
Total, OMAO, PAC 8 86,116 8 86,116 8 87,878 0 1,762
TOTAL OBLIGATIONS, PAC 329 2,239,121 326 2,226,681 326 1,634,704 0 (591,977)
De-obligations 0 (13,000) 0 (13,000) 0 (13,000) 0 0
Rescission 0 (5,000) 0 0 0 0 0 0
TOTAL BUDGET AUTHORITY, PAC 329 2,221,121 326 2,213,681 326 1,621,704 0 (591,977)
TRANSFERS
TO OIG 0 1,302 0 1,302 0 1,302 0 0
Rescission 0 5,000 0 0 0 0 0 0
Subtotal, Transfers 0 6,302 0 1,302 0 1,302 0 0
APPROPRIATION, PAC 329 2,227,423 326 2,214,983 326 1,623,006 0 (591,977)

74 FY 2019 Budget in Brief
National Oceanic and Atmospheric Administration
Highlights of Program Changes Base Increase / Decrease Positions Amount Positions Amount National Ocean Service (NOS) 2 $3,676 0 -$2,135
NOAA requests the following decrease for the following activity:
• A decrease of 0 positions and $1,689 to discontinue grants to state agencies and academic institutions for construction and land acquisition activities within the National Estuarine Research Reserve System. Under this proposal, NOAA will continue to provide national-level system coordination and in-kind support to state governments that choose to continue operating the reserves using state funds.
• A decrease of 0 positions and $446 to reduce National Marine Sanctuaries Construction Grants funding for design and installation of signage, exhibits, and kiosks.
Office of Oceanic & Atmospheric Research (OAR) 0 $36,134 0 -$10,134
NOAA requests the following decrease for the following activity:
• A decrease of 0 positions and $10,134 to terminate the Mississippi State Partnership established by congressionally directed requirements to develop a dedicated high-performance computing facility in collaboration with partners with existing high-performance computing expertise and scientific synergies.
National Weather Service (NWS) 26 $140,829 0 -$23,253
NOAA requests the following increases for this activity: • An increase of 0 positions and $167 provide additional resources to the improved dissemination reliability project. The
improved dissemination reliability project mitigates risk to mission operations during severe weather events by upgrading network capabilities to reduce single points of failure and increase website capacity.
• An increase of 0 positions and $1,036 to provide tenant improvements (TI) and move costs associated with Weather Forecast Office (WFO) and River Forecast Center (RFC) relocations due to unacceptable conditions at facilities that will impact operations. These facilities are located in severe weather areas, such as tornados and hurricanes, where citizens, emergency managers, and local officials count on the timely and accurate delivery of weather warnings.
NOAA requests the following decreases for this activity: • A decrease of 0 positions and $16,284 for a planned reduction for the Service Life Extension Program to sustain
aging Next Generation Weather Radar infrastructure. The proposed funding decrease also reflects an additional $4,424 in reductions to the Observation Portfolio for a total reduction of $16,284.
• A decrease of 0 positions and $4,000 to eliminate the “Jet” supercomputing system and associated contract support in Boulder, CO and reduce NWS’s supercomputing use and associated contract support in Fairmont, WV. Major transition projects including hurricane forecast improvement, the Next Generation Global Prediction System, and storm surge modeling will need to compete for space on NOAA’s remaining supercomputing assets.
• A decrease of 0 positions and $4,172 to will eliminate funding to procure additional operational high-performance computing resources to support coupling of the current generation of terrestrial and coastal models and develop the next generation of integrated Earth system coupled models necessary to expand NOAA’s hydrologic products and services. This reduction maintains the existing water modeling capability.
National Environmental Satellite, Data, and Information Service (NESDIS) 290 $1,953,910 0 -$533,436
NOAA requests the following increases for this activity: • An increase of 0 positions and $5,034 for Space Weather Follow On (SWFO) program. This program increase will
continue work with Naval Research Laboratory (NRL) to develop the compact coronagraph (CCOR) for launch by 2024.
• An increase of 0 positions and $1,026 for System Architecture and Advanced Planning to begin pre-acquisition activities informed by the NOAA Satellite Observing System Architecture study to ensure continuity of NOAA’s environmental satellite data following the current GOES-R Series and JPSS programs.

National Oceanic and Atmospheric Administration
FY 2019 Budget in Brief 75
• An increase of 0 positions and $11,509 for Metop-C under Projects, Planning and Analysis to support the pre-launch testing, launch activities, and Ground Support Equipment of U.S.-instruments on the European Metop-C satellite, which is scheduled to launch in October 2018. This satellite will provide mid-morning polar observations for weather forecasting, and the launch of the NOAA suite of U.S. instruments on MetOp-C is critical to maintaining the quality of Numerical Weather Prediction (NWP) models.
• An increase of 0 positions and $237 to repair and renew Satellite Command and Data Acquisition infrastructure at a sustainable rate. Known and anticipated requirements are similar to improvements that have been completed previously such as server room air conditioners, asphalt road repair, fuel tank replacements, and boiler replacements.
NOAA requests the following decreases for this activity:
• A decrease of 0 positions and $334,896 to continue satellite engineering development, production, integration, and launch activities to complete the four-satellite Geostationary Operational Environmental Satellite - R (GOES-R) Series Program. The remaining funding will sustain the continuity of the GOES-R Series program geostationary observing platforms, including the instruments, satellite, and launch vehicle activities currently under contract to meet the GOES-S launch. Remaining funds will also be used to continue the development activities for GOES-T and GOES-U, including ground system check out.
• A decrease of 0 positions and $230,644 for a planned decrease to what was previously the Joint Polar Satellite System (JPSS) Programs of Record and an increase to what was previously the Polar Follow On (PFO) Program to maintain the original Launch Readiness Dates for JPSS-3 and JPSS-4. The FY 2019 funding will be used to operate and sustain the Suomi National Polar-orbiting Partnership (Suomi NPP) and NOAA 20 (formerly JPSS-1) satellites; continue development of the ATMS, CrIS, VIIRS, and OMPS instruments for JPSS-2, JPSS-3 and JPSS-4, and maintain programmatic and technical synergies with JPSS-2 to achieve cost efficiencies across the JPSS missions.
• A decrease of 0 positions and $2,153 for ground reception and processing of Global Navigation Satellite System Radio Occultation satellite data. FY 2019 funding will support ground system development necessary for the launch and operation of the COSMIC-2A constellation and will continue to fund the procurement of services for at least one commercial ground station to reduce data latency and increase data reliability at low cost.
• A decrease of 0 positions and $1,349 to decrease Satellite Ground Services (SGS) activities in order to fully support other existing NOAA priorities.
• A decrease of 0 positions and $1,966 for the Commercial Weather Data Pilot. This decrease adjusts the Commercial Weather Data Pilot funding to a level appropriate for the scope of work expected to be performed in FY 2019. This level of funding will allow NESDIS to test commercially available data and capabilities based on market research conducted in FY 2018 to assess the accuracy, value and impact of the commercial industry.
Mission Support 0 $6,016 0 -$5,018 NOAA requests the following increase for this activity:
• An increase of 0 positions and $998 to fund regional analysis focused on consolidation and colocation opportunities on a region such as National Capital, Southeast, Northeast, Mid-Atlantic, Gulf Coast, Great Lakes, Pacific Northwest, Alaska, Southwest, Southern California, or the Midwest/Great Plains.
NOAA requests the following decrease for this activity:
• A decrease of 0 positions and $4,526 to decrease National Marine Fisheries Service Facilities Initiative activities in order to fully support other existing NOAA priorities
• A decrease of 0 positions and $1,490 to decrease NAVSTA Newport activities in order to fully support other existing NOAA priorities. Funds provided under a FY 2018 Annualized Continuing Resolution will be sufficient to complete the design phase of the pier.
Office of Marine and Aviation Operations 8 $86,116 0 $1,762
NOAA requests the following increase for this activity: • An increase of 0 positions and $1,257 to increase funding available for capital repairs to NOAA’s ship fleet under the
Progressive Lifecycle Maintenance program. Progressive lifecycle maintenance offers greater capacity to address needed repairs that improve the material condition of the fleet and provides a sustained capital investment in mission systems refresh and technology infusion that will ensure NOAA ships remain capable of collecting environmental data to support NOAA’s mission and the public’s need for accurate and reliable information.
• An increase of 0 positions and $505 to continue fleet recapitalization.

76 FY 2019 Budget in Brief
National Oceanic and Atmospheric Administration
Appropriation: Pacific Coastal Salmon Recovery Summary of Requirements
SummaryPositions Amount
2018 Annualized CR 2 $64,559Adjustments 0 02019 Base 2 64,559Program Changes (2) (64,559)2019 Appropriation 0 0 This account funds state, tribal and local conservation initiatives to help recover Pacific salmon populations. State and local recipients of this funding provide matching contributions of at least thirty-three percent of Federal funds. In addition, NOAA makes funds available to Tribes that do not require matching dollars. The Administration has proposed to eliminate this account in the FY 2019 Congressional Budget.
Comparison by Activity
`Pos Amount Pos Amount Pos Amount Pos Amount
TOTAL BUDGET AUTHORITY / 2 $64,559 2 $64,559 0 $0 (2) ($64,559) APPROPRIATION
2018 Annualized CR 2019 Base 2019 Estimate Increase / Decrease
Highlights of Program Changes
Base Increase / Decrease Positions Amount Positions Amount Pacific Coastal Salmon Recovery 2 $64,559 -2 -$64,559
The Administration has proposed to eliminate this account in the FY 2019 Congressional Budget (-2 positions, -$64.6 million).

National Oceanic and Atmospheric Administration
FY 2019 Budget in Brief 77
Appropriation: Fishermen’s Contingency Fund
Summary of Requirements Summary
Positions Amount2018 Annualized CR 0 $348Adjustments 0 02019 Base 0 348Program Changes 0 12019 Appropriation 0 349
Comparison by Activity
`Pos Amount Pos Amount Pos Amount Pos Amount
TOTAL BUDGET AUTHORITY / 0 $348 0 $348 0 $349 0 $1 APPROPRIATION
2018 Annualized CR 2019 Base 2019 Estimate Increase / Decrease
The Fishermen's Contingency Fund is authorized under Section 402 of Title IV of the Outer Continental Shelf Lands Act Amendments of 1978. NOAA compensates U.S. commercial fishermen for damage or loss of fishing gear, vessels, and resulting economic loss caused by obstructions related to oil and gas exploration, development, and production in any area of the Outer Continental Shelf (OCS). The funds used to provide this compensation are derived from fees collected on an annual basis by the Secretary of the Interior from the holders of leases, exploration permits, easements, or rights-of-way in areas of the OCS. This activity is funded totally through user fees. Disbursements can be made only to the extent authorized in appropriation acts.

78 FY 2019 Budget in Brief
National Oceanic and Atmospheric Administration
Appropriation: Fisheries Finance Program Account Summary of Requirements
SummaryPositions Amount
2018 Annualized CR 0 $7,997Adjustments (7,997)2019 Base 0 0Program Changes 0 02019 Appropriation 0 0
Comparison by Activity
`Pos Amount Pos Amount Pos Amount Pos Amount
TOTAL BUDGET AUTHORITY / 0 $7,997 0 $0 0 $0 0 $0 APPROPRIATION
2018 Estimate 2019 Base 2019 Estimate Increase / Decrease
The Fisheries Finance Program (FFP) is a national loan program that makes long-term, fixed- rate financing available to U.S. citizens who otherwise qualify for financing or refinancing. Types of activities for financing include the construction, reconstruction, reconditioning, and, in some cases, the purchasing of fishing vessels, shoreside processing, aquaculture, mariculture facilities, and the purchase of individual fishing quota (IFQ). The FFP also provides fishery-wide financing to ease the transition to sustainable fisheries through its fishing capacity reduction programs and provides financing to fishermen who fish from small vessels and entry-level fishermen to promote stability and reduce consolidation in already rationalized fisheries. Additionally, FFP can provide loans for fisheries investments of Native American Community Development Quota (CDQ) groups.
The FFP operates under the authority of Title XI of the Merchant Marine Act of 1936, as amended (46 USC 53701); Section 303(a) of the Sustainable Fisheries Act amendments to the MSA; and, from time to time FFP-specific legislation. The overriding guideline for all FFP financings is that they cannot contribute or be construed to contribute to an increase in existing fish harvesting.

National Oceanic and Atmospheric Administration
FY 2019 Budget in Brief 79
Appropriation: Promote and Develop Fisheries Products Summary of Requirements
Comparison by Activity
`Pos Amount Pos Amount Pos Amount Pos Amount
TOTAL BUDGET AUTHORITY 3 $24,500 0 $0 0 $0 0 $0
TRANSFERS From Department of Agriculture (3) (154,868) (154,868) To NOAA ORF 130,164 154,868Appropriations Previously Unavailable (10,017) (10,221)Temporarily Reduced 10,221 10,221
TOTAL APPROPRIATION 0 0 0 0
2018 Annualized CR 2019 Base 2019 Estimate Increase / Decrease
The Promote and Develop account funds are derived from a transfer of thirty percent of duties on imported fisheries products from the Department of Agriculture. Funds from this account are transferred to offset the appropriations for fisheries research and management in the ORF account. Any funds remaining in this account after the ORF transfer are available for Saltonstall-Kennedy grants, which support fisheries research and development projects. For FY 2019, NOAA requests $0 funding for the S-K Grant Program. NOAA estimates that a total of $154,867,577 will be transferred from the Department of Agriculture to the Promote and Develop account. After accounting for sequestration $154,867,577 will be transferred from the Promote and Develop account to the ORF account.
Detailed SummaryPositions Amount Positions Amount
2018 Annualized CR 3 $0Transfers From Department of Agriculture $154,868
To NOAA ORF (130,164)
Total, Transfers 0 24,704Temporarily Reduced 0 (10,221)Appropriations Previously Unavailable 0 10,017Adjustments (3) (24,500)
2019 Base 0 0Program Changes 0 0Total Requirements 0 0Transfers From Department of Agriculture (154,868) To NOAA ORF 154,868Total, Transfers 0Temporarily Reduced 10,221Appropriations Previously Unavailable (10,221)2019 Appropriation 0 0

80 FY 2019 Budget in Brief
National Oceanic and Atmospheric Administration
Appropriation: Marine Mammal Unusual Mortality Event Fund
Summary of Requirements Summary
Positions Amount2018 Annualized CR 0 $0Adjustments 0 02019 Base 0 0Program Changes 0 02019 Appropriation 0 0 The Marine Mammal Protection Act Section 405 (16 USC 1421d) established the Marine Mammal Unusual Mortality Event Fund. NMFS established the Marine Mammal Health and Stranding Response Program, and its Working Group on Unusual Marine Mammal Mortality Events in response to the death of more than 700 bottlenose dolphins on the East Coast of the United States in 1987-88. This program determines when an unusual mortality event is occurring, and directs responses to such events. NOAA will make available funding from this account to members of the Marine Mammal Stranding Network for costs incurred in investigating the death of marine mammals. To date, Congress has appropriated funding for UMEs on one occasion in 2005. Some of those funds were transferred to the National Fish and Wildlife Foundation (NFWF) since they have the ability to quickly distribute funds within 30 days of invoicing to our partners during a UME. Therefore, at this time there are sufficient funds held at NFWF to meet most of our expected expenses in FY 2018 and we anticipate obligating $23,000 from the Marine Mammal Unusual Mortality Event Fund in FY 2019.
Appropriation: Medicare-Eligible Retiree Healthcare Fund Summary of Requirements
SummaryPositions Amount
2018 Annualized CR 0 $1,936Adjustments 0 (333)2019 Base 0 1,603Program Changes 0 02019 Appropriation 0 1,603
Comparison by Activity
Pos Amount Pos Amount Pos Amount Pos AmountTOTAL BUDGET AUTHORITY / 0 $1,936 0 $1,603 0 $1,603 0 $0 APPROPRIATION
2018 Annualized CR 2019 Base 2019 Estimate Increase / Decrease
This account funds the cost of TRICARE retirement health care benefits accrued by the active duty members of the NOAA Commissioned Corps. The Ronald W. Reagan National Defense Authorization Act for 2005 (P.L. 108-375) provided permanent, indefinite appropriations to finance these costs for all uniformed service members.

National Oceanic and Atmospheric Administration
FY 2019 Budget in Brief 81
Appropriation: Limited Access System Administration Fund Summary of Requirements
SummaryPositions Amount
2018 Mandatory Appropriation 40 $13,773Adjustments 0 2302019 Base 40 14,003Program Changes 0 02019 Mandatory Appropriation 40 14,003
Comparison by Activity
Pos Amount Pos Amount Pos Amount Pos AmountTOTAL BUDGET AUTHORITY / 40 $13,732 40 $13,988 40 $13,988 0 $0Temporarily reduced (868) (909)
Appropriation previously unavailable 909 924
TOTAL APPROPRIATION 40 13,773 40 14,003
2018 Estimate 2019 Base 2019 Estimate Increase / Decrease
Under the authority of the Magnuson-Stevens Act Section 304(d)(2)(A), NMFS must collect a fee to recover the incremental costs of management, data collection, and enforcement of Limited Access Privilege (LAP) programs. Funds collected under this authority are deposited into the Fund. Fees cannot exceed three percent of the ex-vessel value of fish harvested under any such program. The Fund is available, without appropriation or fiscal year limitation, only for the purposes of administrating the central registry system; and administering and implementing the MSA in the fishery in which the fees were collected. Appropriation: Foreign Fishing Observer Fund Summary of Requirements
SummaryPositions Amount
2018 Mandatory Appropriation 0 $0Adjustments 0 02019 Base 0 0Program Changes 0 02019 Mandatory Appropriation 0 0 The Foreign Fishing Observer Fund is financed through fees collected from owners and operators of foreign fishing vessels fishing within the U.S. EEZ (such fishing requires a permit issued under the MSA). This includes longline vessels fishing in the Atlantic billfish and shark fishery and other foreign vessels fishing in the EEZ. The fund is used by NOAA to pay salaries, administrative costs, data editing and entry, and other costs incurred in placing observers aboard foreign fishing vessels. The observer program is conducted primarily through contracts with the private sector. NOAA places these observers aboard foreign fishing vessels to monitor compliance with U.S. fishery laws and to collect fishery management data. Amounts available in the fund can be disbursed only to the extent and in amounts provided in appropriation acts. In FY 1985, Congress approved the establishment of a supplemental observer program. The program provided that foreign vessels without Federally funded observers are required to obtain the services of private contractors certified by the Secretary of Commerce.

82 FY 2019 Budget in Brief
National Oceanic and Atmospheric Administration
Appropriation: Damage Assessment and Restoration Revolving Fund Summary of Requirements
SummaryPositions Amount
2018 Mandatory Appropriation 15 $0Adjustments 0 02019 Base 15 0Program Changes 0 02019 Mandatory Appropriation 15 0
Comparison by Activity
TOTAL BUDGET AUTHORITY 15 $5,986 15 $5,968 15 $5,968 0 $0
TRANSFERS From Department of Interior (5,968) (5,968) Appropriations Temprarily Reduced 394 394 Appropriations Previously Unavailable (412) (394)
TOTAL APPROPRIATION 15 0 15 0
Established in 1990 under section 1012(a) of the Oil Pollution Act, this fund facilitates oil and hazardous material spill response, as well as assessment and restoration activities for damages to natural resources for which NOAA serves as trustee. The Fund retains sums transferred by responsible parties or government entities for future use. The sources of these funds are settlements and awards by the courts. Receipts from settlements are expected to be $10.0 million in FY 2018.
Appropriation: Federal Ship Financing Fund Summary of Requirements
SummaryPositions Amount
2018 Mandatory Appropriation 0 $0Adjustments 0 02019 Base 0 0Program Changes 0 02019 Mandatory Appropriation 0 0
The Federal Ship Financing Fund is the liquidating account necessary for the collection of premiums and fees of the loan guarantee portfolio that existed prior to FY 1992. Administrative expenses for management of the loan guarantee portfolio were charged to the Federal Ship Financing Fund prior to the enactment of the Federal Credit Reform Act of 1990. Administrative expenses are charged to the ORF account.

National Oceanic and Atmospheric Administration
FY 2019 Budget in Brief 83
Appropriation: Environmental Improvement and Restoration Fund Summary of Requirements
Comparison by Activity
`Pos Amount Pos Amount Pos Amount Pos Amount
TOTAL BUDGET AUTHORITY / 0 $4,858 0 $3,813 0 $3,813 0 $0Previously UnavailablePermanently Reduced 343 269
TOTAL APPROPRIATION 0 5,201 0 4,082
2018 Estimate 2019 Base 2019 Estimate Increase / Decrease
The Environmental Improvement and Restoration Fund (EIRF) was created by the Department of Interior and Related Agencies Appropriations Act of 1998 for the purpose of carrying out marine research activities in the North Pacific. These funds will provide grants to Federal, state, private, or foreign organizations or individuals to conduct research activities on or relating to the fisheries or marine ecosystems in the North Pacific Ocean, Bering Sea, and Arctic Ocean.
SummaryPositions Amount
2018 Mandatory Appropriation 0 $5,201Adjustments 0 (1,119)2019 Base 0 4,082Program Change 0 02019 Mandatory Appropriation 0 4,082

84 FY 2019 Budget in Brief
National Oceanic and Atmospheric Administration
Appropriation: Western Pacific Sustainable Fisheries Fund Summary of Requirements
SummaryPositions Amount
2018 Mandatory Appropriation 0 $500Adjustments 0 02019 Base 0 500Program Changes 0 02019 Mandatory Appropriation 0 500
Comparison by Activity
`Pos Amount Pos Amount Pos Amount Pos Amount
TOTAL BUDGET AUTHORITY 0 $494 0 $500 0 $500 0 $0Previously Unavailable (27) (33)Temporarily Reduced 33 33
TOTAL APPROPRIATION 0 500 0 500
2018 Estimate 2019 Base 2019 Estimate Increase / Decrease
Section 204(e) of the 2006 amendments to the MSA authorizes the establishment of the Western Pacific Sustainable Fisheries Fund. The purpose of this Fund is to allow foreign fishing within the U.S. EEZ in the Western Pacific though a Pacific Insular Area Fishery Agreement. Before entering into such an Agreement, the Western Pacific Fishery Management Council must develop a Marine Conservation Plan that provides details on uses for any funds collected by the Secretary of Commerce. Marine Conservation Plans must also be developed by the Governors of the Territories of Guam and American Samoa and of the Commonwealth of the Northern Mariana Islands and approved by the Secretary or designee.
The Western Pacific Sustainable Fisheries Fund serves as a repository for any permit payments received by the Secretary for foreign fishing within the U.S. EEZ around Johnston Atoll, Kingman Reef, Palmyra Atoll, and Jarvis, Howland, Baker and Wake Islands, sometimes known as the Pacific remote island areas (PRIA). In the case of violations by foreign vessels occurring in these areas, amounts received by the Secretary attributable to fines and penalties are deposited into the Western Pacific Sustainable Fisheries Fund to be used for fisheries enforcement and for implementation of a marine conservation plan. Additionally, any funds or contributions received in support of conservation and management objectives under a Marine Conservation Plan for any Pacific Insular Area other than American Samoa, Guam, or the Northern Mariana Islands are deposited in the Western Pacific Sustainable Fisheries Fund.
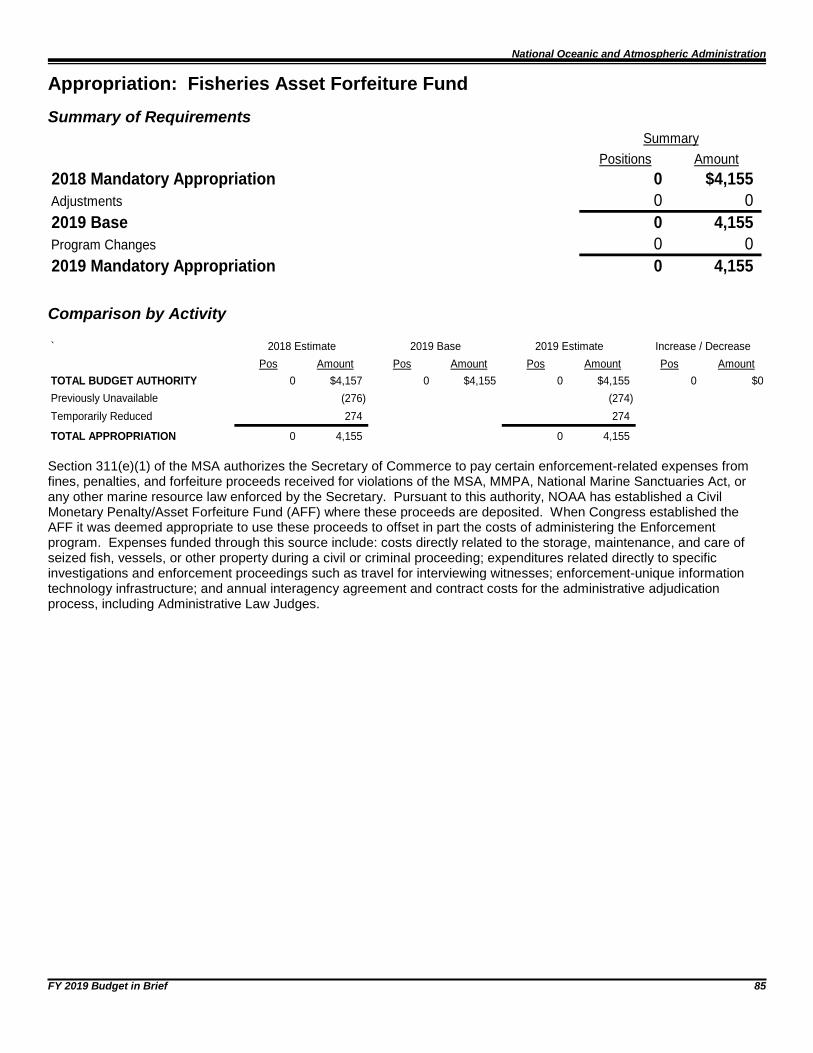
National Oceanic and Atmospheric Administration
FY 2019 Budget in Brief 85
Appropriation: Fisheries Asset Forfeiture Fund Summary of Requirements
SummaryPositions Amount
2018 Mandatory Appropriation 0 $4,155Adjustments 0 02019 Base 0 4,155Program Changes 0 02019 Mandatory Appropriation 0 4,155
Comparison by Activity
`Pos Amount Pos Amount Pos Amount Pos Amount
TOTAL BUDGET AUTHORITY 0 $4,157 0 $4,155 0 $4,155 0 $0Previously Unavailable (276) (274)Temporarily Reduced 274 274
TOTAL APPROPRIATION 0 4,155 0 4,155
2018 Estimate 2019 Base 2019 Estimate Increase / Decrease
Section 311(e)(1) of the MSA authorizes the Secretary of Commerce to pay certain enforcement-related expenses from fines, penalties, and forfeiture proceeds received for violations of the MSA, MMPA, National Marine Sanctuaries Act, or any other marine resource law enforced by the Secretary. Pursuant to this authority, NOAA has established a Civil Monetary Penalty/Asset Forfeiture Fund (AFF) where these proceeds are deposited. When Congress established the AFF it was deemed appropriate to use these proceeds to offset in part the costs of administering the Enforcement program. Expenses funded through this source include: costs directly related to the storage, maintenance, and care of seized fish, vessels, or other property during a civil or criminal proceeding; expenditures related directly to specific investigations and enforcement proceedings such as travel for interviewing witnesses; enforcement-unique information technology infrastructure; and annual interagency agreement and contract costs for the administrative adjudication process, including Administrative Law Judges.

86 FY 2019 Budget in Brief
National Oceanic and Atmospheric Administration
Appropriation: Sanctuaries Enforcement Asset Forfeiture Fund Summary of Requirements
SummaryPositions Amount
2018 Mandatory Appropriation 0 $120Adjustments 0 02019 Base 0 120Program Change 0 02019 Mandatory Appropriation 0 120
Comparison by Activity
`Pos Amount Pos Amount Pos Amount Pos Amount
TOTAL BUDGET AUTHORITY 0 $120 0 $120 0 $120 0 $0Previously Unavailable (8) (8)Temporarily Reduced 8 8
TOTAL APPROPRIATION 0 120 0 120
2018 Estimate 2019 Base 2019 Estimate Increase / Decrease
Sanctuaries Enforcement Asset Forfeiture Fund receives proceeds from civil penalties and forfeiture claims against responsible parties, as determined through court settlements or agreements, for violations of NOAA sanctuary regulations. Penalties received are held in sanctuary site-specific accounts from year to year and spent on resource protection within the sanctuary site where the penalty or forfeiture occurred. Funds are expended for resource protection purposes which may include all aspects of law enforcement (from equipment to labor), community oriented policing programs, and other resource protection and management measures such as the installation of mooring buoys or restoration of injured resources.

National Oceanic and Atmospheric Administration
FY 2019 Budget in Brief 87
Appropriation: North Pacific Observer Fund Summary of Requirements
SummaryPositions Amount
2018 Mandatory Appropriation 0 $3,850Adjustments 0 1502019 Base 0 4,000Program Change 0 02019 Mandatory Appropriation 0 4,000
Comparison by Activity
`Pos Amount Pos Amount Pos Amount Pos Amount
TOTAL BUDGET AUTHORITY 0 $3,870 0 $3,990 0 $3,990 0 $0Previously Unavailable (274) (254)Temporarily Reduced 254 264
TOTAL APPROPRIATION 0 3,850 0 4,000
2018 Estimate 2019 Base 2019 Estimate Increase / Decrease
On January 1, 2013, the restructured North Pacific Groundfish Observer Program (NPGOP) went into effect and made important changes to how observers are deployed, how observer coverage is funded, and the vessels and processors that must have some or all of their operations observed. Coverage levels are no longer based on vessel length and processing volume; rather, NMFS now has the flexibility to decide when and where to deploy observers based on a scientifically defensible deployment plan. The observer program places all vessels and processors in the groundfish and halibut fisheries off Alaska into one of two observer coverage categories: (1) full coverage category and (2) partial coverage.
Vessels and processors in the full coverage category (≥100% observer coverage) will obtain observers by contracting directly with observer providers. Vessels and processors in the partial coverage category (<100% observer coverage) will no longer contract independently with an observer provider, and will be required to carry an observer when they are selected through the Observer Declare and Deploy System (ODDS). Additionally, landings from all vessels in the partial coverage category will be assessed a 1.25 percent fee on standard ex-vessel prices of the landed catch weight of groundfish and halibut. The fee percentage is set in regulation and will be reviewed periodically by the North Pacific Council after the second year of the program. The money generated by this fee will be used to pay for observer coverage on the vessels and processors in the partial coverage category in the following year.
NMFS expects approximately $3.9 million to be collected in fees from the FY 2018 season, to be used in FY 2019 for observer coverage.

88 FY 2019 Budget in Brief
National Oceanic and Atmospheric Administration
Appropriation: Gulf Coast Ecosystem Restoration, Science, Observation, Monitoring and Technology Fund
Summary of Requirements Summary
Positions Amount2018 Mandatory Appropriation 1 $0Adjustments 0 02019 Base 1 0Program Change 0 02019 Appropriation 1 0
The Gulf Coast Ecosystem Restoration Science, Observation, Monitoring and Technology Fund provides funding for the NOAA RESTORE Act Science Program. The purpose of this program is to initiate and sustain an integrative, holistic understanding of the Gulf of Mexico ecosystem and support, to the maximum extent practicable, restoration efforts and the long-term sustainability of the ecosystem, including its fish stocks, fishing industries, habitat, and wildlife through ecosystem research, observation, monitoring, and technology development.
To ensure the best use of resources the Program will coordinate with existing federal and state science and technology programs, including other activities funded under the RESTORE Act. Section 1604 of the RESTORE Act authorized funding for the Program using 2.5 percent of the Gulf Coast Restoration Trust Fund.

National Oceanic and Atmospheric Administration
FY 2019 Budget in Brief 89
Performance Indicators The following table shows the NOAA performance Indicators. Additional details appear at the end of the NOAA section of the Department of Commerce budget.
2017 2017 2018 2019 Target Actual Target Target
Annual number of OAR R&D products transitioned to a new stage(s) (development, demonstration, or application). 65 65 42 42
Reduction in gap between high-performance computing deployed and what is needed to meet modeling requirements (in petaflops)
13 13 16 17
Key milestones completed on time for satellites and ship deployments 2 2 4 3
Base Funded Days-at-Sea for NOAA Ships 2,985 2,554 2,783 2,710
Annual number of peer-reviewed publications related to environmental understanding and prediction 1,700 1,678 1,100 1,050
Percentage of data processed and delivered to the user community 98.5 99.5% 98.5 98.5
U.S. temperature forecasts (cumulative skill score computed over the regions where predictions are made) 26 34 26 26
Lead time (minutes), accuracy (%) and False Alarm Rate (FAR) (%) for tornado warnings 13/72%/71% 9/58%/72% 13/72%/71% 13/72%/71%
Lead time (minutes) and accuracy (%) for flash flood warnings 63 / 76% 73 / 77% 63 / 76% 65 / 76%
Hurricane forecast track error (48 hour) 68 561 65 62
Hurricane forecast intensity error (48 hour) (diff. in knots) 12 131 12 12
Accuracy (%) (threat score) of Day 1 precipitation forecasts 33 34 33 33
Lead time (hours) and accuracy (%) for winter storm warnings 20 / 90% 22 / 87% 20 / 90% 20 / 90%
Accuracy (%) of forecast for marine wind speed / wave height 78 / 81 81 / 84 79 / 92 79 / 92
Accuracy (%) and FAR (%) of forecasts of ceiling and visibility (3 miles / 1000 feet) (aviation forecasts) 65 / 38 63 / 37 65 / 38 65 / 38
Geomagnetic storm forecast accuracy (%) 40 65 56 57
Percentage of U.S. coastal states and territories demonstrating annual improvement in resilience capacity to weather and climate hazards
66% 69% 71% 51%
Number of communities that utilize Digital Coast 5,500 7,040 5,500 5,000
Hydrographic survey backlog within navigational significant areas (square nautical miles surveyed per year) 2,287 2,480 2,279 2,279
Cumulative percent of U.S. and territories enabled to benefit from a new national vertical reference system for improved inundation management
62% 64% 70% 79%
Percent of all coastal communities susceptible to harmful algal blooms verifying use of accurate HAB forecasts 23% 23% 23% 23%
Percent of top 175 U.S. seaports with access to Physical Oceanographic Real-Time Systems (PORTS®), which improves the safety and efficiency of marine transportation
35% 37% 38% 39%

90 FY 2019 Budget in Brief
National Oceanic and Atmospheric Administration
2017 2017 2018 2019 Target Actual Target Target Fish Stock Sustainability Index (FSSI) (cumulative) 754 756.5 763 769.5
Percent of stocks for which the catch is below the specified Annual Catch Limit (ACL) (cumulative) 82.0 91.9 83.0 84.0
Percentage of FSSI fish stocks with adequate population assessments and forecasts (cumulative) 63.8 63.3 64.8 64.3
Percentage of protected species stocks with adequate population assessments and forecasts (cumulative) 19.9 19.3 21.7 24.9
Number of protected species designated as threatened, endangered, or depleted with stable of increasing population levels (cumulative)
30 30 30 30
Percentage and number of actions ongoing or completed to recover endangered and threatened species (cumulative) 48.7% / 2213 48.0% / 2,183 48.2% / 2241 48.8% / 2270
Number of habitat acres restored (annual) 11,050 10,207 17,280 22,300 Number of natural resource environments managed by the Office of National Marine Sanctuaries in which water, habitat, and living resource quality is stable or improving
9 9 9 10
Annual number of coastal, marine and Great Lakes habitat acres acquired or designated for long-term protection 800 6,782 800 200
Percentage of ingested environmental data safely archived to ensure consistent long-term stewardship and usability of the data (per National Archives and Records Administration (NARA) standards)
98% 98% 98% 98%
The cumulative number of NOAA datasets made openly available via Partners' cloud platforms to the public, America’s Weather Enterprise and other environmental information stakeholders.
New 6 15 20
Number of fishermen, seafood processors and aquaculture industry personnel who modify their practices using knowledge gained in fisheries sustainability and seafood safety.
New New New 60,000
Increase annual number of NOAA partnerships with the private sector (# of Cooperative Research and Development Agreements executed)
New New New 8
Uncertainty of the North American carbon sink to better understand the contribution of human activities toward increasing atmospheric CO2 and methane
400 million tons carbon / yr 400 Discontinued
Number of forecast and mission improvements based on NOAA research, to weather applications at operational US weather services and in the US weather commercial
9 9 Discontinued
Number of R&D capabilities transitioning to applications (from TRL 8 to TRL 90), to improve efficiency, accuracy, or precision of forecasts
8 6 Discontinued
Number of publications that contribute to improved understanding of the climate system 850 486 Discontinued
Cumulative number of coastal, marine and Great Lakes issue-based forecasting capabilities developed and used for management
113 108 Discontinued
Annual number of coastal, marine, and Great Lakes ecological characterizations that meet management needs 48 100 Discontinued
Percentage of tools, technologies, and information services that are used by NOAA partners / customers to improve ecosystem-based management
91% 94% Discontinued
Annual economic and societal benefits from Sea Grant activities as measured by jobs created/retained (reported by each individual Sea Grant College
20,770 7,100 Discontinued 0
1. Amounts are preliminary. NOAA will have final values in April 2018

United States Patent and Trademark Office
FY 2019 Budget in Brief 91
U.S. Patent and Trademark Office The mission of the U.S. Patent and Trademark Office (USPTO) is to foster innovation, competitiveness and economic growth, domestically and abroad, by providing high quality and timely examination of patent and trademark applications, guiding domestic and international intellectual property (IP) policy, and delivering IP information and education worldwide.
USPTO accomplishes this mission through its two distinct business lines, Patents and Trademarks, which administer the patent and trademark laws. These laws provide protection to inventors and businesses for their inventions and corporate and product identifications. The laws also encourage innovation and scientific and technical advancement of American industry through the preservation, classification, and dissemination of patent and trademark information. In addition to the examination of applications for patents and trademark registrations, the USPTO provides technical advice and information to federal agencies on IP matters and trade-related aspects of IP rights, and assists foreign governments in establishing regulatory and enforcement mechanisms to meet their international obligations relating to the protection of IP.
In FY 2019, USPTO continues to fulfill its mission by fully supporting the strategic and management priorities of quality, particularly quality examinations through training and guidance; patent pendency and backlog reduction; maintaining trademark pendency; providing domestic and global leadership in IP enforcement; modernizing information technology (IT); and stakeholder and public outreach, including a focus on small business education on obtaining and protecting IP. The Budget supports a 10-year extension of the authority of the Director of the USPTO to set or adjust any fee under Section 10, subsection (a) of the America Invents Act of 2011.
3,076.9
3,428.1 3,414.4
12,89813,011
13,148
12,000
12,250
12,500
12,750
13,000
13,250
13,500
3,000
3,200
3,400
3,600
3,800
4,000
2017 2018 2019
Posi
tions
Dolla
rs in
Mill
ions
Budget Authority Program Level / Positions
Funding Positions

92 FY 2019 Budget in Brief
United States Patent and Trademark Office
Summary of Appropriations 2017 2018 2019 Increase
Appropriations Actual Annualized CR Estimate (Decrease)
New Offsetting Coll. / Program Level $3,078,887 $3,430,123 $3,416,366 ($13,757)Fee Collections (3,078,887) (3,430,123) (3,416,366) 13,757Total Appropriation 0 0 0 0Amounts Temporarily Unavailable for Spending 0 (24,000) 0 24,000Transfer to IG (2,000) (2,000) (2,000) 0
Budget AuthorityNew Offsetting Coll. / Program Level 3,076,887 3,428,123 3,414,366 (13,757)
Base Fee Collections (3,078,887) (3,430,123) (3,416,366) 13,757Budget Authority Temporarily Unavailable 0 (24,000) 0 24,000
Total Budget Authority (2,000) (26,000) (2,000) 24,000
Positions - Reimbursable 12,898 13,011 13,148 137
Civilian Full-Time Equivalent Employment - Reimbursable 12,507 12,735 12,884 149

United States Patent and Trademark Office
FY 2019 Budget in Brief 93
Highlights of Budget Changes
Appropriation: Salaries and Expenses Summary of Requirements
Detailed SummaryPositions Amount Positions Amount
FY 2018 Annualized CR $02018 Estimated Fee Collections 13,011 3,430,123Other Income/Recoveries 39,445USPTO Funding from Operating Reserve (20,067)Funds currently available, 2018 13,011 3,449,501FY 2018 Transfer to DOC OIG (2,000)FY 2018 Base 13,011 3,447,501Adjustments to Base:Adjustments Non-recurring items (16,417)Other Changes 2018 Pay raise $7,308 Full year cost in 2019 for positions f inanced for part-year in FY 2018 8,562 Other Compensation Adjustments 36,936 Civil Service Retirement System (CSRS) (646) Federal Employees' Retirement System (FERS) 1,547 Thrift Savings Plan 185 Federal Insurance Contributions Act (FICA) - OASDI 541 Health insurance 4,308 Compensable Day 8,982 Post Retirement Benefits to OPM 4,329 Travel - Domestic per diem 74 Travel - Foreign per diem 42 Rent payments to GSA 1,660 Postage 123 Printing and reproduction 2,428 Working Capital Fund 973 General Pricing Level Adjustment: Transportation of things 4 Rental payments to others 148 Communications, utilities, and misc. charges 353 Other services 7,322 Supplies and materials 1,027 Equipment 4,807
Subtotal, Other Changes 0 91,013
Total Adjustments to Base 0 74,5962019 Base 13,011 3,522,097Program Changes 137 (63,096)TOTAL REQUIREMENTS 13,148 3,459,001Total Offsetting Fee Collections (3,416,366) Other Income/Recoveries (39,445) Transfer to OIG 2,000USPTO Funding to Operating Reserve (5,191)2019 NET APPROPRIATION 13,148 $0

94 FY 2019 Budget in Brief
United States Patent and Trademark Office
Comparison by Activity
REQUIREMENTS Pos Amount Pos Amount Pos Amount Pos Amount
Patents 11,645 $3,106,523 11,645 $3,175,630 11,714 $3,117,973 68 ($57,657)
Trademarks 1,366 340,978 1,366 346,467 1,435 341,029 69 (5,438)
TOTAL REQUIREMENTS 13,011 3,447,501 13,011 3,522,097 13,148 3,459,001 137 (63,096)
FINANCING
Fees (3,430,123) (3,416,366)
Other Income /Recoveries (39,445) (39,445)
Budget Authority Temporarily Unavailable (23,986)
USPTO funding to Operating Reserve 20,067 (5,191)
Subtotal Financing 0 (3,473,487) 0 (3,461,001)
TOTAL BUDGET AUTHORITY 13,011 (25,986) 13,148 (2,000)
Budget Authority Temporarily Unavailable 23,986
Transfer to DOC OIG 2,000 2,000
TOTAL APPROPRIATION 13,011 0 13,148 0
Highlights of Program Changes
Base Increase / Decrease Positions Amount Positions Amount Patent Process 11,645 $3,175,630 +68 -$57,657
USPTO will continue to make progress toward pendency targets and continually improve patent quality. Budgetary requirements in FY 2019 decrease by $57.7 million due to reductions in the year-over-year investment for the Patent End-to-End (PE2E), Patent legacy IT systems, and related IT infrastructure and IT support services, which more than offsets the increased cost of Patent examining workload costs. Investment in PE2E will continue, but the activities planned for FY 2019 require a lower level of funding than in FY 2018.
Trademark Process 1,366 $346,467 +69 -$5,438
The FY 2019 Budget provides resources for examining trademark applications, registering trademarks, maximizing the use of e-government for conducting business with applicants and registrants, and improving trademark practices worldwide. The FY 2019 negative program change is due to a reduction in the year-over-year investment for IT infrastructure and IT support services, which more than offsets the increased cost of additional Trademark staff due to increased workloads and the increased cost for Trademark Next Generation (TMNG) IT system.

United States Patent and Trademark Office
FY 2019 Budget in Brief 95
Performance Indicators
The following table shows the USPTO performance indicators. Additional details appear at the end of the USPTO section of the Department of Commerce budget.
2017 2017 2018 2019 Target Actual Target Target Number of foreign government officials trained on best practices to protect and enforce intellectual property 5,000 4,134 5,000 5,000
Patent average first action pendency (months) 14.8 16.3 15.4 14.5
Patent average total pendency (months) 24.8 24.2 25.0 23.8 Patent Percent First Actions completed within 14 months (percent) New measure as of FY 2017
--- 45.0% 47.0% 50.0%
Trademark first action pendency (months) 2.5 to 3.5 2.7 2.5 to 3.5 2.5 to 3.5
Trademark average total pendency (months) 12.0 9.5 12.0 12.0
Trademark first action compliance rate 95.5% 97.3% 95.5% 95.5%
Trademark final compliance rate 97.0% 98.3% 97.0% 97.0%
Trademark Exceptional Office Action (percent) 40.0% 45.0% 45.0% 46.0% Percentage of prioritized countries for which country teams have implemented at least 75% of action steps in the country-specific action plans towards progress in 1) institutional improvements of IP office administration for advancing IP protection; 2) institutional improvements of IP enforcement entities; 3) improvements in IP laws and regulations; and, 4) establishment of government-to-government cooperative mechanisms
75% 100% 65% 65%

96 FY 2019 Budget in Brief
United States Patent and Trademark Office

National Institute of Standards and Technology
FY 2019 Budget in Brief 97
National Institute of Standards and Technology The National Institute of Standards and Technology (NIST) mission is: To promote U.S. innovation and industrial competitiveness by advancing measurement science, standards, and technology enhancing economic security and improving our quality of life. NIST is authorized by the NIST Organic Act (15 USC 271), which outlines major roles for NIST in promoting national competitiveness and innovation.
NIST’s FY 2019 budget request is $629.072 million, $316.463 million below the FY 2018 Annualized Continuing Resolution level.
NIST accomplishes this mission and addresses its priorities through the following activities:
Scientific and Technical Research and Services (STRS): FY 2019 budget request for STRS is $573.4 million, $111.9 million below the FY 2018 Annualized Continuing Resolution level. NIST is authorized by the NIST Organic Act (15 USC 271), which outlines major roles for NIST in promoting national competitiveness and innovation. For more than 110 years, NIST has maintained the national standards of measurement, a role that the U.S. Constitution assigns to the federal government to ensure fairness in the marketplace. NIST was founded in 1901 and is one of the nation's oldest physical science laboratories. Today, the NIST Laboratory Programs work at the frontiers of measurement science to ensure that the U.S. system of measurements is firmly grounded on sound scientific and technical principles. Today, the NIST Laboratories address increasingly complex measurement challenges, ranging from the very small (quantum devices for sensing and advanced computing) to the very large (vehicles and buildings), and from the physical infrastructure to the virtual (cybersecurity and the internet of things). As new technologies develop and evolve, NIST's measurement research and services remain critical to national defense, homeland security, trade, and innovation.
Industrial Technology Services (ITS): The FY 2019 budget request is $15.1 million, $136.9 million below the FY 2018 Annualized Continuing Resolution level. The account funds two programs:
• Manufacturing USA: The FY 2019 budget request for Manufacturing USA is $15.1 million, $9.7 million below the FY 2018 Annualized Continuing Resolution level. Manufacturing USA, the National Network for Manufacturing Innovation serves to create effective robust manufacturing research infrastructure for U.S. industry and academia to solve industry-relevant problems. The Manufacturing USA consists of linked Institutes for Manufacturing Innovation with common goals, but unique concentrations. In an Institute, industry, academia, and government partners leverage existing resources, collaborate, and co-invest to nurture manufacturing innovation and accelerate commercialization. The request continues to fund the National Institute for Innovation in Manufacturing Biopharmaceuticals (NIIMBL) manufacturing institute as well as the coordination of the Manufacturing USA network.
• Hollings Manufacturing Extension Partnership (MEP): The FY 2019 President’s Budget request continues the discontinuation of federal funding for the MEP program, a reduction of $127.3 million from the FY 2018 Annualized Continuing Resolution level. The Hollings Manufacturing Extension Partnership Program (MEP) is a federal-state-industry partnership that provides U.S. manufacturers with access to technologies, resources, and industry experts. The MEP program consists of Manufacturing Extension Partnership Centers located across the country that work directly with their local manufacturing communities to strengthen the competitiveness of our nation’s domestic manufacturing base. In FY 2019, no federal funding will be provided for MEP Centers and the Centers will be required to change to an entirely self-supporting basis.
Construction of Research Facilities: The FY 2019 budget request for CRF is $40.5 million, $67.7 million below the FY 2018 Annualized Continuing Resolution level. The President's Budget provides funds for basic maintenance of NIST's current facilities.
959.9 951.4
628.63,444 3,444
2,986 2,800
3,200
3,600
4,000
400
600
800
1,000
1,200
2017 2018 2019
Posi
tion
s
Dol
lars
in
Mill
ions
Budget Authority and Positions
Funding Positions

98 FY 2019 Budget in Brief
National Institute of Standards and Technology
Summary of Appropriations
2017 2018 2019 IncreaseAppropriation Actual Annualized CR Estimate (Decrease)Scientific and Technical Research and Services $690,000 $685,314 $573,429 ($111,885)Industrial Technology Services 153,000 151,961 15,094 (136,867)Construction of Research Facilities 109,000 108,260 40,549 (67,711)Total Appropriation 952,000 945,535 629,072 (316,463)
Transfers of funds from Election Assistance 1,400 1,391 1,499 108Transfers of funds from DoJ to OLES / Forensics, STRS 4,500 4,470 0 (4,470)Off set for recoveries (ITS - MEP) 2,000 0 0 0Unobligated balance rescission (ITS - TIP) 0 0 (2,000) (2,000)
Budget AuthorityScientific and Technical Research and Services 695,900 691,175 574,928 (116,247)Industrial Technology Services 155,000 151,961 13,094 (138,867)Construction of Research Facilities 109,000 108,260 40,549 (67,711)
Total Budget Authority 959,900 951,396 628,571 (322,825)
PositionsScientific and Technical Research and Services - Direct 2,527 2,527 2,150 (377)Industrial Technology Services - Direct 101 101 20 (81)Construction of Research Facilities - Direct 116 116 116 0Working Capital Fund - Reimbursable 700 700 700 0
Total 3,444 3,444 2,986 (458)
Civilian Full-Time Equivalent Employment Scientific and Technical Research and Services - Direct 2,446 2,492 2,115 (377)Industrial Technology Services - Direct 94 100 20 (80)Construction of Research Facilities - Direct 83 110 110 0Working Capital Fund - Reimbursable 681 700 700 0Total 3,304 3,402 2,945 (457)

National Institute of Standards and Technology
FY 2019 Budget in Brief 99
Highlights of Budget Changes Appropriation: Scientific and Technical Research and Services Summary of Requirements
Detailed SummaryPositions Amount Positions Amount
2018 Annualized CR 2,527 $685,314Adjustments to BaseOther Changes
FY 2018 Pay raise $1,604 Civil Service Retirement System (CSRS) (321) Federal Employees' Retirement System (FERS) 614 Thrift Savings Plan (TSP) 92 Federal Insurance Contributions Act (FICA) - OASDI 321 Health insurance 793 Employees' Compensation Fund 79 Compensable day 1,376 Travel - Per Diem 74 Rent payments to GSA 3 Postage 2 Printing and reproduction 12 Electricity rate increase 261 Natural gas rate decrease (126) National Archives and Records Administration (NARA) (5) Other Services: Commerce Business System (3,501) Working Capital Fund (DM) 680 General Pricing Level Adjustment: Transportation of things 18 Rental payments to others 32 Communications, utilities and miscellaneous 73 Other services 1,459 Supplies and materials 399 Equipment 640 Scientific journal subscriptions 186
Subtotal, other changes 0 4,765
Total, Adjustments to Base 0 4,7652019 Base 2,527 690,079Program Changes (377) (116,650)2019 Appropriation 2,150 573,429

100 FY 2019 Budget in Brief
National Institute of Standards and Technology
Comparison by Activity
2018 Annualized CR 2019 Base 2019 Estimate
BUDGET AUTHORITY Pos Amount Pos Amount Pos Amount Pos Amount
Laboratory Programs 2,297 $602,001 2,297 $607,936 1,972 $518,141 (325) ($89,795)
Corporate Services 45 17,193 45 13,850 39 11,632 (6) (2,218)Standards Coordination and Special Programs 185 71,981 185 68,293 139 45,155 (46) (23,138)
TOTAL BUDGET AUTHORITY 2,527 691,175 2,527 690,079 2,150 574,928 (377) (115,151)
FINANCING
Transfers from EAC (1,391) 0 (1,499) 0 (1,499)
Transfers from DoJ (4,470) 0 0 0 0
TOTAL APPROPRIATION 2,527 685,314 2,527 690,079 2,150 573,429 (377) (116,650)
Increase / Decrease
Highlights of Program Changes
Base Increase / Decrease Positions Amount Positions Amount
Laboratory Programs 2,297 $607,936 -325 -$91,294
The request for laboratory programs is approximately a 15 percent reduction from the FY 2018 Annualized Continuing Resolution levels. The funding for the NIST laboratory programs will be reduced by $91.294 million and proposes the elimination of 325 employees. Of those employees, over 200 of them come from NIST’s scientific workforce, a more than 10 percent reduction in scientists and engineers. NIST will ensure that the agency maintains a robust core competency in underpinning measurement science so that NIST may continue to provide the measurements and standards necessary to drive innovation in key priority areas, which include advanced manufacturing, communications, quantum science, and cybersecurity. At the same time, NIST will seek to support forward looking measurement science research to ensure it is positioned to meet the challenges of the future. To preserve a core foundation in measurement science, NIST is proposing reductions to programs and projects across the NIST laboratory portfolio, targeting those that are of lower priority for reasons such as technology maturity, sub-critical effort, where the work no longer requires the leading-edge measurement science capabilities of NIST, or where services may be acquired from international sources. Standards Coordination and Special Programs 185 $68,293 -46 -$23,138
Consistent with NIST’s priority to focus resources on the laboratory programs, NIST is proposing reductions to the Standards Coordination and Special Programs subactivity line by 34 percent, a reduction of $23.138 million dollars. The Standards Coordination and Special Programs sub-program line houses two cross-NIST activities managed by the Associate Director for Laboratory Programs: crosscutting R&D programs, and documentary standards coordination and policy development. The proposed reductions will largely eliminate external R&D partnerships that expand and broaden the impact of the NIST Laboratory R&D programs. They will also eliminate crosscutting R&D program management functions of the Special Programs Office, leaving the individual NIST laboratories responsible for remaining intramural work to taking on those responsibilities. Corporate Services 45 $13,850 -6 -$2,218
Consistent with NIST’s priority to focus resources on the laboratory programs, NIST is proposing reductions to the Corporate Services sub program line by approximately 16 percent, a reduction of $2.218 million dollars. The proposed reductions will streamline management’s monitoring of operational metrics and CIO-wide trends potentially increasing risk of service interruptions. Network maintenance will be kept on most critical network components; however, less critical systems may experience increased times to respond to network connections and Windows desktop incidents and requests. The cuts will equally impact each of the NIST mission functions and programmatic areas that make up the research portfolio of the NIST Laboratory Programs.

National Institute of Standards and Technology
FY 2019 Budget in Brief 101
Appropriation: Construction of Research Facilities Summary of Requirements
Detailed SummaryPositions Amount Positions Amount
2018 Annualized CR 116 $108,260Adjustments to BaseOther Changes FY 2018 Pay raise $64
Civil Service Retirement System (CSRS) (11)
Federal Employees' Retirement System (FERS) 21
Thrift Savings Plan (TSP) 3
Federal Insurance Contribution Act (FICA) - OASDI 11
Health Insurance 28
Employees' Compensation Fund 3
Compensable day 48
Electricity rate increase 3
Natural gas rate decrease (1)
General pricing level adjustment:
Other services 393
Supplies and materials 19
Equipment 5
Subtotal, other changes 0 586
Total Adjustments to Base 0 5862019 Base 116 108,846Program Changes 0 (68,297)2019 APPROPRIATION 116 40,549
Comparison by Activity
2018 Annualized CR 2019 Base 2019 Estimate
BUDGET AUTHORITY Pos Amount Pos Amount Pos Amount Pos Amount
Construction and major renovations 116 $108,260 116 $108,846 116 $40,549 0 ($68,297)
TOTAL BUDGET AUTHORITY / 116 108,260 116 108,846 116 40,549 0 (68,297)
APPROPRIATION
Increase / Decrease
Highlights of Program Changes Base Increase / Decrease Positions Amount Positions Amount Construction and Major Renovations 0 $60,000 0 -$60,000
Delay of the Building 245 Modernization: This request stops the renovation and modernization efforts of the Radiation Physics Building (Building 245), a critical research facility on NIST's Gaithersburg, Maryland campus.
By delaying the completion of the renovation of these facilities, NIST will limit some research efforts related to explosive and radiological materials detection and medical imaging. The Building 245 modernization effort has been segmented into multiple phases, with this decrease the B/C Wing addition and D Wing addition will be largely complete, however renovations necessary for the remaining portions of the building will be halted. While the B/C Wing addition is estimated to be complete in the third quarter of FY 2019, the remaining construction under contract is estimated to be fully complete in the fourth quarter of FY 2020.

102 FY 2019 Budget in Brief
National Institute of Standards and Technology
Base Increase / Decrease Positions Amount Positions Amount Safety, Capacity, Maintenance, and Major Repairs (SCMMR) 0 $48,846 0 -$8,297
The $8.3 million decrease is a combination of a $10.0 million decrease in the Building 1 Renovation and an increase in SCMMR for $1.7 million. This request acknowledges a reduction of $10 million in FY 2019 and delays efforts to renovate Building 1, the 60-year-old main research facility on NIST's Boulder, Colorado campus. Work funded through FY 2018 will be complete in the fourth quarter of FY 2019. Development of the full design of Wing 5 will not begin until funding resumes. Increase to the Safety, Capacity, Maintenance and Major Repairs base: This request of $1.703 million will be utilized to reduce deficiencies of NIST facilities by directing the funding towards the highest priority needs.
Appropriation: Industrial Technology Services Summary of Requirements
Detailed SummaryPositions Amount Positions Amount
2018 Annualized CR 101 $151,961Adjustments to BaseOther Changes 2018 Pay raise $66
Civil Service Retirement System (CSRS) (13)
Federal Employees' Retirement System (FERS) 25
Thrift Savings Plan (TSP) 4
Federal Insurance Contribution Act (FICA) - OASDI 13
Health Insurance 33
Employees' Compensation Fund 4
Compensable day 57
Travel - Per Diem 3
Electricity rate increase 6
Natural Gas rate decrease (4)
General pricing level adjustment:
Communications, utilities, and miscellaneous charges 4
Other services 65
Supplies and materials 2 Equipment 6
Subtotal, other changes 0 271
Total Adjustments to Base 0 2712019 Base 101 152,232Program Changes (81) (137,138)2019 APPROPRIATION 20 15,094

National Institute of Standards and Technology
FY 2019 Budget in Brief 103
Comparison by Activity 2018 Annualized CR 2019 Base 2019 Estimate
BUDGET AUTHORITY Pos Amount Pos Amount Pos Amount Pos Amount
Hollings Manufacturing Extension Partnership Program
81 $127,131 81 $127,331 0 $0 (81) ($127,331)
Manufacturing USA 20 24,830 20 24,901 20 15,094 0 (9,807)
TOTAL BUDGET AUTHORITY / 101 151,961 101 152,232 20 15,094 * (81) (137,138)
APPROPRIATION
Increase / Decrease
* A rescission of $2 million in carryover balances from the discontinued Technology Innovation Program (TIP) adjusts the ITS Budget Authority to $13.094 million.
Highlights of Program Changes
Base Increase / Decrease Positions Amount Positions Amount Hollings Manufacturing Extension Partnership (MEP) 81 $127,331 -81 -$127,331
The FY 2019 budget eliminates federal funding for NIST MEP.
Manufacturing USA 20 $24,901 0 -$9,807
The FY 2019 base funding is $15.1 million for the Manufacturing USA program: $10.0 million to maintain support for the NIIMBL institute and $5.1 million for coordination of the network of manufacturing institutes. With this level NIST will be able to fund the NIIMBL institute at the planned level of $70.0 million for the five-year start-up period, and, provide network support for all institutes in the network, including those funded by other agencies. With the base level of $15.1 million, NIST will not award a second institute from the open-topic competition. The multi-year funding stream to complete the planned $70.0 million total for NIIMBL is $20.0 million annually in FY 2016 and FY 2017, and would be $10.0 million annually in FY 2018, FY 2019, and FY 2020.
Appropriation: Working Capital Fund Comparison by Activity
2018 Annualized CR 2019 Base 2019 Estimate
Pos Amount Pos Amount Pos Amount Pos Amount
TOTAL BUDGET AUTHORITY / 700 $0 700 $0 700 $0 0 $0
APPROPRIATION
Increase / Decrease

104 FY 2019 Budget in Brief
National Institute of Standards and Technology
Public Safety Communications Research Fund (PSCRF) NIST will continue to execute mandatory resources provided under the Middle-Class Tax Relief and Job Creation Act of 2012 through the NIST Public Safety Communications Research Fund to help develop cutting-edge wireless technologies for public safety users, as part of the National Wireless Initiative included in the Act.
Summary of Appropriations
2017 2018 2019 IncreaseAppropriation Actual Annualized CR Estimate (Decrease)Wireless Innovation Fund $0 $0 $0 $0
Positions 78 78 78 0
Civilian Full-Time Equivalent Employment - Reimbursable 78 78 78 0
Highlights of Budget Changes Appropriation: Wireless Innovation Fund Summary of Requirements
SummaryPositions Amount
2018 Annualized CR 78 $0Adjustments to Base 0 0
2019 Base 78 0Program Changes 0 0
2019 APPROPRIATION 78 0

National Institute of Standards and Technology
FY 2019 Budget in Brief 105
Performance Indicators The following table shows the NIST performance indicators. Additional details appear at the end of the NIST section of the Department of Commerce budget.
2017 2017 2018 2019 Target Actual Target Target
Number of businesses using NIST research facilities 325 442 325 300
Relative citation impact of NIST-authored publications 1.6 1.66 1.6 1.3
Dollar amount of co-investment by non-federal sources in DOC-supported Manufacturing USA institutes (millions) $6 $8.89 $15 $29M
International adoption of NIST Quantum SI standards New New 3 4
Number of companies and organizations exposed to NCCOE produced cybersecurity practice guides and other products New New 5,500 6,000
Number of resources derived from the Cybersecurity Framework New New 70 80
Cumulative number of collaborators on NCCoE projects New New 123 140
Number of critical infrastructure sectors with work products integrating the Cybersecurity framework 14 16 Discontinued
Number of Public safety communications stakeholder R&D roadmaps 3 3 Discontinued
Number of communities working with NIST to pilot the Community Resilience Planning Guide 6 8 7 Discontinued
Number of firms receiving in-depth technical assistance from MEP centers 9,187 8,927 9,487 Discontinued
Percentage of MEP clients receiving in-depth technical assistance that increases their competitiveness 64% 65.2% 65% Discontinued
Number of MEP centers partnering with skills training providers (e.g., community colleges) to link manufacturing firms with skills training resources
48 49 49 Discontinued

106 FY 2019 Budget in Brief
National Institute of Standards and Technology

National Telecommunications and Information Administration
FY 2019 Budget in Brief 107
National Technical Information Service The mission of the National Technical Information Service is to provide innovative data services to federal agencies, through agile partnerships with the private sector, to advance federal data priorities, promote economic growth, and enable operational excellence. Moving quickly, bringing industry-leading partners to government agency customers at the velocity of the government's needs. NTIS reports to the Secretary of Commerce through the National Institute of Standards and Technology. NTIS operates a revolving fund for the payment of all expenses incurred.
NTIS’ mission priorities are to:
• Design, test, analyze, and demonstrate the application of Federal data and data services, either alone or in some combination with non-Federal data;
• Leverage the private sector’s knowledge and expertise in managing data and data sets; • Help create suites of products, platforms and services that meet the needs of businesses, innovators, government
agencies or others; and, • Enhance data discovery, usability, interoperability, standards, analytics, and forecasting, or data infrastructure and
security.
In FY 2019, NTIS continues to fulfill its mission by providing innovative data services aligned with its data mission.
Summary of Appropriations 2017 2018 2019 Increase
Appropriation Actual Annualized CR Estimate (Decrease)NTIS Revolving Fund $0 $0 $0 $0
Positions 99 150 150 0
Civilian Full-Time Equivalent Employment - Reimbursable 99 150 150 0
Highlights of Budget Changes Appropriation: Salaries and Expenses Summary of Requirements
SummaryPositions Amount
2018 Annualized CR 150 $0Adjustments to Base 0 02019 Base 150 0Program Changes 0 02019 Appropriation 150 0

108 FY 2019 Budget in Brief
National Telecommunications and Information Administration
Performance Indicators
The following table shows the NTIS performance indicators. Additional details appear at the end of the NTIS section of the Department of Commerce budget.
2017 2017 2018 2019 Target Actual Target Target
Number of updated items available (annual) 451,769 16,809 463,063 474,640
Number of information products disseminated (annual) 54,900,000 102,855 55,900,000 56,900,000
Customer satisfaction 95% - 98% 97.5% 95% - 98% 95% - 98%

National Telecommunications and Information Administration
FY 2019 Budget in Brief 109
National Telecommunications and Information Administration The mission of the National Telecommunications and Information Administration (NTIA) is to advise the President on communication and information policy. NTIA accomplishes this mission through the following activities within the Salaries and Expenses (S&E) account which focus on NTIA’s core programs:
• Domestic and International Policies; • Spectrum Management; • Advanced Communications Research; and • Broadband Programs.
NTIA’s mission priorities include:
• Developing domestic and international communications and information policy for the executive branch; • Ensuring the efficient and effective management and use of spectrum by federal agencies; • Performing state-of-the-art communications research, engineering, and planning; • Administering and managing broadband grant programs; and • Establishing a nationwide interoperable public safety broadband network.
The National Telecommunications and Information Administration’s (NTIA) FY 2019 Budget Request totals $33.6 million. The budget request supports the critical role advising the President on communications and information policy issues. NTIA’s programs and policymaking focus on expanding the availability of spectrum for all users, managing core spectrum programs effectively and efficiently, and identifying innovative approaches to increase spectrum access and sharing opportunities. Additionally, this Budget provides the resources to ensure that the Internet remains an engine for continued economic growth, which promotes a 21st century Internet economy in rural communities, and, expands broadband Internet access and adoption in America.
NTIA’s spectrum management program funding for FY 2019 totals $8.78 million and 39 positions. The tremendous growth in demand for wireless broadband by consumers, businesses, and government agencies requires innovative approaches to increase spectrum access to commercial and federal users. NTIA also supports the commercial sector’s development of next generation wireless services by evaluating and ensuring the efficient use of spectrum by Government users, recommending reallocation for commercial use where possible, and promoting sharing between commercial and government users. The agency promotes the best possible and most efficient use of the nation’s limited spectrum resources across the Federal Government to satisfy the congressionally mandated missions of all federal agencies in support of national defense, homeland security, law enforcement, and public safety. Working with the Federal Communications Commission (FCC), NTIA coordinates international and domestic spectrum access requirements, identifies and reallocates spectrum bands for commercial use, updates spectrum policies, and develops long-range spectrum management plans. NTIA collaborates with the State Department and other interested agencies to advance U.S. interests and positions related to international spectrum issues, conferences, and negotiations. To promote efficient use of the electromagnetic spectrum, the Budget proposes to authorize NTIA to negotiate leases with private entities that would expand their access to federal spectrum. This authority will complement ongoing efforts to make Federal spectrum available for commercial uses through auctions conducted by the Federal Communications Commission. In addition, in an effort to better define and validate the spectrum fee structure, NTIA is currently conducting a review of spectrum management costs, functions and allocations. The review began in October 2017 and will conclude in FY 2019 with implementation of a new fee structure beginning in FY 2020. This review may impact the level of fees charged to Agencies in the FY 2020. NTIA’s advanced communications research program funding for FY 2019 totals $8.46 million and 45 positions. Communications research plays a critical role identifying innovative approaches to increase spectrum access and sharing opportunities. This request includes resources for NTIA’s Institute for Telecommunication Sciences (ITS) which provides scientific research on spectrum capability, spectrum management approaches (e.g., spectrum sharing) and spectrum-enabled technology development and testing for both federal agencies and private industry partners. NTIA has a statutory directive to further scientific knowledge related to telecommunications, particularly with respect to radio spectrum. NTIA is expanding collaborative research and development in advanced communications technologies to support commercial and government applications. This work will advance research, development, testing, and evaluation to enhance wireless efficiencies.
32.0 31.8 33.6
136 143 143
0
100
200
0
20
40
60
2017 2018 2019
Posi
tion
s
Dolla
rs in
Mill
ions
Budget Authority and Positions
Funding Positions

110 FY 2019 Budget in Brief
National Telecommunications and Information Administration
NTIA’s policy program funding in FY 2019 totals $8.13 million and 33 positions. The Internet is the greatest engine of communications and commerce the world has ever known. NTIA’s domestic and international policies work to preserve the Internet’s openness and its cultural and economic potentials while advancing key U.S. interests. NTIA coordinates Executive Branch communications policy and represents the Administration’s policy to independent agencies such as the Federal Communication Commission (FCC) and the Federal Trade Commission (FTC). NTIA policy must be positioned to meet the growing complexity of the Internet environment, as the world becomes more interconnected via rapid growth of the Internet, the globalization of information technology services and equipment, and as governance of the Internet becomes an increasingly geopolitical issue. The FY 2019 President’s Budget Request continues to support the United States leadership on these broad range of Internet policy issues. Utilizing the multistakeholder process, which involves the full inclusion of stakeholders, to reach general consensus on internet policy issues (e.g., consumer data privacy, cybersecurity, digital copyright), NTIA will be central to the Executive Branch’s involvement in the Internet Governance Forum (IGF), and support mutual legal assistance treaty modernization efforts with key industries in the U.S. NTIA’s broadband program funding in FY 2019 totals $8.27 and 26 positions. Broadband has become integral in fueling a dynamic economy, driving commerce, enriching education, enhancing healthcare, and improving public safety. NTIA’s FY 2019 budget continues to address demand by state, local, and tribal governments for technical assistance and hands-on guidance in bringing broadband to American communities across the nation. NTIA will continue to respond to the demand for technical services and broadband leadership efforts by partnering with unserved and underserved communities, so that they can attract new business investments and spur economic growth. NTIA’s strategy capitalizes on strong relationships with broadband providers, municipal organizations, innovation economy firms, non-profit organizations, foundations, and other federal stakeholders.
Summary of Appropriations
2017 2018 2019 IncreaseAppropriation Actual Annualized CR Estimate (Decrease)
Salaries and Expenses 32,000 31,783 33,646 1,863
Total Appropriation / Budget Authority 32,000 31,783 33,646 1,863
PositionsSalaries and Expenses - direct 136 143 143 0Salaries and Expenses - reimbursable 143 159 159 0
Total 279 302 302 0
Civilian Full-Time Equivalent EmploymentSalaries and Expenses - direct 136 143 143 0Salaries and Expenses - reimbursable 143 159 159 0Total 279 302 302 0

National Telecommunications and Information Administration
FY 2019 Budget in Brief 111
Highlights of Budget Changes Appropriation: Salaries and Expenses Summary of Requirements
Detailed SummaryPositions Amount Positions Amount
2018 Annualized CR 143 31,783Adjustments to BaseOther Changes FY 2018 Pay raise 94 Health insurance 33 Employee Compensation Fund (17) Compensable Day 67
Travel - Per diem 7 Postage 1 Printing and reproduction 1 NARA (1) Working Capital Fund 333 General Pricing Level Adjustment: Rental payments to others 23 Communications, utilities, and miscellaneous charges 2 Other services 106 Supplies and materials 3 Equipment 27
Subtotal, other changes 0 679Total Adjustments to Base 0 679
2019 Base 143 32,462Program Changes 0 1,184
2019 APPROPRIATION 143 33,646

112 FY 2019 Budget in Brief
National Telecommunications and Information Administration
Comparison by Activity
2018 Annualized CR 2019 Base 2019 Estimate
Direct Obligations Pos Amount Pos Amount Pos Amount Pos Amount
Domestic & International Policies 33 7,922 33 8,084 33 8,130 0 46
Spectrum Management 39 7,559 39 7,724 39 8,778 0 1,054
Advanced Communications Research 45 8,176 45 8,384 45 8,464 0 80Broadband Programs 26 8,126 26 8,270 26 8,274 0 4
Total Direct Obligations 143 31,783 143 32,462 143 33,646 0 1,184Reimbursable Authority 159 66,781 159 41,679 159 45,687 0 4,008
TOTAL OBLIGATIONS 302 98,564 302 74,141 302 79,333 0 5,192
FINANCING
Unoblig bal, start of year (Reimbursable)
Offsetting collections from:
Federal funds (157) (66,281) (157) (45,187)
Non-Federal sources (2) (500) (2) (500)
Subtotal, financing (159) (66,781) (159) (45,687)
TOTAL BUDGET AUTHORITY / 143 31,783 143 33,646 APPROPRIATION
Increase / Decrease
Highlights of Program Changes
Base Increase / Decrease Positions Amount Positions Amount Domestic and International Policies 33 8,084 0 46
NTIA proposes an increase of $46K in support services.
Spectrum Management 39 7,724 0 1,054
NTIA proposes an increase of $1,054K in Spectrum Management. This increase will increase the offsetting collections by an additional $4,216K for a total increase of $5,270K. NTIA will use the increase in funding to decrese the monthly backlog of spectrum certifications by 10 percent.
Advanced Communications Research 45 8,384 0 80
NTIA proposes an increase in $80K in the areas of Advanced Communications Research will be used to purchase technical equipment.
Broadband Programs 26 8,270 0 4
NTIA proposes an increase in $4K be used in support services.

National Telecommunications and Information Administration
FY 2019 Budget in Brief 113
Public Safety Broadband Network The Middle Class Tax Relief Act of 2012, P.L.112-96, established the Public Safety Trust Fund (PSTF), the Network Construction Fund, and the State and Local Implementation Fund and provided $7 billion to establish a nationwide interoperable public safety broadband network (NPSBN) for first responders. give public safety 21st century communication tools to help save lives, solve crimes, and keep our communities and emergency responders safe. The NPSBN will The investment is now supported by proceeds from specified spectrum auctions conducted by the Federal Communications Commission (FCC), with all proceeds net of certain costs deposited into the PSTF. Funding will be expended in support of programs specified in the Act, including the development of the public safety broadband network in the 700 MHz band and research and development of standards, technologies, and applications to advance wireless public safety and communications.
The Act also provided $135 million for a grant program to assist State, regional, tribal, and local jurisdictions to identify, plan, and implement the most efficient, effective way to utilize and integrate the infrastructure, equipment, and other architecture associated with the nationwide public safety broadband network.

114 FY 2019 Budget in Brief
National Telecommunications and Information Administration
Summary of Appropriations Appropriation, Mandatory
2017 2018 2019 IncreasePublic Safety Trust Fund Actual Estimate Estimate (Decrease)Appropriation (Special or Trust Fund) 0 0 0 0
Appropriation prev. unavail 21,420 0 0 0Transfer to Treasury (Deficit Reduction) 0 0 0 0Appropriations Temporarily Reduced 0 0 0 0
Mandatory Appropriation 21,420 0 0 0
State and Local Implementation FundOffsetting Collections (Receipts from Public Safety Trust Fund)
0 0 0 0
Spending Authority from offsetting collections applied to repay debt 0 0 0 0
Spending authority from offsetting collections substituted for borrowing authority 0 0 0 0
Spending Authority from offsetting collections 0 0 0 0
Network Construction FundOffsetting Collections (Receipts from Public Safety Trust Fund) 14,229 50,875 0 (50,875)
Spending Authority from offsetting collections 14,229 50,875 0 (50,875)
First Responder Network AuthorityOffsetting collections (Fees transferred by network partner) 0
240,000 120,000 (120,000)
Spending authority from offsetting collections 0 240,000 120,000 (120,000)
PositionsPublic Safety Trust Fund - Direct 61 102 5 (97)State and Local Implementation Fund - Direct 4 4 4 0Network Construction Fund - Direct 157 97 3 (94)First Responder Network Authority - Reimbursable 0 94 260 166Total 222 297 272 (25)
Civilian Full-Time Equivalent EmploymentPublic Safety Trust Fund - Direct 61 102 5 (97)State and Local Implementation Fund - Direct 4 4 4 0Network Construction Fund - Direct 157 97 3 (94)First Responder Network Authority - Reimbursable 0 94 260 166Total 222 297 272 (25)

National Telecommunications and Information Administration
FY 2019 Budget in Brief 115
Highlights of Budget Changes Appropriation: Public Safety Trust Fund Summary of Requirements
SummaryPositions Amount
2018 Estimate 102 $0Adjustments to Base 0 02019 Base 102 0Program Changes (97) 0
2019 Mandatory Budget Authority 5 0
Comparison by Activity
2018 Estimate 2019 Base 2019 Estimate
BUDGET AUTHORITY Pos Amount Pos Amount Pos Amount Pos Amount
Public Safety Trust Fund 0 0 0 0 0 0 0 0
First Responder Network Authority 94 0 94 0 0 0 (94) 0
NTIA Programmatic and Oversight 7 0 7 0 4 0 (3) 0
NIST Public Safety Wireless Research 0 0 0 0 0 0 0 0
Next Generation E-911 (DOT) 0 0 0 0 0 0 0 0Next Generation E-911 (NTIA) 1 0 1 0 1 0 0 0
TOTAL BUDGET AUTHORITY / 102 0 102 0 5 0 (97) 0
Increase / Decrease
Highlights of Program Changes Base Increase / Decrease Positions Amount Positions Amount Public Safety Trust Fund 102 0 -97 0
The Act established FirstNet to develop a nationwide interoperable public safety broadband network in the 700 MHz band. This fund will be administered in support of programs included in the Act, including development of the public safety broadband network and research and development of standards, technologies, and applications to advance wireless public safety and communications.

116 FY 2019 Budget in Brief
National Telecommunications and Information Administration
Appropriation: State and Local Implementation Fund Comparison by Activity
2018 Estimate 2019 Base 2019 Estimate
REIMBURSABLE AUTHORITY Pos Amount Pos Amount Pos Amount Pos Amount
State and Local Implementation Program 4 1,769 4 0 4 0 0 0
TOTAL REIMBURSABLE AUTHORITY 4 1,769 4 0 0 0 0 0
FINANCING
(1,769) 0
Offsetting collections from:
Federal funds 0 0
Non-Federal sources 0
Subtotal, financing 0 (1,769) 0 0TOTAL /MANDATORY BUDGET AUTHORITY (offsetting collections) 4 0 0 0
Increase / Decrease
Unobligated balance, start of year (Reimbursable)
Appropriation: Network Construction Fund Comparison by Activity
2018 Estimate 2019 Base 2019 Estimate
REIMBURSABLE AUTHORITY Pos Amount Pos Amount Pos Amount Pos Amount
First Responder Network 93 20,000 93 20,000 0 250 (93) (19,750)
NTIA/Opt-out 4 3,878 4 3,878 3 1,070 (1) (2,808)
TOTAL REIMBURSABLE AUTHORITY 97 23,878 97 23,878 3 1,320 (94) (22,558)
FINANCING
5,539,480
Offsetting collections from:
Federal funds 50,875 0
Non-Federal sources 0
Subtotal, financing 0 50,875 0 0
TOTAL /MANDATORY BUDGET AUTHORITY (offsetting collections)
97 74,753 3 1,320
Increase / Decrease
Unobligated balance, start of year (Reimbursable)
Highlights of Program Changes
Base Increase / Decrease Positions Amount Positions Amount Network Construction Fund 97 23,878 -94 -22,558
Auction proceeds deposited into the PSTF were transferred to this account to cover FirstNet and NTIA costs related to building, operating, and maintaining the Public Safety Broadband Network.

National Telecommunications and Information Administration
FY 2019 Budget in Brief 117
Appropriation: First Responder Network Authority
Comparison by Activity
2018 Estimate 2019 Base 2019 Estimate
REIMBURSABLE AUTHORITY Pos Amount Pos Amount Pos Amount Pos Amount
First Responder Network 94 120,000 94 120,000 260 120,000 166 0
TOTAL REIMBURSABLE AUTHORITY 94 120,000 94 120,000 260 120,000 166 0
FINANCING
0 120,000
Offsetting collections from:
Federal funds 0 0
Non-Federal sources 240,000 120,000
Subtotal, financing 94 240,000 260 240,000
TOTAL /MANDATORY BUDGET AUTHORITY (offsetting collections)
94 120,000 260 120,000
Increase / Decrease
Unobligated balance, start of year (Reimbursable)
Highlights of Program Changes
Base Increase / Decrease Positions Amount Positions Amount First Responder Network Authority 94 120,000 166 0
The Middle Class Tax Relief and Job Creation Act of 2012 created the First Responder Network Authority to manage the construction, deployment, and operations of a nationwide, interoperable public safety broadband network (NPSBN) for use by public safety entities. FirstNet is an independent entity within the Department of Commerce's National Telecommunications and Information Administration and is overseen by a 15-member Board comprised of representatives from the first responder community, Federal Agencies and the private sector. Initial funding for this activity was provided by spectrum auction receipts. The Act authorizes FirstNet to charge and collect fees for use of network capability as well as use of the network and infrastructure to create a sustainable funding source for future operations. The amounts presented in the budget schedules for this account for FY 2018 reflect estimates of receipts from fees. Actual funding will be determined through FirstNet's National Public Safety Broadband Network contract award and the statutorily mandated state opt-out process. Funding will partially support several aspects of FirstNet's mission post NPRBN contract award. It will fund a portion of FirstNet's annual operating requirements and efforts to enhance public safety communications.

118 FY 2019 Budget in Brief
National Telecommunications and Information Administration
Performance Indicators The following table shows the NTIA performance indicators. Additional details appear at the end of the NTIA section of the Department of Commerce budget.
2017 2017 2018 2019 Target Actual Target Target
Percentage of NTIA positions substantially adopted or successful at international meeting
75% of NTIA’s positions
substantially adopted or
successful at international
meetings
95%
75% of NTIA’s positions
substantially adopted or
successful at international
meeting
60% of NTIA’s positions
substantially adopted or
successful at international
meeting
In coordination with DOC operating units, conduct outreach activities with government, industry and multistakeholder groups to identify and address privacy and global free flow of information issues
6 public forums and proceedings 7 6 public forums
and proceedings 4 public forums
and proceedings
Communities to which NTIA provides technical assistance 250 communities 400 145 communities 145 communities
Number of times research publications are downloaded annually 8,000 downloads 8,089 7,000 downloads 7,000 downloads
Successfully completed deliverables under reimbursable agreements (on time, on budget and accepted) 95% 99% 95% 95%
Create a pipeline of spectrum for mission-critical government services and commercial providers New New Meet 66% of
annual milestones Meet 66% of
annual milestones
Deploy, operate and maintain a nationwide public safety broadband network New New
Stagger deployment of FirstNet core network and nationwide functions. Initiate Band 14 RAN build- out for Opt-In states
Target public safety device
connections and Band 14 coverage
in Opt-In states
Identify up to 500 MHz of spectrum to support wireless broadband
Meet 66% of milestones
regarding the identification of
500 MHz for wireless
broadband
66% Retired Retired
Number of government and private test-bed facilities partnering with the Center for Advanced Communications 5 0 Retired Retired
Miles of broadband networks deployed (Infrastructure Projects) 116,000 miles 117,072 Retired Retired
Delivery by FirstNet and acceptance of each state’s network plans, or alternatively, FCC’s approval of a state’s plan required for the implementation of the National Public Safety Broadband Network (NPSBN)
Complete RFP process. Award NPSBN contract. Issue State Plans to 56 U.S. states
and territories
Completed RFP Process, Awarded Retired Retired

Summary Tables
FY 2019 Budget in Brief 119
Department of Commerce Funding 2017 2018 2019 IncreaseActual Annualized CR Estimate (Decrease)
BUDGET AUTHORITY Discretionary $9,224,215 $9,124,773 $9,772,979 $648,206 Mandatory 325,222 260,173 240,977 (19,196)TOTAL BUDGET AUTHORITY 9,549,437 9,384,946 10,013,956 629,010
OUTLAYS, NET Discretionary 9,028,610 9,369,238 10,606,000 1,236,762 Mandatory 1,297,000 328,000 1,492,000 1,164,000TOTAL OUTLAYS, NET 10,325,610 9,697,238 12,098,000 2,400,762

Summary Tables
120 FY 2019 Budget in Brief
Positions and Full-Time Equivalent Employment 2017 2018 2019 IncreaseActual Annualized CR Estimate (Decrease)
CIVILIAN / NOAA CORP POSITIONS
Civilian Direct Full-Time Permanent 21,991 22,896 22,190 (706) Other than Full-Time Permanent 3,813 4,753 88,505 83,752 Subtotal 25,804 27,649 110,695 83,046
Civilian Reimbursable Full-Time Permanent 13,820 13,984 14,105 121
NOAA Corp Full-Time Permanent 324 324 324 0
Working Capital Fund Full-Time Permanent 2,796 2,789 2,972 183 Other than Full-Time Permanent 3,914 3,745 5,304 1,559 Subtotal 6,710 6,534 8,276 1,742
Civilian - Mandatory
Full-Time Permanent 438 495 470 (25) Other than Full-Time Permanent 307 488 488 0 Subtotal 745 983 958 (25)
TOTAL POSITIONS 47,403 49,474 134,358 84,884
Civilian Direct Full-Time Permanent 21,310 21,753 21,104 (649) Other than Full-Time Permanent 1,504 2,469 11,152 8,683 Subtotal 22,814 24,222 32,256 8,034
Civilian Reimbursable Full-Time Permanent 13,387 13,694 13,828 134
NOAA Corp Full-Time Permanent 316 324 324 0
Working Capital Fund Full-Time Permanent 2,594 2,401 2,824 423 Other than Full-Time Permanent 1,539 1,556 1,976 420 Subtotal 4,133 3,957 4,800 843
Civilian - Mandatory Full-Time Permanent 435 486 461 (25) Other than Full-Time Permanent 121 232 232 0 Subtotal 556 718 693 (25)
TOTAL, FTE 41,206 42,915 51,901 8,986
CIVILIAN / NOAA CORP FULL-TIME EQUIVALENT EMPLOYMENT

Summary Tables
FY 2019 Budget in Brief 121
Budget Authority ― FY 2017, FY 2018 and FY 2019 2017 2018 2019 Change
DISCRETIONARY Actual Annualized CR Estimate 2018 - 2019Departmental Management $58,000 $57,606 $58,994 $1,388HCHB Renovation and Modernization 4,000 3,973 2,796 (1,177) Subtotal, Departmental Management 62,000 61,579 61,790 211Office of the Inspector General 38,626 38,364 40,888 2,524Economic Development Administration 276,000 264,194 (25,063) (289,257)Bureau of the Census 1,467,420 1,457,454 3,796,957 2,339,503Economic & Statistical Analysis 107,300 106,571 100,987 (5,584)International Trade Administration 483,000 479,720 445,147 (34,573)Bureau of Industry & Security 112,500 111,736 120,647 8,911Minority Business Development Agency 34,000 33,769 10,000 (23,769)National Oceanic & Atmospheric Administration 5,653,469 5,614,207 4,561,409 (1,052,798)United States Patent & Trademark Office (2,000) (26,000) (2,000) 24,000National Institute of Standards & Technology 959,900 951,396 628,571 (322,825)National Technical Information Service 0 0 0 0National Telecommunications & Information Administration 32,000 31,783 33,646 1,863
TOTAL, DISCRETIONARY 9,224,215 9,124,773 9,772,979 648,206
Offsetting receipts: NOAA: Fisheries finance, negative subsidy (189) (2,557) (8,109) (5,552)
MANDATORYDepartmental Management 3,188 3,500 3,500 0Bureau of the Census 20,000 20,000 20,000 0National Oceanic & Atmospheric Administration 267,765 237,993 217,477 (20,516)National Telecommunications & Information Admin. 35,649 0 0 0
SUBTOTAL, MANDATORY 326,602 261,493 240,977 (20,516)
Mandatory Sequestered
Bureau of the Census (1,380) (1,320) 0 1,320
TOTAL MANDATORY 325,222 260,173 240,977 (19,196)
TOTAL DEPARTMENT OF COMMERCE 9,549,437 9,384,946 10,013,956 629,010

Summary Tables
122 FY 2019 Budget in Brief
Outlays ― FY 2017, FY 2018 and FY 2019 2017 2018 2019 Change
DISCRETIONARY Actual Annualized CR Estimate 2018 - 2019Departmental Management $75,000 $75,000 $78,000 $3,000Office of the Inspector General 37,000 40,000 38,000 (2,000)Economic Development Administration 287,000 339,000 314,000 (25,000)Bureau of the Census 1,436,000 1,557,000 3,423,000 1,866,000Economic & Statistical Analysis 104,000 109,000 102,000 (7,000)International Trade Administration 468,000 434,000 448,000 14,000Bureau of Industry & Security 111,000 138,000 122,000 (16,000)Minority Business Development Agency 31,000 32,000 20,000 (12,000)National Oceanic & Atmospheric Administration 5,397,000 5,651,000 5,206,000 (445,000)United States Patent & Trademark Office 95,000 (27,000) 33,000 60,000National Institute of Standards & Technology 941,000 990,000 800,000 (190,000)National Technical Information Service 5,000 (8,000) (14,000) (6,000)National Telecommunications & Information Administration 42,000 42,000 36,000 (6,000)Offsetting receipts: NOAA: Fisheries finance, negative subsidy (390) (2,762) 2,762
TOTAL, DISCRETIONARY 9,028,610 9,369,238 10,606,000 1,236,762
MANDATORYDepartmental Management $4,000 $4,000 $4,000 $0Bureau of the Census 21,000 37,000 20,000 (17,000)National Oceanic & Atmospheric Administration 161,000 171,000 212,000 41,000National Institute of Standards & Technology 8,000 47,000 56,000 9,000National Telecommunications & Information Administration 1,143,000 107,000 1,239,000 1,132,000 Subtotal 1,337,000 366,000 1,531,000 1,165,000Offsetting receipts (40,000) (38,000) (39,000) (1,000)TOTAL MANDATORY 1,297,000 328,000 1,492,000 1,164,000
TOTAL DEPARTMENT OF COMMERCE 10,325,610 9,697,238 12,098,000 2,400,762

Summary Tables
FY 2019 Budget in Brief 123
Positions ― FY 2017, FY 2018 & FY 2019 2017 2018 2019 Change
Actual Annualized CR Estimate 2018 - 2019Departmental Management 954 941 941 0Office of the Inspector General 179 180 186 6Economic Development Administration 191 191 64 (127)Bureau of the Census 14,465 15,220 101,178 85,958Economic & Statistical Analysis 573 548 513 (35)International Trade Administration 1,880 1,880 1,752 (128)Bureau of Industry & Security 372 452 469 17Minority Business Development Agency 70 50 50 0National Oceanic & Atmospheric Administration 11,699 12,730 12,269 (461)United States Patent & Trademark Office 12,898 13,011 13,148 137National Institute of Standards & Technology 3,522 3,522 3,064 (458)National Technical Information Service 99 150 150 0National Telecommunications & Information Administration 501 599 574 (25)TOTAL1 47,403 49,474 134,358 84,884
1. Amounts include Full-Time Permanent and Other than Full-Time Permanent Positions
Full-Time Equivalent Employment - FY 2017, FY 2018 & FY 2019
2017 2018 2019 ChangeActual Annualized CR Estimate 2018 - 2019
Departmental Management 779 793 793 0Office of the Inspector General 164 179 183 4Economic Development Administration 184 184 58 (126)Bureau of the Census 9,361 9,953 19,836 9,883Economic & Statistical Analysis 523 523 501 (22)International Trade Administration 1,651 1,683 1,566 (117)Bureau of Industry & Security 369 434 451 17Minority Business Development Agency 46 50 50 0National Oceanic & Atmospheric Administration 11,640 12,152 11,832 (320)United States Patent & Trademark Office 12,507 12,735 12,884 149National Institute of Standards & Technology 3,382 3,480 3,023 (457)National Technical Information Service 99 150 150 0National Telecommunications & Information Administration 501 599 574 (25)TOTAL 41,206 42,915 51,901 8,986

Summary Tables
124 FY 2019 Budget in Brief
Historical Summary of Resources
0
4,000
8,000
12,000
16,000
20,000
09 10 11 12 13 14 15 16 17 18 19
Dol
lars
(in
mill
ions
)
Budget AuthorityFY 2009 - FY 2019
Actual BA President's Budget
30,000
35,000
40,000
45,000
50,000
09 10 11 12 13 14 15 16 17 18 19
PositionsFY 2009 - FY 2019
Actuals President's Budget
Note: Since the 2010 Decennial Census resulted in an extreme distortion in the number of Other than full-time permanent positions (OTPs) (i.e., over 1 million
were proposed for FY 2010 in the President’s Budget), all OTPs have been excluded from this chart.

Summary Tables
FY 2019 Budget in Brief 125
Bridge from FY 2018 and FY 2019 Appropriations to FY 2018 and FY 2019 Budget Authority
FY 2018 FY 2019 ChangeAnnualized CR Estimate 2018 - 2019
ANNUAL APPROPRIATIONS ACT $9,165,951 $9,806,480 $640,529
Transfers: Election Assistance Commission to NIST/STRS 1,391 1,499 108 DoJ Community Oriented Policing Services to NIST/STRS 4,470 0 (4,470) ITA Transfer 0 5,000 5,000 Net of Rescinded OIG transfers (39) 0 39EDA Rescission 0 (40,000) (40,000)NOAA Rescission (23,000) 0 23,000Temporarily Unavailable (USPTO) (24,000) 0 24,000
*TOTAL, DISCRETIONARY BUDGET AUTHORITY 9,124,773 9,772,979 648,205*Excludes NOAA Offsetting Receipts (2,557) (8,109) (5,552)
MANDATORYDepartmental Management 3,500 3,500 0Bureau of the Census State Children's Health Insurance Program 18,680 20,000 1,320National Oceanic & Atmospheric Administration Damage Assessment & Restoration Revolving Fund 5,986 5,968 (18) Fisheries Finance Program Account 7,997 0 (7,997) Environmental Improvement & Restoration Fund 4,858 3,813 (1,045) Sanctuaries Asset Forfeiture Fund 120 120 0 Transfer to Promote and Develop Fisheries from Dept. of Agriculture 154,664 154,868 204 NOAA Commissioned Officer Corp Retirement 30,102 30,075 (27) Limited Access System Administration Fund 13,732 13,988 256 Western Pacific Sustainable Fisheries 494 500 6 Fisheries Asset Forfeiture Fund 4,157 4,155 (2) North Pacific Observer Fund 3,870 3,990 120 Spectrum Pipeline 12,013National Telecommunications and Information Administration 0 0 0
TOTAL, MANDATORY BUDGET AUTHORITY 260,173 240,977 (7,183)
DEPARTMENT OF COMMERCE BUDGET AUTHORITY 9,384,946 10,013,956 629,009

Summary Tables
126 FY 2019 Budget in Brief
Comparison of FY 2019 Estimate with FY 2017 Actual and FY 2017 Annualized CR
Pos Amount Pos Amount Pos Amount Pos Amount
DEPARTMENTAL MANAGEMENT Salaries & Expenses 200 $58,000 193 $57,606 193 $58,994 0 $1,388
HCHB Renovation & Modernization 5 4,000 5 3,973 5 2,796 0 (1,177)
DM Working Capital Fund 672 0 665 0 665 0 0 0
Subtotal, DM 877 62,000 863 61,579 863 61,790 0 211
OFFICE OF THE INSPECTOR GENERAL 177 32,744 178 32,522 184 32,030 6 (492)
ECONOMIC DEVELOPMENT ADMINISTRATION Salaries & Expenses 190 39,000 190 38,735 64 14,937 (126) (23,798)
Economic Development Assistance Programs 0 237,000 0 225,458 0 0 0 (225,458)
Subtotal, EDA 190 276,000 190 264,193 64 14,937 (126) (249,256)
BUREAU OF THE CENSUS Current Surveys & Programs 1,375 270,000 1,427 268,166 1,387 249,125 (40) (19,041)
Periodic Censuses & Programs 3,567 1,200,000 3,319 1,191,868 3,823 3,551,388 504 2,359,520
CENSUS Working Capital Fund 1,424 0 1,424 0 1,607 0 183 0
Subtotal, Census 6,366 1,470,000 6,170 1,460,034 6,817 3,800,513 647 2,340,479
ECONOMIC & STATISTICAL ANALYSIS Salaries & Expenses 522 107,300 522 106,571 510 100,987 (12) (5,584)
INTERNATIONAL TRADE ADMINISTRATION Operations & Administration 1,831 483,000 1,831 479,720 1,703 440,147 (128) (39,573)
BUREAU OF INDUSTRY & SECURITY Operations & Administration 370 114,507 450 111,736 467 120,647 17 8,911
MINORITY BUSINESS DEVELOPMENT AGENCY Minority Business Development 58 32,000 50 33,769 50 10,000 0 (23,769)
NATIONAL OCEANIC & ATMOSPHERIC ADMIN. Operations, Research & Facilities 10,808 3,305,813 11,834 3,344,243 11,381 2,937,753 (453) (406,490)
Procurement, Acquisition & Construction 315 2,400,416 329 2,227,423 326 1,623,006 (3) (604,417)
Fishermen's Contingency Fund 350 0 348 0 349 0 1
Pacific Coastal Salmon Recovery 2 65,000 2 64,559 0 0 (2) (64,559)
Medicare Eligible Retiree Healthcare Fund 1,936 0 1,936 0 1,603 0 (333)
Subtotal, NOAA 11,125 5,773,515 12,165 5,638,509 11,707 4,562,711 (458) (1,075,798)
PATENT & TRADEMARK OFFICE Salaries & Expenses 12,436 0 13,011 0 13,148 0 137 0
NATIONAL INSTITUTE OF STANDARDS & TECHNOLOGY Scientific & Technical Research & Services 2,527 690,000 2,527 685,314 2,150 573,429 (377) (111,885
Industrial Technology Services 101 153,000 101 151,961 20 15,094 (81) (136,867)
Construction of Research Facilities 116 109,000 116 108,260 116 40,549 0 (67,711)
NIST Working Capital Fund 700 0 700 0 700 0 0 0
Subtotal, NIST 3,444 952,000 3,444 945,535 2,986 629,072 (458) (316,463)
NATIONAL TECHNICAL INFORMATION SERVI 150 0 150 0 150 0 0 0
NATIONAL TELECOMMUNICATIONS & INFO. ADMIN. Salaries & Expenses 136 32,000 143 31,783 143 33,646 0 1,863
TOTAL, DEPARTMENT OF COMMERCE 37,682 9,335,066 39,167 9,165,951 38,792 9,806,480 (375) 640,529
2017 Actual 2018 Annualized CR 2019 Estimate Increase / Decrease

Summary Tables
FY 2019 Budget in Brief 127
Summary of Requirements with Detail of Adjustments to Base and Built-In Changes
2019 Estimate
Positions Amount Positions Amount2018 Annualized CR 39,167 $9,165,9512018 Estimate (Fee Collections) 0 3,430,123Other Income / Recoveries (USPTO) 39,445USPTO Funding from operating reserve (20,067)
TransfersFrom Department of Agriculture (PDF) $154,868FY Transfer to DOC OIG (5,882)From PDF to ORF (24,035)Technical Adjustments to Base (NOAA) 23,697 Total, Transfers 148,648
One-time Adjustment Temporary Reduction (NOAA-P&DFP) (10,686)
Adjustments to Base
Adjustments Restoration of FY 2018 deobligations (NOAA) 30,500 Non-recurring costs (DM, USPTO) (19,526) Other Adjustment (NOAA) (3) (12,773) Appropriations Previously Unavailable (NOAA) 10,017 Total, Adjustments (3) 8,218
Financing: Recoveries of prior year obligations (Census, NOAA) (36,406) Total. Financing (36,406)
Other Changes FY 2018 Pay raise 21,429 FY 2019 Pay raise (NOAA only) 498 Full-year cost in 2019 of positions f inanced for part-year in FY 2018 0 9,317 Civil Service Retirement System (CSRS) (3,347) Federal Employees' Retirement System (FERS) 6,690 Thrift Savings Plan 2,080 Federal Insurance Contributions Act (FICA) - OASDI 3,085 Health insurance 11,027 Compensable Day 20,622 Employees' Compensation Fund (960) Travel: Domestic Per diem 559 Foreign Per diem (ITA) 63 Mileage (101) Rent payments to GSA 8,884 Postage 682 Printing and reproduction 2,636 NARA 42
Detailed Summary

Summary Tables
128 FY 2019 Budget in Brief
2019 Estimate
FTE Amount FTE Amount Other services: Working Capital Fund $4,022 Commerce Business System (3,381) General pricing level adjustment Transportation of things 372 Rental payments to others 742 Communications, utilities, and miscellaneous 1,821 Other services 32,909 Supplies 3,254 Equipment 6,982 Activities in support of licensing programs (BIS) 1,662 Post-Retirement Benefits to OPM (USPTO) 4,329 Other compensation adjustments (USPTO) 36,936 Overseas price increases (ITA) 472 Scientif ic journal subscriptions (NIST) 186 Electricity rate increase (NIST) 270 Natural gas rate decrease (NIST) (131) Grants (NOAA) 1,055
Subtotal, other changes 0 174,705
Total Adjustments to Base (3) 170,2142019 Base 39,164 12,899,931Program Changes (372) 561,060Total Requirements 38,792 13,460,991 Offsetting Fee Collections (ITA, USPTO) (3,416,366) Recoveries (NOAA) (40,500) Other Income (USPTO) (39,445) Funding to operating reserve (USPTO) (5,191)Transfers Transfer from Department of Homeland Security (ITA) (5,000) To/From OIG 6,858 Transfer from Department of Agriculture (NOAA) (154,868)
2019 Appropriation 38,792 $9,806,480
Detailed Summary

Summary Tables
FY 2019 Budget in Brief 129
Comparison by Bureau of Adjustments to Base, FY 2019 Estimate and Program Changes
Discretionary Accounts
BUREAU FTE Amount FTE Amount FTE Amount FTE Amount
Departmental Management 0 ($1,661) 863 $59,918 863 $61,790 0 $1,872
Office of the Inspector General 0 565 178 33,087 184 32,030 6 (1,057)
Economic Development Administration 0 (2,477) 190 261,716 64 14,937 (126) (246,779)
Bureau of the Census 0 (14,160) 6,170 1,443,294 6,817 3,796,957 647 2,353,663
Economic and Statistical Analysis 0 1,005 522 107,576 510 100,987 (12) (6,589)
International Trade and Investment Administration 0 5,700 1,831 485,420 1,703 445,147 (128) (40,273)
Bureau of Industry and Security 0 4,100 450 115,836 467 120,647 17 4,811
Minority Business Development Agency 0 (59) 50 33,710 50 10,000 0 (23,710)
National Oceanic & Atmospheric Admin. (3) 96,304 12,162 5,853,658 11,707 4,756,777 (455) (1,096,881)
Patent and Trademark Office 0 74,596 13,011 3,522,097 13,148 3,459,001 137 (63,096)
National Technical Information Service 0 0 150 0 150 0 0 0
National Inst. of Standards & Technology 0 5,622 3,444 951,157 2,986 629,072 (458) (322,085)
National Telecommunications and Info. Admin. 0 679 143 32,462 143 33,646 0 1,184
TOTAL REQUIREMENTS (3) 170,214 39,164 12,899,931 38,792 13,460,991 (372) 561,060
Offsetting Fee Collections (ITA, USPTO) 0 (3,416,366)
Other Income (USPTO) 0 (39,445)
Funding to operating reserve (USPTO) 0 (5,191)
Transfer from Department of Homeland Security (ITA) 0 (5,000)
To/From OIG 0 6,858
Transfer from Department of Agriculture (NOAA) 0 (154,868)
2019 APPROPRIATION 38,792 9,806,480
2019 Base 2019 Estimate Increase / DecreaseNet Adjustments To Base

Summary Tables
130 FY 2019 Budget in Brief
Budget Authority by Function 2017 2018 2019 Change
DISCRETIONARY APPROPRIATIONS Actual Annualized CR Estimate 2018 - 2019
050 DEFENSE-RELATED ACTIVITIES054 Defense-related activities
Bureau of Industry and Security $36,000 $35,756 $38,607 $2,852
300 NATURAL RESOURCES AND ENVIRONMENT306 Other natural resources
National Oceanic & Atmospheric Administration 5,783,633 5,744,371 4,716,278 (1,028,093)
370 COMMERCE AND HOUSING CREDIT376 Other advancement and regulation of Commerce
Departmental Management 62,000 61,579 61,790 211
Inspector General 38,626 38,364 40,888 2,524
Bureau of the Census 1,467,420 1,457,454 3,796,957 2,339,503
Economic and Statistical Analysis 107,300 106,571 100,987 (5,584)
International Trade Administration 483,000 479,720 445,147 (34,573)
Bureau of Industry and Security 76,500 75,980 82,040 6,059
Minority Business Development Agency 34,000 33,769 10,000 (23,769)
National Oceanic & Atmospheric Administration (130,164) (130,164) (154,869) (24,705)
Patent and Trademark Office (2,000) (26,000) (2,000) 24,000
National Institute of Standards & Technology 959,900 951,396 628,571 (322,825)
National Telecommunications & Information Administration 32,000 31,783 33,646 1,863
Subtotal, Commerce and Housing Credit 3,128,582 3,080,452 5,043,157 1,962,704
450 COMMUNITY AND REGIONAL DEVELOPMENT452 Area and regional development
Economic Development Administration 276,000 264,194 (25,063) (289,257)
TOTAL, DISCRETIONARY 9,224,215 9,124,773 9,772,979 648,206
MANDATORY APPROPRIATIONS300 NATURAL RESOURCES AND ENVIRONMENT302 Conservation and land management
National Oceanic & Atmospheric Administration 15,049 4,858 3,813 (1,045)
306 Other natural resources
National Oceanic & Atmospheric Administration 70,494 61,833 50,031 (11,802)
Subtotal, Natural Resources and Environment 85,543 66,691 53,844 (12,847)
370 COMMERCE AND HOUSING CREDIT376 Other advancement & regulation of Commerce
Departmental Management 3,188 3,500 3,500 0
Bureau of the Census 18,620 18,680 20,000 1,320
National Oceanic & Atmospheric Administration 182,222 171,302 163,633 (7,669)
National Telecommunications & Information Administration 35,649 0 0 0
Subtotal, Commerce and Housing Credit 239,679 193,482 187,133 (6,349)
TOTAL, MANDATORY 325,222 260,173 240,977 (19,196)
TOTAL, DEPARTMENT OF COMMERCE 9,549,437 9,384,946 10,013,956 629,010

Summary Tables
FY 2019 Budget in Brief 131
Authorizing Legislation Required for 2019
FY 2019APPROPRIATION AND ACTIVITY RequestBureau of the CensusSalaries and Expenses State Childrens Health Insurance Program, 42 USC 1397ii(b)(1)(4) ,expires 9/30/15 $20,000
Economic Development Administration
Salaries and Expenses 14,900Proposed language changes: For necessary expenses of an orderly closedown of the Economic Development Administration, including, but limited to, severance costs for personnel and on-going administration, oversight and monitoring of grants and loans previously awarded by the Economic Development Administration.
Economic Development Assistance Programs (Public Works, Partnership Planning, Technical Assistance, Research and Evaluation, and Economic Adjustment Assistance Programs)
0
Economic Development Assistance Programs (Trade Adjustment Assistance Program) 0
Economic Development Assistance Programs (Investing in Manufacturing Communities Fund and Regional Export Challenge Programs)
0
Proposed language changes: For grants for economic development assistance as provided by the Public Works and Economic Development Act of 1965, for trade adjustment assistance, and for grants authorized by section 27 of the Stevenson-Wydler Technology Innovation Act of 1980 (15 U.S.C. 3722), $222,000,000 to remain available until expended and may hereafter be used for the orderly closedown of the Economic Development Administration, [of which $15,000,000 shall be for grants under such section 27] including but not limited to, on-going administration, oversight and monitoring of grants and loans previously awarded by the Economic Development Administration, whether expended by the Economic Development Administration or a successor operating unit within the Department of Commerce. Such funds will be available to such successor operating unit in addition to any other amounts that may be appropriated for the necessary expenses of such operating unit as provided by law.
Subtotal, EDA
Bureau of Industry and Security
Export Administration Act of 1979, P.L. 106-508, expired 8/20/01 120,647
International Trade Administration
Export Promotion, P.L. 103-392, expired 9/30/96 314,042
National Institute of Standards & Technology
National Institute of Standards & Technology Authorization Act of 2010, P.L. 111-358, expired 9/30/2013 Scientific & Technical Research & Services 571,930 Industrial Technology Services 15,094 Construction of Research Facilities 40,549Subtotal, NIST 627,573

Summary Tables
132 FY 2019 Budget in Brief
FY 2019APPROPRIATION AND ACTIVITY Request
National Oceanic and Atmospheric AdministrationOperations, Research and FacilitiesNational Ocean Service Coral Reef Conservation Act, P.L.106-562, expired 9/30/04 $26,033 Hydrographic Services Improvement Act, P.L.107-372, expired 9/30/07 199,895 Coastal Zone Management Act, P.L. 104-150, expired 9/30/99 40,489 Marine Protection, Research, Preservation & Sanctuaries Act Title II & III, P.L.106-513, expired 49,739 9/30/05
Endangered Species Act Amendments of 1988, P.L. 100-478, expired 9/30/92 $145,177
Marine Mammal Protection Act, P.L. 103-238, expired 9/30/99 39,474
NOAA Marine Fisheries Program Authorization Act, P.L. 104-297, expired 9/30/00 120,420
Interjurisdictional Fisheries Act, P.L. 109-479, expired 9/30/12 767
Magnuson-Stevens Fishery Conservation and Management Act , P.L. 109-479, expires 9/30/13 511,397
Estuary Restoration Act, P.L.110-114, expires 9/30/2012 500
Oceanic and Atmospheric Research National Sea College Program, P.L.107-299, expires 9/30/08 0
Ocean Exploration 33 USC 3406; P.L. 111-11, expires 9/30/15 19,561
Federal Ocean Acidification Research and Monitoring Act of 2009 33 USC 3708; P.L. 111-11, expired 9/30/2012 National Integrated Drought Information System Act of 2006 15 USC 313d note; P.L. 109-430, sec. 4, expired 9/30/2012
Procurement, Acquisition and ConstructionNational Ocean Service Marine Protection, Research, Preservation & Sanctuaries Act Title II & III, P.L.106-513, expired 1,541
9/30/05 Coastal Zone Management Act, P.L. 104-150, expired 9/30/99 0Subtotal, NOAA 1,176,506National Telecommunications and Information AdministrationSalaries and Expenses 33,646Telecommunications Authorization Act of 1992, P.L. 102-538, expired 9/30/93TOTAL, AUTHORIZATION REQUIRED 2,307,314PROGRAMS AUTHORIZED 7,499,166TOTAL, DEPARTMENT OF COMMERCE APPROPRIATIONS 9,806,480
8,013
13,500