the descartes systems roup nc · “believe,” “plan,” “expect,” “anticipate,”...
TRANSCRIPT

THE DESCARTES SYSTEMS GROUP INC. ANNUAL REPORT
US GAAP FINANCIAL RESULTS FOR 2019 FISCAL YEAR

TABLE OF CONTENTS
Management’s Discussion and Analysis of Financial Condition and Results of Operations ............... 2
Overview............................................................................................................................. 4
Consolidated Operations ....................................................................................................... 8
Quarterly Operating Results ................................................................................................. 15
Liquidity and Capital Resources ............................................................................................ 18
Commitments, Contingencies and Guarantees ....................................................................... 21
Outstanding Share Data ...................................................................................................... 22
Application of Critical Accounting Policies .............................................................................. 23
Change In / Initial Adoption of Accounting Policies ................................................................. 27
Controls and Procedures ..................................................................................................... 29
Trends / Business Outlook ................................................................................................... 30
Certain Factors That May Affect Future Results ...................................................................... 33
Management’s Report on Financial Statements and Internal Control Over Financial Reporting ...... 45
Consolidated Balance Sheets ............................................................................................... 50
Consolidated Statements of Operations ................................................................................. 51
Consolidated Statements of Comprehensive Income ............................................................... 52
Consolidated Statements of Shareholders’ Equity ................................................................... 53
Consolidated Statements of Cash Flows ................................................................................ 54
Notes to Consolidated Financial Statements ........................................................................... 55
Corporate Information ........................................................................................................ 89

2
MANAGEMENT’S DISCUSSION AND ANALYSIS OF
FINANCIAL CONDITION AND RESULTS OF
OPERATIONS Our Management’s Discussion and Analysis of Financial Condition and Results of Operations (“MD&A”)
contains references to Descartes using the words “we,” “us,” “our” and similar words and the reader is
referred to using the words “you,” “your” and similar words. This MD&A also refers to our fiscal years. Our fiscal year commences on February 1st of each year and
ends on January 31st of the following year. Our fiscal year that we’re reporting on in this MD&A, which
ended on January 31, 2019, is referred to as the “current fiscal year,” “fiscal 2019,” “2019” or using similar
words. Our previous fiscal year, which ended on January 31, 2018, is referred to as the “previous fiscal
year,” “fiscal 2018,” “2018” or using similar words. Other fiscal years are referenced by the applicable
year during which the fiscal year ends. For example, 2020 refers to the annual period ending January 31,
2020 and the “fourth quarter of 2020” refers to the quarter ending January 31, 2020. This MD&A, which is prepared as of March 6, 2019, covers our year ended January 31, 2019, as compared
to years ended January 31, 2018 and 2017. You should read the MD&A in conjunction with our audited
consolidated financial statements for 2019 that appear elsewhere in this Annual Report to Shareholders.
We prepare and file our consolidated financial statements and MD&A in United States (“US”) dollars and
in accordance with US generally accepted accounting principles (“GAAP”). All dollar amounts we use in the
MD&A are in US currency, unless we indicate otherwise.
We have prepared the MD&A with reference to the Form 51-102F1 MD&A disclosure requirements
established under National Instrument 51-102 “Continuous Disclosure Obligations” (“NI 51-102”) of the
Canadian Securities Administrators.
Additional information about us, including copies of our continuous disclosure materials such as our annual
information form, is available on our website at http://www.descartes.com, through the EDGAR website
at http://www.sec.gov or through the SEDAR website at http://www.sedar.com.
Certain statements made in this Annual Report to Shareholders, constitute forward-looking information
for the purposes of applicable securities laws (“forward-looking statements”), including, but not limited
to: statements in the “Trends / Business Outlook” section and statements regarding our expectations
concerning future revenues and earnings, including potential variances from period to period; our
expectations regarding the cyclical nature of our business; mix of revenues and potential variances from
period to period; our plans to focus on generating services revenues yet to continue to allow customers
to elect to license technology in lieu of subscribing to services; our expectations on losses of revenues and
customers; our baseline calibration; our ability to keep our operating expenses at a level below our
baseline revenues; our future business plans and business planning process; allocation of purchase price
for completed acquisitions; our expectations regarding future restructuring charges and cost-reduction
activities; expenses, including amortization of intangible assets and stock-based compensation; goodwill
impairment tests and the possibility of future impairment adjustments; capital expenditures; acquisition-
related costs; our liability with respect to various claims and suits arising in the ordinary course; any
commitments referred to in the “Commitments, Contingencies and Guarantees” section of this MD&A; our
intention to actively explore future business combinations and other strategic transactions; our liability
under indemnification obligations; our reinvestment of earnings of subsidiaries back into such subsidiaries;
our dividend policy; the sufficiency of capital to meet working capital, capital expenditure, debt repayment
requirements and our anticipated growth strategy; our ability to raise capital; our adoption of certain
accounting standards; and other matters related to the foregoing. When used in this document, the words
“believe,” “plan,” “expect,” “anticipate,” “intend,” “continue,” “may,” “will,” “should” or the negative of
such terms and similar expressions are intended to identify forward-looking statements. These forward-looking statements are subject to risks and uncertainties and are based on assumptions that may cause
future results to differ materially from those expected. The material assumptions made in making these
forward-looking statements include the following: global shipment volumes continuing to increase at levels
3
consistent with the average growth rates of the global economy; countries continuing to implement and
enforce existing and additional customs and security regulations relating to the provision of electronic
information for imports and exports; countries continuing to implement and enforce existing and additional
trade restrictions and sanctioned party lists with respect to doing business with certain countries,
organizations, entities and individuals; our continued operation of a secure and reliable business network;
the continued availability of the data and content that is utilized in the delivery of services made available
over our network; the stability of general economic and market conditions, currency exchange rates, and
interest rates; equity and debt markets continuing to provide us with access to capital; our continued
ability to identify and source attractive and executable business combination opportunities; our ability to
develop solutions that keep pace with the continuing changes in technology, and our continued compliance
with third party intellectual property rights. While management believes these assumptions to be
reasonable under the circumstances, they may prove to be inaccurate. Such forward-looking statements
also involve known and unknown risks, uncertainties and other factors that may cause our actual results,
performance or achievements of, or developments in our business or industry, to differ materially from
the anticipated results, performance or achievements or developments expressed or implied by such
forward-looking statements. Such factors include, but are not limited to, the factors discussed under the
heading “Certain Factors That May Affect Future Results” in this MD&A and in other documents filed with
the Securities and Exchange Commission, the Ontario Securities Commission and other securities
commissions across Canada from time to time. If any of such risks actually occur, they could materially
adversely affect our business, financial condition or results of operations. In that case, the trading price
of our common shares could decline, perhaps materially. Readers are cautioned not to place undue reliance
upon any such forward-looking statements, which speak only as of the date made. Forward-looking
statements are provided for the purpose of providing information about management’s current
expectations and plans relating to the future. Readers are cautioned that such information may not be
appropriate for other purposes. Except as required by applicable law, we do not undertake or accept any
obligation or undertaking to release publicly any updates or revisions to any forward-looking statements
to reflect any change in our expectations or any change in events, conditions, assumptions or
circumstances on which any such statements are based.

4
OVERVIEW
We use technology and networks to simplify
complex business processes. We’re primarily
focused on logistics and supply chain management
business processes. Our solutions are
predominantly cloud-based and are focused on
improving the productivity, performance and
security of logistics-intensive businesses.
Customers use our modular, software-as-a-service
(“SaaS”) and data solutions to route, schedule,
track and measure delivery resources; plan,
allocate and execute shipments; rate, audit and
pay transportation invoices; access and analyze
global trade data; research and perform trade tariff
and duty calculations; file customs and security
documents for imports and exports; and complete
numerous other logistics processes by participating
in a large, collaborative multi-modal logistics
community. Our pricing model provides our
customers with flexibility in purchasing our
solutions either on a subscription, transactional or
perpetual license basis. Our primary focus is on
serving transportation providers (air, ocean and
truck modes), logistics service providers (including
third-party logistics providers, freight forwarders
and customs brokers) and distribution-intensive
companies for which logistics is either a key or a
defining part of their own product or service
offering, or for which our solutions can provide an
opportunity to reduce costs, improve service levels,
or support growth by optimizing the use of assets
and information.
The Market
Logistics is the management of the flow of
resources between a point of origin and a point of
destination – processes that move items (such as
goods, people, information) from point A to point
B. Supply chain management is broader than
logistics and includes the sourcing, procurement,
conversion and storage of resources for
consumption by an enterprise. Logistics and supply
chain management have been evolving over the
past several years as companies are increasingly
seeking automation and real-time control of their
supply chain activities. We believe companies are
looking for integrated solutions for managing
inventory in transit, conveyance units, people, data
and business documents.
We believe logistics-intensive organizations are
seeking to reduce operating costs, differentiate
themselves, improve margins, and better serve
customers. Global trade and transportation
processes are often manual and complex to
manage. This is a consequence of the growing
number of business partners participating in
companies’ global supply chains and a lack of
standardized business processes.
Additionally, global sourcing, logistics outsourcing,
imposition of additional customs and regulatory
requirements and the increased rate of change in
day-to-day business requirements are adding to
the overall complexities that companies face in
planning and executing in their supply chains.
Whether a shipment is delayed at the border, a
customer changes an order or a breakdown occurs
on the road, there are increasingly more issues that
can significantly impact the execution of fulfillment
schedules and associated costs.
The rise of e-commerce has heightened these
challenges for many suppliers with end-customers
increasingly demanding narrower order-to-
fulfillment periods, lower prices and greater
flexibility in scheduling and rescheduling deliveries.
End customers also want real-time updates on
delivery status, adding considerable burden to
supply chain management as process efficiency is
balanced with affordable service.
In this market, the movement and sharing of data
between parties involved in the logistics process is
equally important to the physical movement of
goods. Manual, fragmented and distributed
logistics solutions are often proving inadequate to
address the needs of operators. Connecting
manufacturers and suppliers to carriers on an
individual, one-off basis is too costly, complex and
risky for organizations dealing with many trading
partners. Further, many of these solutions do not
provide the flexibility required to efficiently
accommodate varied processes for organizations to
remain competitive. We believe this presents an
opportunity for logistics technology providers to
unite this highly fragmented community and help
customers improve efficiencies in their operations.
As the market continues to change, we’ve been
evolving to meet our customers’ needs. While the
rate of adoption of newer logistics and supply chain
management technologies is increasing, a large
number of organizations still have manual business
processes. We have been educating our prospects and customers on the value of connecting to
trading partners through our Global Logistics
Network (“GLN”) and automating, as well as
5
standardizing, multi-party business processes. We
believe that our target customers are increasingly
looking for a single source, neutral, network-based
solution provider who can help them manage the
end-to-end shipment – from researching global
trade information, to the booking of a shipment, to
the tracking of that shipment as it moves, to the
regulatory compliance filings to be made during the
move and, finally, to the settlement and audit of
the invoice.
Additionally, regulatory initiatives mandating
electronic filing of shipment information with
customs authorities require companies to automate
aspects of their shipping processes to remain
compliant and competitive. Our customs
compliance technology helps shippers,
transportation providers, freight forwarders and
other logistics intermediaries to securely and
electronically file shipment and tariff/duty
information with customs authorities and self-audit
their own efforts. Our technology also helps
carriers and freight forwarders efficiently
coordinate with customs brokers and agencies to
expedite cross-border shipments. While many
compliance initiatives started in the US, compliance
has now become a global issue with significantly
more international shipments crossing several
borders on the way to their final destinations.
Increasingly, data and content have become
central to supply chain planning and execution.
Complex international supply chains are affected
by logistics service provider performance, capacity,
and productivity, as well as regulatory frameworks
such as free trade agreements. We believe our
Global Trade Data, Trade Regulations, Free-Trade-
Agreement, and duty rate and calculation solutions
help customers improve their sourcing, landed
cost, and transportation lane and provider selection
processes.
Solutions
Descartes’ Logistics Technology Platform unites a
growing global community of logistics-focused
parties, allowing them to transact business while
leveraging a broad array of applications designed
to help logistics-intensive businesses thrive.
The Logistics Technology Platform fuses our GLN,
an extensive logistics network covering multiple
transportation modes, with a broad array of
modular, interoperable web and wireless logistics
management solutions. Designed to help
accelerate time-to-value and increase productivity
and performance for businesses of all sizes, the
Logistics Technology Platform leverages the GLN’s
multimodal logistics community to enable
companies to quickly and cost-effectively connect
and collaborate.
Descartes’ GLN, the underlying foundation of the
Logistics Technology Platform, manages the flow of
data and documents that track and control
inventory, assets and people in motion. Designed
expressly for logistics operations, it is native to the
particularities of different transportation modes
and country borders. As a state-of-the-art
messaging network with wireless capabilities, the
GLN helps manage business processes in real-time
and in-motion. Its capabilities go beyond logistics,
supporting common commercial transactions,
regulatory compliance documents, and customer
specific needs.
The GLN extends its reach using interconnect
agreements with other general and logistics-
specific networks, to offer companies access to a
wide array of trading partners. With the flexibility
to connect and collaborate in unique ways,
companies can effectively route or transform data
to and from partners and deploy additional
Descartes solutions on the GLN. The GLN allows
“low tech” partners to act and respond with “high
tech” capabilities and connect to the transient
partners that exist in many logistics operations.
This inherent adaptability creates opportunities to
develop logistics business processes that can help
customers differentiate themselves from their
competitors.
Descartes’ Logistics Application Suite offers a wide
array of modular, cloud-based, interoperable web
and wireless logistics management applications.
These solutions embody Descartes’ deep domain
expertise, not merely “check box” functionality.
These solutions deliver value for a broad range of
logistics-intensive organizations, whether they
purchase transportation, run their own fleet,
operate globally or locally, or work across air,
ocean or ground transportation. Descartes’
comprehensive suite of solutions includes:
• Routing, Mobile and Telematics;
• Transportation Management and e-
commerce enablement;
• Customs & Regulatory Compliance;
• Trade Data;
• Global Logistics Network Services; and
• Broker & Forwarder Enterprise Systems.
The Descartes applications forming part of the
Logistics Technology Platform are modular and
6
interoperable to allow organizations the flexibility
to deploy them quickly within an existing portfolio
of solutions. Implementation is streamlined
because these solutions use web-native or wireless
user interfaces and are pre-integrated with the
GLN. With interoperable and multi-party solutions,
Descartes’ solutions are designed to deliver
functionality that can enhance a logistics
operation’s performance and productivity both
within the organization and across a complex
network of partners.
Descartes’ expanding global trade content offering
unites systems and people with trade information
to enable organizations to work smarter by making
more informed supply chain and logistics decisions.
Our content solutions can help customers: research
and analyze global trade movements, regulations
and trends; reduce the risk of transacting with
denied parties; increase trade compliance rates;
optimize sourcing, procurement, and business
development strategies; and minimize duty spend.
Descartes’ GLN community members enjoy
extended command of operations and accelerated
time-to-value relative to many alternative logistics
solutions. Given the inter-enterprise nature of
logistics, quickly gaining access to partners is
paramount. For this reason, Descartes has focused
on growing a community that strategically attracts
and retains relevant logistics parties. Upon joining
the GLN community, many companies find that a
number of their trading partners are already
members with an existing connection to the GLN.
This helps to minimize the time required to
integrate Descartes’ logistics management
applications and to begin realizing results.
Descartes is committed to continuing to expand
community membership. Companies that join the
GLN community or extend their participation find a
single place where their entire logistics network can
exist regardless of the range of transportation
modes, the number of trading partners or the
variety of regulatory agencies.
Sales and Distribution
Our sales efforts are primarily directed towards two
specific customer markets: (a) transportation
companies and logistics service providers; and (b)
manufacturers, retailers, distributors and mobile
business service providers. Our sales staff is
regionally based and trained to sell across our
solutions to specific customer markets. In North America and Europe, we promote our products
primarily through direct sales efforts aimed at
existing and potential users of our products. In the
Asia Pacific, Indian subcontinent, South America
and African regions, we focus on making our
channel partners successful. Channel partners for
our other international operations include
distributors, alliance partners and value-added
resellers.
United by Design
Descartes’ ‘United By Design’ strategic alliance
program is intended to ensure complementary
hardware, software and network offerings are
interoperable with Descartes’ solutions and work
together seamlessly to solve multi-party business
problems.
‘United By Design’ is intended to create a global
ecosystem of logistics-intensive organizations
working together to standardize and automate
business processes and manage resources in
motion. The program centers on Descartes’ Open
Standard Collaborative Interfaces, which provide a
wide variety of connectivity mechanisms to
integrate a broad spectrum of applications and
services.
Descartes has partnering relationships with
multiple parties across the following three
categories:
• Technology Partners – Complementary
hardware, software, network, and
embedded technology providers that
extend the functional breadth of Descartes’
solution capabilities;
• Consulting Partners - Large system
integrators and enterprise resource
planning system vendors through to
vertically specialized or niche consulting
organizations that provide domain
expertise and/or implementation services
for Descartes’ solutions; and
• Channel Partners (Value-Added Resellers) –
Organizations that market, sell, implement
and support Descartes' solutions to extend
access and expand market share into
territories and markets where Descartes
might not have a focused direct sales
presence.
Marketing
Our marketing efforts are focused on growing
demand for our solutions and establishing
Descartes as a thought leader and innovator across
the markets we serve. Marketing programs are delivered through integrated initiatives designed to
reach our target customer and prospect groups.
These programs include digital and online

7
marketing, trade shows and user group events,
partner-focused campaigns, proactive media
relations, and direct corporate marketing efforts.
Fiscal 2019 Highlights
On February 2, 2018, Descartes acquired Aljex
Software, Inc. (“Aljex”), a cloud-based provider of
back-office transportation management solutions
for freight brokers and transportation providers.
US-based Aljex helps customers automate
business processes and create electronic
documents critical for executing transportation
moves through the lifecycle of a shipment. The
purchase price for the acquisition was
approximately $32.4 million, net of cash acquired,
which was funded from drawing on our existing
credit facility.
On June 6, 2018, we filed a final short-form base
shelf prospectus (the “Base Shelf Prospectus”),
allowing us to offer and issue the following
securities: (i) common shares; (ii) preferred
shares; (iii) senior or subordinated unsecured debt
securities; (iv) subscription receipts; (v) warrants;
and (vi) securities comprised of more than one of
the aforementioned common shares, preferred
shares, debt securities, subscription receipts and/
or warrants offered together as a unit. These
securities may be offered separately or together, in
separate series, in amounts, at prices and on terms
to be set forth in one or more shelf prospectus
supplements. The aggregate initial offering price of
securities that may be sold by us (or certain of our
current or future shareholders) pursuant to the
Base Shelf Prospectus during the 25-month period
that the Base Shelf Prospectus, including any
amendments thereto, remains valid is limited to an
aggregate of $750 million.
On June 22, 2018, Descartes acquired certain
assets of Velocity Mail, LLC (“Velocity Mail”), an
electronic transportation network that provides
global air carriers with mail and parcel shipment
scanning and tracking solutions. Using US-based
Velocity Mail’s network, global air carriers leverage
mobile devices to accurately track shipments and
deliveries in real-time. The purchase price for the
acquisition was approximately $26.1 million, net of
cash acquired, which was funded from drawing on
Descartes’ existing credit facility.
On August 21, 2018, Descartes acquired PinPoint
GPS Solutions Inc. (“PinPoint”), a provider of fleet tracking and mobile workforce solutions. Canada-
based PinPoint helps customers collect real-time
location information on trucks and mobile workers
using technology, including Geotab (telematics)
and SkyBitz (trailer tracking). The purchase price
for the acquisition was approximately $11.0 million
(CAD $14.4 million), net of cash acquired, which
was funded from a combination of drawing on
Descartes’ existing credit facility and issuing to the
sellers less than 0.1 million Descartes common
shares from treasury. Additional contingent
consideration of up to $2.3 million (CAD $3.0
million) in cash is payable if certain revenue
performance targets are met by PinPoint in the two
years following the acquisition. The fair value of the
contingent consideration was valued at $0.7 million
at the acquisition date.
On January 25, 2019, we amended and increased
our existing $150.0 million senior secured
revolving credit facility. The newly amended and
increased facility is now a $350.0 million revolving
operating credit facility to be available for general
corporate purposes, including the financing of
ongoing working capital needs and acquisitions.
With the approval of the lenders, the credit facility
can be expanded to a total of $500.0 million. The
credit facility has a five-year maturity with no fixed
repayment dates prior to the end of the five-year
term ending January 2024. Borrowings under the
credit facility are secured by a first charge over
substantially all of Descartes’ assets. The credit
facility contains certain customary representations,
warranties and guarantees, and covenants.
Events Subsequent to Fiscal 2019
On February 12, 2019, Descartes acquired
substantially all of the assets of the businesses run
by the Management Systems Resources Inc. group
of companies (collectively, “Visual Compliance”), a
provider of software solutions and services to
automate customs, trade and fiscal compliance
processes including denied and restricted party
screening processes and export licensing. The
purchase price for the acquisition was
approximately $250 million at February 12, 2019
(approximate CAD $330 million purchase price),
net of cash acquired, which was funded from a
combination of drawing on Descartes’ existing
credit facility and issuing to the sellers 0.3 million
Descartes common shares from treasury.

8
CONSOLIDATED OPERATIONS
The following table shows, for the fiscal years indicated, our results of operations in millions of dollars
(except per share and weighted average share amounts):
Year ended January 31, January 31, January 31,
2019 2018 2017
Total revenues 275.2 237.4 203.8
Cost of revenues 75.0 63.7 56.1
Gross margin 200.2 173.7 147.7
Operating expenses 114.8 100.3 83.6
Other charges 3.8 4.0 3.5
Amortization of intangible assets 40.2 33.5 30.0
Income from operations 41.4 35.9 30.6
Investment income 0.2 0.2 1.4
Interest expense (2.1) (1.3) (0.6)
Income before income taxes 39.5 34.8 31.4
Income tax expense
Current 6.0 6.6 4.0
Deferred 2.2 1.3 3.6
Net income 31.3 26.9 23.8
EARNINGS PER SHARE
BASIC 0.41 0.35 0.31
DILUTED 0.40 0.35 0.31
WEIGHTED AVERAGE SHARES OUTSTANDING (thousands)
BASIC 76,832 76,324 75,800
DILUTED 77,791 77,112 76,515
OTHER PERTINENT INFORMATION
Total assets 653.3 624.9 500.5
Non-current financial liabilities 25.5 37.0 -
Total revenues consist of license revenues, services revenues and professional services and
other revenues. License revenues are derived from licenses granted to our customers to use our software
products. Services revenues are comprised of ongoing transactional and/or subscription fees for use of
our services and products by our customers and maintenance, which include revenues associated with
maintenance and support of our services and products. Professional services and other revenues are
comprised of professional services revenues from consulting, implementation and training services related
to our services and products, hardware revenues and other revenues.

9
The following table provides additional analysis of our revenues by type (in millions of dollars and as a
percentage of total revenues) generated over each of the periods indicated:
Year ended January 31, January 31, January 31,
2019 2018 2017
License revenues 5.9 8.1 6.9
Percentage of total revenues 2% 3% 3%
Services revenues 241.5 204.4 173.0
Percentage of total revenues 88% 86% 85%
Professional services and other 27.8 24.9 23.9
Percentage of total revenues 10% 11% 12%
Total revenues 275.2 237.4 203.8
Our license revenues were $5.9 million, $8.1 million and $6.9 million in 2019, 2018 and 2017,
respectively, representing 2%, 3% and 3% of total revenues in 2019, 2018 and 2017, respectively. While
our sales focus has been on generating services revenues in our SaaS business model, we continue to see
a market for licensing the products in our omni-channel retailing and home delivery logistics solutions.
The amount of license revenues in a period is dependent on our customers’ preference to license our
solutions instead of purchasing our solutions as a service and we anticipate variances from period to
period.
Our services revenues were $241.5 million, $204.4 million and $173.0 million in 2019, 2018 and 2017,
respectively, representing 88%, 86% and 85% of total revenues in 2019, 2018 and 2017, respectively.
The increase in 2019 compared to 2018 was primarily due to the inclusion of a full period of services
revenues from the fiscal 2018 acquisitions of Z-Firm LLC (“ShipRush”), PCSTrac Inc. (“PCSTrac”) and
MacroPoint LLC (“MacroPoint”) as well as additional services revenues from the fiscal 2019 acquisitions of
Aljex, Velocity Mail and PinPoint. Services revenues in 2019 were also positively impacted by the growth
in sales of transactional and subscription products. Service revenues in 2019 as compared to 2018 were
also positively impacted by the strengthening of the euro and British pound sterling compared to the US
dollar.
The increase in services revenues in 2018 compared to 2017 was primarily due to the inclusion of a full
period of services revenues from the fiscal 2017 acquisitions of pixi* Software GmbH (“Pixi”), Appterra
LLC (“Appterra”), 4Solutions Information Technology Pty Ltd. (“4Solutions”) and Datamyne Inc.
(“Datamyne”) as well as additional services revenues from the fiscal 2018 acquisitions of ShipRush,
PCSTrac and MacroPoint. Services revenues in 2018 were also positively impacted by the growth in
revenue from new and existing customers in both transactional and subscription products. Services
revenues in 2018 as compared to 2017 were also positively impacted by the strengthening of the euro
and Canadian dollar compared to the US dollar. This positive impact was partially offset by the weakening
of the British pound sterling compared to the US dollar.
Our professional services and other revenues were $27.8 million, $24.9 million and $23.9 million in
2019, 2018 and 2017, respectively, representing 10%, 11% and 12% of total revenues in 2019, 2018
and 2017, respectively. The increase in professional services revenue in 2019 compared to 2018 was
primarily due to increased professional services activity in the United States and Europe as well as the

10
fiscal 2019 acquisition of Aljex. Professional services and other revenues in 2019 compared to 2018 were
also positively impacted by the strengthening of the euro compared to the US dollar.
The increase in professional services revenues in 2018 compared to 2017 was primarily due to the inclusion
of a full period of professional services revenues from the fiscal 2017 acquisitions of Pixi, Appterra and
Datamyne.
We operate in one business segment providing logistics technology solutions. The following table provides
additional analysis of our revenues by geographic location of customer (in millions of dollars and as a
percentage of total revenues):
Year Ended January 31, January 31, January 31,
2019 2018 2017
United States 165.1 133.3 106.7
Percentage of total revenues 60% 56% 52%
Europe, Middle-East and Africa (“EMEA”) 80.1 77.6 75.2
Percentage of total revenues 29% 33% 37%
Canada 18.2 15.6 13.2
Percentage of total revenues 7% 6% 7%
Asia Pacific 11.8 10.9 8.7
Percentage of total revenues 4% 5% 4%
Total revenues 275.2 237.4 203.8
Revenues from the United States were $165.1 million, $133.3 million and $106.7 million in 2019, 2018
and 2017, respectively. The increase in 2019 compared to 2018 was primarily a result of the inclusion of
a full period of revenues from the 2018 acquisitions of ShipRush, PCSTrac and MacroPoint as well as a
partial period of revenues from the 2019 acquisitions of Aljex and Velocity Mail. Revenues in the United
States in 2019 were also positively impacted by the growth in sales of transactional and subscription
products to both new and existing customers in the United States.
The increase in 2018 compared to 2017 was primarily a result of the inclusion of a full period of revenues
from the fiscal 2017 acquisitions of Appterra and Datamyne as well as a partial period of revenues from
the fiscal 2018 acquisitions of ShipRush, PCSTrac and MacroPoint. Revenues in 2018 were also positively
impacted by the growth in sales of transactional, subscription and license products.
Revenues from the EMEA region were $80.1 million, $77.6 million and $75.2 million in 2019, 2018 and
2017, respectively. The increase in 2019 compared to 2018 was primarily a result of growth in sales of
transactional, subscription and professional services products. The increase in revenues in the EMEA region
2019 as compared to 2018 was also positively impacted by the strengthening of the euro and British
pound sterling compared to the US dollar.
The increase in revenues in the EMEA region in 2018 as compared to 2017 was primarily a result of the
inclusion of a full period of revenue from the fiscal 2017 acquisition of Pixi. Revenues in 2018 compared
to 2017 were also positively impacted by the strengthening of the euro compared to the US dollar partially
offset by the weakening of the British pound sterling compared to the US dollar.
Revenues from Canada were $18.2 million, $15.6 million and $13.2 million in 2019, 2018 and 2017, respectively. The increase in 2019 compared to 2018 was primarily a result of the inclusion of a partial
period of revenues from the 2019 acquisition of PinPoint as well as growth in sales of transactional,
subscription and professional services products.

11
The increase in revenues in Canada in 2018 compared to 2017 was primarily a result of growth in sales
of transactional, subscription and professional services products in Canada. Revenues in Canada were also
positively impacted in 2018 as compared to 2017 by the strengthening of the Canadian dollar compared
to the US dollar.
Revenues from the Asia Pacific region were $11.8 million, $10.9 million and $8.7 million in 2019,
2018 and 2017, respectively. The increase in 2019 compared to 2018 was primarily a result of increased
transactional revenues.
The increase in revenues in the Asia Pacific region in 2018 compared to 2017 was primarily a result of the
inclusion of a full period of revenue from the fiscal 2017 acquisition of 4Solutions as well as growth in
sales of transactional and subscription products in the region.
The following table provides analysis of cost of revenues (in millions of dollars) and the related gross
margins for the periods indicated:
Year ended January 31, January 31, January 31,
2019 2018 2017
License
License revenues 5.9 8.1 6.9
Cost of license revenues 1.0 0.7 1.1
Gross margin 4.9 7.4 5.8
Gross margin percentage 83% 91% 84%
Services
Services revenues 241.5 204.4 173.0
Cost of services revenues 57.6 48.9 42.0
Gross margin 183.9 155.5 131.0
Gross margin percentage 76% 76% 76%
Professional services and other
Professional services and other revenues 27.8 24.9 23.9
Cost of professional services and other revenues 16.4 14.1 13.0
Gross margin 11.4 10.8 10.9
Gross margin percentage 41% 43% 46%
Total
Revenues 275.2 237.4 203.8
Cost of revenues 75.0 63.7 56.1
Gross margin 200.2 173.7 147.7
Gross margin percentage 73% 73% 72%
Cost of license revenues consists of costs related to our sale of third-party technology, such as third-
party map license fees and royalties.
Gross margin percentage for license revenues was 83%, 91% and 84% in 2019, 2018 and 2017,
respectively. Our gross margin on license revenues is dependent on the proportion of our license revenues
that involve third-party technology. The margin in 2019 as compared to 2018 was negatively impacted by a higher proportion of our license revenues in 2019 that involved third-party technology.

12
The margin in 2018 as compared to 2017 was positively impacted by a lower proportion of our license
revenues in 2018 that involved third-party technology.
Cost of services revenues consists of internal costs of running our systems and applications and other
personnel-related expenses incurred in providing maintenance, including customer support.
Gross margin percentage for services revenues was 76%, 76% and 76% in 2019, 2018 and 2017,
respectively. Overall, the margin in 2019 as compared to 2018 and 2018 compared to 2017 was consistent.
Cost of professional services and other revenues consists of personnel-related expenses incurred in
providing professional services, hardware installation as well as hardware costs.
Gross margin percentage for professional services and other revenues was 41%, 43% and 46%
for 2019, 2018 and 2017, respectively. The margin in 2019 compared to 2018 was negatively impacted
by an increased proportion of hardware and hardware installation revenues, which generally have lower
gross margins, and increased telematics hardware costs. Hardware installation revenues typically have
lower margins than our professional services revenues and as such we anticipate variances in gross margin
from period to period as a result of the sales mix.
The margin in 2018 as compared to 2017 was negatively impacted by an increased proportion of hardware
revenues and hardware installation revenues.
Operating expenses, consisting of sales and marketing, research and development and general and
administrative expenses, were $114.8 million, $100.3 million and $83.6 million for 2019, 2018 and 2017,
respectively. The increase in operating expenses in 2019 compared to 2018 was primarily due to increased
operating expenses from the fiscal 2018 acquisitions of ShipRush, PCSTrac and MacroPoint as well as the
fiscal 2019 acquisitions of Aljex, Velocity Mail and PinPoint. Operating expenses in 2019 compared to 2018
were also negatively impacted by the strengthening of the euro and British pound sterling compared to
the US dollar.
The increase in operating expenses in 2018 as compared to 2017 was primarily due to increased operating
expenses from the fiscal 2017 of Pixi, Appterra, 4Solutions, Datamyne as well as the fiscal 2018
acquisitions of ShipRush, PCSTrac and MacroPoint. Operating expenses in 2018 compared to 2017 were
also negatively impacted by the impact of the strengthening of the euro and Canadian dollar compared to
the US dollar.

13
The following table provides analysis of operating expenses (in millions of dollars and as a percentage of
total revenues) for the periods indicated:
Year ended January 31, January 31, January 31,
2019 2018 2017
Total revenues 275.2 237.4 203.8
Sales and marketing expenses 36.9 33.1 24.9
Percentage of total revenues 13% 14% 12%
Research and development expenses 47.9 41.8 35.6
Percentage of total revenues 17% 18% 17%
General and administrative expenses 30.0 25.4 23.1
Percentage of total revenues 11% 11% 11%
Total operating expenses 114.8 100.3 83.6
Percentage of total revenues 42% 42% 41%
Sales and marketing expenses include salaries, commissions, stock-based compensation and other
personnel-related costs, bad debt expenses, travel expenses, advertising programs and services, and
other promotional activities associated with selling and marketing our services and products. Sales and
marketing expenses were $36.9 million, $33.1 million and $24.9 million in 2019, 2018 and 2017,
respectively. Sales and marketing expenses as a percentage of total revenues were 13% in 2019, 14% in
2018 and 12% in 2017. The increase in sales and marketing expenses in 2019 compared to 2018 was
primarily due to the inclusion of sales and marketing expenses from the fiscal 2018 acquisition of
MacroPoint and fiscal 2019 acquisitions of Aljex, Velocity Mail and PinPoint. Sales and marketing expenses
in 2019 compared to 2018 were also negatively impacted by the strengthening of the euro and British
pound sterling compared to the US dollar.
The increase in sales and marketing expenses in 2018 as compared to 2017 was primarily due to the
inclusion of sales and marketing expenses from the fiscal 2017 acquisition of Datamyne and fiscal 2018
acquisition of MacroPoint. These acquisitions also drove the increase in sales and marketing expense as a
percentage of total revenues in 2018. Sales and marketing expenses in 2018 compared to 2017 were also
negatively impacted by the strengthening of the euro and Canadian dollar compared to the US dollar.
Research and development expenses consist primarily of salaries, stock-based compensation and
other personnel-related costs of technical and engineering personnel associated with our research and
product development activities, as well as costs for third-party outsourced development providers. We
expensed all costs related to research and development in 2019, 2018 and 2017. Research and
development expenses were $47.9 million, $41.8 million and $35.6 million in 2019, 2018 and 2017,
respectively. Research and development expenses as a percentage of total revenues were 17% in 2019,
18% in 2018 and 17% in 2017. The increase in research and development expenses in 2019 compared to
2018 was primarily attributable to increased payroll and related costs from the fiscal 2018 acquisitions of
ShipRush, PCSTrac and MacroPoint as well as the fiscal 2019 acquisitions of Aljex and Velocity Mail.
Research and development expenses in 2019 as compared to 2018 were also negatively impacted by the
strengthening of the euro compared to the US dollar.
The increase in research and development expenses in 2018 compared to 2017 was primarily attributable
to increased payroll and related costs from the fiscal 2017 acquisitions of Appterra, Datamyne and the
fiscal 2018 acquisitions of ShipRush, PCSTrac and MacroPoint. Research and development expenses in
2018 compared to 2017 were also negatively impacted by the strengthening of the Canadian dollar and euro compared to the US dollar.
14
General and administrative expenses consist primarily of salaries, stock-based compensation and
other personnel-related costs of administrative personnel, as well as professional fees and other
administrative expenses. General and administrative costs were $30.0 million, $25.4 million and $23.1
million in 2019, 2018 and 2017, respectively. General and administrative expenses as a percentage of
total revenues were 11%, 11% and 11% in 2019, 2018 and 2017, respectively. The increase in general
and administrative expenses in 2019 compared to 2018 was primarily attributable to the inclusion of
general and administrative expenses from the fiscal 2018 acquisitions of ShipRush and MacroPoint as well
as the fiscal 2019 acquisitions of Aljex and PinPoint. General and administrative expenses in 2019 as
compared to 2018 were also negatively impacted by the strengthening of the euro and British pound
sterling compared to the US dollar.
The increase in general and administrative expenses in 2018 compared to 2017 was primarily attributable
to the inclusion of general and administrative expenses from the fiscal 2017 acquisitions of Appterra,
Datamyne and the fiscal 2018 acquisitions of ShipRush and MacroPoint. General and administrative
expenses in 2018 compared to 2017 were also negatively impacted by the strengthening of the Canadian
dollar and euro compared to the US dollar.
Other charges consist primarily of acquisition-related costs with respect to completed and prospective
acquisitions and restructuring charges. Acquisition-related costs primarily include advisory services,
brokerage services, administrative costs and retention bonuses, and relate to completed and prospective
acquisitions. Restructuring costs relate to the integration of previously completed acquisitions and other
cost-reduction activities. Other charges were $3.8 million, $4.0 million and $3.5 million in 2019, 2018 and
2017, respectively. Other charges included acquisition-related costs of $3.8 million, $3.5 million and $3.0
million in 2019, 2018 and 2017, respectively.
The increase in other charges in 2018 compared to 2017 was primarily a result of additional acquisition-
related costs.
Amortization of intangible assets is amortization of the value attributable to intangible assets,
including customer agreements and relationships, non-compete covenants, existing technologies and
trade names, in each case associated with acquisitions completed by us as of the end of each reporting
period. Intangible assets with a finite life are amortized to income over their useful life. The amount of
amortization expense in a fiscal period is dependent on our acquisition activities as well as our asset
impairment tests. Amortization of intangible assets was $40.2 million, $33.5 million and $30.0 million in
2019, 2018 and 2017, respectively. The increase in amortization over those three years primarily arose
due to amortization expense from the acquisitions of Pixi, Appterra, 4Solutions, Datamyne, ShipRush,
PCSTrac, MacroPoint, Aljex, Velocity Mail and PinPoint. As at January 31, 2019, the unamortized portion
of all intangible assets amounted to $176.2 million.
We test the carrying value of our finite life intangible assets for recoverability when events or changes in
circumstances indicate that there may be evidence of impairment. We write down intangible assets or
asset groups with a finite life to fair value when the related undiscounted cash flows are not expected to
allow for recovery of the carrying value. Fair value of intangible asset or asset groups is determined by
discounting the expected related cash flows. No finite life intangible asset or asset group impairment has
been identified or recorded for any of the fiscal periods reported.
Investment income was $0.2 million, $0.2 million and $1.4 million in 2019, 2018 and 2017, respectively.
Investment income in 2019 was consistent with 2018. The decrease in investment income in 2018
compared to 2017 was primarily attributable to the sale of marketable securities during 2017.
Interest expense was $2.1 million, $1.3 million and $0.6 million in 2019, 2018 and 2017, respectively.
Interest expense is primarily comprised of interest expense on the amount borrowed and outstanding on
our revolving debt facility, debt standby charges as well as the amortization of deferred financing charges. Interest expense increased in 2019 compared to 2018 as a result of higher average interest rates and a
higher debt balance due to additional debt facility borrowings to fund the acquisitions of Aljex, Velocity

15
Mail and PinPoint. The increase in interest expense in 2018 compared to 2017 was a result of higher debt
balance due to additional debt facility borrowings to fund the acquisition of Pixi and MacroPoint.
Income tax expense is comprised of current and deferred income tax expense. Income tax expense for
2019, 2018 and 2017 was 21%, 23% and 24% of income before income taxes, respectively, with current
income tax expense being 15%, 19% and 13% of income before income taxes, respectively. The Tax Cuts
and Jobs Act (the “Tax Act”) was enacted on December 22, 2017 and introduced significant changes to
U.S. income tax law. Effective January 1, 2018, the Tax Act reduced the U.S. statutory tax rate from 35%
to 21%. Overall, the Tax Act did not have a significant impact on income tax expense in 2019.
Income tax expense – current was $6.0 million, $6.6 million and $4.0 million in 2019, 2018 and 2017,
respectively. Current income taxes arise primarily from income that is not fully sheltered by loss carry-
forwards or other tax attributes. Current income tax expense decreased in 2019 compared to 2018
primarily related to a net favorable outcome on the conclusion of certain tax audits partially offset by
higher current income tax expense as a result of the higher pre-tax income generated in 2019.
Current tax expense increased in 2018 compared to 2017 primarily due to a charge of $1.5 million
attributable to changes in the estimate of our uncertain tax positions, $0.8 million in Canada as a result
of less income being sheltered by loss carry-forwards and other attributes and $0.3 million in adjustments
in respect to income tax of previous periods.
Income tax expense – deferred was $2.2 million, $1.3 million and $3.6 million in 2019, 2018 and
2017, respectively. Deferred income tax expense increased in 2019 compared to 2018 primarily due to
the adoption of Accounting Standards Update 2016-16.
Deferred income tax expense decreased in 2018 compared to 2017 primarily due to $1.1 million in
reductions to corporate income tax rates in the US and EMEA and a $0.7 million reduction in deferred tax
charges and recognition of deferred tax assets related to stock compensation.
Net income was $31.3 million, $26.9 million and $23.8 million in 2019, 2018 and 2017, respectively.
QUARTERLY OPERATING RESULTS
The following table provides an analysis of our unaudited operating results (in thousands of dollars, except
per share and weighted average number of share amounts) for each of the quarters ended on the date
indicated.
April 30, July 31, October 31, January 31, Total
2018 2018 2018 2019
2019
Revenues 67,018 67,115 70,008 71,030 275,171
Gross margin 48,434 49,154 50,858 51,731 200,177
Operating expenses 27,997 28,358 29,144 29,258 114,757
Net income 6,986 8,498 7,901 7,892 31,277
Basic earnings per share 0.09 0.11 0.10 0.10 0.41
Diluted earnings per share 0.09 0.11 0.10 0.10 0.40
Weighted average shares outstanding
(thousands):
Basic 76,793 76,816 76,854 76,865 76,832
Diluted 77,650 77,781 77,863 77,842 77,791

16
April 30, July 31, October 31, January 31, Total
2017 2017 2017 2018
2018
Revenues 54,514 57,293 62,001 63,631 237,439
Gross margin 40,132 41,946 45,158 46,499 173,735
Operating expenses 22,505 23,942 26,450 27,483 100,380
Net income 6,885 7,159 6,170 6,665 26,879
Basic earnings per share 0.09 0.09 0.08 0.09 0.35
Diluted earnings per share 0.09 0.09 0.08 0.09 0.35
Weighted average shares outstanding
(thousands):
Basic 75,912 75,969 76,630 76,773 76,324
Diluted 76,648 76,739 77,442 77,616 77,112
Revenues over the comparative periods have been positively impacted by the six acquisitions that we
completed from the beginning of fiscal 2018 through the end of fiscal 2019. In addition, we have seen
increased revenues as a result of an increase in transactions processed over our GLN business document
exchange as we help our customers comply with electronic filing requirements of US, Canadian, EU and
Asian security and customs regulations.
Our services revenues continue to have minor seasonal trends. In the first fiscal quarter of each year, we
historically have seen slightly lower shipment volumes by air and truck which impact the aggregate
number of transactions flowing through our GLN business document exchange. In the second fiscal quarter
of each year, we historically have seen a slight increase in ocean services revenues as ocean carriers are
in the midst of their customer contract negotiation period. In the third fiscal quarter of each year, we have
historically seen shipment and transactional volumes at their highest. In the fourth fiscal quarter of each
year, the various international holidays impact the aggregate number of shipping days in the quarter, and
historically we have seen this adversely impact the number of transactions our network processes and,
consequently, the amount of services revenues we receive during that period. In the second and fourth
fiscal quarters of each year, we historically have seen a slight decrease in professional services revenues
due to various international holidays and vacation seasons. Overall, the impact of seasonal trends has a
relatively minor impact on our revenues quarter to quarter.
In the fourth quarter of 2019 revenues were positively impacted on a quarter to quarter basis by increased
transactional, subscription and professional services revenues as well as a full quarter of operations from
our acquisition of PinPoint. Revenues in the fourth quarter of 2019 were negatively impacted on a quarter
to quarter basis by the weakening of the euro, British pound sterling and Swedish krona compared to the
US dollar. Operating expenses increased primarily due to the inclusion of a full quarter of operations from
our acquisition of PinPoint. Operating expenses in the fourth quarter of 2019 were positively impacted on
a quarter to quarter basis by the weakening of the euro, British pound sterling and Swedish krona
compared to the US dollar.
In the third quarter of 2019 revenues were positively impacted on a quarter to quarter basis by the
inclusion of a full quarter of operations from our acquisition of Velocity Mail as well as a partial quarter of
operations from our acquisition of PinPoint. Revenues and gross margin in the third quarter of 2019 were
also positively impacted on a quarter to quarter basis by increased transactional, subscription and
professional services revenues. Revenues in the third quarter of 2019 were negatively impacted on a
quarter to quarter basis by the weakening of the euro, British pound sterling and Swedish krona compared
to the US dollar. Operating expenses increased primarily due to the inclusion of a full quarter of operations
from our acquisition of Velocity Mail and a partial quarter of operations from our acquisition of PinPoint.
Operating expenses in the third quarter of 2019 were positively impacted on a quarter to quarter basis by
the weakening of the euro, British pound sterling and Swedish krona compared to the US dollar. Net income decreased in the third quarter of 2019 primarily due to the prior quarter including a non-recurring
reduction in income tax expense.

17
In the second quarter of 2019 revenues were positively impacted on a quarter to quarter basis by the
inclusion of a partial quarter of operations from our acquisition of Velocity Mail. Revenues and gross margin
in the second quarter of 2019 were also positively impacted on a quarter to quarter basis by increased
transactional and subscription revenues partially offset by a decrease of $0.7 million in license revenue,
which can vary from period to period, and a decrease of $0.9 million in professional services revenues due
to holidays and vacation seasons. Revenues in the second quarter of 2019 were also negatively impacted
on a quarter to quarter basis by the weakening of the euro and British pound sterling compared to the US
dollar. Operating expenses increased primarily due to the inclusion of a partial quarter of operations from
our acquisition of Velocity Mail. Operating expenses in the second quarter of 2019 were positively impacted
on a quarter to quarter basis by the weakening of the euro and British pound sterling compared to the US
dollar. Net income increased as a result of a reduction in income tax expense partially offset by additional
stock-based compensation expense as well as amortization as a result of the acquisition of Velocity Mail.
In the first quarter of 2019 revenues were positively impacted on a quarter to quarter basis by the inclusion
of a full quarter of operations from our acquisition of Aljex. Revenues and gross margin in the first quarter
of 2019 were also positively impacted on a quarter to quarter basis by increased transactional, subscription
and professional services revenues as well as the strengthening of the euro compared to the US dollar.
Operating expenses increased primarily due to the inclusion of a full quarter of operations from our
acquisition of Aljex. Operating expenses in the first quarter of 2019 were also negatively impacted on a
quarter to quarter basis by the strengthening of the euro compared to the US dollar. Net income was
lowered by additional amortization as a result of the acquisition of Aljex as well as additional acquisition-
related costs.
In the fourth quarter of 2018, revenues were positively impacted on a quarter to quarter basis by the
inclusion of a full quarter of operations from our acquisition of MacroPoint. Revenues in the fourth quarter
of 2018 were also positively impacted on a quarter to quarter basis by the strengthening of the euro and
British pound sterling compared to the US dollar. Operating expenses in the fourth quarter were negatively
impacted on a quarter to quarter basis by the strengthening of the euro and British pound sterling
compared to the US dollar. Net income was higher in the fourth quarter of 2018 as a result of lower
acquisition-related costs with respect to completed and prospective acquisitions as well as restructuring
costs.
In the third quarter of 2018, revenues were positively impacted on a quarter to quarter basis by the
inclusion of a partial quarter of operations from our acquisition of MacroPoint and a full quarter of
operations from our acquisitions of ShipRush and PCSTrac. Revenues in the third quarter of 2018 were
also positively impacted on a quarter to quarter basis by the strengthening of the euro, Canadian dollar
and British pound sterling compared to the US dollar. Operating expenses increased because of the partial
quarter of operations from our acquisition of MacroPoint and a full quarter of operations from our
acquisitions of ShipRush and PCSTrac. Operating expenses in the third quarter were also negatively
impacted on a quarter to quarter basis by the strengthening of the euro, Canadian dollar and British pound
sterling compared to the US dollar. Net income was lowered in the third quarter of 2018 by the inclusion
of a partial period of amortization as a result of our acquisition of MacroPoint and a full quarter of
amortization from our acquisitions of ShipRush and PCSTrac. Net income was also lowered as a result of
restructuring expense recognized in the third quarter of 2018 from our fiscal 2018 restructuring plan.
In the second quarter of 2018, revenues and gross margin were positively impacted on a quarter to quarter
basis by the inclusion of a partial quarter of operations from our acquisitions of ShipRush and PCSTrac.
Revenues in the second quarter of 2018 were also positively impacted on a quarter to quarter basis by
the strengthening of the euro, Canadian dollar, British pound sterling and Swedish krona compared to the
US dollar. Operating expenses increased because of the partial quarter of operations from our acquisitions
of ShipRush and PCSTrac. Operating expenses in the second quarter of 2018 were also negatively
impacted on a quarter to quarter basis by the strengthening of the euro, Canadian dollar, Swedish krona
and British pound sterling compared to the US dollar. Net income was lowered by additional amortization as a result of the acquisitions of ShipRush and PCSTrac in the second quarter of 2018.

18
In the first quarter of 2018, revenues and gross margin were positively impacted on a quarter to quarter
basis by the inclusion of a full quarter of operations from our acquisitions of 4Solutions Information
Technology Pty Ltd. (“4Solutions”) and Datamyne Inc. (“Datamyne”). Revenues in the first quarter of
2018 were also positively impacted on a quarter to quarter basis by the strengthening of the British pound
sterling and euro compared to the US dollar. Operating expenses increased because of the inclusion of a
full quarter of operations from our acquisitions of 4Solutions and Datamyne. Operating expenses in the
first quarter of 2018 were also negatively impacted on a quarter to quarter basis by the strengthening of
the euro, Swedish krona and British pound sterling and positively impacted by weakening of the Canadian
dollar compared to the US dollar. Net income was lowered by additional amortization as a result of the
acquisitions of 4Solutions and Datamyne in 2017.
LIQUIDITY AND CAPITAL RESOURCES
Cash. We had $27.3 million and $35.1 million in cash as at January 31, 2019 and January 31, 2018,
respectively. All cash was held in interest-bearing bank accounts, primarily with major Canadian, US and
European banks. The cash balance decreased from January 31, 2018 to January 31, 2019 by $7.8 million
primarily due to cash used for acquisitions partially offset by net borrowings on the credit facility and cash
generated from operations.
Credit facility. On January 25, 2019, we amended and increased our existing $150.0 million senior
secured revolving credit facility. The newly amended and increased facility is now a $350.0 million
revolving operating credit facility to be available for general corporate purposes, including the financing
of ongoing working capital needs and acquisitions. With the approval of the lenders, the credit facility can
be expanded to a total of $500.0 million. The credit facility has a five-year maturity with no fixed
repayment dates prior to the end of the five-year term ending January 2024. Borrowings under the credit
facility are secured by a first charge over substantially all of Descartes’ assets. Depending on the type of
advance, interest rates under the revolving operating portion of the credit facility are based on the Canada
or US prime rate, Bankers’ Acceptance (BA) or London Interbank Offered Rate (LIBOR) plus an additional
0 to 250 basis points based on the ratio of net debt to adjusted earnings before interest, taxes,
depreciation and amortization, as defined in the credit agreement. A standby fee of between 20 to 40
basis points will be charged on all undrawn amounts. The credit facility contains certain customary
representations, warranties and guarantees, and covenants.
As at January 31, 2019, $324.5 million of the revolving operating credit facility remained available for use
and the outstanding balance of $25.5 million was required to be repaid in February 2024. Subsequent to
January 31, 2019, an additional $241.5 million was drawn on the credit facility to finance the acquisition
of Visual Compliance on February 12, 2019. We were in compliance with the covenants of the credit facility
as at January 31, 2019 and remain in compliance as of the date of this MD&A.
Short-form base shelf prospectus. On June 6, 2018, we filed a final short-form base shelf prospectus
(the “Base Shelf Prospectus”), allowing us to offer and issue the following securities: (i) common shares;
(ii) preferred shares; (iii) senior or subordinated unsecured debt securities; (iv) subscription receipts; (v)
warrants; and (vi) securities comprised of more than one of the aforementioned common shares, preferred
shares, debt securities, subscription receipts and/ or warrants offered together as a unit. These securities
may be offered separately or together, in separate series, in amounts, at prices and on terms to be set
forth in one or more shelf prospectus supplements. The aggregate initial offering price of securities that
may be sold by us (or certain of our current or future shareholders) pursuant to the Base Shelf Prospectus
during the 25-month period that the Base Shelf Prospectus, including any amendments thereto, remains
valid is limited to an aggregate of $750 million.
Working capital. As at January 31, 2019, our working capital (current assets less current liabilities) was
$1.9 million. Current assets primarily include $27.3 million of cash, $31.5 million of current trade
receivables and $9.0 million of prepaid expenses. Current liabilities primarily include $34.2 million of

19
deferred revenue, $29.4 million of accrued liabilities and $5.1 million of accounts payable. Our working
capital decreased from January 31, 2018 to January 31, 2019 by $5.3 million, primarily due to cash used
for acquisitions partially offset by borrowings on the credit facility and cash generated from operations
during the period.
Historically, we’ve financed our operations and met our capital expenditure requirements primarily through
cash flows provided from operations, issuances of common shares and proceeds from debt. We anticipate
that, considering the above, we have sufficient liquidity to fund our current cash requirements for working
capital, contractual commitments, capital expenditures and other operating needs. We also believe that
we have the ability to generate sufficient amounts of cash in the long term to meet planned growth targets
and to fund strategic transactions. Should additional future financing be undertaken, the proceeds from
any such transaction could be utilized to fund strategic transactions or for general corporate purposes. We
expect, from time to time, to continue to consider select strategic transactions to create value and improve
performance, which may include acquisitions, dispositions, restructurings, joint ventures and partnerships,
and we may undertake further financing transactions, including draws on our credit facility or equity
offerings, in connection with any such potential strategic transaction.
With respect to earnings of our non-Canadian subsidiaries, our intention is that these earnings will be
reinvested in each subsidiary indefinitely. Of the $27.3 million of cash as at January 31, 2019, $21.3
million was held by our foreign subsidiaries, most significantly in the United States with lesser amounts
held in other countries in the EMEA and Asia Pacific regions. To date, we have not encountered significant
legal or practical restrictions on the abilities of our subsidiaries to repatriate money to Canada, even if
such restrictions may exist in respect of certain foreign jurisdictions where we have subsidiaries. In the
future, if we elect to repatriate the unremitted earnings of our foreign subsidiaries in the form of dividends,
or if the shares of the foreign subsidiaries are sold or transferred, then we could be subject to additional
Canadian or foreign income taxes, net of the impact of any available foreign tax credits, which would result
in a higher effective tax rate. We have not provided for foreign withholding taxes or deferred income tax
liabilities related to unremitted earnings of our non-Canadian subsidiaries, since such earnings are
considered permanently invested in those subsidiaries, or are not subject to withholding taxes.
The table set forth below provides a summary of cash flows for the periods indicated in millions of dollars:
Year ended January 31, January 31, January 31,
2019 2018 2017
Cash provided by operating activities 78.1 72.1 72.6
Purchase of marketable securities - - (0.2)
Sale of marketable securities - - 6.1
Additions to property and equipment (5.2) (5.1) (4.9)
Acquisition of subsidiaries, net of cash acquired (67.9) (111.9) (71.3)
Proceeds from borrowing on credit facility 68.5 80.0 10.8
Credit facility repayments (78.7) (43.0) (10.2)
Payment of debt issuance costs - - (1.0)
Issuance of common shares, net of issuance costs 0.3 1.0 0.1
Payment of contingent consideration (1.5) - -
Effect of foreign exchange rate on cash (1.4) 3.9 (1.1)
Net change in cash (7.8) (3.0) 0.9
Cash, beginning of period 35.1 38.1 37.2
Cash, end of period 27.3 35.1 38.1
Cash provided by operating activities was $78.1 million, $72.1 million and $72.6 million for 2019,
2018 and 2017, respectively. For 2019, the $78.1 million of cash provided by operating activities resulted
from $31.3 million of net income, plus adjustments for $50.6 million of non-cash items included in net income and less $3.8 million of cash used in changes in our operating assets and liabilities. Cash provided

20
by operating activities increased in 2019 compared to 2018 primarily due to the increase in net income
adjusted for non-cash items.
For 2018, the $72.1 million of cash provided by operating activities resulted from $26.9 million of net
income, plus adjustments for $40.8 million of non-cash items included in net income and plus $4.4 million
of cash provided from changes in our operating assets and liabilities. For 2017, the $72.6 million of cash
provided by operating activities resulted from $23.8 million of net income, plus adjustments for $38.7
million of non-cash items included in net income and plus $10.1 million of cash provided from changes in
our operating assets and liabilities. Cash provided by operating activities decreased in 2018 compared to
2017 primarily due to cash used for payment of retention bonuses on the MK Data acquisition partially
offset by growth in net income adjusted for non-cash items.
Purchase of marketable securities were nil, nil and $0.2 million for 2019, 2018 and 2017, respectively.
Sale of marketable securities were nil, nil and $6.1 million for 2019, 2018 and 2017, respectively.
Additions to property and equipment were $5.2 million, $5.1 million and $4.9 million in 2019, 2018
and 2017, respectively. Additions to property and equipment increased in 2019 compared to 2018 and in
2018 compared to 2017 as a result of additional investments in computing equipment and software to
support our network and build out our security infrastructure.
Acquisition of subsidiaries, net of cash acquired were $67.9 million, $111.9 million and $71.3 million
in 2019, 2018 and 2017, respectively. Acquisitions in 2019 related to Aljex, Velocity Mail and PinPoint.
Acquisitions in 2018 related to ShipRush, PCSTrac and MacroPoint. Acquisitions in 2017 related to Pixi,
Appterra, 4Solutions and Datamyne.
Proceeds from borrowing on credit facility were $68.5 million, $80.0 million and $10.8 million in
2019, 2018 and 2017, respectively. In 2019 the borrowings on our credit facility financed the acquisitions
of Aljex, Velocity Mail and PinPoint. The borrowings on our credit facility in 2018 partially financed our
acquisition of MacroPoint. The borrowings on our credit facility in 2017 financed our acquisition of Pixi.
Credit facility repayments were $78.7 million, $43.0 million and $10.2 million in 2019, 2018 and 2017,
respectively.
Payment of debt issuance costs were nil, nil and $1.0 million in 2019, 2018 and 2017, respectively,
and relate to costs paid in amending the terms of our credit facility agreement.
Issuance of common shares, net of issuance costs were $0.3 million, $1.0 million and $0.1 million
in 2019, 2018 and 2017, respectively. The $0.3 million in 2019 was a result of the exercise of employee
stock options partially offset by cash used to file the new short-form base shelf prospectus. The $1.0
million in 2018 was a result of the exercise of employee stock options. The $0.1 million in 2017 was a
result of the exercise of employee stock options partially offset by costs paid to file the short-form base
shelf prospectus.
Payment of contingent consideration was $1.5 million, nil and nil in 2019, 2018 and 2017.
21
COMMITMENTS, CONTINGENCIES AND GUARANTEES
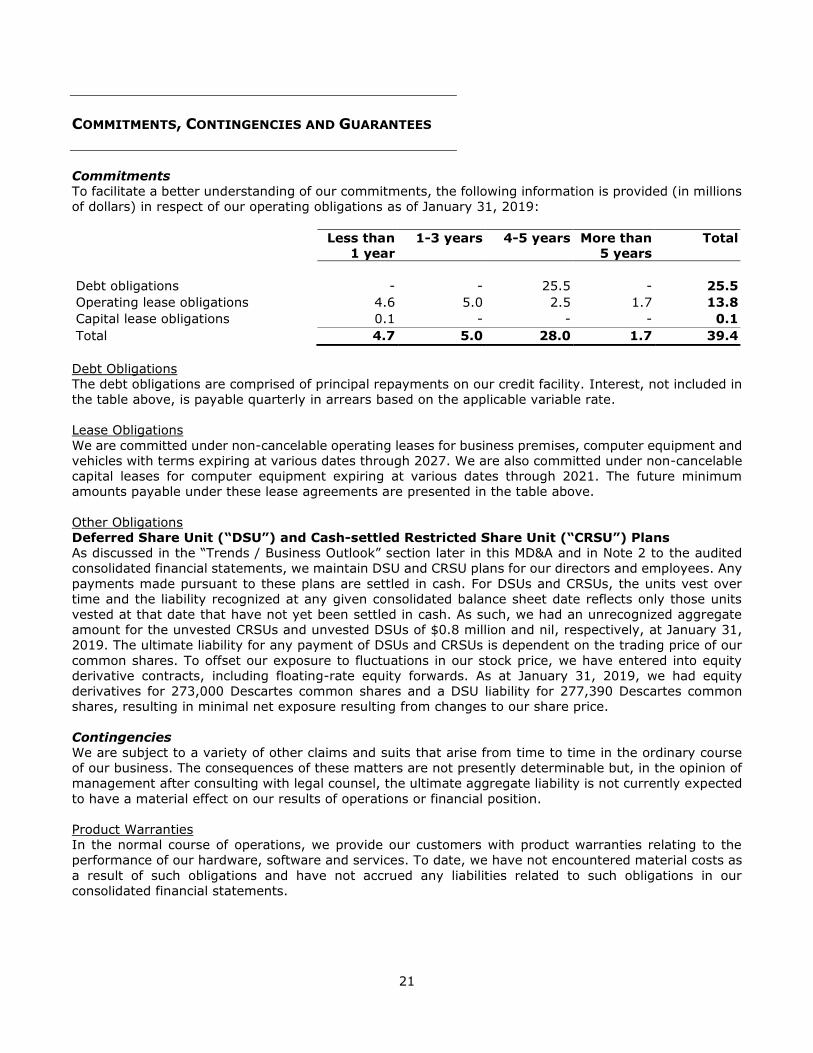
Commitments
To facilitate a better understanding of our commitments, the following information is provided (in millions
of dollars) in respect of our operating obligations as of January 31, 2019:
Less than
1 year
1-3 years 4-5 years More than
5 years
Total
Debt obligations - - 25.5 - 25.5
Operating lease obligations 4.6 5.0 2.5 1.7 13.8
Capital lease obligations 0.1 - - - 0.1
Total 4.7 5.0 28.0 1.7 39.4
Debt Obligations
The debt obligations are comprised of principal repayments on our credit facility. Interest, not included in
the table above, is payable quarterly in arrears based on the applicable variable rate.
Lease Obligations
We are committed under non-cancelable operating leases for business premises, computer equipment and
vehicles with terms expiring at various dates through 2027. We are also committed under non-cancelable
capital leases for computer equipment expiring at various dates through 2021. The future minimum
amounts payable under these lease agreements are presented in the table above.
Other Obligations
Deferred Share Unit (“DSU”) and Cash-settled Restricted Share Unit (“CRSU”) Plans
As discussed in the “Trends / Business Outlook” section later in this MD&A and in Note 2 to the audited
consolidated financial statements, we maintain DSU and CRSU plans for our directors and employees. Any
payments made pursuant to these plans are settled in cash. For DSUs and CRSUs, the units vest over
time and the liability recognized at any given consolidated balance sheet date reflects only those units
vested at that date that have not yet been settled in cash. As such, we had an unrecognized aggregate
amount for the unvested CRSUs and unvested DSUs of $0.8 million and nil, respectively, at January 31,
2019. The ultimate liability for any payment of DSUs and CRSUs is dependent on the trading price of our
common shares. To offset our exposure to fluctuations in our stock price, we have entered into equity
derivative contracts, including floating-rate equity forwards. As at January 31, 2019, we had equity
derivatives for 273,000 Descartes common shares and a DSU liability for 277,390 Descartes common
shares, resulting in minimal net exposure resulting from changes to our share price.
Contingencies
We are subject to a variety of other claims and suits that arise from time to time in the ordinary course
of our business. The consequences of these matters are not presently determinable but, in the opinion of
management after consulting with legal counsel, the ultimate aggregate liability is not currently expected
to have a material effect on our results of operations or financial position.
Product Warranties
In the normal course of operations, we provide our customers with product warranties relating to the
performance of our hardware, software and services. To date, we have not encountered material costs as
a result of such obligations and have not accrued any liabilities related to such obligations in our
consolidated financial statements.

22
Business combination agreements
In respect of our acquisitions of Appterra, ShipRush and PinPoint, up to $3.8 million in cash may become
payable if certain revenue performance targets are met in the two years following the acquisition. A
balance of $2.2 million is accrued related to the fair value of this contingent consideration as at January
31, 2019.
Guarantees
In the normal course of business, we enter into a variety of agreements that may contain features that
meet the definition of a guarantee under ASC Topic 460, “Guarantees”. The following lists our significant
guarantees:
Intellectual property indemnification obligations
We provide indemnifications of varying scope to our customers against claims of intellectual property
infringement made by third parties arising from the use of our products. In the event of such a claim, we
are generally obligated to defend our customers against the claim and we are liable to pay damages and
costs assessed against our customers that are payable as part of a final judgment or settlement. These
intellectual property infringement indemnification clauses are not generally subject to any dollar limits and
remain in force for the term of our license agreement with our customer, which license terms are typically
perpetual. Historically, we have not encountered material costs as a result of such indemnification
obligations.
Other indemnification agreements
In the normal course of operations, we enter into various agreements that provide general indemnities.
These indemnities typically arise in connection with purchases and sales of assets, securities offerings or
buy-backs, service contracts, administration of employee benefit plans, retention of officers and directors,
membership agreements, customer financing transactions, and leasing transactions. In addition, our
corporate by-laws provide for the indemnification of our directors and officers. Each of these indemnities
requires us, in certain circumstances, to compensate the counterparties for various costs resulting from
breaches of representations or obligations under such arrangements, or as a result of third party claims
that may be suffered by the counterparty as a consequence of the transaction. We believe that the
likelihood that we could incur significant liability under these obligations is remote. Historically, we have
not made any significant payments under such indemnities.
In evaluating estimated losses for the guarantees or indemnities described above, we consider such factors
as the degree of probability of an unfavorable outcome and the ability to make a reasonable estimate of
the amount of loss. We are unable to make a reasonable estimate of the maximum potential amount
payable under such guarantees or indemnities as many of these arrangements do not specify a maximum
potential dollar exposure or time limitation. The amount also depends on the outcome of future events
and conditions, which cannot be predicted. Given the foregoing, to date, we have not accrued any liability
in our financial statements for the guarantees or indemnities described above.
OUTSTANDING SHARE DATA
We have an unlimited number of common shares authorized for issuance. As of March 6, 2019, we had
77,161,346 common shares issued and outstanding.
At the annual meeting of shareholders held on May 26, 2016, the shareholders of the Corporation approved
the addition of 4,500,000 options to the Corporation’s stock option plan. As of March 6, 2019, there were
879,338 options issued and outstanding, and 4,005,138 remaining available for grant under all stock
option plans.
At the annual meeting of shareholders held on June 1, 2017, the shareholders of the Corporation approved
the addition of a further 1,500,000 units to the Corporation’s performance and restricted share unit plan.
23
As of March 6, 2019, there were 576,145 performance share units (“PSUs”) and 337,066 restricted share
units (“RSUs”) issued and outstanding, and 1,419,461 remaining available for grant under all performance
and restricted share unit plans.
On November 30, 2004, we announced that our board of directors had adopted a shareholder rights plan
(the “Rights Plan”) to ensure the fair treatment of shareholders in connection with any take-over offer,
and to provide our board of directors and shareholders with additional time to fully consider any unsolicited
take-over bid. We did not adopt the Rights Plan in response to any specific proposal to acquire control of
the Company. The Rights Plan was approved by the TSX and was originally approved by our shareholders
on May 18, 2005. The Rights Plan took effect as of November 29, 2004. An amended and restated Rights
Plan was ratified by shareholders at our annual shareholders’ meeting held on June 1, 2017. We
understand that the Rights Plan is similar to plans adopted by other Canadian companies and approved
by their shareholders.
APPLICATION OF CRITICAL ACCOUNTING POLICIES
Our consolidated financial statements and accompanying notes are prepared in accordance with GAAP.
Preparing financial statements requires management to make estimates and assumptions that affect the
reported amounts of assets, liabilities, revenues and expenses. These estimates and assumptions are
affected by management’s application of accounting policies. Estimates are deemed critical when a
different estimate could have reasonably been used or where changes in the estimates are reasonably
likely to occur from period to period and would materially impact our financial condition or results of
operations. Our significant accounting policies are discussed in Note 2 to the audited consolidated financial
statements for 2019 included in our 2019 Annual Report.
Our management has discussed the development, selection and application of our critical accounting
policies with the audit committee of the board of directors.
The following discusses the critical accounting estimates and assumptions that management has made
under these policies and how they affect the amounts reported in the fiscal 2019 consolidated financial
statements:
Revenue recognition
Revenue is recognized upon transfer of control of promised goods or services to customers in an amount
that reflects the consideration we expect to receive in exchange for those goods or services. We enter into
contracts that can include various combinations of goods and services, which are generally capable of
being distinct and accounted for as separate performance obligations. A product or service is distinct if
the customer can benefit from it on its own or together with other readily available resources and the
promise to transfer the good or service is separately identifiable from other promises in the contractual
arrangement with the customer. Non-distinct goods and services are combined with other goods or
services until they are distinct as a bundle and therefore form a single performance obligation.
The consideration (including any discounts) is allocated between separate goods and services in a bundle
on a relative basis based on their standalone selling prices (“SSP”). Revenue is recognized net of any taxes
collected from customers, which are subsequently remitted to governmental authorities. In addition to
these general policies, the specific revenue recognition policies for each major category of revenue are
included below.
License
Revenues for distinct licenses for on-premise or hosted software are derived from perpetual licenses granted to our customers for the right to use our software products. License revenues are billed on the
24
effective date of a contract and revenue is recognized at the point in time when the customer is provided
control of the respective software.
Services
Services, which allow customers to access hosted software over a contract term without taking possession
of the software, is provided on a subscription and/or transactional fee basis. Revenues from hosted
software subscriptions and maintenance are typically billed annually in advance and revenue is recognized
on a ratable basis over the contract term beginning on the date that our service is made available to the
customer. Transaction fees are typically billed and recognized as revenue on a monthly basis based on
the customer usage for that period.
Professional Services & Other
Professional services are comprised of consulting, implementation and training services related to our
services and products. These services are generally considered to be separate performance obligations as
they provide incremental benefit to customers beyond providing access to the software. Professional
services are typically billed on a time and materials basis and revenue is recognized over time as the
services are performed. For professional services contracts billed on a fixed price basis, revenue is
recognized over time based on the proportion of services performed. Revenue related to customer
reimbursement of travel related expenses is recognized on a gross basis as incurred. Other revenues
include hardware revenue and is generally billed, and revenue is recognized, when control of the product
has transferred under the terms of an enforceable contract.
Costs to Obtain a Contract with a Customer
We recognize an asset for the incremental costs of obtaining a contract with a customer if we expect the
costs to be recoverable. We have determined that certain sales incentive programs meet the requirements
to be capitalized. These capitalized costs are amortized consistent with the pattern of transfer to the
customer for the goods and services to which the asset relates, including specifically identifiable contract
renewals. The period of benefit including renewals is determined to be generally between four to six years,
taking into consideration our customer contracts, our technology, renewal behaviors and other factors.
Amortization of the asset is included in sales and marketing expenses in the consolidated statements of
operations. Applying the practical expedient, we recognize the incremental costs of obtaining contracts as
an expense when incurred if the amortization period of the assets that we otherwise would have recognized
is one year or less.
Contract Assets and Liabilities
The payment terms and conditions in our customer contracts may vary from the timing of revenue
recognition. In some cases, customers pay in advance of delivery of products or services; in other cases,
payment is due as services are performed or in arrears following delivery. Timing differences between
revenue recognition and invoicing result in unbilled receivables, contract assets, or deferred revenue.
Receivables are accrued when revenue is recognized prior to invoicing but the right to payment is
unconditional (i.e., only the passage of time is required). This occurs most commonly when software term
licenses recognized at a point in time are paid for periodically over the license term. Contract assets result
when amounts allocated to distinct performance obligations are recognized when or as control of a product
or service is transferred to the customer, but invoicing is contingent on performance of other performance
obligations or on completion of contractual milestones and is presented as other receivables. Contract
assets are transferred to receivables when the rights become unconditional, typically upon invoicing of the
related performance obligations in the contract or upon achieving the requisite project milestone. Contract
liabilities primarily relate to the advance consideration received from customers and is presented as
deferred revenue. Deferred revenue results from customer payments in advance of our satisfaction of the
associated performance obligation(s) and relates primarily to prepaid maintenance or other recurring
services. Deferred revenues are relieved as revenue is recognized. Contract assets and deferred revenues
are reported on a contract-by-contract basis at the end of each reporting period.
Significant Judgments
Our contracts with customers often include promises to transfer multiple goods and services to a customer.
Determining whether goods and services are considered distinct performance obligations that should be

25
accounted for separately versus together may require significant judgment. Judgment is also needed in
assessing the ability to collect the corresponding receivables.
Judgment is required to determine the SSP for each distinct performance obligation, which is needed to
determine whether there is a discount that needs to be allocated based on the relative SSP of the various
goods and services. In order to determine the SSP of its promised goods or services, we conduct a regular
analysis to determine whether various goods or services have an observable standalone selling price. If
the Company does not have an observable SSP for a particular good or service, then SSP for that particular
good or service is estimated using reasonably available information and maximizing observable inputs
with approaches including historical pricing, cost plus a margin, adjusted market assessment, and the
residual approach.
Impairment of long-lived assets
We test long-lived assets or asset groups, such as property and equipment and finite life intangible assets,
for recoverability when events or changes in circumstances indicate that there may be impairment. An
impairment loss is recognized when the estimate of undiscounted future cash flows generated by such
asset or asset groups is less than the carrying amount. Measurement of the impairment loss is based on
the present value of the expected future cash flows. Our impairment analysis contains estimates due to
the inherent uncertainty relating to forecasting long-term estimated cash flows and determining the
ultimate useful lives of asset or asset groups. Actual results will differ, which could materially impact our
impairment assessment.
Goodwill
We test for impairment of goodwill at least annually on October 31st of each year and at any other time
if any event occurs or circumstances change that would more likely than not reduce our fair value below
our carrying amount. Our operations are analyzed by management and our chief operating decision maker
as being part of a single industry segment providing logistics technology solutions. Accordingly, our
goodwill impairment assessment is based on the allocation of goodwill to a single reporting unit.
We will perform further quarterly analysis of whether any event has occurred that would more likely than
not reduce our fair value below our carrying amounts and, if so, we will perform a goodwill impairment
test between the annual dates. Any future impairment adjustment will be recognized as an expense in the
period that the adjustment is identified.
Application of the goodwill impairment test requires judgment, including the identification of reporting
units, assigning assets and liabilities to reporting units, assigning goodwill to reporting units, assessing
qualitative factors and determining the fair value of each reporting unit. Significant judgments are required
to estimate the fair value of reporting units and include estimating future cash flows, determining
appropriate discount rates and other assumptions. Changes in these estimates and assumptions could
materially affect the determination of fair value and/or goodwill impairment for each reporting unit.
Stock-based compensation plans
Stock Options
We maintain stock option plans for non-employee directors, officers, employees and other service
providers. Options to purchase our common shares are granted at an exercise price equal to the fair
market value of our common shares as of the date of grant. This fair market value is determined using
the closing price of our common shares on the TSX on the day immediately preceding the date of the
grant.
Employee stock options generally vest over a five-year period starting from the grant date and expire
seven years from the grant date. Non-employee directors’ and officers’ stock options generally have
quarterly vesting over a three to five-year period.
The fair value of employee stock option grants that are ultimately expected to vest are amortized to
expense in our consolidated statement of operations based on the straight-line attribution method. The
fair value of stock option grants is calculated using the Black-Scholes Merton option-pricing model.
26
Expected volatility is based on historical volatility of our common stock and other factors. The risk-free
interest rates are based on Government of Canada average bond yields for a period consistent with the
expected life of the option in effect at the time of the grant. The expected option life is based on the
historical life of our granted options and other factors.
Performance & Restricted Share Units
PSUs are measured at fair value estimated using a Monte Carlo Simulation approach and will be expensed
to stock-based compensation expense over the vesting period. The ultimate number of PSUs that vest is
based on the total shareholder return (“TSR”) of our Company relative to the TSR of companies comprising
a peer index group. TSR is calculated based on the weighted-average closing price of shares for the five
trading days preceding the beginning and end of the performance period. Expected volatility is based on
historical volatility of our common stock and other factors. The risk-free interest rates are based on the
Government of Canada average bond yields for a period consistent with the expected life of the PSUs at
the time of the grant. The expected PSU life is based on the historical life of our stock options and other
factors.
RSUs vest annually over a three-year period starting from the grant date and expire ten years from the
grant date. We issue new shares from treasury upon the redemption of an RSU. RSUs are measured at
fair value based on the closing price of our common shares for the day preceding the date of the grant
and will be expensed to stock-based compensation expense over the vesting period.
Deferred Share Unit Plan
Our board of directors adopted a deferred share unit plan effective as of June 28, 2004, pursuant to which
non-employee directors are eligible to receive grants of deferred share units, each of which has an initial
value equal to the weighted-average closing price of our common shares for the five trading days
preceding the grant date. The plan allows each director to choose to receive, in the form of DSUs, all,
none or a percentage of the eligible director’s fees which would otherwise be payable in cash. If a director
has invested less than the minimum amount of equity in Descartes, as prescribed from time to time by
the board of directors, then the director must take at least 50% of the base annual fee for serving as a
director in the form of DSUs. Each DSU fully vests upon award but is distributed only when the director
ceases to be a member of the board of directors. Vested units are settled in cash based on our common
share price when conversion takes place. Fair value of the liability is based on the closing price of our
common shares at the balance sheet date.
Cash-Settled Restricted Share Unit Plan
Our board of directors adopted a cash-settled restricted share unit plan effective as of May 23, 2007,
pursuant to which certain of our employees and non-employee directors are eligible to receive grants of
CRSUs, each of which has an initial value equal to the weighted-average closing price of our common
shares for the five trading days preceding the date of the grant. The CRSUs generally vest based on
continued employment and have annual vesting over three to five-year periods. Vested units are settled
in cash based on our common share price when conversion takes place, which is within 30 days following
a vesting date and in any event prior to December 31st of the calendar year in which a vesting date
occurs. Fair value of the liability is based on the closing price of our common shares at the balance sheet
date.
Income Taxes
We have provided for income taxes based on information that is currently available to us. Tax filings are
subject to audits, which could materially change the amount of deferred income tax assets and liabilities.
We record deferred tax assets on our consolidated balance sheet for tax benefits that we currently expect
to realize in future periods. Over recent years, we have determined that there was sufficient positive
evidence such that it was more likely than not that we would utilize all or a portion of deferred tax assets
in certain jurisdictions, to offset taxable income in future periods. This positive evidence included that we
have earned cumulative income, after permanent differences, in each of these jurisdictions in at least the current and two preceding tax years. As such, over recent years, we have reduced our valuation
allowances by amounts which represent the amount of tax loss carry forwards that we project will be used

27
to offset taxable income in these jurisdictions over the foreseeable future. In making the projection for
the period, we made certain assumptions, including the following: (i) that there will be continued customer
migration from technology platforms owned by foreign jurisdictions to a technology platform owned by
another entity in our corporate group; and (ii) that tax rates in these jurisdictions will be consistent over
the period of projection. Any further change to increase or decrease the valuation allowance for the
deferred tax assets would result in an income tax expense or income tax recovery, respectively, on the
consolidated statements of operations.
Business Combinations
In connection with business acquisitions that we have completed, we identify and estimate the fair value
of net assets acquired, including certain identifiable intangible assets (other than goodwill) and liabilities
assumed in the acquisitions. Any excess of the purchase price over the estimated fair value of the net
assets acquired is assigned to goodwill. Intangible assets include customer agreements and relationships,
non-compete covenants, existing technologies and trade names. Our initial allocation of purchase price is
generally preliminary in nature and may not be final for up to one year from the date of acquisition.
Changes to the estimates and assumptions used in determining our purchase price allocation may result
in material differences depending on the size of the acquisition completed.
CHANGE IN / INITIAL ADOPTION OF ACCOUNTING POLICIES
Recently adopted accounting pronouncements
In May 2014, the FASB issued Accounting Standards Update 2014-09, “Revenue from Contracts with
Customers” (“ASC 606”). ASC 606 supersedes the revenue recognition requirements in ASC Topic 605,
“Revenue Recognition” ("ASC 605") and nearly all other existing revenue recognition guidance under US
GAAP. The core principle of ASC 606 is to recognize revenues when promised goods or services are
transferred to customers in an amount that reflects the consideration that is expected to be received for
those goods or services. ASC 606 is effective for annual periods, and interim periods within those annual
periods, beginning after December 15, 2017, which is our fiscal year that began on February 1, 2018
(fiscal 2019). The Company has adopted ASC 606 in the first quarter of fiscal 2019 using the cumulative
effect method and therefore the comparative information has not been restated and continues to be
reported under ASC 605. The details of the significant changes and quantitative impact of the changes are
set out below.
Term-based licenses
Under ASC 605, revenue attributable to term-based arrangements was recognized ratably over
the term of the arrangement because Vendor Specific Objective Evidence did not exist for the
undelivered maintenance and support element of the arrangement. Under ASC 606, the Company
has deemed the licenses to be distinct from other performance obligations. Revenue allocated to
the distinct license based on the SSP is recognized at the time that both the right-to-use the
software has commenced for the term and the software has been made available to the customer.
Costs to obtain a contract
Under the Company’s previous accounting policies, the Company generally expensed commission
costs paid to employees or third parties to obtain customer contracts as incurred. Under ASC 606,
the Company allocates these incremental commission costs to the various performance obligations
to which they relate using the relative selling price allocation for bundled commissions. For
performance obligations not delivered upfront, the allocated commissions are deferred and
amortized over the pattern of transfer of the related performance obligation. If the expected
amortization period for all performance obligations in a contract with a customer is one year or
less, the commission fee is expensed when incurred. Capitalized costs to obtain a contract are
included in other long-term assets on the consolidated balance sheet.
The adoption of ASC 606 resulted in an increase to contract assets of $0.5 million, an increase to other

28
long-term assets of $4.2 million, an increase to the liability for deferred income taxes of $1.1 million and
a decrease to accumulated deficit of $3.6 million, as of February 1, 2018.
In January 2016, the FASB issued Accounting Standards Update 2016-01, “Financial Instruments—Overall
(Subtopic 825-10): Recognition and Measurement of Financial Assets and Financial Liabilities” (“ASU 2016-
01”). ASU 2016-01 supersedes the guidance to classify equity securities with readily determinable fair
values into different categories reducing the number of items that are recognized in other comprehensive
income as well as simplifying the impairment assessment of equity investments without readily
determinable fair values. ASU 2016-01 is effective for annual periods, and interim periods within those
annual periods, beginning after December 15, 2017, which is our fiscal year that began on February 1,
2018 (fiscal 2019). The Company adopted this guidance in the first quarter of fiscal 2019. The adoption
of this standard did not have a material impact on our results of operations or disclosures.
In August 2016, the FASB issued Accounting Standards Update 2016-15, “Statement of Cash Flows (Topic
230): Classification of Certain Cash Receipts and Cash Payments” (“ASU 2016-15”). ASU 2016-15 clarifies
the presentation and classification in the statement of cash flows. ASU 2016-15 is effective for annual
periods, and interim periods within those annual periods, beginning after December 15, 2017, which is
our fiscal year that began on February 1, 2018 (fiscal 2019). The Company adopted this guidance in the
first quarter of fiscal 2019. The adoption of this standard did not have a material impact on our results of
operations or disclosures.
In October 2016, the FASB issued Accounting Standards Update 2016-16, “Income Taxes (Topic 740):
Intra-Entity Transfers of Assets Other Than Inventory” (“ASU 2016-16”). ASU 2016-16 requires the
recognition of the income tax consequences of an intra-entity transfer of an asset other than inventory
when the transfer occurs. ASU 2016-16 is effective for annual periods, and interim periods within those
annual periods, beginning after December 15, 2017, which is our fiscal year that began on February 1,
2018 (fiscal 2019). The Company adopted this guidance in the first quarter of fiscal 2019. As a result of
adoption, the balance of unamortized deferred tax charges was written-off and previously unrecognized
deferred income tax assets in certain jurisdictions were recognized. The change was applied on a modified
retrospective basis, and no prior periods were restated. Accordingly, we have recognized a decrease of
$4.0 million in accumulated deficit as a result of the adoption of this change in accounting policy.
In January 2017, the FASB issued Accounting Standards Update 2017-01, “Business Combinations (Topic
805): Clarifying the Definition of a Business” (“ASU 2017-01”). ASU 2017-01 clarifies the definition of a
business to assist entities with evaluating whether transactions should be accounted for as acquisitions of
assets or businesses. ASU 2017-01 is effective for annual periods, and interim periods within those annual
periods, beginning after December 15, 2017, which is our fiscal year that began on February 1, 2018
(fiscal 2019). The Company adopted this guidance in the first quarter of fiscal 2019. The adoption of this
standard did not have a material impact on our results of operations or disclosures.
Recently issued accounting pronouncements
In February 2016, the FASB issued Accounting Standards Update 2016-02, “Leases (Topic 842)” (“ASU
2016-02”) and issued subsequent amendments to the initial guidance during 2018, collectively referred
to as “Topic 842”. These updates supersede the lease guidance in ASC Topic 840, “Leases” and require
the recognition of lease assets and lease liabilities by lessees for most leases previously classified as
operating leases under ASC Topic 840. Leases will continue to be classified as either operating or finance.
Topic 842 is effective for annual periods, and interim periods within those annual periods, beginning after
December 15, 2018, which will be our fiscal year beginning February 1, 2019 (fiscal 2020). The Company
will adopt this guidance using a modified retrospective method approach in the first quarter of fiscal 2020
and will not restate comparative periods.
We have an established project team with the objective of evaluating the effect that Topic 842 will have
on our consolidated financial statements, related disclosures, business processes, systems and controls. The team has been responsible for analyzing the impact of the new standard on our leases by reviewing
current accounting policies, practices and our lease contracts to identify potential differences that would
result from applying the requirements of the new standard. In addition, this team is assisting in the

29
implementation of changes to our business processes, systems and controls in order to support recognition
and disclosure under the new standard.
As permitted under Topic 842, we will carry forward our current assessments of whether a contract
contains a lease, lease classification, remaining lease terms and amounts capitalized as initial direct costs.
While we are continuing to assess all potential impacts of the new standard, we anticipate that the initial
application of the new standard will have a material impact on our consolidated balance sheet. We
currently estimate that at February 1, 2019 we will recognize right-of-use assets and lease liabilities of
approximately $10.5 to $11.5 million. Following transition, we anticipate that the standard will not have
a material impact on either our consolidated statement of operations or our consolidated statement of
cash flows.
In June 2016, the FASB issued Accounting Standards Update 2016-13, “Financial Instruments – Credit
Losses (Topic 326): Measurement of Credit Losses on Financial Instruments” (“ASU 2016-13”). ASU 2016-
13 requires measurement and recognition of expected credit losses for financial assets held. ASU 2016-
13 is effective for annual periods, and interim periods within those annual periods, beginning after
December 15, 2019, which will be our fiscal year beginning February 1, 2020 (fiscal 2021). Early adoption
is permitted. The Company will adopt this guidance in the first quarter of fiscal 2021 and is currently
evaluating the impact that the adoption will have on its results of operations, financial position and
disclosures.
In January 2017, the FASB issued Accounting Standards Update 2017-04, “Intangibles – Goodwill and
Other (Topic 350): Simplifying the Test for Goodwill Impairment” (“ASU 2017-04”). ASU 2017-04
simplifies how an entity is required to test goodwill for impairment. ASU 2017-04 is effective for annual
periods, and interim periods within those annual periods, beginning after December 15, 2019, which will
be our fiscal year beginning February 1, 2020 (fiscal 2021). Early adoption is permitted. The Company will
adopt this guidance in the first quarter of fiscal 2021. The adoption of this amendment is not expected to
have a material impact on our results of operations or disclosures.
In August 2018, the FASB issued Accounting Standards Update 2018-15, “Intangibles – Goodwill and
Other – Internal-Use Software (Subtopic 350-40): Customer’s Accounting for Implementation Costs
Incurred in a Cloud Computing Arrangement That Is a Service Contract” (“ASU 2018-15”). ASU 2018-15
aligns the requirements for capitalizing implementation costs incurred in a hosting arrangement that is a
service contract with the requirements for capitalizing implementation costs incurred to develop or
obtain internal-use software. ASU 2018-15 is effective for annual periods, and interim periods within those
annual periods, beginning after December 15, 2019, which will be our fiscal year beginning February 1,
2020 (fiscal 2021). Early adoption is permitted. The Company will adopt this guidance in the first quarter
of fiscal 2021. The adoption of this amendment is not expected to have a material impact on our results
of operations or disclosures.
CONTROLS AND PROCEDURES
Under the supervision and with the participation of our management, including our Chief Executive Officer
and Chief Financial Officer, management evaluated our disclosure controls and procedures (as defined in
National Instrument 52-109 Certification of Disclosure in Issuers’ Annual and Interim Filings) as of January
31, 2019. Based upon that evaluation, our Chief Executive Officer and Chief Financial Officer concluded
that our disclosure controls and procedures were effective.

30
Under the supervision and with the participation of our management, including our Chief Executive Officer
and Chief Financial Officer, management assessed the effectiveness of our internal control over financial
reporting (as defined in National Instrument 52-109 Certification of Disclosure in Issuers’ Annual and
Interim Filings) as of January 31, 2019, based on criteria established in “Internal Control – Integrated
Framework” (2013), issued by the Committee of Sponsoring Organizations of the Treadway Commission.
Based on the assessment, our Chief Executive Officer and Chief Financial Officer concluded that, as of
January 31, 2019, our internal control over financial reporting was effective.
During the period beginning on November 1, 2018 and ended on January 31, 2019, no changes were
made to the Company’s internal control over financial reporting that have materially affected, or are
reasonably likely to materially affect, the Company’s internal control over financial reporting.
TRENDS / BUSINESS OUTLOOK
This section discusses our outlook for fiscal 2020 and in general as of the date of this MD&A and contains
forward-looking statements.
Our business may be impacted from time to time by the general cyclical and seasonal nature of particular
modes of transportation and the freight market in general, as well as the cyclical and seasonal nature of
the industries that such markets serve. Factors which may create cyclical fluctuations in such modes of
transportation or the freight market in general include legal and regulatory requirements, timing of
contract renewals between our customers and their own customers, seasonal-based tariffs, vacation
periods applicable to particular shipping or receiving nations, weather-related events that impact shipping
in particular geographies and amendments to international trade agreements. Since some of our revenues
from particular products and services are tied to the volume of shipments being processed, adverse
fluctuations in the volume of global shipments or shipments in any particular mode of transportation may
adversely affect our revenues. Significant declines in shipment volumes could likely have a material
adverse effect on our business.
Industry consolidation, rapid technological change and frequent new product introductions and
enhancements continue to characterize the software and services industries – particularly for logistics
management technology companies. Organizations are increasingly requiring greater levels of
functionality and more sophisticated product offerings from their software and services providers.
Increased importance is being placed on leveraging cloud-based technology to better manage logistics
processes and to connect and collaborate with trading partners on a global basis, as well as to reuse and
share supply chain data in order to accelerate time-to-value. Cloud-based technology also enables
business networks to more easily unite and integrate services provided by a broad range of partners and
technology alliances to extend functionality and further enhance collaboration between business
communities. As a result, we believe there is a trend away from using manual and paper-based supply
chain and logistics processes towards electronic processes powered by the exchange of electronic
information between logistics and supply chain participants.
Accordingly, we expect that our future success will be dependent upon our ability to enhance current
products or develop and introduce new products offering enhanced performance and new functionality at
competitive prices. In particular, we believe customers are looking for end-to-end solutions that combine
a multi-modal, multi-process network with business document exchange and wireless mobile resource
management (“MRM”) applications with end-to-end global trade compliance, trade content and
collaborative supply chain execution applications. These applications include freight bookings, contract
and rate management, classification of goods for tariff and duty purposes, sanctioned party screening, customs filings and electronic shipment manifest processes, transportation management, routing and
scheduling, purchase order to dock door processes, and inventory visibility.
31
We believe there is a continued acceptance of subscription pricing and SaaS business models in the
markets we serve that provide lower up-front cost and easier-to-maintain alternatives than may be
available through traditional perpetual license pricing models. In fiscal 2019, our services revenues
comprised 88% of our total revenues, with the balance being license, professional services and other
revenues. We expect that our focus in fiscal 2020 will remain on generating services revenues, primarily
by promoting the use of our GLN (including customs compliance services) and the migration of customers
using our legacy license-based products to our services-based architecture. We anticipate maintaining the
flexibility to license our products to those customers who prefer to buy the products in that fashion and
the composition of our revenues in any one quarter will be impacted by the buying preferences of our
customers.
We have significant contracts with our license customers for ongoing support and maintenance, as well as
significant service contracts which provide us with recurring services revenues. After their initial term, our
service contracts are generally renewable at a customer’s option, and there are generally no mandatory
payment obligations or obligations to license additional software or subscribe for additional services. For
fiscal 2020, based on our historic experience, we anticipate that over a one-year period we may lose
approximately 4% to 6% of our aggregate annualized recurring revenues in the ordinary course.
We internally measure and manage our “baseline calibration,” a non-GAAP financial measure, which we
define as the difference between our “baseline revenues” and “baseline operating expenses”. We define
our “baseline revenues,” a non-GAAP financial measure, as our visible, recurring and contracted revenues.
Baseline revenues are not a projection of anticipated total revenues for a period as they exclude any
anticipated or expected new sales for a period beyond the date that the baseline revenues are measured.
We define our “baseline operating expenses,” a non-GAAP financial measure, as our total expenses less
interest, investment income, taxes, depreciation and amortization, stock-based compensation (for which
we include related costs and taxes), acquisition-related costs and restructuring charges. Baseline
operating expenses are not a projection of anticipated total expenses for a period as they exclude any
expenses associated with anticipated or expected new sales for a period beyond the date that the baseline
expenses are measured. Our baseline calibration is not a projection of net income for a period as
determined in accordance with GAAP, or adjusted earnings before interest, taxes, depreciation and
amortization for a period as it excludes anticipated or expected new sales for a period beyond the date
that the baseline calibration is measured, excludes any costs of goods sold or other expenses associated
with such new sales, and excludes the expenses identified as excluded in the definition of “baseline
operating expenses,” above. We calculate and disclose “baseline revenues,” “baseline operating expenses”
and “baseline calibration” because management uses these metrics in determining its planned levels of
expenditures for a period and we believe this information is useful to our investors. However, because
these metrics are limited estimated operating metrics that do not have comparable GAAP measures, we
are unable to provide quantitative reconciliations of these measures to GAAP measures without
unreasonable efforts and accordingly are omitting this information. These metrics are estimated operating
metrics and not projections, nor actual financial results, and are not indicative of current or future
performance. These metrics do not have a standardized meaning prescribed by GAAP and are unlikely to
be comparable to similarly-titled metrics used by other companies and are not a replacement or proxy for
any GAAP measure. At February 12, 2019, using foreign exchange rates of $0.75 to CAD $1.00, $1.13 to
EUR 1.00 and $1.34 to £1.00, we estimated that our baseline revenues for the first quarter of 2020 are
approximately $74.0 million and our baseline operating expenses are approximately $51.8 million. We
consider this to be our baseline calibration of approximately $22.2 million for the first quarter of 2020, or
approximately 30% of our baseline revenues as at February 12, 2019.
We estimate that aggregate amortization expense for existing intangible assets will be $38.8 million for
2020, $35.3 million for 2021, $31.1 million for 2022, $23.7 million for 2023, $12.3 million for 2024 and
$35.0 million thereafter. Expected future amortization expense is based on the level of existing intangibles
at January 31, 2019, is subject to fluctuations in foreign exchange rates and assumes no future
adjustments or impairment of existing intangible assets.

32
We anticipate that stock-based compensation expense for fiscal 2020 for grants outstanding as at January
31, 2019 will be approximately $2.8 to $3.0 million, subject to any necessary adjustments resulting from
actual stock-based compensation forfeitures and fluctuations in foreign exchange rates.
We performed our annual goodwill impairment tests in accordance with ASC Topic 350, “Intangibles –
Goodwill and Other” (“ASC Topic 350”) as at October 31, 2018 and determined that there was no evidence
of impairment. We are currently scheduled to perform our next annual impairment test during the third
quarter of fiscal 2020. We will continue to perform quarterly analyses of whether any event has occurred
that would more likely than not reduce our enterprise value below our carrying amounts and, if so, we will
perform a goodwill impairment test between the annual dates. The likelihood of any future impairment
increases if our public market capitalization is adversely impacted by global economic, capital market or
other conditions for a sustained period of time. Any future impairment adjustment will be recognized as
an expense in the period that such adjustment is identified.
In fiscal 2019, capital expenditures were $5.2 million or 2% of revenues, as we continue to invest in
computer equipment and software to support our network and build out our infrastructure. We anticipate
that we will incur approximately $6.0 to $8.0 million in capital expenditures in fiscal 2020 primarily related
to investments in our network and security infrastructure.
We conduct business in a variety of foreign currencies and, as a result, our foreign operations are subject
to foreign exchange fluctuations. Our businesses operate in their local currency environment and use their
local currency as their functional currency. Assets and liabilities of foreign operations are translated into
US dollars at the exchange rate in effect at the balance sheet date. Revenues and expenses of foreign
operations are translated using daily exchange rates. Translation adjustments resulting from this process
are accumulated in other comprehensive income (loss) as a separate component of shareholders’ equity.
Transactions incurred in currencies other than the functional currency are converted to the functional
currency at the transaction date. All foreign currency transaction gains and losses are included in net
income. Some of our cash is held in foreign currencies. We currently have no specific hedging program in
place to address fluctuations in international currency exchange rates. We can make no accurate prediction
of what will happen with international currency exchange rates going forward. However, if the US dollar
was to weaken in comparison to foreign currencies, then we anticipate this will increase the expenses of
our business and have a negative impact on our results of operations. By way of illustration, 69% of our
revenues in the fourth quarter of fiscal 2019 were in US dollars, 15% in euro, 7% in Canadian dollars, 3%
in British pound sterling, and the balance in mixed currencies, while 49% of our operating expenses were
in US dollars, 17% in euro, 20% in Canadian dollars, 3% in British pound sterling, and the balance in
mixed currencies.
Our tax expense for a period is difficult to predict as it depends on many factors, including the actual
jurisdictions in which income is earned, the tax rates in those jurisdictions, the amount of deferred tax
assets relating to the jurisdictions and the valuation allowances relating to those tax assets. We can
provide no assurance as to the timing or amounts of any income tax expense or recovery, nor can we
provide any assurance that our current valuation allowance for deferred tax assets will not need to be
adjusted further.
We anticipate that our effective tax rate will be approximately 23% to 26% in fiscal 2020.
We intend to continue to actively explore business combinations to add complementary services, products
and customers to our existing businesses. We also intend to continue to focus our acquisition activities on
companies that are targeting the same customers as us and processing similar data and, to that end, we
listen to our customers’ suggestions as they relate to acquisition opportunities. Depending on the size and
scope of any business combination, or series of business combinations, we may choose or need to use our
existing credit facility or need to raise additional debt or equity capital. However, there can be no assurance
that we will be able to undertake such a financing transaction. If we use debt in connection with acquisition
activity, we will incur additional interest expense from the date of the draw under such facility.

33
Certain future commitments are set out above in the section of this MD&A called “Commitments,
Contingencies and Guarantees”. We believe that we have sufficient liquidity to fund our current operating
and working capital requirements, including the payment of these commitments.
CERTAIN FACTORS THAT MAY AFFECT FUTURE RESULTS
Any investment in us will be subject to risks inherent to our business. Before making an investment
decision, you should carefully consider the risks described below together with all other information
included in this report. The risks and uncertainties described below are not the only ones facing us.
Additional risks and uncertainties that we are not aware of or have not focused on, or that we currently
deem immaterial, may also impair our business operations. This report is qualified in its entirety by these
risk factors.
If any of the risks actually occur, they could materially adversely affect our business, financial condition,
liquidity or results of operations. In that case, the trading price of our securities could decline and you
may lose all or part of your investment.
We may have difficulties identifying, successfully integrating or maintaining or growing our
acquired businesses.
Businesses that we acquire may sell products or services that we have limited experience operating or
managing. We may experience unanticipated challenges or difficulties identifying suitable acquisition
candidates, integrating their businesses into our company, maintaining these businesses at their current
levels or growing these businesses. Factors that may impair our ability to identify, successfully integrate,
maintain or grow acquired businesses may include, but are not limited to:
• Challenges identifying suitable businesses to buy and negotiating the acquisition of those
businesses on acceptable terms;
• Challenges completing the acquisitions within our expected time frames and budgets;
• Challenges in integrating acquired businesses with our business;
• Loss of customers of the acquired business;
• Loss of key personnel from the acquired business, such as former executive officers or key
technical personnel;
• Non-compatible business cultures;
• For regulatory compliance businesses, changes in government regulations impacting electronic
regulatory filings or import/export compliance, including changes in which government
agencies are responsible for gathering import and export information;
• Difficulties in gaining necessary approvals in international markets to expand acquired
businesses as contemplated;
• Our inability to obtain or maintain necessary security clearances to provide international
shipment management services;
• Our failure to make appropriate capital investments in infrastructure to facilitate growth; and
• Other risk factors identified in this report.
We may fail to properly respond to any of these risks, which may have a material adverse effect on our
business results.
Investments in acquisitions and other business initiatives involve a number of risks that could
harm our business.
We have in the past acquired, and in the future, expect to seek to acquire, additional products, services,
customers, technologies and businesses that we believe are complementary to ours. For example, in fiscal
2020 we acquired Visual Compliance. In fiscal 2019, we acquired Aljex, Velocity Mail and PinPoint. In fiscal
2018, we acquired ShipRush, PCSTrac and MacroPoint. In fiscal 2017, we acquired Pixi, Appterra, 4Solutions and Datamyne. We’re unable to predict whether or when we will be able to identify any
appropriate products, technologies or businesses for acquisition, or the likelihood that any potential

34
acquisition will be available on terms acceptable to us or will be completed. We also, from time to time,
take on investments in other business initiatives, such as the implementation of new systems or purchase
of marketable securities.
Acquisitions and other business initiatives involve a number of risks, including: substantial investment of
funds, diversion of management’s attention from current operations; additional demands on resources,
systems, procedures and controls; and disruption of our ongoing business. Acquisitions specifically involve
risks, including: difficulties in integrating and retaining all or part of the acquired business, its customers
and its personnel; assumption of disclosed and undisclosed liabilities; dealing with unfamiliar laws,
customs and practices in foreign jurisdictions; and the effectiveness of the acquired company’s internal
controls and procedures. In addition, we may not identify all risks or fully assess risks identified in
connection with an investment. As well, by investing in such initiatives, we may deplete our cash resources
or dilute our shareholder base by issuing additional shares. Furthermore, for acquisitions, there is a risk
that our valuation assumptions, customer retention expectations and our models for an acquired product
or business may be erroneous or inappropriate due to foreseen or unforeseen circumstances and thereby
cause us to overvalue an acquisition target. There is also a risk that the contemplated benefits of an
acquisition or other investment may not materialize as planned or may not materialize within the time
period or to the extent anticipated. The individual or combined effect of these risks could have a material
adverse effect on our business.
System or network failures, information security breaches or other cyber-security threats in
connection with our services and products could reduce our sales, impair our reputation,
increase costs or result in liability claims, and seriously harm our business.
We rely on information technology networks and systems to process, transmit and store electronic
information. Any disruption to our services and products, our own information systems or communications
networks or those of third-party providers on which we rely as part of our own product offerings could
result in the inability of our customers to receive our products for an indeterminate period of time. Our
ability to deliver our products and services depends on the development and maintenance of internet
infrastructure by third parties. This includes maintenance of reliable networks with the necessary security,
speed, data capacity and bandwidth. While our services are designed to operate without interruption, we
have experienced, and may in the future experience, interruptions and delays in services and availability
from time to time. In the event of a catastrophic event with respect to one or more of our systems, we
may experience an extended period of system unavailability, which could negatively impact our
relationship with customers. Our services and products may not function properly for reasons which may
include, but are not limited to, the following:
• System or network failure;
• Software errors, failures and crashes;
• Interruption in the supply of power;
• Virus proliferation or malware;
• Communications failures;
• Information or infrastructure security breaches;
• Insufficient investment in infrastructure;
• Earthquakes, fires, floods, natural disasters, or other force majeure events outside our control;
and
• Acts of war, sabotage, cyber-attacks, denial-of-service attacks and/or terrorism.
In addition, any disruption to the availability of customer information, or any compromise to the integrity
or confidentiality of customer information in our systems or networks, or the systems or networks of third
parties on which we rely, could result in our customers being unable to effectively use our products or
services or being forced to take mitigating actions to protect their information. Back-up and redundant
systems may be insufficient or may fail and result in a disruption of availability of our products or services
to our customers or the integrity or availability of our customers’ information.
Some jurisdictions have enacted laws requiring companies to notify individuals of data security breaches
involving certain types of personal data and in some cases our agreements with certain customers require
us to notify them in the event of a security incident. Such mandatory disclosures could lead to negative

35
publicity and may cause our current and prospective customers to lose confidence in the effectiveness of
our data security measures. Moreover, if a high-profile security breach occurs with respect to another
SaaS provider, customers may lose trust in the security of the SaaS business model generally, which could
adversely impact our ability to retain existing customers or attract new ones.
Any actual or perceived threat of disruption to our services or any compromise of customer information
could impair our reputation and cause us to lose customers or revenue, or face litigation, necessitate
customer service or repair work that would involve substantial costs and distract management from
operating our business. Despite the implementation of advanced threat protection, information and
network security measures and disaster recovery plans, our systems and those of third parties on which
we rely may be vulnerable. If we are unable (or are perceived as being unable) to prevent, or promptly
identify and remedy, such outages and breaches, our operations may be disrupted, our business
reputation could be adversely affected, and there could be a negative impact on our financial condition
and results of operations.
Our existing customers might cancel contracts with us, fail to renew contracts on their renewal
dates, and/or fail to purchase additional services and products, and we may be unable to
attract new customers.
We depend on our installed customer base for a significant portion of our revenues. We have significant
contracts with our license customers for ongoing support and maintenance, as well as significant service
contracts that provide recurring services revenues to us. In addition, our installed customer base has
historically generated additional new license and services revenues for us. Service contracts are generally
renewable at a customer’s option and/or subject to cancellation rights, and there are generally no
mandatory payment obligations or obligations to license additional software or subscribe for additional
services.
If our customers fail to renew their service contracts, fail to purchase additional services or products, or
we are unable to attract new customers, then our revenues could decrease and our operating results could
be adversely affected. Factors influencing such contract terminations could include changes in the financial
circumstances of our customers, dissatisfaction with our products or services, our retirement or lack of
support for our legacy products and services, our customers selecting or building alternate technologies
to replace us, the cost of our products and services as compared to the cost of products and services
offered by our competitors, our ability to attract, hire and maintain qualified personnel to meet customer
needs, consolidating activities in the market, and changes in our customers’ business or in regulation
impacting our customers’ business that may no longer necessitate the use of our products or services,
general economic or market conditions, or other reasons. Further, our customers could delay or terminate
implementations or use of our services and products or be reluctant to migrate to new products. Such
customers will not generate the revenues we may have anticipated within the timelines anticipated, if at
all, and may be less likely to invest in additional services or products from us in the future. We may not
be able to adjust our expense levels quickly enough to account for any such revenue losses. In addition,
loss of one or more of our key customers could adversely impact our competitive position in the
marketplace and hurt our credibility and ability to attract new customers.
Our success depends on our ability to continue to innovate and to create new solutions and
enhancements to our existing products
We may not be able to develop and introduce new solutions and enhancements to our existing products
that respond to new technologies or shipment regulations on a timely basis. If we are unable to develop
and sell new products and new features for our existing products that keep pace with rapid technological
and regulatory change as well as developments in the transportation logistics industry, our business,
results of operations and financial condition could be adversely affected. We intend to continue to invest
significant resources in research and development to enhance our existing products and services and
introduce new high-quality products that customers will want. If we are unable to predict or quickly react
to user preferences or changes in the transportation logistics industry, or its regulatory requirements, or if we are unable to modify our products and services on a timely basis or to effectively bring new products
to market, our sales may suffer.

36
In addition, we may experience difficulties with software or hardware development, design, integration
with third-party software or hardware, or marketing that could delay or prevent our introduction,
deployment or implementation of new solutions and enhancements. The introduction of new solutions by
competitors, the emergence of new industry standards or the development of entirely new technologies
to replace existing offerings could render our existing or future solutions obsolete.
We may not have sufficient resources to make the necessary investments in software development and
our technical infrastructure, and we may experience difficulties that could delay or prevent the successful
development, introduction or marketing of new products or enhancements. In addition, our products or
enhancements may not meet increasingly complex customer requirements or achieve market acceptance
at the rate we expect, or at all. Any failure by us to anticipate or respond adequately to technological
advancements, customer requirements and changing industry standards, or any significant delays in the
development, introduction or availability of new products or enhancements, could undermine our current
market position and negatively impact our business, results of operations or financial condition.
Disruptions in the movement of freight could negatively affect our revenues.
Our business is highly dependent on the movement of freight from one point to another since we generate
transaction revenues as freight is moved by, to or from our customers. If there are disruptions in the
movement of freight, proper reporting or the overall volume of international shipments, whether as a
result of labor disputes, weather or natural disaster, terrorist events, political instability, changes in cross
border trade agreements, contagious illness outbreaks, or otherwise, then the traffic volume on our Global
Logistics Network will be impacted and our revenues will be adversely affected. As these types of freight
disruptions are generally unpredictable, there can be no assurance that our business, results of operations
and financial condition will not be adversely affected by such events.
We may not remain competitive. Increased competition could seriously harm our business.
The market for supply chain technology is highly competitive and subject to rapid technological change.
We expect that competition will increase in the future. To maintain and improve our competitive position,
we must continue to develop and introduce in a timely and cost-effective manner new products, product
features and services to keep pace with our competitors. We currently face competition from a large
number of specific market entrants, some of which are focused on specific industries, geographic regions
or other components of markets we operate in.
Current and potential competitors include supply chain application software vendors, customers that
undertake internal software development efforts, value-added networks and business document
exchanges, enterprise resource planning software vendors, regulatory filing companies, trade data
vendors and general business application software vendors. Many of our current and potential competitors
may have one or more of the following relative advantages:
• Established relationships with existing customers or prospects that we are targeting;
• Superior product functionality and industry-specific expertise;
• Broader range of products to offer and better product life cycle management;
• Larger installed base of customers;
• Greater financial, technical, marketing, sales, distribution and other resources;
• Better performance;
• Lower cost structure and more profitable operations;
• Greater investment in infrastructure;
• Greater worldwide presence;
• Early adoption of, or adaptation to changes in, technology; or
• Longer operating history; and/or greater name recognition.
Further, current and potential competitors have established, or may establish, cooperative relationships
and business combinations among themselves or with third parties to enhance their products, which may
result in increased competition. In addition, we expect to experience increasing price competition and competition surrounding other commercial terms as we compete for market share. In particular, larger
competitors or competitors with a broader range of services and products may bundle their products,

37
rendering our products more expensive and/or less functional. As a result of these and other factors, we
may be unable to compete successfully with our existing or new competitors.
If we fail to attract and retain key personnel, it would adversely affect our ability to develop
and effectively manage our business.
Our performance is substantially dependent on the performance of our highly qualified management,
technical expertise, and sales and marketing personnel, which we regard as key individuals to our
business. We do not maintain life insurance policies on any of our employees that list Descartes as a loss
payee. Our success is highly dependent on our ability to identify, hire, train, motivate, promote, and retain
key individuals. Significant competition exists for management and skilled personnel. If we fail to cross
train key employees, particularly those with specialized knowledge it could impair our ability to provide
consistent and uninterrupted service to our customers. If we are not able to attract, retain or establish an
effective succession planning program for key individuals it could have a material adverse effect on our
business, results of operations, financial condition and the price of our common shares.
We have in the past, and may in the future, make changes to our executive management team or board
of directors. There can be no assurance that any such changes and the resulting transition will not have a
material adverse effect on our business, results of operations, financial condition and the price of our
common shares.
General economic conditions may affect our results of operations and financial condition.
Demand for our products depends in large part upon the level of capital and operating expenditures by
many of our customers. Decreased capital and operational spending could have a material adverse effect
on the demand for our products and our business, results of operations, cash flow and overall financial
condition. Disruptions in the financial markets may adversely impact the availability of credit already
arranged and the availability and cost of credit in the future, which could result in the delay or cancellation
of projects or capital programs on which our business depends. In addition, disruptions in the financial
markets may also have an adverse impact on regional economies or the world economy, which could
negatively impact the capital and operating expenditures of our customers. These conditions may reduce
the willingness or ability of our customers and prospective customers to commit funds to purchase our
products and services, or their ability to pay for our products and services after purchase.
Changes in government filing or screening requirements for global trade may adversely impact
our business.
Our regulatory compliance services help our customers comply with government filing and screening
requirements relating to global trade. The services that we offer may be impacted, from time to time, by
changes in these requirements, including potential future changes as a consequence of Brexit or the
ratification of the Canada-United States-Mexico Agreement. Changes in requirements that impact
electronic regulatory filings or import/export compliance, including changes adding or reducing filing
requirements, changes in enforcement practices or changes in the government agency responsible for
such requirements could adversely impact our business, results of operations and financial condition.
Emergence or increased adoption of alternative sources for trade data may adversely impact
our business.
With recent acquisitions in the area of supplying trade data and content, an increasing portion of our
business relates to the supply of trade data and content that is often used by our customers in other
systems, such as enterprise resource planning systems. Emergence or increased adoption of alternative
sources of this data and content could have an adverse impact on our customers’ needs to obtain this
data and content from us and/or the need for certain of the third-party system vendors in this field to

38
refer customers to us for this data and content, each of which could adversely impact upon the revenues
and income we generate from these areas of our business.
If we need additional capital in the future and are unable to obtain it or can only obtain it on
unfavorable terms, our operations may be adversely affected, and the market price for our
securities could decline.
Historically, we have financed our operations primarily through cash flows from our operations, the sale
of our equity securities and borrowing under our credit facility. In addition to our current cash and available
debt facilities, we may need to raise additional debt or equity capital to repay existing debt, fund expansion
of our operations, to enhance our services and products, or to acquire or invest in complementary
products, services, businesses or technologies. However, there can be no assurance that we will be able
to undertake incremental financing transactions. If we raise additional funds through further issuances of
convertible debt or equity securities, our existing shareholders could suffer significant dilution and any
new equity securities we issue could have rights, preferences and privileges superior to those attaching
to our common shares. Our current credit facility contains, and any debt financing secured by us in the
future could contain restrictive covenants relating to our capital-raising activities and other financial and
operational matters, which may make it more difficult for us to obtain additional capital and to pursue
business opportunities, including potential acquisitions. In addition, we may not be able to obtain
additional financing on terms favorable to us, if at all. If adequate funds are not available on terms
favorable or at all, our operations and growth strategy may be adversely affected and the market price
for our common shares could decline.
Changes in the value of the U.S. dollar, as compared to the currencies of other countries where
we transact business, could harm our operating results and financial condition.
Historically, the largest percentage of our revenues has been denominated in U.S. dollars. However, the
majority of our international expenses, including the wages of our non-U.S. employees and certain key
supply agreements, have been denominated in Canadian dollars, euros and other foreign currencies.
Therefore, changes in the value of the U.S. dollar as compared to the Canadian dollar, the euro and other
foreign currencies may materially affect our operating results. We generally have not implemented
hedging programs to mitigate our exposure to currency fluctuations affecting international accounts
receivable, cash balances and inter-company accounts. We also have not hedged our exposure to currency
fluctuations affecting future international revenues and expenses and other commitments. Accordingly,
currency exchange rate fluctuations have caused, and may continue to cause, variability in our foreign
currency denominated revenue streams, expenses, and our cost to settle foreign currency denominated
liabilities.
We may have exposure to greater than anticipated tax liabilities or expenses.
We are subject to income and non-income taxes in various jurisdictions and our tax structure is subject
to review by both domestic and foreign taxation authorities and currently has tax audits open in a number
of jurisdictions in which we operate. On a quarterly basis, we assess the status of these audits and the
potential for adverse outcomes to determine whether a provision for income and other taxes is
appropriate. The timing of the resolution of income tax audits is highly uncertain, and the amounts
ultimately paid, if any, upon resolution of the issues raised by the taxing authorities may differ from any
amounts that we accrue from time to time. The actual amount of any change could vary significantly
depending on the ultimate timing and nature of any settlements. We cannot currently provide an estimate
of the range of possible outcomes.
The determination of our worldwide provision for income taxes and other tax liabilities requires significant
judgment. In the ordinary course of a global business, there are many transactions and calculations where
the ultimate tax outcome is uncertain. Any audit of our tax filings could materially change the amount of
current and deferred income tax assets and liabilities. We have recorded a valuation allowance against a
portion of our net deferred tax assets. If we achieve a consistent level of profitability, the likelihood of
further reducing our deferred tax valuation allowance for some portion of the losses incurred in prior periods in one of our jurisdictions will increase. We calculate our current and deferred tax provision based
on estimates and assumptions that could differ from the actual results reflected in income tax returns filed
during subsequent years. Adjustments based on filed returns are generally recorded in the period when

39
the tax returns are filed and the global tax implications are known. Our estimate of the potential outcome
for any uncertain tax issue is based on a number of assumptions. Any further changes to the valuation
allowance for our deferred tax assets would also result in an income tax recovery or income tax expense,
as applicable, on the consolidated statements of operations in the period in which the valuation allowance
is changed.
Changes to earnings resulting from past acquisitions may adversely affect our operating
results.
Under ASC Topic 805, “Business Combinations”, we allocate the total purchase price to an acquired
company’s net tangible assets, intangible assets and in-process research and development based on their
values as of the date of the acquisition (including certain assets and liabilities that are recorded at fair
value) and record the excess of the purchase price over those values as goodwill. Management’s estimates
of fair value are based upon assumptions believed to be reasonable but which are inherently uncertain.
After we complete an acquisition, the following factors, among others, could result in material charges
that would adversely affect our operating results and may adversely affect our cash flows:
• Impairment of goodwill or intangible assets;
• A reduction in the useful lives of intangible assets acquired;
• Identification of assumed contingent liabilities after we finalize the purchase price allocation
period;
• Charges to our operating results to eliminate certain pre-merger activities that duplicate those
of the acquired company or to reduce our cost structure; and
• Charges to our operating results resulting from revised estimates to restructure an acquired
company’s operations after we finalize the purchase price allocation period.
Routine charges to our operating results associated with acquisitions include amortization of intangible
assets, acquisition-related costs and restructuring charges. Acquisition-related costs primarily include
retention bonuses, advisory services, brokerage services and administrative costs with respect to
completed and prospective acquisitions.
We expect to continue to incur additional costs associated with combining the operations of our acquired
companies, which may be substantial. Additional costs may include costs of employee redeployment,
relocation and retention, including salary increases or bonuses, accelerated stock-based compensation
expenses and severance payments, reorganization or closure of facilities, taxes, and termination of
contracts that provide redundant or conflicting services. These costs would be accounted for as expenses
and would decrease our net income and earnings per share for the periods in which those adjustments
are made.
As we continue to increase our international operations we increase our exposure to
international business risks that could cause our operating results to suffer.
While our headquarters are in Canada, we currently have direct operations in the U.S., EMEA, Asia Pacific
and South American regions. We anticipate that these international operations will continue to require
significant management attention and financial resources to localize our services and products for delivery
in these markets, to develop compliance expertise relating to international regulatory agencies, and to
develop direct and indirect sales and support channels in those markets. We face a number of risks
associated with conducting our business internationally that could negatively impact our operating results.
These risks include, but are not limited to:
• Longer collection time from foreign clients, particularly in the EMEA region and the Asia Pacific
region;
• Difficulty in repatriating cash from certain foreign jurisdictions;
• Language barriers, conflicting international business practices, and other difficulties related to
the management and administration of a global business;
• Increased management, travel, infrastructure and legal compliance costs associated with
having international operations; • Difficulties and costs of staffing and managing geographically disparate direct and indirect
operations;
• Volatility or fluctuations in foreign currency and tariff rates;

40
• Multiple, and possibly overlapping, tax structures;
• Complying with complicated and widely differing global laws and regulations in areas such as
employment, tax, privacy and data protection;
• Trade restrictions;
• Enhanced security procedures and requirements relating to certain jurisdictions;
• The need to consider characteristics unique to technology systems used internationally;
• Economic or political instability in some markets; and
• Other risk factors set out herein.
Increases in fuel prices and other transportation costs may have an adverse effect on the
businesses of our customers resulting in them spending less money with us.
Our customers are all involved, directly or indirectly, in the delivery of goods from one point to another,
particularly transportation providers and freight forwarders. As the costs of these deliveries become more
expensive, whether as a result of increases in fuel costs or otherwise, our customers may have fewer
funds available to spend on our products and services. There can be no assurance that these companies
will be able to allocate sufficient funds to use our products and services. In addition, rising fuel costs may
cause global or geographic-specific reductions in the number of shipments being made, thereby impacting
the number of transactions being processed by our Global Logistics Network and our corresponding
network revenues.
We may not be able to compensate for downward pricing pressure on certain products and
services by increased volumes of transactions or increased prices elsewhere in our business,
ultimately resulting in lower revenues.
Some of our products and services are sold to industries where there is downward pricing pressure on the
particular product or service due to competition, general industry conditions or other causes. If we cannot
offset any such downward pricing pressure, then the particular customer may generate less revenue for
our business or we may have less aggregate revenue. This could have an adverse impact on our operating
results.
From time to time, we may be subject to litigation or dispute resolution that could result in
significant costs to us and damage to our reputation.
From time to time, we may be subject to litigation or dispute resolution relating to any number or type of
claims, including claims for damages related to undetected errors or malfunctions of our services and
products or their deployment, claims related to previously-completed acquisition transactions or claims
relating to applicable securities laws. Litigation may seriously harm our business because of the costs of
defending the lawsuit, diversion of employees’ time and attention and potential damage to our reputation.
Further, our services and products are complex and often implemented by our customers to interact with
third-party technology or networks. Claims may be made against us for damages properly attributable to
those third-party technologies or networks, regardless of our lack of responsibility for any failure resulting
in a loss, even if our services and products perform in accordance with their functional specifications. We
may also have disputes with key suppliers for damages incurred which, depending on resolution of the
disputes, could impact the ongoing quality, price or availability of the services or products we procure
from the supplier. Limitation of liability provisions in certain third-party contracts may not be enforceable
under the laws of some jurisdictions. As a result, we could be required to pay substantial amounts of
damages in settlement or upon the determination of any of these types of claims, and incur damage to
our reputation and products. The likelihood of such claims and the amount of damages we may be required
to pay may increase as our customers increasingly use our services and products for critical business
functions, or rely on our services and products as the systems of record to store data for use by other
customer applications. Our insurance may not cover potential claims, or may not be adequate to cover all
costs incurred in defense of potential claims or to indemnify us for all liability that may be imposed. A
claim brought against us that is uninsured or underinsured could result in unanticipated costs, thereby
harming our operating results and leading analysts or potential investors to lower their expectations of our performance, which could reduce the trading price of our common shares.

41
Our success and ability to compete depend upon our ability to secure and protect patents,
trademarks and other proprietary rights.
We consider certain aspects of our internal operations, products, services and related documentation to
be proprietary, and we primarily rely on a combination of patent, copyright, trademark and trade secret
laws and other measures to protect our proprietary rights. Patent applications or issued patents, as well
as trademark, copyright, and trade secret rights may not provide adequate protection or competitive
advantage and may require significant resources to obtain and defend. We will also not be able to protect
our intellectual property if we are unable to enforce our rights or if we do not detect unauthorized use of
our intellectual property. Despite our precautions, it may be possible for unauthorized third parties to copy
our products and use information that we regard as proprietary to create products and services that
compete with ours. We also rely on contractual restrictions in our agreements with customers, employees,
outsourced developers and others to protect our intellectual property rights. There can be no assurance
that these agreements will not be breached, that we will have adequate remedies for any breach, or that
our patents, copyrights, trademarks or trade secrets will not otherwise become known. Through an escrow
arrangement, we have granted some of our customers a contingent future right to use our source code
for software products solely for their internal maintenance services. If our source code is accessed through
an escrow, the likelihood of misappropriation or other misuse of our intellectual property may increase.
Moreover, the laws of some countries do not protect proprietary intellectual property rights as effectively
as do the laws of the U.S. and Canada. Protecting and defending our intellectual property rights could be
costly regardless of venue. In order to protect our intellectual property rights, we may be required to
spend significant resources to monitor and protect these rights. The Company is currently involved in, and
expects to remain involved in, certain litigation to protect its intellectual property from infringement by
third parties. In addition, further litigation may be necessary in the future to enforce our intellectual
property rights, to protect our trade secrets, to determine the validity and scope of the intellectual property
rights of others or to defend against claims of infringement or invalidity. Litigation brought to protect and
enforce our intellectual property rights could be costly, time consuming and distracting to management
and could result in the impairment or loss of portions of our intellectual property. Furthermore, our efforts
to enforce our intellectual property rights may be met with defenses, counterclaims and countersuits
attacking the validity and enforceability of our intellectual property rights and/or exposing us to claims for
damages in any related counterclaims or countersuits. Our inability to protect our proprietary technology
against unauthorized copying or use, as well as any costly litigation or diversion of our management’s
attention and resources, could delay further sales or the implementation of our solutions, impair the
functionality of our solutions, delay introductions of new solutions, result in our substituting inferior or
more costly technologies into our solutions, or injure our reputation.
We are dependent on certain key vendors for the availability of telematics units, which could
impede our development and expansion.
We currently have relationships with a small number of telematics/mobile asset unit vendors over which
we have no operational or financial control and no influence in how these vendors conduct their businesses.
Suppliers of telematics/mobile asset units could among other things, extend delivery times, raise prices
and limit supply due to their own shortages and business requirements. Interruption in the supply of
equipment from these vendors could delay our ability to maintain, grow and expand our telematics
solutions business and those areas of our business that interact with telematics units. If our relationships
with any of these unit vendors were to terminate, there is no guarantee that our remaining unit vendors
would be able to handle the increased equipment supply required to maintain and grow our expansive
networks at our desired rates. There is also no guarantee that business relationships with other key unit
vendors could be entered into on terms desirable or favorable to us, if at all. Fewer key vendors might
mean that existing or potential customers are unable to meaningfully communicate using our Global
Logistics Network, which may cause existing and potential customers to move to competitors’ products.
Such equipment supply issues could adversely affect our business, results of operations and financial
condition.

42
Concerns about the environmental impacts of greenhouse gas emissions and global climate
change may result in environmental taxes, charges, regulatory schemes, assessments or
penalties, which could restrict or negatively impact our operations or reduce our profitability.
The impacts of human activity on global climate change have attracted considerable public and scientific
attention, as well as the attention of the U.S. and other governments. Efforts are being made to reduce
greenhouse gas emissions and energy consumption, including those from automobiles and other modes
of transportation. The added cost of any environmental regulation, taxes, charges, assessments or
penalties levied or imposed on our customers in light of these efforts could result in additional costs for
our customers, which could lead them to reduce use of our services. There are also a number of legislative
and environmental regulatory initiatives internationally that could restrict or negatively impact our
operations or increase our costs. Additionally, environmental regulation, taxes, charges, assessments or
penalties could be levied or imposed directly on us. Any enactment of laws or passage of regulations
regarding greenhouse gas emissions by Canada, the U.S., or any other jurisdiction we conduct our
business in, could adversely affect our operations and financial results.
The general cyclical and seasonal nature of the freight market may have a material adverse
effect on our business, results of operations and financial condition.
Our business may be impacted from time to time by the general cyclical and seasonal nature of particular
modes of transportation and the freight market in general, as well as the cyclical and seasonal nature of
the industries that such markets serve. Factors which may create cyclical fluctuations in such modes of
transportation or the freight market in general include legal and regulatory requirements, timing of
contract renewals between our customers and their own customers, seasonal-based tariffs, vacation
periods applicable to particular shipping or receiving nations, weather-related events that impact shipping
in particular geographies and amendments to international trade agreements. Since some of our revenues
from particular products and services are tied to the volume of shipments being processed, adverse
fluctuations in the volume of global shipments or shipments in any particular mode of transportation may
adversely affect our revenues. Declines in shipment volumes would likely have a material adverse effect
on our business.
If we are unable to generate broad market acceptance of our services, products and pricing,
serious harm could result to our business.
We currently derive substantially all of our revenues from our federated network and global logistics
technology solutions and expect to do so in the future. Broad market acceptance of these types of services
and products, and their related pricing, is therefore critical to our future success. The demand for, and
market acceptance of, our services and products is subject to a high level of uncertainty. Some of our
services and products are often considered complex and may involve a new approach to the conduct of
business by our customers. The market for our services and products may weaken, competitors may
develop superior services and products that perform logistics services on a global scale or within a
particular geographic region, or we may fail to develop or maintain acceptable services and products to
address new market conditions, governmental regulations or technological changes. Any one of these
events could have a material adverse effect on our business, results of operations and financial condition.
Claims that we infringe third-party proprietary rights could trigger indemnification obligations
and result in significant expenses or restrictions on our ability to provide our products or
services.
Competitors and other third parties have claimed, and in the future, may claim, that our current or future
services or products infringe their proprietary rights or assert other claims against us. Many of our
competitors have obtained patents covering products and services generally related to our products and
services, and they may assert these patents against us. Such claims, whether with or without merit, could
be time consuming and expensive to litigate or settle and could divert management attention from focusing
on our core business.
As a result of such a dispute, we may have to pay damages, incur substantial legal fees, suspend the sale
or deployment of our services and products, develop costly non-infringing technology, if possible, or enter
into license agreements, which may not be available on terms acceptable to us, if at all. Any of these

43
results would increase our expenses and could decrease the functionality of our services and products,
which would make our services and products less attractive to our current and/or potential customers. We
have agreed in some of our agreements, and may agree in the future, to indemnify other parties for any
expenses or liabilities resulting from claimed infringements of the proprietary rights of third parties. If we
are required to make payments pursuant to these indemnification agreements, such payments could have
a material adverse effect on our business, results of operations and financial condition.
Our results of operations may vary significantly from quarter to quarter and therefore may be
difficult to predict or may fail to meet investment community expectations.
Our results of operations may vary from quarter to quarter in the future due to a variety of factors, many
of which are outside of our control. Such factors include, but are not limited to:
• Volatility or fluctuations in foreign currency exchange rates;
• Volatility or fluctuations in interest rates;
• Timing of acquisitions and related costs;
• Timing of restructuring activities;
• The introduction of enhanced products and services from competitors;
• Our ability to introduce new products and updates to our existing products on a timely basis;
• The termination of any key customer contracts, whether by the customer or by us;
• Recognition and expensing of deferred tax assets;
• Legal costs incurred in bringing or defending any litigation with customers or third-party
providers, and any corresponding judgments or awards;
• Legal and compliance costs incurred to comply with regulatory requirements;
• Fluctuations in the demand for our services and products;
• The impact of stock-based compensation expense;
• Price and functionality competition in our industry;
• Changes in legislation and accounting standards;
• Our ability to satisfy contractual obligations in customer contracts and deliver services and
products to the satisfaction of our customers; and
• Other risk factors discussed in this report.
Although our revenues may fluctuate from quarter to quarter, significant portions of our expenses are not
variable in the short term, and we may not be able to reduce them quickly to respond to decreases in
revenues. If revenues are below expectations, this shortfall is likely to adversely and/or disproportionately
affect our operating results. If this occurs, the trading price of our common shares may fall substantially.
Privacy laws and regulations are extensive, open to various interpretations, complex to
implement and may reduce demand for our products, and failure to comply may impose
significant liabilities.
Our customers can use our products to collect, use, process and store information regarding their
transactions with their customers. Federal, state and foreign government bodies and agencies have been
increasingly adopting new laws and regulations regarding the collection, use, processing, storage and
disclosure of such information obtained from consumers and individuals. In addition to government
regulatory activity, privacy advocacy groups and the technology industry and other industries may
consider various new, additional or different self-regulatory standards that may place additional burdens
directly on our customers and target customers, and indirectly on us. Our products are expected to be
capable of use by our customers in compliance with such laws and regulations. The functional and
operational requirements and costs of compliance with such laws and regulations may adversely impact
our business, and failure to enable our products to comply with such laws and regulations could lead to
significant fines and penalties imposed by regulators, as well as claims by our customers or third parties.
Additionally, all of these domestic and international legislative and regulatory initiatives could adversely
affect our customers’ ability or desire to collect, use, process and store shipment logistics information,
which could reduce demand for our products.

44
The price of our common shares has in the past been volatile and may also be volatile in the
future.
The trading price of our common shares may be subject to fluctuation in the future. This may make it
more difficult for you to resell your common shares when you want at prices that you find attractive.
Increases in our common share price may also increase our compensation expense pursuant to our
existing director, officer and employee compensation arrangements. We enter into equity derivative
contracts including floating-rate equity forwards to partially offset the potential fluctuations of certain
share-based compensation expenses. Fluctuations in our common share price may be caused by events
unrelated to our operating performance and beyond our control. Factors that may contribute to
fluctuations include, but are not limited to:
• Revenue or results of operations in any quarter failing to meet the expectations, published or
otherwise, of the investment community;
• Changes in recommendations or financial estimates by industry or investment analysts;
• Changes in management or the composition of our board of directors;
• Outcomes of litigation or arbitration proceedings;
• Announcements of technological innovations or acquisitions by us or by our competitors;
• Introduction of new products or significant customer wins or losses by us or by our competitors;
• Developments with respect to our intellectual property rights or those of our competitors;
• Fluctuations in the share prices of other companies in the technology and emerging growth
sectors;
• General market conditions; and
• Other risk factors set out in this report.
If the market price of our common shares drops significantly, shareholders could institute securities class
action lawsuits against us, regardless of the merits of such claims. Such a lawsuit could cause us to incur
substantial costs and could divert the time and attention of our management and other resources from
our business.
Fair value assessments of our intangible assets required by GAAP may require us to record
significant non-cash charges associated with intangible asset impairment.
Significant portions of our assets, which include customer agreements and relationships, non-compete
covenants, existing technologies and trade names, are intangible. We amortize intangible assets on a
straight-line basis over their estimated useful lives. We review the carrying value of these assets at least
annually for evidence of impairment. In accordance with ASC Topic 360-10-35, “Property, Plant, and
Equipment: Overview: Subsequent Measurement” an impairment loss is recognized when the estimate of
undiscounted future cash flows generated by such assets is less than the carrying amount. Measurement
of the impairment loss is based on the present value of the expected future cash flows. Future fair value
assessments of intangible assets may require impairment charges to be recorded in the results of
operations for future periods. This could impair our ability to achieve or maintain profitability in the future.
If our common share price decreases to a level such that the fair value of our net assets is less
than the carrying value of our net assets, we may be required to record additional significant
non-cash charges associated with goodwill impairment.
We account for goodwill in accordance with ASC Topic 350, “Intangibles – Goodwill and Other”, which
among other things, requires that goodwill be tested for impairment at least annually. We have designated
October 31st for our annual impairment test. Should the fair value of our net assets, determined by our
market capitalization, be less than the carrying value of our net assets at future annual impairment test
dates, we may have to recognize goodwill impairment losses in our results of operations in future periods.
This could impair our ability to achieve or maintain profitability in the future.
We have a substantial accumulated deficit and may incur losses in the future. As at January 31,
2019, our accumulated deficit was $172.8 million, which has been accumulated from 2005 and prior fiscal periods. Although the Company has been profitable since 2005, there can be no assurance that we will
not incur losses again in the future. If we fail to maintain profitability, the market price of our common
shares may decline.

45
MANAGEMENT’S REPORT ON FINANCIAL STATEMENTS
AND INTERNAL CONTROL OVER FINANCIAL
REPORTING
Financial Statements
Management is responsible for the accompanying consolidated financial statements and all other
information in this Annual Report. These consolidated financial statements have been prepared in
accordance with US generally accepted accounting principles (“GAAP”) and necessarily include amounts
that reflect management’s judgment and best estimates. Financial information contained elsewhere in this
Annual Report is prepared on a basis consistent with the consolidated financial statements.
The Board of Directors carries out its responsibilities for the consolidated financial statements through its
Audit Committee, consisting solely of independent directors. The Audit Committee meets with
management and the independent auditors to review the consolidated financial statements and internal
controls as they relate to financial reporting. The Audit Committee reports its findings to the Board of
Directors for its consideration in approving the consolidated financial statements for issuance to
shareholders.
Internal Control Over Financial Reporting
Management is responsible for establishing and maintaining adequate internal control over financial
reporting. Internal control over financial reporting is a process designed by, or under the supervision of,
the Chief Executive Officer and Chief Financial Officer and effected by the Board of Directors, management
and other personnel to provide reasonable assurance regarding the reliability of financial reporting and
the preparation of financial statements for external purposes in accordance with GAAP.
Due to its inherent limitations, internal control over financial reporting may not prevent or detect
misstatements on a timely basis.
Under the supervision and with the participation of our management, including our Chief Executive Officer
and Chief Financial Officer, management assessed the effectiveness of our internal control over financial
reporting as of January 31, 2019, based on criteria established in “Internal Control – Integrated
Framework” (2013), issued by the Committee of Sponsoring Organizations of the Treadway Commission.
Based on the assessment, management concluded that, as of January 31, 2019, the design and operation
of our internal control over financial reporting was effective.
Management’s internal control over financial reporting as of January 31, 2019, has been audited by KPMG
LLP, Independent Registered Public Accounting Firm, who also audited our Consolidated Financial
Statements for the year ended January 31, 2019, as stated in the Report of Independent Registered Public
Accounting Firm, which expressed an unqualified opinion on the effectiveness of our internal control over
financial reporting as of January 31, 2019.
Changes in Internal Control Over Financial Reporting
During the fiscal year ended January 31, 2019, no changes were made to the Company’s internal control
over financial reporting that have materially affected, or are reasonably likely to materially affect, the
Company’s internal control over financial reporting.
‘Edward J. Ryan’
Edward J. Ryan
‘Allan Brett’
Allan Brett
Chief Executive Officer Chief Financial Officer
Waterloo, Ontario Waterloo, Ontario

46
KPMG LLP
Bay Adelaide Centre
Suite 4600
333 Bay Street
Toronto, Ontario
M5H 2S5
Telephone (416) 777-8500
Fax (416) 777-8818
www.kpmg.ca
Report of Independent Registered Public Accounting Firm
To the Shareholders and Board of Directors of The Descartes Systems Group Inc.
Opinion on the Consolidated Financial Statements
We have audited the accompanying consolidated balance sheets of The Descartes Systems Group Inc. (the
Company) as of January 31, 2019 and 2018, the related consolidated statements of operations, comprehensive
income, shareholders’ equity, and cash flows for each of the years in the three-year period ended January 31,
2019, and the related notes (collectively, the consolidated financial statements).
In our opinion, the consolidated financial statements present fairly, in all material respects, the financial position
of the Company as of January 31, 2019 and 2018, and the results of its operations and its cash flows for each of
the years in the three-year period ended January 31, 2019, in conformity with U.S. generally accepted
accounting principles.
We also have audited, in accordance with the standards of the Public Company Accounting Oversight Board
(United States) (PCAOB), the Company’s internal control over financial reporting as of January 31, 2019, based
on the criteria established in Internal Control – Integrated Framework (2013) issued by the Committee of
Sponsoring Organizations of the Treadway Commission, and our report dated March 6, 2019 expressed an
unqualified opinion on the effectiveness of the Company’s internal control over financial reporting.
Changes in Accounting Principles
As discussed in Note 2 to the consolidated financial statements, the Company has changed its method of
accounting for revenue from contracts with customers and income taxes related to intra-entity transfers of assets
other than inventory in 2019 due to the adoption of the new revenue standard (Accounting Standards
Codification Topic 606) and amendments to the income taxes standard (Accounting Standards Codification
Topic 740), respectively.
Basis for Opinion
These consolidated financial statements are the responsibility of the Company’s management. Our responsibility
is to express an opinion on these consolidated financial statements based on our audits. We are a public
accounting firm registered with the PCAOB and are required to be independent with respect to the Company in
accordance with the U.S. federal securities laws and the applicable rules and regulations of the Securities and
Exchange Commission and the PCAOB.
47
We conducted our audits in accordance with the standards of the PCAOB. Those standards require that we plan
and perform the audit to obtain reasonable assurance about whether the consolidated financial statements are
free of material misstatement, whether due to error or fraud. Our audits included performing procedures to
assess the risks of material misstatement of the consolidated financial statements, whether due to error or fraud,
and performing procedures that respond to those risks. Such procedures included examining, on a test basis,
evidence regarding the amounts and disclosures in the consolidated financial statements. Our audits also
included evaluating the accounting principles used and significant estimates made by management, as well as
evaluating the overall presentation of the consolidated financial statements. We believe that our audits provide a
reasonable basis for our opinion.
Chartered Professional Accountants, Licensed Public Accountants
We have served as the Company’s auditor since 2015.
Toronto, Canada
March 6, 2019

48
KPMG LLP
Bay Adelaide Centre
Suite 4600
333 Bay Street
Toronto, Ontario
M5H 2S5
Telephone (416) 777-8500
Fax (416) 777-8818
www.kpmg.ca
Report of Independent Registered Public Accounting Firm
To the Shareholders and Board of Directors of The Descartes Systems Group Inc.
Opinion on Internal Control Over Financial Reporting
We have audited The Descartes Systems Group Inc.’s internal control over financial reporting as of January 31,
2019, based on the criteria established in Internal Control – Integrated Framework (2013) issued by the
Committee of Sponsoring Organizations of the Treadway Commission. In our opinion, The Descartes Systems
Group Inc. (the Company) maintained, in all material respects, effective internal control over financial reporting
as of January 31, 2019, based on the criteria established in Internal Control – Integrated Framework (2013)
issued by the Committee of Sponsoring Organizations of the Treadway Commission.
We also have audited, in accordance with the standards of the Public Company Accounting Oversight Board
(United States) (PCAOB), the consolidated balance sheets of the Company as of January 31, 2019 and 2018,
the related consolidated statements of operations, comprehensive income, shareholders’ equity, and cash flows
for each of the years in the three-year period ended January 31, 2019, and the related notes (collectively, the
consolidated financial statements), and our report dated March 6, 2019 expressed an unqualified opinion on
those consolidated financial statements.
Basis for Opinion
The Company’s management is responsible for maintaining effective internal control over financial reporting and
for its assessment of the effectiveness of internal control over financial reporting, included in the accompanying
Management’s Report on Financial Statements and Internal Control over Financial Reporting preceding this
report. Our responsibility is to express an opinion on the Company’s internal control over financial reporting
based on our audit. We are a public accounting firm registered with the PCAOB and are required to be
independent with respect to the Company in accordance with the U.S. federal securities laws and the applicable
rules and regulations of the Securities and Exchange Commission and the PCAOB.
We conducted our audit in accordance with the standards of the PCAOB. Those standards require that we plan
and perform the audit to obtain reasonable assurance about whether effective internal control over financial
reporting was maintained in all material respects. Our audit of internal control over financial reporting included
obtaining an understanding of internal control over financial reporting, assessing the risk that a material
weakness exists, and testing and evaluating the design and operating effectiveness of internal control based on
the assessed risk. Our audit also included performing such other procedures as we considered necessary in the
circumstances. We believe that our audit provides a reasonable basis for our opinion.

49
Definition and Limitations of Internal Control Over Financial Reporting
A company’s internal control over financial reporting is a process designed to provide reasonable assurance
regarding the reliability of financial reporting and the preparation of financial statements for external purposes in
accordance with generally accepted accounting principles. A company’s internal control over financial reporting
includes those policies and procedures that (1) pertain to the maintenance of records that, in reasonable detail,
accurately and fairly reflect the transactions and dispositions of the assets of the company; (2) provide
reasonable assurance that transactions are recorded as necessary to permit preparation of financial statements
in accordance with generally accepted accounting principles, and that receipts and expenditures of the company
are being made only in accordance with authorizations of management and directors of the company; and (3)
provide reasonable assurance regarding prevention or timely detection of unauthorized acquisition, use, or
disposition of the company’s assets that could have a material effect on the financial statements.
Because of its inherent limitations, internal control over financial reporting may not prevent or detect
misstatements. Also, projections of any evaluation of effectiveness to future periods are subject to the risk that
controls may become inadequate because of changes in conditions, or that the degree of compliance with the
policies or procedures may deteriorate.
Chartered Professional Accountants, Licensed Public Accountants
Toronto, Canada
March 6, 2019

50
THE DESCARTES SYSTEMS GROUP INC. CONSOLIDATED BALANCE SHEETS (US DOLLARS IN THOUSANDS; US GAAP)
January 31, January 31,
2019 2018
ASSETS
CURRENT ASSETS
Cash 27,298 35,145
Accounts receivable (net)
Trade (Note 5) 31,493 28,792
Other (Note 6) 4,331 3,171
Prepaid expenses and other 9,027 7,621
Inventory (Note 7) 95 123
72,244 74,852
OTHER LONG-TERM ASSETS (Note 18) 10,510 3,966
PROPERTY AND EQUIPMENT, NET (Note 8) 12,612 12,798
DEFERRED INCOME TAXES 3,598 4,660
DEFERRED TAX CHARGE - 453
INTANGIBLE ASSETS, NET (Note 9) 176,192 178,001
GOODWILL (Note 10) 378,178 350,148
653,334 624,878
LIABILITIES AND SHAREHOLDERS’ EQUITY
CURRENT LIABILITIES
Accounts payable 5,147 7,897
Accrued liabilities (Note 11) 29,392 25,538
Income taxes payable 1,592 3,270
Deferred revenue (Note 18) 34,236 30,985
70,367 67,690
LONG-TERM DEBT (Note 12) 25,464 37,000
LONG-TERM DEFERRED REVENUE (Note 18) 855 1,128
LONG-TERM INCOME TAXES PAYABLE 7,634 8,663
DEFERRED INCOME TAXES 15,507 11,585
119,827 126,066
COMMITMENTS, CONTINGENCIES AND GUARANTEES (Note 13)
SHAREHOLDERS’ EQUITY (Note 14)
Common shares – unlimited shares authorized; Shares issued and outstanding totaled
76,864,866 at January 31, 2019 (January 31, 2018 – 76,773,497) 276,753 274,536
Additional paid-in capital 454,722 451,151
Accumulated other comprehensive loss (25,201) (15,252)
Accumulated deficit (172,767) (211,623)
533,507 498,812
653,334 624,878
The accompanying notes are an integral part of these consolidated financial statements.
Approved by the Board:
‘Eric A. Demirian’ ‘Edward J. Ryan’ Eric A. Demirian Edward J. Ryan Chairman of the Board Chief Executive Officer

51
THE DESCARTES SYSTEMS GROUP INC. CONSOLIDATED STATEMENTS OF OPERATIONS (US DOLLARS IN THOUSANDS, EXCEPT PER SHARE AND WEIGHTED AVERAGE SHARE AMOUNTS; US GAAP)
January 31, January 31, January 31,
Year Ended 2019 2018 2017
REVENUES 275,171 237,439 203,779
COST OF REVENUES 74,994 63,704 56,051
GROSS MARGIN 200,177 173,735 147,728
EXPENSES
Sales and marketing 36,873 33,128 24,943
Research and development 47,872 41,804 35,556
General and administrative 30,012 25,448 23,077
Other charges (Note 19) 3,798 3,994 3,455
Amortization of intangible assets 40,179 33,477 30,001
158,734 137,851 117,032
INCOME FROM OPERATIONS 41,443 35,884 30,696
INTEREST EXPENSE (2,128) (1,297) (611)
INVESTMENT INCOME 195 161 1,415
INCOME BEFORE INCOME TAXES 39,510 34,748 31,500
INCOME TAX EXPENSE (Note 17)
Current 6,042 6,572 4,022
Deferred 2,191 1,297 3,640
8,233 7,869 7,662
NET INCOME 31,277 26,879 23,838
EARNINGS PER SHARE (Note 15)
Basic 0.41 0.35 0.31
Diluted 0.40 0.35 0.31
WEIGHTED AVERAGE SHARES OUTSTANDING (thousands)
Basic 76,832 76,324 75,800
Diluted 77,791 77,112 76,515
The accompanying notes are an integral part of these consolidated financial statements.

52
THE DESCARTES SYSTEMS GROUP INC. CONSOLIDATED STATEMENTS OF COMPREHENSIVE INCOME (US DOLLARS IN THOUSANDS; US GAAP)
January 31, January 31, January 31,
2019 2018 2017
Comprehensive income
Net Income 31,277 26,879 23,838
Other comprehensive income (loss):
Foreign currency translation adjustment, net of income tax
expense (recovery) of ($44) for the year ended January 31, 2019 (January 31, 2018 – $255; January 31, 2017 – ($143))
(9,949) 17,527 2,084
Unrealized gain (loss) on marketable securities, net of income tax expense of
nil for the year ended January 31, 2019 (January 31, 2018 - nil; January 31, 2017 - $11)
- - 977
Gain on marketable securities reclassified into net income - - (960)
Total other comprehensive income (loss) (9,949) 17,527 2,101
COMPREHENSIVE INCOME 21,328 44,406 25,939
The accompanying notes are an integral part of these consolidated financial statements.
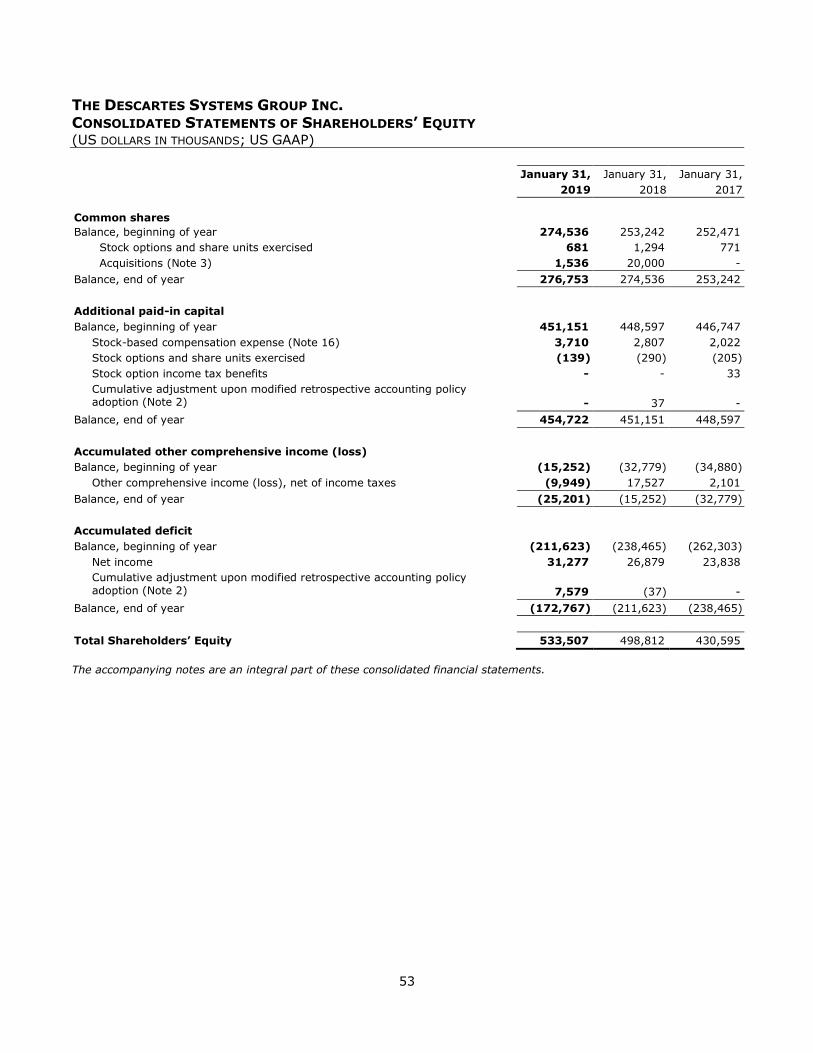
53
THE DESCARTES SYSTEMS GROUP INC. CONSOLIDATED STATEMENTS OF SHAREHOLDERS’ EQUITY (US DOLLARS IN THOUSANDS; US GAAP)
January 31, January 31, January 31,
2019 2018 2017
Common shares
Balance, beginning of year 274,536 253,242 252,471
Stock options and share units exercised 681 1,294 771
Acquisitions (Note 3) 1,536 20,000 -
Balance, end of year 276,753 274,536 253,242
Additional paid-in capital
Balance, beginning of year 451,151 448,597 446,747
Stock-based compensation expense (Note 16) 3,710 2,807 2,022
Stock options and share units exercised (139) (290) (205)
Stock option income tax benefits - - 33
Cumulative adjustment upon modified retrospective accounting policy adoption (Note 2)
-
37
-
Balance, end of year 454,722 451,151 448,597
Accumulated other comprehensive income (loss)
Balance, beginning of year (15,252) (32,779) (34,880)
Other comprehensive income (loss), net of income taxes (9,949) 17,527 2,101
Balance, end of year (25,201) (15,252) (32,779)
Accumulated deficit
Balance, beginning of year (211,623) (238,465) (262,303)
Net income 31,277 26,879 23,838
Cumulative adjustment upon modified retrospective accounting policy
adoption (Note 2)
7,579
(37)
-
Balance, end of year (172,767) (211,623) (238,465)
Total Shareholders’ Equity 533,507 498,812 430,595
The accompanying notes are an integral part of these consolidated financial statements.

54
THE DESCARTES SYSTEMS GROUP INC. CONSOLIDATED STATEMENTS OF CASH FLOWS (US DOLLARS IN THOUSANDS; US GAAP)
Year Ended January 31, January 31, January 31,
2019 2018 2017
OPERATING ACTIVITIES
Net income 31,277 26,879 23,838
Adjustments to reconcile net income to cash provided by operating activities:
Depreciation 4,544 4,101 3,628
Amortization of intangible assets 40,179 33,477 30,001
Stock-based compensation expense (Note 16) 3,710 2,807 2,022
Other non-cash operating activities 71 (784) (1,028)
Deferred tax expense 2,191 1,297 3,640
Deferred tax charge (49) (31) 358
Changes in operating assets and liabilities:
Accounts receivable
Trade (135) (1,963) 2,727
Other (451) 16 (212)
Prepaid expenses and other (4,466) (1,772) (64)
Inventory 74 52 2
Accounts payable (1,065) 1,428 (317)
Accrued liabilities 2,570 (592) 3,674
Income taxes payable (2,423) 6,326 1,431
Deferred revenue 2,047 902 2,883
Cash provided by operating activities 78,074 72,143 72,583
INVESTING ACTIVITIES
Purchase of marketable securities - - (241)
Sale of marketable securities - - 6,140
Additions to property and equipment (5,244) (5,086) (4,914)
Acquisition of subsidiaries, net of cash acquired (Note 3) (67,932) (111,867) (71,348)
Cash used in investing activities (73,176) (116,953) (70,363)
FINANCING ACTIVITIES
Proceeds from borrowing on the credit facility 68,468 80,000 10,801
Credit facility repayments (78,659) (43,000) (10,200)
Payment of debt issuance costs - - (957)
Issuance of common shares for cash, net of issuance costs 345 1,003 145
Payment of contingent consideration (1,531) - -
Cash (used in) provided by financing activities (11,377) 38,003 (211)
Effect of foreign exchange rate changes on cash (1,368) 3,817 (1,087)
(Decrease) increase in cash (7,847) (2,990) 922
Cash, beginning of year 35,145 38,135 37,213
Cash, end of year 27,298 35,145 38,135
Supplemental disclosure of cash flow information:
Cash paid during the year for interest 1,712 680 64
Cash paid during the year for income taxes 7,862 3,887 3,861
The accompanying notes are an integral part of these consolidated financial statements.
55
THE DESCARTES SYSTEMS GROUP INC. NOTES TO CONSOLIDATED FINANCIAL STATEMENTS (TABULAR AMOUNTS IN THOUSANDS OF US DOLLARS, EXCEPT PER SHARE AMOUNTS OR AS OTHERWISE INDICATED;
US GAAP)
Note 1 - Description of the Business
The Descartes Systems Group Inc. (“Descartes,” “Company,” “our” or “we”) is a provider of global logistics
technology solutions. Customers use our modular, software-as-a-service (“SaaS”) and data solutions to
route, schedule, track and measure delivery resources; plan, allocate and execute shipments; rate, audit
and pay transportation invoices; access and analyze global trade data; research and perform trade tariff
and duty calculations; file customs and security documents for imports and exports; and complete
numerous other logistics processes by participating in a large, collaborative multi-modal logistics
community. Our pricing model provides our customers with flexibility in purchasing our solutions either
on a subscription, transactional or perpetual license basis. Our primary focus is on serving transportation
providers (air, ocean and truck modes), logistics service providers (including third-party logistics
providers, freight forwarders and customs brokers) and distribution-intensive companies for which logistics
is either a key or a defining part of their own product or service offering, or for which our solutions can
provide an opportunity to reduce costs, improve service levels, or support growth by optimizing the use
of assets and information.
Note 2 – Basis of Presentation
The accompanying consolidated financial statements are presented in United States (“US”) dollars and are
prepared in accordance with generally accepted accounting principles in the US (“GAAP”) and the rules
and regulations of the Canadian Securities Administrators and the US Securities and Exchange Commission
(“SEC”) for the preparation of consolidated financial statements.
Our fiscal year commences on February 1st of each year and ends on January 31st of the following year.
Our fiscal year, which ends on January 31, 2019, is referred to as the “current fiscal year”, “fiscal 2019”,
“2019” or using similar words. Our previous fiscal year, which ended on January 31, 2018, is referred to
as the “previous fiscal year”, “fiscal 2018”, “2018” or using similar words. Other fiscal years are referenced
by the applicable year during which the fiscal year ends. For example, “2020” refers to the annual period
ending January 31, 2020 and the “fourth quarter of 2020” refers to the quarter ending January 31, 2020.
Basis of consolidation
The consolidated financial statements include the financial statements of Descartes and our wholly-owned
subsidiaries. We do not have any variable interests in variable interest entities. All intercompany accounts
and transactions have been eliminated during consolidation.
Foreign currency translation
The US dollar is the presentation currency of the Company. Assets and liabilities of our subsidiaries are
translated into US dollars at the exchange rate in effect at the balance sheet date. Revenues and expenses
are translated into US dollars using daily exchange rates. Translation adjustments resulting from this
process are accumulated in other comprehensive income (loss) as a separate component of shareholders’
equity. On substantial liquidation of a foreign operation, the component of accumulated other
comprehensive income relating to that particular foreign operation is recognized in the consolidated
statements of operations.
The functional currency of each of our entities is the local currency in which they operate. Transactions
incurred in currencies other than the local currency of an entity are converted to the local currency at the
transaction date. Monetary assets and liabilities denominated in foreign currencies are re-measured into the local currency at the exchange rate in effect at the balance sheet date. All foreign currency re-
measurement gains and losses are included in net income. For the year ended January 31, 2019, foreign

56
currency re-measurement loss of $0.4 million was included in net income (January 31, 2018 – loss of $0.4
million; January 31, 2017 – loss of $0.1 million).
Use of estimates
Preparing financial statements in conformity with GAAP requires management to make estimates and
assumptions that affect the amounts that are reported in the consolidated financial statements and
accompanying note disclosures. Although these estimates and assumptions are based on management’s
best knowledge of current events, actual results may be different from the estimates. These estimates,
judgments and assumptions are evaluated on an ongoing basis. We base our estimates on historical
experience and on various other assumptions that we believe are reasonable at that time, the results of
which form the basis for making judgments about the carrying values of assets and liabilities that are not
readily apparent from other sources.
Estimates and assumptions are used when accounting for items such as allocations of the purchase price
and the fair value of net assets acquired in business combination transactions, useful lives of intangible
assets and property and equipment, revenue related estimates including determining the nature and
timing of satisfaction of performance obligations, and determining the standalone selling price (“SSP”) of
performance obligations, variable consideration, and other obligations such as product returns and
refunds, allowance for doubtful accounts, collectability of other receivables, provisions for excess or
obsolete inventory, restructuring accruals, fair value of stock-based compensation, assumptions embodied
in the valuation of assets for impairment assessment, accounting for income taxes, valuation allowances
for deferred income tax assets, realization of investment tax credits, uncertain tax positions and
recognition of contingencies.
Cash
Cash included highly liquid short-term deposits with original maturities of three months or less.
Financial instruments
Fair value of financial instruments
The carrying amounts of the Company’s cash, accounts receivable (net), accounts payable, accrued
liabilities and income taxes payable approximate their fair value due to their short maturities.
Derivative instruments
We use derivative instruments to manage equity risk relating to our share-based compensation. We account
for these instruments in accordance with ASC Topic 815 “Derivatives and Hedging” (Topic 815), which
requires that every derivative instrument be recorded on the balance sheet as either an asset or a liability
measured at its fair value as of the reporting date. We do not designate our derivative instruments as hedges
and as such the changes in our derivative financial instruments' fair values are recognized in earnings. The
fair value of equity contract derivatives is determined utilizing a valuation model based on the quoted market
value of our common shares at the balance sheet date.
Foreign exchange risk
We are exposed to foreign exchange risk because the Company transacts business in currencies other than
the US dollar. Accordingly, our results are affected, and may be affected in the future, by exchange rate
fluctuations of the US dollar relative to the Canadian dollar, euro, British pound sterling and various other
foreign currencies.
Interest rate risk
Depending on the type of advance under the available facilities, interest on such borrowings will be charged
based on either i) Canada or US prime rate; or ii) Banker’s Acceptance (BA); or iii) LIBOR. We are exposed
to interest rate fluctuations to the extent that we borrow on our credit facility.

57
Credit risk
We are exposed to credit risk through our invested cash and accounts receivable. We hold our cash with
reputable financial institutions. The lack of concentration of accounts receivable from a single customer and
the dispersion of customers among industries and geographical locations mitigate our credit risk.
We do not use any type of speculative financial instruments, including but not limited to foreign exchange
contracts, futures, swaps and option agreements, to manage our foreign exchange or interest rate risks. In
addition, we do not hold or issue financial instruments for trading purposes.
Equity risk
We are exposed to equity risk through certain share-based compensation expenses that are fair valued at
the balance sheet date. The Company enters into equity derivative contracts including floating-rate equity
forwards to partially offset the potential fluctuations of certain future share-based compensation expenses.
The Company does not hold derivatives for speculative purposes.
Allowance for doubtful accounts
We maintain an allowance for doubtful accounts for estimated losses resulting from the inability of
customers to make their required payments. Specifically, we consider the age of the receivables,
customers’ payment history, historical write-offs, the creditworthiness of the customer, and current
economic trends among other factors. Accounts receivable are written off, and the associated allowance
is eliminated, if it is determined that the specific balance is no longer collectible. The allowance is
maintained for 100% of all accounts deemed to be uncollectible and, for those receivables not specifically
identified as uncollectible, an allowance is maintained for a specific percentage of those receivables based
upon the aging of accounts, our historical collection experience and current economic expectations. To
date, the actual losses have been within our expectations. No single customer accounted for more than
10% of the accounts receivable balance as of January 31, 2019 and 2018.
Inventory
Finished goods inventories are stated at the lower of cost and net realizable value. The cost of finished
goods is determined on the basis of average cost of units.
The valuation of inventory, including the determination of obsolete or excess inventory, requires
management to estimate the future demand for our products within specified time horizons. We perform
an assessment of inventory which includes a review of, among other factors, demand requirements,
product life cycle and development plans, product pricing and quality issues. If the demand for our
products indicates we are no longer able to sell inventories above cost or at all, we write down inventory
to market or excess inventory is written off.
Impairment of long-lived assets
We test long-lived assets or asset groups, such as property and equipment and finite life intangible assets,
for recoverability when events or changes in circumstances indicate that there may be impairment.
Circumstances which could trigger a review include, but are not limited to: significant adverse changes in
the business climate or legal factors; current period cash flow or operating losses combined with a history
of losses or a forecast of continuing losses associated with the use of the asset or asset group; and a
current expectation that the asset or asset group will more likely than not be sold or disposed of before
the end of its estimated useful life. An impairment loss is recognized when the estimate of undiscounted
future cash flows generated by such asset or asset group is less than the carrying amount. Measurement
of the impairment loss is based on the present value of the expected future cash flows. No impairment of
long-lived assets has been identified or recorded in our consolidated statements of operations for any of
the fiscal years presented.
Goodwill and intangible assets
Goodwill represents the excess of the purchase price in a business combination over the fair value of net tangible and intangible assets acquired. Goodwill is not subject to amortization.

58
We test for impairment of goodwill at least annually on October 31st of each year and at any other time if
any event occurs or circumstances change that would more likely than not reduce our fair value below our
reporting unit’s carrying amount. Our operations are analyzed by management and our chief operating
decision maker as being part of a single industry segment providing logistics technology solutions.
Accordingly, our goodwill impairment assessment is based on the allocation of goodwill to a single
reporting unit. We completed the qualitative assessment during our third quarter of 2019 and concluded
that it was more likely than not that the fair value of the goodwill was greater than the carrying value. As
a result, no impairment of goodwill was recorded in fiscal 2019 (no impairments were recorded for fiscal
2018 or fiscal 2017).
We perform further quarterly analysis of whether any event has occurred that would more likely than not
reduce our fair value below our reporting unit’s carrying amount and, if so, we perform a goodwill
impairment test between the annual date. Any impairment adjustment is recognized as an expense in the
period that the adjustment is identified.
Intangible assets related to our acquisitions are recorded at their fair value at the acquisition date.
Intangible assets include customer agreements and relationships, non-compete covenants, existing
technologies and trade names. Intangible assets are amortized on a straight-line basis over their estimated
useful lives. We write down intangible asset or asset groups with a finite life to fair value when the related
undiscounted cash flows are not expected to allow for recovery of the carrying value. Fair value of
intangible asset or asset groups is determined by discounting the expected related future cash flows.
Amortization of our intangible assets is generally recorded at the following rates:
Customer agreements and relationships Straight-line over three to twenty years
Existing technologies Straight-line over two to twelve years
Trade names Straight-line over one to fifteen years
Non-compete covenants Straight-line over two to twelve years
Property and equipment
Property and equipment is recorded at cost. Depreciation of our property and equipment is generally
recorded at the following rates:
Computer equipment and software 30% declining balance
Furniture and fixtures 20% declining balance
Leasehold improvements Straight-line over lesser of useful life or term of lease
Fully depreciated property and equipment are removed from the balance sheet when they are no longer
in use.
Revenue recognition
Revenue is recognized upon transfer of control of promised goods or services to customers in an amount
that reflects the consideration we expect to receive in exchange for those goods or services. We enter into
contracts that can include various combinations of goods and services, which are generally capable of
being distinct and accounted for as separate performance obligations. A product or service is distinct if
the customer can benefit from it on its own or together with other readily available resources and the
promise to transfer the good or service is separately identifiable from other promises in the contractual
arrangement with the customer. Non-distinct goods and services are combined with other goods or
services until they are distinct as a bundle and therefore form a single performance obligation.
The consideration (including any discounts) is allocated between separate goods and services in a bundle
on a relative basis based on their SSP. Revenue is recognized net of any taxes collected from customers,

59
which are subsequently remitted to governmental authorities. In addition to these general policies, the
specific revenue recognition policies for each major category of revenue are included below.
License
Revenues for distinct licenses for on-premise or hosted software are derived from perpetual licenses
granted to our customers for the right to use our software products. License revenues are billed on the
effective date of a contract and revenue is recognized at the point in time when the customer is provided
control of the respective software.
Services
Services, which allow customers to access hosted software over a contract term without taking possession
of the software, is provided on a subscription and/or transactional fee basis. Revenues from hosted
software subscriptions and maintenance are typically billed annually in advance and revenue is recognized
on a ratable basis over the contract term beginning on the date that our service is made available to the
customer. Transaction fees are typically billed and recognized as revenue on a monthly basis based on
the customer usage for that period.
Professional Services & Other
Professional services are comprised of consulting, implementation and training services related to our
services and products. These services are generally considered to be separate performance obligations as
they provide incremental benefit to customers beyond providing access to the software. Professional
services are typically billed on a time and materials basis and revenue is recognized over time as the
services are performed. For professional services contracts billed on a fixed price basis, revenue is
recognized over time based on the proportion of services performed. Revenue related to customer
reimbursement of travel related expenses is recognized on a gross basis as incurred. Other revenues
include hardware revenue and is generally billed, and revenue is recognized, when control of the product
has transferred under the terms of an enforceable contract.
Costs to Obtain a Contract with a Customer
We recognize an asset for the incremental costs of obtaining a contract with a customer if we expect the
costs to be recoverable. We have determined that certain sales incentive programs meet the requirements
to be capitalized. These capitalized costs are amortized consistent with the pattern of transfer to the
customer for the goods and services to which the asset relates, including specifically identifiable contract
renewals. The period of benefit including renewals is determined to be generally between four to six years,
taking into consideration our customer contracts, our technology, renewal behaviors and other factors.
Amortization of the asset is included in sales and marketing expenses in the consolidated statements of
operations. Applying the practical expedient, we recognize the incremental costs of obtaining contracts as
an expense when incurred if the amortization period of the assets that we otherwise would have recognized
is one year or less.
Contract Assets and Liabilities
The payment terms and conditions in our customer contracts may vary from the timing of revenue
recognition. In some cases, customers pay in advance of delivery of products or services; in other cases,
payment is due as services are performed or in arrears following delivery. Timing differences between
revenue recognition and invoicing result in unbilled receivables, contract assets, or deferred revenue.
Receivables are accrued when revenue is recognized prior to invoicing but the right to payment is
unconditional (i.e., only the passage of time is required). This occurs most commonly when software term
licenses recognized at a point in time are paid for periodically over the license term. Contract assets result
when amounts allocated to distinct performance obligations are recognized when or as control of a product
or service is transferred to the customer, but invoicing is contingent on performance of other performance
obligations or on completion of contractual milestones and is presented as other receivables. Contract
assets are transferred to receivables when the rights become unconditional, typically upon invoicing of the
related performance obligations in the contract or upon achieving the requisite project milestone. Contract liabilities primarily relate to the advance consideration received from customers and is presented as
deferred revenue. Deferred revenue results from customer payments in advance of our satisfaction of the
associated performance obligation(s) and relates primarily to prepaid maintenance or other recurring
60
services. Deferred revenues are relieved as revenue is recognized. Contract assets and deferred revenues
are reported on a contract-by-contract basis at the end of each reporting period.
Significant Judgments
Our contracts with customers often include promises to transfer multiple goods and services to a customer.
Determining whether goods and services are considered distinct performance obligations that should be
accounted for separately versus together may require significant judgment. Judgment is also needed in
assessing the ability to collect the corresponding receivables.
Judgment is required to determine the SSP for each distinct performance obligation, which is needed to
determine whether there is a discount that needs to be allocated based on the relative SSP of the various
goods and services. In order to determine the SSP of its promised goods or services, we conduct a regular
analysis to determine whether various goods or services have an observable standalone selling price. If
the Company does not have an observable SSP for a particular good or service, then SSP for that particular
good or service is estimated using reasonably available information and maximizing observable inputs
with approaches including historical pricing, cost plus a margin, adjusted market assessment, and the
residual approach.
Research and development costs
To date, we have not capitalized any costs related to research and development of our computer software
products. Costs incurred between the dates that the product is considered to be technologically feasible
and is considered to be ready for general release to customers have historically been expensed as they
have not been significant.
Stock-based compensation plans
Stock Options
We maintain stock option plans for non-employee directors, officers, employees and other service
providers. Options to purchase our common shares are granted at an exercise price equal to the fair
market value of our common shares as of the date of grant. This fair market value is determined using
the closing price of our common shares on the TSX on the day immediately preceding the date of the
grant.
Employee stock options generally vest over a five-year period starting from the grant date and expire
seven years from the grant date. Non-employee directors’ and officers’ stock options generally have
quarterly vesting over a three to five-year period. We issue new shares from treasury upon the exercise
of a stock option.
The fair value of employee stock option grants that are ultimately expected to vest are amortized to
expense in our consolidated statement of operations based on the straight-line attribution method. The
fair value of stock option grants is calculated using the Black-Scholes Merton option-pricing model.
Expected volatility is based on historical volatility of our common stock and other factors. The risk-free
interest rates are based on Government of Canada average bond yields for a period consistent with the
expected life of the option in effect at the time of the grant. The expected option life is based on the
historical life of our granted options and other factors.
Effective as of February 1, 2017, the Company adopted a change in accounting policy in accordance with
ASU 2016-09 to account for forfeitures as they occur. The change was applied on a modified retrospective
basis, and no prior periods were restated as a result of this change in accounting policy.
Performance & Restricted Share Units
We maintain a performance and restricted share unit plan pursuant to which certain of our officers are
eligible to receive grants of performance share units (“PSUs”) and restricted share units (“RSUs”).
PSUs vest at the end of a three-year performance period. The ultimate number of PSUs that vest is based
on the total shareholder return (“TSR”) of our Company relative to the TSR of companies comprising a
peer index group. TSR is calculated based on the weighted-average closing price of shares for the five

61
trading days preceding the beginning and end of the performance period. The fair value of PSUs is
expensed to stock-based compensation expense over the vesting period. PSUs expire ten years from the
grant date. New shares are issued from treasury upon the redemption of a PSU.
PSUs are measured at fair value estimated using a Monte Carlo Simulation approach. Expected volatility
is based on historical volatility of our common stock and other factors. The risk-free interest rates are
based on the Government of Canada average bond yields for a period consistent with the expected life of
the PSUs at the time of the grant. The expected PSU life is based on the historical life of our stock options
and other factors.
RSUs vest annually over a three-year period starting from the grant date and expire ten years from the
grant date. We issue new shares from treasury upon the redemption of an RSU.
RSUs are measured at fair value based on the closing price of our common shares for the day preceding
the date of the grant and will be expensed to stock-based compensation expense over the vesting period.
Deferred Share Unit Plan
Our board of directors adopted a deferred share unit plan effective as of June 28, 2004, pursuant to which
non-employee directors are eligible to receive grants of deferred share units (“DSUs”), each of which has
an initial value equal to the weighted-average closing price of our common shares for the five trading days
preceding the grant date. The plan allows each director to choose to receive, in the form of DSUs, all,
none or a percentage of the eligible director’s fees which would otherwise be payable in cash. If a director
has invested less than the minimum amount of equity in Descartes, as prescribed from time to time by
the board of directors, then the director must take at least 50% of the base annual fee for serving as a
director in the form of DSUs. Each DSU fully vests upon award but is distributed only when the director
ceases to be a member of the board of directors. Vested units are settled in cash based on our common
share price when conversion takes place. Fair value of the liability is based on the closing price of our
common shares at the balance sheet date.
Cash-Settled Restricted Share Unit Plan
Our board of directors adopted a cash-settled restricted share unit plan effective as of May 23, 2007,
pursuant to which certain of our employees and non-employee directors are eligible to receive grants of
cash-settled restricted share units (“CRSUs”), each of which has an initial value equal to the weighted-
average closing price of our common shares for the five trading days preceding the date of the grant. The
CRSUs generally vest based on continued employment and have annual vesting over three to five-year
periods. Vested units are settled in cash based on our common share price when conversion takes place,
which is within 30 days following a vesting date and in any event prior to December 31st of the calendar
year in which a vesting date occurs. Fair value of the liability is based on the closing price of our common
shares at the balance sheet date.
Business combinations
We apply the provisions of ASC Topic 805, “Business Combinations” (Topic 805), in the accounting for our
acquisitions. It requires us to recognize separately from goodwill, the assets acquired and the liabilities
assumed at their acquisition date fair values. Goodwill as of the acquisition date is measured as the excess
of consideration transferred over the net of the acquisition date fair values of the assets acquired and the
liabilities assumed. While we use our best estimates and assumptions to accurately value assets acquired
and liabilities assumed at the acquisition date as well as contingent consideration, where applicable, our
estimates are inherently uncertain and subject to refinement. As a result, during the measurement period,
which may be up to one year from the acquisition date, we may record adjustments to the assets acquired
and liabilities assumed with the corresponding offset to goodwill. Upon the conclusion of the measurement
period or final determination of the values of assets acquired or liabilities assumed, whichever comes first,
any subsequent adjustments would be recorded to our consolidated statement of operations.

62
Costs to exit or restructure certain activities of an acquired company or our internal operations are
accounted for as termination and exit costs pursuant to ASC Topic 420, “Exit or Disposal Cost Obligations”
(Topic 420) and are accounted for separately from the business combination.
For a given acquisition, we generally identify certain pre-acquisition contingencies as of the acquisition
date and may extend our review and evaluation of these pre-acquisition contingencies throughout the
measurement period in order to obtain sufficient information to assess whether we include these
contingencies as a part of the purchase price allocation and, if so, to determine the estimated amounts.
If we determine that a pre-acquisition contingency (non-income tax related) is probable in nature and
estimable as of the acquisition date, we record our best estimate for such a contingency as a part of the
preliminary purchase price allocation. We often continue to gather information and evaluate our pre-
acquisition contingencies throughout the measurement period and if we make changes to the amounts
recorded or if we identify additional pre-acquisition contingencies during the measurement period, such
amounts will be included in the purchase price allocation during the measurement period and,
subsequently, in our results of operations.
Uncertain tax positions and tax related valuation allowances assumed in connection with a business
combination are initially estimated as of the acquisition date. We review these items during the
measurement period as we continue to actively seek and collect information relating to facts and
circumstances that existed at the acquisition date. Changes to these uncertain tax positions and tax related
valuation allowances made subsequent to the measurement period, or if they relate to facts and
circumstances that did not exist at the acquisition date, are recorded in our provision for income taxes in
our consolidated statement of operations.
Income taxes
We use the liability method of income tax allocation to account for income taxes. Deferred tax assets and
liabilities arise from temporary differences between the tax bases of assets and liabilities and their reported
amounts in the consolidated financial statements that will result in taxable or deductible amounts in future
years. These temporary differences are measured using enacted tax rates. A valuation allowance is
recorded to reduce deferred tax assets to the extent that we consider it is more likely than not that a
deferred tax asset will not be realized. In determining the valuation allowance, we consider factors such
as the reversal of deferred income tax liabilities, projected taxable income, our history of losses for tax
purposes, and the character of income tax assets and tax planning strategies. A change to these factors
could impact the estimated valuation allowance and income tax expense.
We evaluate our uncertain tax positions by using a two-step approach to recognize and measure uncertain
tax positions and provisions for income taxes. The first step is to evaluate the tax position for recognition
by determining if the weight of available evidence indicates it is more likely than not, based solely on the
technical merits, that the position will be sustained on audit, including resolution of related appeals or
litigation processes, if any. The second step is to measure the appropriate amount of the benefit to
recognize. The amount of benefit to recognize is measured as the maximum amount which is more likely
than not to be realized. The tax position is derecognized when it is no longer more likely than not that the
position will be sustained on audit. We continually assess the likelihood and amount of potential
adjustments and adjust the income tax provisions, income taxes payable and deferred income taxes in
the period in which the facts that give rise to a revision become known.
Earnings per share
Basic earnings per share is calculated by dividing net income by the weighted average number of common
shares outstanding during the period. Diluted earnings per common share is calculated by dividing net
income by the sum of the weighted average number of common shares outstanding and all additional
common shares that would have been outstanding if potentially dilutive common shares had been issued
during the period. The treasury stock method is used to compute the dilutive effect of stock-based
compensation.

63
Recently adopted accounting pronouncements
In May 2014, the FASB issued Accounting Standards Update 2014-09, “Revenue from Contracts with
Customers” (“ASC 606”). ASC 606 supersedes the revenue recognition requirements in ASC Topic 605,
“Revenue Recognition” ("ASC 605") and nearly all other existing revenue recognition guidance under US
GAAP. The core principle of ASC 606 is to recognize revenues when promised goods or services are
transferred to customers in an amount that reflects the consideration that is expected to be received for
those goods or services. ASC 606 is effective for annual periods, and interim periods within those annual
periods, beginning after December 15, 2017, which is our fiscal year that began on February 1, 2018
(fiscal 2019). The Company has adopted ASC 606 in the first quarter of fiscal 2019 using the cumulative
effect method and therefore the comparative information has not been restated and continues to be
reported under ASC 605. The details of the significant changes and quantitative impact of the changes are
set out below.
Term-based licenses
Under ASC 605, revenue attributable to term-based arrangements was recognized ratably over
the term of the arrangement because Vendor Specific Objective Evidence did not exist for the
undelivered maintenance and support element of the arrangement. Under ASC 606, the Company
has deemed the licenses to be distinct from other performance obligations. Revenue allocated to
the distinct license based on the SSP is recognized at the time that both the right-to-use the
software has commenced for the term and the software has been made available to the customer.
Costs to obtain a contract
Under the Company’s previous accounting policies, the Company generally expensed commission
costs paid to employees or third parties to obtain customer contracts as incurred. Under ASC 606,
the Company allocates these incremental commission costs to the various performance obligations
to which they relate using the relative selling price allocation for bundled commissions. For
performance obligations not delivered upfront, the allocated commissions are deferred and
amortized over the pattern of transfer of the related performance obligation. If the expected
amortization period for all performance obligations in a contract with a customer is one year or
less, the commission fee is expensed when incurred. Capitalized costs to obtain a contract are
included in other long-term assets on the consolidated balance sheet.
The adoption of ASC 606 resulted in an increase to contract assets of $0.5 million, an increase to other
long-term assets of $4.2 million, an increase to the liability for deferred income taxes of $1.1 million and
a decrease to accumulated deficit of $3.6 million, as of February 1, 2018.
Had we presented the results for the year ended January 31, 2019 under ASC 605, we would have
expensed all sales commissions as incurred which would have had increased sales and marketing expenses
and decreased net income before taxes by approximately $2.4 million. The adoption of ASC 606 had an
immaterial impact on revenue compared to ASC 605.
In January 2016, the FASB issued Accounting Standards Update 2016-01, “Financial Instruments—Overall
(Subtopic 825-10): Recognition and Measurement of Financial Assets and Financial Liabilities” (“ASU 2016-
01”). ASU 2016-01 supersedes the guidance to classify equity securities with readily determinable fair
values into different categories reducing the number of items that are recognized in other comprehensive
income as well as simplifying the impairment assessment of equity investments without readily
determinable fair values. ASU 2016-01 is effective for annual periods, and interim periods within those
annual periods, beginning after December 15, 2017, which is our fiscal year that began on February 1,
2018 (fiscal 2019). The Company adopted this guidance in the first quarter of fiscal 2019. The adoption
of this standard did not have a material impact on our results of operations or disclosures.
In August 2016, the FASB issued Accounting Standards Update 2016-15, “Statement of Cash Flows (Topic
230): Classification of Certain Cash Receipts and Cash Payments” (“ASU 2016-15”). ASU 2016-15 clarifies the presentation and classification in the statement of cash flows. ASU 2016-15 is effective for annual
periods, and interim periods within those annual periods, beginning after December 15, 2017, which is
our fiscal year that began on February 1, 2018 (fiscal 2019). The Company adopted this guidance in the

64
first quarter of fiscal 2019. The adoption of this standard did not have a material impact on our results of
operations or disclosures.
In October 2016, the FASB issued Accounting Standards Update 2016-16, “Income Taxes (Topic 740):
Intra-Entity Transfers of Assets Other Than Inventory” (“ASU 2016-16”). ASU 2016-16 requires the
recognition of the income tax consequences of an intra-entity transfer of an asset other than inventory
when the transfer occurs. ASU 2016-16 is effective for annual periods, and interim periods within those
annual periods, beginning after December 15, 2017, which is our fiscal year that began on February 1,
2018 (fiscal 2019). The Company adopted this guidance in the first quarter of fiscal 2019. As a result of
adoption, the balance of unamortized deferred tax charges was written-off and previously unrecognized
deferred income tax assets in certain jurisdictions were recognized. The change was applied on a modified
retrospective basis, and no prior periods were restated. Accordingly, we have recognized a decrease of
$4.0 million in accumulated deficit as a result of the adoption of this change in accounting policy.
In January 2017, the FASB issued Accounting Standards Update 2017-01, “Business Combinations (Topic
805): Clarifying the Definition of a Business” (“ASU 2017-01”). ASU 2017-01 clarifies the definition of a
business to assist entities with evaluating whether transactions should be accounted for as acquisitions of
assets or businesses. ASU 2017-01 is effective for annual periods, and interim periods within those annual
periods, beginning after December 15, 2017, which is our fiscal year that began on February 1, 2018
(fiscal 2019). The Company adopted this guidance in the first quarter of fiscal 2019. The adoption of this
standard did not have a material impact on our results of operations or disclosures.
Recently issued accounting pronouncements
In February 2016, the FASB issued Accounting Standards Update 2016-02, “Leases (Topic 842)” (“ASU
2016-02”) and issued subsequent amendments to the initial guidance during 2018, collectively referred
to as “Topic 842”. These updates supersede the lease guidance in ASC Topic 840, “Leases” and require
the recognition of lease assets and lease liabilities by lessees for most leases previously classified as
operating leases under ASC Topic 840. Leases will continue to be classified as either operating or finance.
Topic 842 is effective for annual periods, and interim periods within those annual periods, beginning after
December 15, 2018, which will be our fiscal year beginning February 1, 2019 (fiscal 2020). The Company
will adopt this guidance using a modified retrospective method approach in the first quarter of fiscal 2020
and will not restate comparative periods.
We have an established project team with the objective of evaluating the effect that Topic 842 will have
on our consolidated financial statements, related disclosures, business processes, systems and controls.
The team has been responsible for analyzing the impact of the new standard on our leases by reviewing
current accounting policies, practices and our lease contracts to identify potential differences that would
result from applying the requirements of the new standard. In addition, this team is assisting in the
implementation of changes to our business processes, systems and controls in order to support recognition
and disclosure under the new standard.
As permitted under Topic 842, we will carry forward our current assessments of whether a contract
contains a lease, lease classification, remaining lease terms and amounts capitalized as initial direct costs.
While we are continuing to assess all potential impacts of the new standard, we anticipate that the initial
application of the new standard will have a material impact on our consolidated balance sheet. We
currently estimate that at February 1, 2019 we will recognize right-of-use assets and lease liabilities of
approximately $10.5 to $11.5 million. Following transition, we anticipate that the standard will not have
a material impact on either our consolidated statement of operations or our consolidated statement of
cash flows.
In June 2016, the FASB issued Accounting Standards Update 2016-13, “Financial Instruments – Credit
Losses (Topic 326): Measurement of Credit Losses on Financial Instruments” (“ASU 2016-13”). ASU 2016-
13 requires measurement and recognition of expected credit losses for financial assets held. ASU 2016-13 is effective for annual periods, and interim periods within those annual periods, beginning after
December 15, 2019, which will be our fiscal year beginning February 1, 2020 (fiscal 2021). Early adoption
is permitted. The Company will adopt this guidance in the first quarter of fiscal 2021 and is currently

65
evaluating the impact that the adoption will have on its results of operations, financial position and
disclosures.
In January 2017, the FASB issued Accounting Standards Update 2017-04, “Intangibles – Goodwill and
Other (Topic 350): Simplifying the Test for Goodwill Impairment” (“ASU 2017-04”). ASU 2017-04
simplifies how an entity is required to test goodwill for impairment. ASU 2017-04 is effective for annual
periods, and interim periods within those annual periods, beginning after December 15, 2019, which will
be our fiscal year beginning February 1, 2020 (fiscal 2021). Early adoption is permitted. The Company will
adopt this guidance in the first quarter of fiscal 2021. The adoption of this amendment is not expected to
have a material impact on our results of operations or disclosures.
In August 2018, the FASB issued Accounting Standards Update 2018-15, “Intangibles – Goodwill and
Other – Internal-Use Software (Subtopic 350-40): Customer’s Accounting for Implementation Costs
Incurred in a Cloud Computing Arrangement That Is a Service Contract” (“ASU 2018-15”). ASU 2018-15
aligns the requirements for capitalizing implementation costs incurred in a hosting arrangement that is a
service contract with the requirements for capitalizing implementation costs incurred to develop or
obtain internal-use software. ASU 2018-15 is effective for annual periods, and interim periods within those
annual periods, beginning after December 15, 2019, which will be our fiscal year beginning February 1,
2020 (fiscal 2021). Early adoption is permitted. The Company will adopt this guidance in the first quarter
of fiscal 2021. The adoption of this amendment is not expected to have a material impact on our results
of operations or disclosures.
Note 3 – Acquisitions
Fiscal 2019 Acquisitions
On February 2, 2018, Descartes acquired Aljex Software, Inc. (“Aljex”), a cloud-based provider of back-
office transportation management solutions for freight brokers and transportation providers. US-based
Aljex helps customers automate business processes and create electronic documents critical for executing
transportation moves through the lifecycle of a shipment. The purchase price for the acquisition was
approximately $32.4 million, net of cash acquired, which was funded from drawing on Descartes’ existing
credit facility. The gross contractual amount of trade receivables acquired was $0.2 million with a fair
value of $0.2 million at the date of acquisition. Our acquisition date estimate of contractual cash flows not
expected to be collected was nominal. The purchase price was finalized in the three month period ended
January 31, 2019 with no adjustments.
On June 22, 2018, Descartes acquired certain assets of Velocity Mail, LLC (“Velocity Mail”), an electronic
transportation network that provides global air carriers with mail and parcel shipment scanning and
tracking solutions. Using US-based Velocity Mail’s network, global air carriers leverage mobile devices to
accurately track shipments and deliveries in real-time. The purchase price for the acquisition was
approximately $26.1 million, net of cash acquired, which was funded from drawing on Descartes’ existing
credit facility. The gross contractual amount of trade receivables acquired was $1.0 million with a fair
value of $1.0 million at the date of acquisition. Our acquisition date estimate of contractual cash flows not
expected to be collected was nominal. The completion of the initial purchase price allocation is pending
the finalization of the fair value for accrued liability balances as well as potential unrecorded liabilities. We
expect to finalize the purchase price allocation on or before June 22, 2019.
On August 21, 2018, Descartes acquired PinPoint GPS Solutions Inc. (“PinPoint”), a provider of fleet
tracking and mobile workforce solutions. Canada-based PinPoint helps customers collect real-time location
information on trucks and mobile workers using technology, including Geotab (telematics) and SkyBitz
(trailer tracking). The purchase price for the acquisition was approximately $11.0 million (CAD $14.4
million), net of cash acquired, which was funded from a combination of drawing on Descartes’ existing
credit facility and issuing to the sellers less than 0.1 million Descartes common shares from treasury.
Additional contingent consideration of up to $2.3 million (CAD $3.0 million) in cash is payable if certain revenue performance targets are met by PinPoint in the two years following the acquisition. The fair value
of the contingent consideration was valued at $0.7 million at the acquisition date. The gross contractual
amount of trade receivables acquired was $0.5 million with a fair value of $0.5 million at the date of

66
acquisition. Our acquisition date estimate of contractual cash flows not expected to be collected was
nominal. The completion of the initial purchase price allocation is pending the finalization of the fair value
for accrued liability balances as well as potential unrecorded liabilities. We expect to finalize the purchase
price allocation on or before August 21, 2019.
For the businesses acquired during fiscal 2019, we incurred acquisition-related costs of $0.5 million for
the year ended January 31, 2019. The acquisition-related costs were primarily for advisory services and
are included in other charges in our consolidated statements of operations. For the year ended January
31, 2019, we have recognized aggregate revenues of $15.1 million, and an aggregate net income of $0.9
million, from Aljex, Velocity Mail and PinPoint since the date of acquisition in our consolidated statements
of operations.
The final purchase allocation for Aljex and the preliminary purchase price allocations for Velocity Mail
and PinPoint, which have not been finalized, is as follows:
The above transactions were accounted for using the acquisition method in accordance with ASC Topic
805, “Business Combinations”. The purchase price allocation in the table above represents our estimates
of the allocation of the purchase price and the fair value of net assets acquired. The preliminary purchase
price allocation may differ from the final purchase price allocation, and these differences may be material.
Revisions to the allocation will occur as additional information about the fair value of assets and liabilities
becomes available. The final purchase price allocation for Velocity Mail and PinPoint will be completed
within one year from the acquisition dates.
Aljex
Velocity
PinPoint Total
Purchase price consideration:
Cash, less cash acquired related to Aljex ($193),
Velocity Mail (nil) and PinPoint ($769) 32,382 26,107
9,443 67,932
Common shares issued - - 1,536 1,536
Contingent consideration - - 714 714
Net working capital adjustments (receivable) / payable (152) (102) 84 (170)
32,230 26,005 11,777 70,012
Allocated to:
Current assets, excluding cash acquired 607 1,407 599 2,613
Other long-term assets - 501 - 501
Current liabilities (266) (81) (511) (858)
Deferred revenue (1,024) (70) (574) (1,668)
Deferred income tax liability (4,200) - (2,077) (6,277)
Net tangible (liabilities) assets assumed (4,883) 1,757 (2,563) (5,689)
Finite life intangible assets acquired:
Customer agreements and relationships 5,300 7,800 7,758 20,858
Existing technology 12,400 7,600 - 20,000
Tradenames 280 100 207 587
Non-compete covenants 230 300 69 599
Goodwill 18,903 8,448 6,306 33,657
32,230 26,005 11,777 70,012

67
The acquired intangible assets are being amortized over their estimated useful lives as follows:
Aljex
Velocity
PinPoint
Customer agreements and relationships 13 years 12 years 9 years
Existing technology 5 years 5 years N/A
Trade names 8 years 4 years 8 years
Non-compete covenants 5 years 5 years 5 years
The goodwill on the Aljex, Velocity Mail and PinPoint acquisitions arose as a result of the combined strategic
value to our growth plan. The goodwill arising from the Aljex and PinPoint acquisitions is not deductible
for tax purposes. The goodwill from the Velocity Mail acquisition is deductible for tax purposes.
Fiscal 2018 Acquisitions
On August 14, 2017, we acquired MacroPoint LLC (“MacroPoint”), an electronic transportation network
providing location-based truck tracking and predictive freight capacity data content. US-based MacroPoint
runs a connected network helping transportation brokers, logistics service providers and shippers track
the locations of deliveries in trucks as well as predictive freight capacity to help identify early opportunities
for additional freight moves. The purchase price for the acquisition was approximately $106.2 million, net
of cash acquired, which was funded using $20.0 million of our common shares, $80.0 million from drawing
on Descartes’ credit facility and the balance from cash on hand. The gross contractual amount of trade
receivables acquired was $2.0 million with a fair value of $2.0 million at the date of acquisition. Our
acquisition date estimate of contractual cash flows not expected to be collected was nominal. The purchase
price was finalized in the three month period ended July 31, 2018 with no adjustments.
On June 1, 2017, we acquired substantially all of the assets of PCSTrac, Inc., including certain related
assets of Progressive Computer Services Inc., doing business as PCS Technologies (collectively referred
to as “PCSTrac”). US-based PCSTrac helps specialty retailers and their logistics service providers
collaborate to improve carton-level visibility for shipments from distribution centers to stores. PCSTrac’s
solutions provide visibility and insight into the store replenishment supply chain, helping increase sales,
enhance loss prevention, and improve inventory control. The total purchase price for the acquisition was
$11.5 million, net of cash acquired, which was funded using cash on hand. The gross contractual amount
of trade receivables acquired was $0.4 million with a fair value of $0.4 million at the date of acquisition.
Our acquisition date estimate of contractual cash flows not expected to be collected was nominal. The
purchase price was finalized in the three month period ended April 30, 2018 with no adjustments.
On May 18, 2017, we acquired Z-Firm LLC (“ShipRush”), a US-based provider of e-commerce multi-carrier
parcel shipping solutions for small-to medium-sized businesses. The ShipRush platform helps customers
streamline their supply chain and reduce transportation costs by automatically importing orders,
comparing carrier rates, printing shipping labels for all major carriers, and tracking through final delivery.
The purchase price for the acquisition was $14.2 million, net of cash acquired, which was funded using
cash on hand. Additional contingent consideration of up to $3.0 million in cash is payable if certain revenue
performance targets are met by ShipRush in the two years following the acquisition. The fair value of the
contingent consideration was valued at $1.2 million at the acquisition date. The gross contractual amount
of trade receivables acquired was $0.4 million with a fair value of $0.4 million at the date of acquisition.
Our acquisition date estimate of contractual cash flows not expected to be collected was nominal. The
purchase price was finalized in the three month period ended April 30, 2018 with no adjustments.

68
The final purchase price allocations for businesses we acquired during 2018 are as follows:
The acquired intangible assets are being amortized over their estimated useful lives as follows:
ShipRush
PCSTrac
MacroPoint
Customer agreements and relationships 9 years 13 years 12 years
Existing technology 5 years 5 years 5 years
Trade names 8 years 4 years 8 years
Non-compete covenants 5 years 5 years 5 years
The goodwill on the ShipRush, PCSTrac and MacroPoint acquisitions arose as a result of the combined
strategic value to our growth plan. The goodwill arising from the PCSTrac, ShipRush and MacroPoint
acquisitions is deductible for tax purposes.
Fiscal 2017 Acquisitions
On December 23, 2016, we acquired The Datamyne Inc. (“Datamyne”), a provider of cloud-based trade
data content solutions for customers to analyze import and export trade activity. Datamyne, primarily
operating in the U.S. and South America, collects, cleanses and commercializes logistics trade data from
over 50 nations across five continents, including key markets in North America, Latin America, Asia, Africa,
and the European Union. Subscribers use Datamyne’s web‐based solutions and business intelligence tools
to augment, speed up and simplify trade data research, and to shape global marketing, prospecting, and
sourcing strategies. The total purchase price for the acquisition was $52.5 million, net of cash acquired,
which was funded with cash on hand. The gross contractual amount of trade receivables acquired was
$1.5 million with a fair value of $1.4 million at the date of acquisition. Our acquisition date estimate of
contractual cash flows not expected to be collected was $0.1 million. In the second quarter of fiscal 2018,
the working capital for Datamyne was finalized resulting in a $0.4 million decrease in goodwill and a $0.4
million decrease in current liabilities. The purchase price was finalized in the three month period ended January 31, 2018 with no adjustments.
ShipRush PCSTrac MacroPoint Total
Purchase price consideration:
Cash, less cash acquired related to ShipRush
($253), PCSTrac (nil) and MacroPoint ($2,098) 14,198 11,492 86,177 111,867
Common shares issued - - 20,000 20,000
Contingent consideration 1,233 - - 1,233
Net working capital adjustments payable 88 40 163 291
15,519 11,532 106,340 133,391
Allocated to:
Current assets, excluding cash acquired 461 467 2,127 3,055
Current liabilities (266) (10) (1,693) (1,969)
Deferred revenue (609) - (5,787) (6,396)
Net tangible (liabilities) assets assumed (414) 457 (5,353) (5,310)
Finite life intangible assets acquired:
Customer agreements and relationships 2,400 1,850 26,030 30,280
Existing technology 4,710 3,270 17,170 25,150
In-process research and development - - 290 290
Tradenames 120 60 570 750
Non-compete covenants 100 80 2,420 2,600
Goodwill 8,603 5,815 65,213 79,631
15,519 11,532 106,340 133,391
69
On November 11, 2016, we acquired 4Solutions Information Technology Pty Ltd. (“4Solutions”), an
Australia-based provider of cloud-based business-to-business supply chain integration solutions.
4Solutions operates the Health Supply Network, an electronic document exchange network for the
healthcare community, which allows large multi-national, local pharmaceutical manufacturers and
wholesalers connect and collaborate to automate a wide array of supply chain processes. The total
purchase price for the acquisition was approximately $2.5 million, net of cash acquired, which was funded
with cash on hand. The gross contractual amount of trade receivables acquired was $0.2 million with a
fair value of $0.2 million at the date of acquisition. Our acquisition date estimate of contractual cash flows
not expected to be collected was nil. The purchase price was finalized in the three month period ended
October 31, 2017 with no adjustments.
On October 12, 2016, we acquired Appterra LLC (“Appterra”), a US-based provider of cloud-based
business-to-business supply chain integration solutions. Appterra’s solutions help its customers connect
electronically, automate supply chain processes, and enhance collaboration and visibility among global
trading partners. The total purchase price for the acquisition was $5.7 million, net of cash acquired, which
was funded with cash on hand. Additional contingent consideration of up to $1.6 million in cash was
payable if certain revenue performance targets are met by Appterra in the two years following the
acquisition. The fair value of the contingent consideration was valued at $0.7 million at the acquisition
date. The gross contractual amount of trade receivables acquired was $0.1 million with a fair value of $0.1
million at the date of acquisition. Our acquisition date estimate of contractual cash flows not expected to
be collected was nil. The purchase price was finalized in the three month period ended October 31, 2017
with no adjustments.
On April 29, 2016, we acquired pixi* Software GmbH (“Pixi”), a Germany-based provider of technology
solutions for e-commerce order fulfilment and warehouse management. Pixi’s solutions help its customers
automate e-commerce processes originating from online orders, and Pixi is currently integrated with
hundreds of e-commerce sites in Europe. The total purchase price for the acquisition was approximately
$10.6 million, net of cash acquired, which was funded by drawing on our credit facility. The gross
contractual amount of trade receivables acquired was $0.6 million with a fair value of $0.4 million at the
date of acquisition. Our acquisition date estimate of contractual cash flows not expected to be collected
was $0.2 million. The purchase price was finalized in the three month period ended April 30, 2017 with no
adjustments.

70
The final purchase price allocations for businesses we acquired during 2017 are as follows:
The acquired intangible assets are being amortized over their estimated useful lives as follows:
Pixi
Appterra
4Solutions
Datamyne
Customer agreements and relationships 9 years 11 years 8 years 9 years
Existing technology 5 years 5 years 2 years 6 years
Trade names N/A N/A 5 years 9 years
Non-compete covenants N/A 5 years N/A 5 years
The goodwill on the Pixi, Appterra, 4Solutions and Datamyne acquisitions arose as a result of the combined
strategic value to our growth plan. The goodwill arising from the Pixi, 4Solutions and Datamyne
acquisitions is not deductible for tax purposes. The goodwill arising from the Appterra acquisition is
deductible for tax purposes.
Pro Forma Results of Operations (Unaudited)
The financial information in the table below summarizes selected results of operations on a pro forma
basis as if we had acquired PinPoint, Velocity Mail, Aljex, MacroPoint, PCSTrac, ShipRush, Datamyne,
4Solutions, Appterra and Pixi as of the beginning of each of the periods presented.
This pro forma information is for information purposes only and does not purport to represent what our
results of operations for the periods presented would have been had the acquisitions of PinPoint, Velocity
Pixi
Appterra
4Solutions
Datamyne
Total
Purchase price consideration:
Cash, less cash acquired
related to Pixi ($688),
Appterra ($66), 4Solutions
($281) and Datamyne ($2,637)
10,648
5,703
2,456
52,541
71,348
Contingent consideration - 700 - - 700
Net working capital
adjustments (receivable)
(26)
(118)
4
(567)
(707)
10,622 6,285 2,460 51,974 71,341
Allocated to:
Current assets, excluding cash
acquired
500 391 257 1,837 2,985
Property and equipment 46 21 33 87 187
Deferred income tax asset - 18 - 3,281 3,299
Current liabilities (523) (328) (182) (1,263) (2,296)
Deferred revenue (78) (633) (164) (2,979) (3,854)
Deferred income tax liability (1,870) - (443) (10,955) (13,268)
Income tax liability - - - (694) (694)
Net tangible liabilities assumed (1,925) (531) (499) (10,686) (13,641)
Finite life intangible assets
acquired:
Customer agreements and
relationships
1,375 1,840 910 13,300 17,425
Existing technology 4,467 1,160 607 12,500 18,734
Trade names - - 91 1,790 1,881
Non-compete covenants - 50 - 390 440
Goodwill 6,705 3,766 1,351 34,680 46,502
10,622 6,285 2,460 51,974 71,341

71
Mail, Aljex, MacroPoint, PCSTrac, ShipRush, Datamyne, 4Solutions, Appterra and Pixi occurred at the
beginning of the period indicated, or to project our results of operations for any future period.
Year Ended January 31, January 31, January 31,
2019 2018 2017
Revenues 281,419 266,074 252,910
Net income 31,889 25,704 20,044
Earnings per share
Basic 0.42 0.34 0.26
Diluted 0.41 0.33 0.26
Note 4 – Fair Value Measurements
ASC Topic 820 “Fair Value Measurements and Disclosures” (Topic 820) defines fair value as the price that
would be received upon sale of an asset or paid upon transfer of a liability in an orderly transaction
between market participants at the measurement date and in the principal or most advantageous market
for that asset or liability. The fair value, in this context, should be calculated based on assumptions that
market participants would use in pricing the asset or liability, not on assumptions specific to the entity. In
addition, the fair value of liabilities should include consideration of non-performance risk, including our
own credit risk.
Topic 820 establishes a fair value hierarchy which prioritizes the inputs used in the valuation
methodologies in measuring fair value into three levels:
• Level 1—inputs are based upon unadjusted quoted prices for identical instruments traded in active
markets.
• Level 2—inputs are based upon quoted prices for similar instruments in active markets, quoted
prices for identical or similar instruments in markets that are not active, and model-based valuation
techniques for which all significant assumptions are observable in the market or can be
corroborated by observable market data for substantially the full term of the assets or liabilities.
• Level 3—inputs are generally unobservable and typically reflect management’s estimates of
assumptions that market participants would use in pricing the asset or liability. The fair values are
therefore determined using model-based techniques that include option pricing models, discounted
cash flow models, and similar techniques.
The carrying amounts of the Company’s cash, accounts receivable (net), accounts payable, accrued
liabilities and income taxes payable approximate their fair value (a Level 2 measurement) due to their
short maturities.
The Company enters into equity derivative contracts including floating-rate equity forwards to partially
offset the potential fluctuations of certain future share-based compensation expenses. The Company does
not hold derivatives for speculative purposes. As at January 31, 2019, we had equity derivatives for
273,000 Descartes common shares with a weighted average price of $20.86.
The following table shows the Company’s derivative instruments measured at fair value on a recurring
basis as of January 31, 2019:
Fair Value of
Derivatives
Designated as Hedge
Instruments
Fair Value of
Derivatives Not
Designated As Hedge
Instruments Fair Value
Derivative assets:
Equity contracts - 2,794 2,794

72
The fair value of equity contract derivatives is determined utilizing a valuation model based on the quoted
market value of our common shares at the balance sheet date (Level 2 fair value inputs). The fair value
of equity contract derivatives is recorded as other current assets and gains and losses are recorded in
general and administrative expenses in the consolidated financial statements. For the years ended January
31, 2019, 2018 and 2017, we recognized an expense (recovery) in general and administrative expenses
of ($1.2) million, ($1.1) million and ($0.5) million.
Note 5 – Trade Receivables
January 31, January 31,
2019 2018
Trade receivables 33,350 30,111
Less: Allowance for doubtful accounts (1,857) (1,319)
31,493 28,792
Included in accounts receivable are unbilled receivables in the amount of $1.0 million as at January 31,
2019 ($0.6 million as at January 31, 2018). For the years ended January 31, 2019, 2018 and 2017, bad
debt expense was $1.2 million, $0.8 million and $0.6 million, respectively.
Note 6 – Other Receivables
January 31, January 31,
2019 2018
Net working capital adjustments receivable from acquisitions 55 118
Other receivables 4,276 3,053
4,331 3,171
Other receivables include receivables related to sales and use taxes, income taxes, non-trade receivables
and contract assets. At January 31, 2019, $0.1 million ($0.1 million as at January 31, 2018) of the net
working capital adjustments receivable from acquisitions is recoverable from amounts held in escrow
related to the respective acquisitions. The change in net working capital adjustments receivable from
acquisitions is primarily due to payments received during the period.
Note 7 – Inventory
At January 31, 2019 and January 31, 2018, inventory is entirely comprised of finished goods inventory.
Finished goods inventory primarily consists of hardware and related parts for mobile asset units held for
sale. For the years ended January 31, 2018, 2017 and 2016, a provision for excess or obsolete inventories
has been recorded in cost of revenues of nominal, $0.1 million and nil, respectively.

73
Note 8 – Property and Equipment
January 31, January 31,
2019 2018
Cost
Computer equipment and software 34,870 36,374
Furniture and fixtures 1,262 1,296
Leasehold improvements 444 438
36,576 38,108
Accumulated amortization
Computer equipment and software 23,070 24,403
Furniture and fixtures 634 669
Leasehold improvements 260 238
23,964 25,310
Net 12,612 12,798
Note 9 - Intangible Assets
January 31, January 31,
2019 2018
Cost
Customer agreements and relationships 177,224 162,772
Existing technology 184,641 174,506
Trade names 7,754 7,532
Non-compete covenants 6,173 5,980
375,792 350,790
Accumulated amortization
Customer agreements and relationships 82,028 73,621
Existing technology 110,051 92,304
Trade names 4,456 4,221
Non-compete covenants 3,065 2,643
199,600 172,789
Net 176,192 178,001
Intangible assets related to our acquisitions are recorded at their fair value at the acquisition date. The
change in intangible assets during the year ended January 31, 2019 is primarily due to the acquisitions of
Aljex, Velocity Mail and PinPoint, partially offset by amortization. The balance of the change in intangible
assets is due to foreign currency translation.
Intangible assets with a finite life are amortized into income over their useful lives. Amortization expense
for existing intangible assets is expected to be $176.2 million over the following periods: $38.8 million for
2020, $35.3 million for 2021, $31.1 million for 2022, $23.7 million for 2023, $12.3 million for 2024 and
$35.0 million thereafter. Expected future amortization expense is subject to fluctuations in foreign
exchange rates and assumes no future adjustments to acquired intangible assets.

74
Note 10 – Goodwill
Goodwill is recorded when the consideration paid for an acquisition of a business exceeds the fair value of
identifiable net tangible and intangible assets acquired. The following table summarizes the changes in
goodwill since January 31, 2017:
January 31, January 31,
2019 2018
Balance at beginning of year 350,148 263,113
Acquisition of Datamyne - (435)
Acquisition of ShipRush - 8,603
Acquisition of PCSTrac - 5,815
Acquisition of MacroPoint - 65,213
Acquisition of Aljex 18,903 -
Acquisition of Velocity Mail 8,448 -
Acquisition of PinPoint 6,306 -
Adjustments on account of foreign exchange (5,627) 7,839
Balance at end of year 378,178 350,148
Note 11 - Accrued Liabilities
January 31, January 31,
2019 2018
Accrued compensation and benefits 16,771 14,234
Accrued professional fees 1,137 1,107
Other accrued liabilities 11,484 10,197
29,392 25,538
Other accrued liabilities include accrued expenses related to third party resellers and royalties, suppliers,
accrued restructuring charges and accrued contingent acquisition purchase consideration.
Note 12 - Debt
On January 25, 2019, we amended and increased our existing $150.0 million senior secured revolving
credit facility. The newly amended and increased facility is now a $350.0 million revolving operating credit
facility to be available for general corporate purposes, including the financing of ongoing working capital
needs and acquisitions. With the approval of the lenders, the credit facility can be expanded to a total of
$500.0 million. The credit facility has a five-year maturity with no fixed repayment dates prior to the end
of the five-year term ending January 2024. Borrowings under the credit facility are secured by a first
charge over substantially all of Descartes’ assets. Depending on the type of advance, interest rates under
the revolving operating portion of the credit facility are based on the Canada or US prime rate, Bankers’
Acceptance (BA) or London Interbank Offered Rate (LIBOR) plus an additional 0 to 250 basis points based
on the ratio of net debt to adjusted earnings before interest, taxes, depreciation and amortization, as
defined in the credit agreement. A standby fee of between 20 to 40 basis points will be charged on all
undrawn amounts. The credit facility contains certain customary representations, warranties and
guarantees, and covenants.
75
Long-term debt is comprised of the following:
January 31, January 31,
2019 2018
Credit facility 25,464 37,000
Available for use 324,536 113,000
As at January 31, 2019, the outstanding balance of $25.5 million was required to be repaid prior to
February 2024. We were in compliance with the covenants of the credit facility as of January 31, 2019.
As at January 31, 2019, we had outstanding letters of credit of approximately $0.2 million ($0.3 million
as at January 31, 2018), which were not related to our credit facility.
Note 13 - Commitments, Contingencies and Guarantees
Commitments
The following information is provided in respect of our operating and capital lease obligations:
Years Ended January 31,
Operating
Leases
Capital
Leases Total
2020 4,627 51 4,678
2021 3,046 2 3,048
2022 1,979 - 1,979
2023 1,470 - 1,470
2024 1,038 - 1,038
2025 737 - 737
2026 733 - 733
2027 271 - 271
13,901 53 13,954
Lease Obligations
We are committed under non-cancelable operating leases for business premises, computer equipment and
vehicles with terms expiring at various dates through 2027. We are also committed under non-cancelable
capital leases for computer equipment expiring at various dates through 2021. The future minimum
amounts payable under these lease agreements are outlined in the chart above. The $0.1 million balance
of the capital lease obligation outstanding at January 31, 2019 is included in accrued liabilities in the
consolidated balance sheet. For the years ended January 31, 2019, 2018 and 2017, rental expense from
operating leases was $5.2 million, $5.1 million and $4.9 million, respectively.
Other Obligations
As described in Note 2 to these consolidated financial statements, we maintain deferred share unit (“DSU”)
and cash-settled restricted share unit (“CRSU”) plans for our directors and employees. Any payments
made pursuant to these plans are settled in cash. For DSUs and CRSUs, the units vest over time and the
liability recognized at any given consolidated balance sheet date reflects only those units vested at that
date that have not yet been settled in cash. As such, we had an unrecognized aggregate liability for the
unvested CRSUs and unvested DSUs of $0.8 million and nil, respectively, for which no liability was recorded
in the consolidated balance sheet at January 31, 2019, in accordance with ASC Topic 718, “Compensation
– Stock Compensation”. The ultimate liability for any payment of DSUs and CRSUs is dependent on the
trading price of our common shares. To offset our exposure to fluctuations in our stock price, we have
entered into equity derivative contracts, including floating-rate equity forwards. As at January 31, 2019, we had equity derivatives for 273,000 Descartes common shares and a DSU liability for 277,390 Descartes
common shares, resulting in minimal net exposure resulting from changes to our share price.

76
Contingencies
We are subject to a variety of other claims and suits that arise from time to time in the ordinary course
of our business. The consequences of these matters are not presently determinable but, in the opinion of
management after consulting with legal counsel, the ultimate aggregate liability is not currently expected
to have a material effect on our results of operations or financial position.
Product Warranties
In the normal course of operations, we provide our customers with product warranties relating to the
performance of our hardware, software and services. To date, we have not encountered material costs as
a result of such obligations and have not accrued any liabilities related to such obligations in our
consolidated financial statements.
Business combination agreements
In respect of our acquisitions of Appterra, ShipRush and PinPoint, up to $3.8 million in cash may become
payable if certain revenue performance targets are met in the two years following the acquisition. A
balance of $2.2 million is accrued related to the fair value of this contingent consideration as at January
31, 2019.
Guarantees
In the normal course of business, we enter into a variety of agreements that may contain features that
meet the definition of a guarantee under ASC Topic 460, “Guarantees”. The following lists our significant
guarantees:
Intellectual property indemnification obligations
We provide indemnifications of varying scope to our customers against claims of intellectual property
infringement made by third parties arising from the use of our products. In the event of such a claim, we
are generally obligated to defend our customers against the claim and we are liable to pay damages and
costs assessed against our customers that are payable as part of a final judgment or settlement. These
intellectual property infringement indemnification clauses are not generally subject to any dollar limits and
remain in force for the term of our license agreement with our customer, which license terms are typically
perpetual. Historically, we have not encountered material costs as a result of such indemnification
obligations.
Other indemnification agreements
In the normal course of operations, we enter into various agreements that provide general indemnities.
These indemnities typically arise in connection with purchases and sales of assets, securities offerings or
buy-backs, service contracts, administration of employee benefit plans, retention of officers and directors,
membership agreements, customer financing transactions, and leasing transactions. In addition, our
corporate by-laws provide for the indemnification of our directors and officers. Each of these indemnities
requires us, in certain circumstances, to compensate the counterparties for various costs resulting from
breaches of representations or obligations under such arrangements, or as a result of third party claims
that may be suffered by the counterparty as a consequence of the transaction. We believe that the
likelihood that we could incur significant liability under these obligations is remote. Historically, we have
not made any significant payments under such indemnities.
In evaluating estimated losses for the guarantees or indemnities described above, we consider such factors
as the degree of probability of an unfavorable outcome and the ability to make a reasonable estimate of
the amount of loss. We are unable to make a reasonable estimate of the maximum potential amount
payable under such guarantees or indemnities as many of these arrangements do not specify a maximum
potential dollar exposure or time limitation. The amount also depends on the outcome of future events
and conditions, which cannot be predicted. Given the foregoing, to date, we have not accrued any liability
in our financial statements for the guarantees or indemnities described above.

77
Note 14 – Share Capital
On June 6, 2018, we filed a final short-form base shelf prospectus (the “Base Shelf Prospectus”), allowing
us to offer and issue the following securities: (i) common shares; (ii) preferred shares; (iii) senior or
subordinated unsecured debt securities; (iv) subscription receipts; (v) warrants; and (vi) securities
comprised of more than one of the aforementioned common shares, preferred shares, debt securities,
subscription receipts and/ or warrants offered together as a unit. These securities may be offered
separately or together, in separate series, in amounts, at prices and on terms to be set forth in one or
more shelf prospectus supplements. The aggregate initial offering price of securities that may be sold by
us (or certain of our current or future shareholders) pursuant to the Base Shelf Prospectus during the 25-
month period that the Base Shelf Prospectus, including any amendments thereto, remains valid is limited
to an aggregate of $750 million.
The following table sets forth the common shares outstanding (number of shares in thousands):
January 31, January 31, January 31,
(thousands of shares) 2019 2018 2017
Balance, beginning of year 76,773 75,875 75,761
Shares issued:
Stock options and share units exercised 46 141 114
Acquisitions (Note 3) 46 757 -
Balance, end of year 76,865 76,773 75,875
Cash flows provided from stock options and share units exercised during 2019, 2018 and 2017 were
approximately $0.5 million, $1.0 million and $0.6 million, respectively.
Note 15 - Earnings Per Share
The following table sets forth the computation of basic and diluted earnings per share (“EPS”) (number of
shares in thousands):
Year Ended January 31,
2019
January 31,
2018
January 31,
2017
Net income for purposes of calculating basic and diluted
earnings per share 31,277 26,879 23,838
Weighted average shares outstanding
76,832
76,324
75,800
Dilutive effect of employee stock options 205 167 230
Dilutive effect of restricted and performance share units 754 621 485
Weighted average common and common equivalent shares
outstanding
77,791
77,112
76,515
Earnings per share
Basic 0.41 0.35 0.31
Diluted 0.40 0.35 0.31
For the years ended January 31, 2019, 2018 and 2017, the application of the treasury stock method
excluded 271,869, 270,525 and 145,932 stock options, respectively, from the calculation of diluted EPS
as the assumed proceeds from the unrecognized stock-based compensation expense of such stock options
that are attributed to future service periods made such stock options anti-dilutive.
For the years ended January 31, 2019, 2018 and 2017, nil, 2,475 and 25,000 stock options, respectively,
were excluded from the calculation of diluted EPS as those options had an exercise price greater than or

78
equal to the average market value of our common shares during the applicable periods and their inclusion
would have been anti-dilutive.
Note 16 - Stock-Based Compensation Plans
Total estimated stock-based compensation expense recognized in our consolidated statement of
operations was as follows:
Year Ended January 31, January 31, January 31,
2019 2018 2017
Cost of revenues 160 90 40
Sales and marketing 436 246 81
Research and development 184 85 14
General and administrative 2,930 2,386 1,887
Effect on net income 3,710 2,807 2,022
Differences between how GAAP and applicable income tax laws treat the amount and timing of recognition
of stock-based compensation expense may result in a deferred tax asset. We have recorded a valuation
allowance against any such deferred tax asset except for $0.6 million ($0.6 million at January 31, 2018)
recognized in the United States. The tax benefit realized in connection with stock options exercised during
2019, 2018 and 2017 was $0.2 million, nominal and nominal, respectively.
Stock Options
As of January 31, 2019, we had 742,838 stock options granted and outstanding under our shareholder-
approved stock option plan and 4,005,138 remained available for grant. In addition, we had 136,500 stock
options outstanding pursuant to option grants made outside of our shareholder-approved stock option
plan as permitted under the rules of the Toronto Stock Exchange in certain circumstances.
As of January 31, 2019, $2.1 million of total unrecognized compensation costs, net of forfeitures, related
to non-vested stock option awards is expected to be recognized over a weighted average period of 2.4
years. The total fair value of stock options vested during 2019 was $1.3 million.
The total number of options granted during the years ended January 31, 2019, 2018 and 2017 was
272,144, 274,500 and 170,932, respectively. The weighted average grant-date fair value of options
granted during the years ended January 31, 2019, 2018 and 2017 was $7.10, $5.26 and $4.46 per option,
respectively.
The weighted-average assumptions were as follows:
Year Ended January 31,
2019
January 31,
2018
January 31,
2017
Expected dividend yield (%) - - -
Expected volatility (%) 23.6 23.5 25.2
Risk-free rate (%) 2.0 1.0 0.6
Expected option life (years) 5 5 5

79
A summary of option activity under all of our plans is presented as follows:
Number of
Stock Options
Outstanding
Weighted-
Average
Exercise
Price
Weighted-
Average
Remaining
Contractual
Life (years)
Aggregate
Intrinsic
Value
(in millions)
Balance at January 31, 2017 526,321 $12.36 4.2 4.9
Granted 274,500 $23.18
Exercised (142,112) $6.98
Forfeited (1,500) $23.14
Balance at January 31, 2018 657,209 $18.21 4.9 5.7
Granted 272,144 $27.96
Exercised (46,065) $11.75
Forfeited (3,950) $26.43
Balance at January 31, 2019 879,338 $21.41 4.7 8.7
Vested or expected to vest at January 31,
2019
879,338 $21.41 4.7 8.7
Exercisable at January 31, 2019 536,620 $19.17 4.2 6.5
The total intrinsic value of options exercised during the years ended January 31, 2019, 2018 and 2017
was approximately $0.8 million, $2.5 million and $1.8 million, respectively.
Options outstanding and options exercisable as at January 31, 2019 by range of exercise price are as
follows:
Options Outstanding Options Exercisable
Range of Exercise Prices
Weighted
Average
Exercise
Price
Number of
Stock
Options
Weighted
Average
Remaining
Contractual
Life (years)
Weighted
Average
Exercise
Price
Number of
Stock
Options
$6.87 – $6.87 $6.87 20,000 0.4 $6.87 20,000
$11.62 – $11.79 $11.77 159,500 2.4 $11.77 136,000
$19.02 - $22.94 $21.52 427,969 4.8 $21.05 302,504
$26.34 – $27.96 $27.95 271,869 6.2 $27.95 78,116
$21.41 879,338 4.7 $19.17 536,620

80
A summary of the status of our unvested stock options under our shareholder-approved stock option plan
as of January 31, 2019 is presented as follows:
Number of
Stock Options
Outstanding
Weighted-
Average Grant-
Date Fair Value
per Share
Balance at January 31, 2017 152,292 $4.12
Granted 274,500 $5.26
Vested (149,225) $4.70
Forfeited (1,500) $5.25
Balance at January 31, 2018 276,067 $4.98
Granted 272,144 $7.10
Vested (219,043) $5.56
Forfeited (3,950) $6.41
Balance at January 31, 2019 325,218 $6.18
The above noted table excludes the 136,500 options pursuant to option grants made outside of our
shareholder-approved stock option plan as permitted under the rules of the Toronto Stock Exchange in
certain circumstances.
Performance Share Units
A summary of PSU activity is as follows:
Number of
PSUs
Outstanding
Weighted-
Average
Granted Date
Fair Value
Weighted-
Average
Remaining
Contractual
Life (years)
Aggregate
Intrinsic
Value
(in millions)
Balance at January 31, 2017 337,647 $13.73 6.6 7.3
Granted 51,121 $30.13
Performance units issued 51,752 $14.37
Balance at January 31, 2018 440,520 $15.91 6.1 11.9
Granted 54,351 $35.23
Performance units issued 35,512 $19.59
Balance at January 31, 2019 530,383 $18.02 5.5 16.6
Vested or expected to vest at January 31,
2019
530,383 $18.02 5.5 16.6
Exercisable at January 31, 2019 424,911 $14.40 4.8 13.3
The aggregate intrinsic values represent the total pre-tax intrinsic value (the aggregate closing share price
of our common shares on January 31, 2019) that would have been received by PSU holders if all PSUs
had been vested on January 31, 2019.
As of January 31, 2019, $1.8 million of total unrecognized compensation costs related to non-vested
awards is expected to be recognized over a weighted average period of 1.5 years. The total fair value of
PSUs vested during 2019 was $2.0 million.
81
Restricted Share Units
A summary of RSU activity is as follows:
Number of
RSUs
Outstanding
Weighted-
Average
Granted Date
Fair Value
Weighted-
Average
Remaining
Contractual
Life (years)
Aggregate
Intrinsic
Value
(in millions)
Balance at January 31, 2017 263,235 $11.17 6.7 5.7
Granted 35,785 $23.14
Balance at January 31, 2018 299,020 $12.80 6.1 8.1
Granted 38,046 $27.96
Balance at January 31, 2019 337,066 $14.42 5.6 10.6
Vested or expected to vest at January 31,
2019
337,066 $14.42 5.6 10.6
Exercisable at January 31, 2019 299,773 $12.93 5.2 9.4
The aggregate intrinsic values represent the total pre-tax intrinsic value (the aggregate closing share price
of our common shares on January 31, 2019) that would have been received by RSU holders if all RSUs
had been vested on January 31, 2019.
As of January 31, 2019, $1.0 million of total unrecognized compensation costs related to non-vested
awards is expected to be recognized over a weighted average period of 1.7 years. The total fair value of
RSUs vested during 2019 was $0.9 million.
Deferred Share Unit Plan
As at January 31, 2019, the total number of DSUs held by participating directors was 277,390 (242,082
at January 31, 2018), representing an aggregate accrued liability of $8.6 million ($6.8 million at January
31, 2018). During 2019, 35,308 DSUs were granted and nil DSUs were redeemed and settled in cash. As
at January 31, 2019, the unrecognized aggregate liability for the unvested DSUs was nil (nil at January
31, 2018). The fair value of the DSU liability is based on the closing price of our common shares at the
balance sheet date. The total compensation cost related to DSUs recognized in our consolidated
statements of operations was approximately $2.2 million, $2.3 million and $1.6 million for the years ended
January 31, 2019, 2018 and 2017, respectively.

82
Cash-Settled Restricted Share Unit Plan
A summary of activity under our CRSU plan is as follows:
Number of
CRSUs
Outstanding
Weighted-
Average
Remaining
Contractual
Life (years)
Balance at January 31, 2017 77,329 1.4
Granted 32,978
Vested and settled in cash (50,802)
Forfeited (1,334)
Balance at January 31, 2018 58,171 1.5
Granted 32,261
Vested and settled in cash (45,369)
Balance at January 31, 2019 45,063 1.6
Non-vested at January 31, 2019 45,063 1.6
We recognize the compensation cost of the CRSUs ratably over the service/vesting period relating to the
grant and have recorded an aggregate accrued liability of $0.6 million at January 31, 2019 ($0.8 million
at January 31, 2018). As at January 31, 2019, the unrecognized aggregate liability for the unvested CRSUs
was $0.8 million ($0.9 million at January 31, 2018). The fair value of the CRSU liability is based on the
closing price of our common shares at the balance sheet date. The total compensation cost related to
CRSUs recognized in our consolidated statements of operations was approximately $0.8 million, $1.0
million and $0.8 million for the years ended January 31, 2019, 2018 and 2017, respectively.
Note 17 - Income Taxes
Income before income taxes is earned in the following tax jurisdictions:
Year Ended January 31, January 31, January 31,
2019 2018 2017
Canada 16,715 17,964 19,560
United States 11,077 6,203 2,670
Other countries 11,718 10,581 9,270
39,510 34,748 31,500

83
Income tax expense is incurred in the following jurisdictions:
Year Ended January 31, January 31, January 31,
2019 2018 2017
Current income tax expense
Canada 3,037 1,243 447
United States 1,298 494 873
Other countries 1,707 4,835 2,702
6,042 6,572 4,022
Deferred income tax expense (recovery)
Canada 2,531 2,051 4,251
United States 67 1,876 1,272
Other countries (407) (2,630) (1,883)
2,191 1,297 3,640
8,233 7,869 7,662
Income tax expense for 2019, 2018 and 2017 was 21%, 23% and 24% of income before income taxes,
respectively, with current income tax expense being 15%, 19% and 13% of income before income taxes,
respectively.
Current income tax expense decreased in 2019 compared to 2018 primarily related to a net favorable
outcome on the conclusion of certain tax audits partially offset by higher current income tax expense as
a result of the higher pre-tax income generated in 2019.
Current tax expense increased in 2018 compared to 2017 primarily due to a charge of $1.5 million
attributable to changes in the estimate of our uncertain tax positions, $0.8 million in Canada as a result
of less income being sheltered by loss carry-forwards and other attributes and $0.3 million in adjustments
in respect to income tax of previous periods.
Deferred income tax expense increased in 2019 compared to 2018 primarily due to the adoption of
Accounting Standards Update 2016-16.
Deferred income tax expense decreased in 2018 compared to 2017 primarily due to $1.1 million in
reductions to corporate income tax rates in the US and EMEA and a $0.7 million reduction in deferred tax
charges and recognition of deferred tax assets related to stock compensation.

84
The components of the deferred income tax assets and liabilities are as follows:
January 31, January 31,
2019 2018
Assets
Accrued liabilities not currently deductible 11,483 9,060
Accumulated net operating losses 11,081 13,868
Research and development and other tax credits and expenses 911 1,580
Total deferred income tax assets 23,475 24,508
Liabilities
Difference between tax and accounting basis of intangible assets (23,974) (12,976)
Difference between tax and accounting basis of property and equipment (909) (6,933)
Other timing differences (574) (267)
Total deferred income tax liabilities (25,457) (20,176)
Net deferred income taxes (1,982) 4,332
Valuation allowance (9,927) (11,257)
Net deferred income taxes, net of valuation allowance (11,909) (6,925)
As at January 31, 2019, we have not accrued for foreign withholding taxes and Canadian income taxes
applicable to approximately $303.3 million of unremitted earnings of subsidiaries operating outside of
Canada. These earnings, which we consider to be invested indefinitely, will become subject to these taxes
if and when they are remitted as dividends or if we sell our stock in the subsidiaries. If we decide to
repatriate the foreign earnings, we would need to adjust our income tax provision in the period we
determined that the earnings will no longer be indefinitely invested outside Canada.
The provision (recovery) for income taxes varies from the expected provision at the statutory rates for
the reasons detailed in the table below:
Year Ended January 31, January 31, January 31,
2019 2018 2017
Income before income taxes 39,510 34,748 31,500
Combined basic Canadian statutory rates 26.5% 26.5% 26.5%
Income tax expense based on the above rates 10,470 9,207 8,347
Increase (decrease) in income taxes resulting from:
Permanent differences including amortization of intangible
assets
(133) (1,870) (882)
Effect of differences between Canadian and foreign tax rates (172) 595 213
Effect of rate changes on current year timing differences (245) (571) 495
Adjustments relating to previous periods (973) (152) (431)
Increase (decrease) in tax reserves (515) 1,954 492
Valuation allowance (344) (1,564) (1,580)
Stock based compensation 231 (135) 351
Deferred tax charges - 179 400
Other, including foreign exchange (86) 226 257
Income tax expense 8,233 7,869 7,662

85
We have income tax loss carry forwards which expire as follows:
Expiry year
United
States EMEA Asia Pacific Total
2020 - - 671 671
2021 - - 273 273
2022 1 - 48 49
2023 12 1,162 - 1,174
2024 - 131 - 131
Thereafter 5,271 46,459 4,524 56,254
5,284 47,752 5,516 58,552
The following is a tabular reconciliation of the total estimated liability associated with uncertain tax
positions taken:
January 31, January 31,
2019 2018
Liability, beginning of year 8,977 6,388
Gross increases – current period 493 3,368
Lapsing due to statutes of limitations (1,646) (779)
Liability, end of year 7,824 8,977
We have identified accruals of $7.8 million with respect to uncertain tax positions as at January 31, 2019.
It is possible that these uncertain tax positions will not be realized in which case up to $7.6 million of the
recorded liability will decrease the effective tax rate in future years if this liability is reversed. We believe
that it is reasonably possible that $0.3 million of the uncertain tax positions could decrease tax expense
in the next 12 months relating primarily to tax years becoming statute barred for purposes of future tax
examinations by local taxing jurisdictions.
We recognize accrued interest and penalties related to uncertain tax positions as a current tax expense.
As at January 31, 2019 and January 31, 2018, the unrecognized tax positions have resulted in no material
liability for estimated interest and penalties.
Descartes and our subsidiaries file their tax returns as prescribed by the tax laws of the jurisdictions within
which they operate. We are no longer subject to income tax examinations by tax authorities in our major
tax jurisdictions as follows:
Years No Longer Subject to
Audit
Tax Jurisdiction
United States Federal 2015 and prior
Canada 2017 and prior
United Kingdom 2015 and prior
Sweden 2012 and prior
Norway 2017 and prior
Netherlands 2014 and prior
Belgium 2014 and prior
On December 22, 2017, the U.S. government enacted comprehensive tax legislation commonly referred
to as the Tax Cuts and Jobs Act (the “Tax Act”). Although the legislative changes contained in the Tax Act
are extensive and the interpretation of several aspects of the Tax Act are still unclear, we recorded an
income tax benefit of $0.7 million in 2018 to reflect the reduced U.S. tax rate from 35% to 21% and other effects of the Tax Act. There was no material adjustment to income tax expense for 2019 related to the
Tax Act. The Company will continue to assess the impacts, if any, throughout 2020 as they become known

86
due to changes in its interpretations and assumptions, as well as additional regulatory guidance that may
be issued.
Note 18 – Contract Balances, Performance Obligations and Contract Costs
Deferred Revenue
The following table presents the changes in the deferred revenue balance as follows:
Deferred
Revenue
Balance at January 31, 2018 32,113
Recognition of unearned revenue (27,252)
Deferral of revenue 29,423
Increases from business combinations 1,789
Effect of movements in foreign exchange (982)
Balance at January 31, 2019 35,091
Current 34,236
Long-term 855
Performance Obligations
As of January 31, 2019, approximately $199.9 million of revenue is expected to be recognized in the future
related to performance obligations that are unsatisfied (or partially unsatisfied) at the end of the reporting
period. We expect to recognize revenue on approximately 80% of these remaining performance obligations
over the next 24 months with the balance recognized thereafter.
Contract Assets
The following table presents the changes in the contract assets balance as follows:
Contract
Assets
Balance at January 31, 2018 -
Adjustment for adoption of ASC 606 495
Balance at February 1, 2018 495
Transfers to trade receivables from contract assets (266)
Increases as a result of delivered term licenses recognized as revenue during the
period, net of amounts transferred to trade receivables 606
Effect of movements in foreign exchange (23)
Balance at January 31, 2019 812
Contract Costs
Capitalized contract costs net of accumulated amortization is $7.3 million at January 31, 2019. In the
comparative periods, such contract costs were primarily recognized as selling expenses when incurred.
Capitalized contract costs are amortized consistent with the pattern of transfer to the customer for the
goods and services to which the asset relates. The total contract cost amortization included in sales and
marketing expenses was $1.8 million for the year ended January 31, 2019. There was no impairment loss
in relation to the costs capitalized during the year ended January 31, 2019.
Note 19 - Other Charges
Other charges are comprised of acquisition-related costs and restructuring initiatives which have been undertaken from time to time under various restructuring plans. Acquisition-related costs primarily include
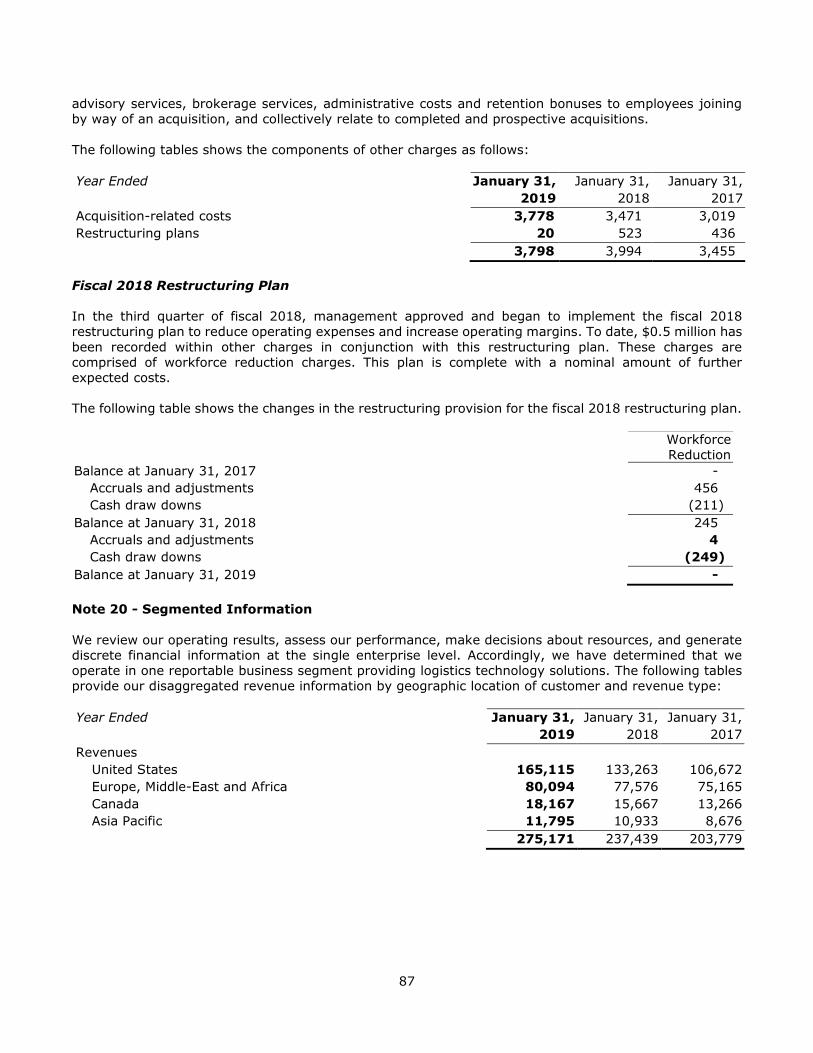
87
advisory services, brokerage services, administrative costs and retention bonuses to employees joining
by way of an acquisition, and collectively relate to completed and prospective acquisitions.
The following tables shows the components of other charges as follows:
Year Ended January 31, January 31, January 31,
2019 2018 2017
Acquisition-related costs 3,778 3,471 3,019
Restructuring plans 20 523 436
3,798 3,994 3,455
Fiscal 2018 Restructuring Plan
In the third quarter of fiscal 2018, management approved and began to implement the fiscal 2018
restructuring plan to reduce operating expenses and increase operating margins. To date, $0.5 million has
been recorded within other charges in conjunction with this restructuring plan. These charges are
comprised of workforce reduction charges. This plan is complete with a nominal amount of further
expected costs.
The following table shows the changes in the restructuring provision for the fiscal 2018 restructuring plan.
Workforce
Reduction
Balance at January 31, 2017 -
Accruals and adjustments 456
Cash draw downs (211)
Balance at January 31, 2018 245
Accruals and adjustments 4
Cash draw downs (249)
Balance at January 31, 2019 -
Note 20 - Segmented Information
We review our operating results, assess our performance, make decisions about resources, and generate
discrete financial information at the single enterprise level. Accordingly, we have determined that we
operate in one reportable business segment providing logistics technology solutions. The following tables
provide our disaggregated revenue information by geographic location of customer and revenue type:
Year Ended January 31, January 31, January 31,
2019 2018 2017
Revenues
United States 165,115 133,263 106,672
Europe, Middle-East and Africa 80,094 77,576 75,165
Canada 18,167 15,667 13,266
Asia Pacific 11,795 10,933 8,676
275,171 237,439 203,779

88
Year Ended January 31, January 31, January 31,
2019 2018 2017
Revenues
Services 241,543 204,376 172,950
Professional services and other 27,774 24,918 23,917
Licenses 5,854 8,145 6,912
275,171 237,439 203,779
License revenues are derived from licenses granted to our customers to use our software products.
Services revenues are comprised of ongoing transactional and/or subscription fees for use of our services
and products by our customers and maintenance, which include revenues associated with maintenance
and support of our services and products. Professional services and other revenues are comprised of
professional services revenues from consulting, implementation and training services related to our
services and products, hardware revenues and other revenues.
The following table provides information by geographic area of operation for our long-lived assets. Long-
lived assets represent property and equipment and intangible assets that are attributed to geographic
areas.
January 31, January 31,
2019 2018
Total long-lived assets
United States 119,958 108,077
Europe, Middle-East and Africa 28,433 37,857
Canada 40,413 44,865
188,804 190,799
Note 21 – Subsequent Event
On February 12, 2019, Descartes acquired substantially all of the assets of the businesses run by the
Management Systems Resources Inc. group of companies (collectively, “Visual Compliance”), a provider
of software solutions and services to automate customs, trade and fiscal compliance processes including
denied and restricted party screening processes and export licensing. The purchase price for the
acquisition was approximately $250 million at February 12, 2019 (approximate CAD $330 million purchase
price), net of cash acquired, which was funded from a combination of drawing on Descartes’ existing credit
facility and issuing to the sellers 0.3 million Descartes common shares from treasury. As of the issue date
of these consolidated financial statements, the fair value of the acquired assets and liabilities has not been
determined.

CORPORATE INFORMATION
Stock Exchange Information
Our common stock trades on the Toronto Stock Exchange
under the symbol DSG and on The Nasdaq Stock Market
under the symbol DSGX.
Transfer Agents
Computershare Investor Services Inc. Computershare Trust Company
100 University Avenue 12039 West Alameda Parkway
Toronto, Ontario M5J 2Y1 Suite Z-2 Lakewood, Colorado
North America: (800) 663-9097 80228 USA
Phone: (416) 263-9200 Phone: (303) 262-0600
Independent Registered Public Accounting Firm
KPMG LLP
Bay Adelaide Centre
333 Bay Street
Suite 4600
Toronto, Ontario M5H 2S5
Phone: (416) 777-8500
Investor Inquiries
Investor Relations
The Descartes Systems Group Inc.
120 Randall Drive
Waterloo, Ontario N2V 1C6
Phone: (519) 746-8110 ext. 202358
Toll Free: (800) 419-8495
E-mail: [email protected]
www.descartes.com
The Descartes Systems Group Inc.
Corporate Headquarters
120 Randall Drive
Waterloo, Ontario N2V 1C6
Canada
Phone: (519) 746-8110
(800) 419-8495
Fax: (519) 747-0082
www.descartes.com
