the design and empirical evaluation of a chemical ... · the design and empirical evaluation of a...
TRANSCRIPT

THE DESIGN AND EMPIRICAL EVALUATION OF A CHEMICAL
PROCESS VISUALIZATION TOOL TO HELP INTRODUCTORY CHEMICAL
ENGINEERING STUDENTS SOLVE MATERIAL BALANCE PROBLEMS
By
PAWAN AGARWAL
A thesis submitted in partial fulfillment of
the requirements for the degree of
MASTER OF SCIENCE IN COMPUTER SCIENCE
WASHINGTON STATE UNIVERSITY School of Electrical Engineering and Computer Science
AUGUST 2009

To the Faculty of Washington State University: The members of the Committee appointed to examine the thesis of PAWAN AGARWAL find it satisfactory and recommend that it be accepted.
___________________________________ Christopher Hundhausen, Ph.D., Chair
___________________________________ Richard Zollars, Ph.D.
___________________________________ Carl Hauser, Ph.D.
ii

ACKNOWLEDGEMENTS
Dr. Christopher Hundhausen of the Department of Electrical Engineering and Computer
Science at Washington State University designed and carried out the statistical analyses
presented in Chapter 4. Dr. Richard Zollars of the Chemical Engineering Department
designed the problems for the study and graded the solutions of the participants. Dr.
Haluk Bayenal of Chemical Engineering Department at WSU for grading the solutions
for agreement analysis. Dr. Bernie Van Wie of Chemical Engineering Department at
WSU for participating in Pilot study and allowing students in his class to take part in our
study. Dr. Andy Stefik for conducting ANCOVA analysis of data. Jon Brown, for
providing support and suggestions throughout the development of the software.
This research is supported by the National Science Foundation under award no. DUE-
0837828. we thank NSF for funding this project which helped me to get financial
support.
I extend my special thanks to my advisor, Dr. Christopher Hundhausen, to have faith in
me and allow me to be part of this project. I thank my wife and fellow graduate student
Anukrati Agrawal for her support and encouragement. Last but not the least I thank my
parents, Shri Vijay Kumar and Smt. Pushpa Agarwal for their blessings and love.
iii

THE DESIGN AND EMPIRICAL EVALUATION OF A CHEMICAL
PROCESS VISUALIZATION TOOL TO HELP INTRODUCTORY CHEMICAL
ENGINEERING STUDENTS SOLVE MATERIAL BALANCE PROBLEMS
Abstract
by Pawan Agarwal, M.S. Washington State University
August 2009
Chair: Christopher Hundhausen
For students in introductory chemical engineering courses, material balance
problems pose a formidable barrier to success. Prior studies have confirmed that students
need additional help beyond class lectures to solve material balance problems. Computer
software constitutes one potential source of help. While commercial software systems for
solving material balance problems exist, due to their complexity, they are inappropriate
for students first learning to solve material balance problems. To explore the potential for
specialized educational software to help students solve material balance problems and
ultimately succeed in introductory chemical engineering courses, this thesis develops and
empirically evaluates ChemProV, a specialized software tool specifically designed to
help introductory chemical engineering students visualize and solve material balance
problems. As students work through a material balance problem using ChemProV, the
tool provides scaffolding in the form of feedback messages. The messages generated by
the system aim to motivate students to correct problems without giving specific solutions.
An experimental evaluation compared the software against the traditional medium for
solving material balance problems—pen and paper. In our quantitative analysis of the
iv

study, ChemProV failed to show any significant performance advantage over pen and
paper. The data shows that 10 participants out of a total 21 created more accurate overall
solutions using ChemProV. The average accuracy of the solutions created using
ChemProV is 69.07% and of solutions created using Pen and Paper is 54.56% for those
10 participants. The statistical test shows positive trend indicating that students with low
grades in the class were benefited more by ChemProV as compared to students who got
grades above average in the class. We examine why ChemProV failed to show significant
performance advantage, and propose directions for further research for enhancing novice
chemical engineering visualization environments and improving the learning experience
of students.
v
TABLE OF CONTENTS
ACKNOWLEDGEMENTS…………………………………………………….iii
ABSTRACT…………………………………………………………………….iv
LIST OF FIGURES……………………………………………………………..vi
LIST OF TABLES……………………………………………………………..viii
CHAPTER
1. INTRODUCTION………………………………………………………..1
2. RELATED WORK……………………………………………………….7
3. INTERFACE…………………………………………………………….26
4. EXPERIMENTAL EVALUATION…………………………………….46
5. CONCLUSION AND FUTURE WORK………………………………..67
BIBLIOGRAPHY……………………………………………………………….75
APPENDIX
A1. Inform Consent Form………………………………………………………..76
A2. Participant Background Questionnaire………………………………………77
A3. Study instructions……………………………………………………………78
A4. ChemProV Tutorial………………………………………………………….83
A5. Pen and Paper Tutorial………………………………………………………95
A6. Exit Questionnaire………………………………………………………….104
vi
LIST OF FIGURES
1. Diagrammatic representation of ZPD…………………………………………08
2. ALVIS with a visual representation of an array and its corresponding code…13
3. Snapshot of CVCK interface………………………………………………….15
4. The ChemSense drawing palette with water molecule………………………..16
5. Sample Hint window…………………………………………………………..18
6. Sample instant feedback……………………………………………………….18
7. Sample of Skillometer…………………………………………………………19
8. Snapshot of PicoMap™ Interface with a concept map…………………………20
9. Create link dialog box………………………………………………………….20
10. ChemProV tool………………………………………………………………....28
11. Chemical stream………………………………………………………………..29
12. Equations editor………………………………………………………………..30
13. Warning message when Quantity consistency is violated in a stream………....32
14. Warning message when Unit consistency is violated in a stream……………...33
15. Warning message when Quantity consistency is violated in a stream…………34
16. Warning message with the out-stream when Unit/Quantity consistency is violated
across the streams……………………………………………………………....35
17. Warning message with the name of missing element when element consistency
rule is violated…………………………………………………………………..36
18. Error message displayed on violation of unit rule in the equations…………….37
vii
19. Error message displayed with the equation when element rule is violated. In this
example, m11 is acetic acid and m21 is ammonia……………………………..38
20. Snapshot of the Solvability status box…………………………………………38
21. Snapshot of the solvability status when one of the unknown elements is missing
from the set of equations created………………………………………………39
22. Solvability status when the set of equations is not independent……………….40
23. Process unit creation…………………………………………………………...41
24. Single Chemical stream creation………………………………………………42
25. Chemical stream creation………………………………………………………42
26. Equations editor showing solvability status of the system and error with the
equation…………………………………………………………………………44
27. Complete PFD and independent set of equations………………………………45
28. Plot of Time on Task……………………………………………………………55
29. Plot of Accuracy………………………………………………………………...56
30. Graph showing the relation of grades to Total correctness……………………..59
31. Graph showing the relation of grades to Equation correctness…………………60
viii
LIST OF TABLES
1. Possible Cohorts for the experiment…………………………………….50
2. Percentage Agreement achieved on grading scheme……………………53
3. Mean time-on-task for each condition…………………………………..54
4. Mean accuracy-on-task for each condition………………………….......54
5. ANOVA results for time-on-task………………………………………..56
6. ANOVA results for Accuracy score……………………………………..56
7. Average ratings and standard deviations for exit questionnaire data……58
8. ANOVA results for exit questionnaire data……………………………...58
9. ANCOVA results of final grades covariate and Total correctness…........58
10. ANCOVA results of final grades covariate and Equation correctness…..59
11. ANOVA results for total accuracy of students with ‘high’ grades………61
12. Mean Accuracy Difference Between Tools by Group…………………...62
13. Data for warning/error messages in the system…………………………..63
ix
Chapter One
Introduction
Today there is ever increasing demand for engineering graduates, and Chemical
Engineering (ChE) educators are faced with a critical problem: how to address the low
retention rate of students in their program. Statistics indicate that less than 50% of
students enrolled in an engineering program graduate with a degree (Borrego, Padilla,
Zhang, Ohland, & T. J. Anderson, 2005) The low rate of success in ChE programs can be
related to the rate of success or failure of students in the introductory “material/balance”
gateway course. This course serves as a critical stepping stone for chemical engineers,
preparing students to solve material balance problems. This, in turn lays a foundation for
subsequent core ChE courses like thermodynamics, kinetics and unit operations. On a
foundational level, this course introduces students to the engineering approach of solving
process related problems which they use throughout their career as chemical engineers
(Richard M Felder, 1986).
Over the past two decades at Washington State University, it has been observed
that approximately 35% of students are not able to pass this gateway course and of this
large majority, 66% of students, eventually lose interest in ever graduating with a
Chemical Engineering degree (Zollars, Hundhausen & Brown, 2008). So the question
arises as to why a large majority of students are not able to succeed, and what can be
done to assist them in their endeavors to succeed.
1

Possible reasons for failure
A typical solution of chemical material balance problem consists of breaking a
process down into its components, identifying the known and unknown variables in the
system and assembling the information to solve for the unknowns. Broadly, it consists of
two parts: (a) create process flow diagram (PFD) and (b) create a set of mathematical
equations. On the basis of the given information in the problem, students have to create a
PFD to represent the behavior of the problem and identify known and unknown
components. Based on this diagram they have to create an independent set of algebraic
equations to solve for the unknown variables in the system.
Past researchers at WSU have identified that most of the students struggle even to
start the problem (Zollars et al., 2008). Once they start, most of them commit mistakes in
creating a PFD, which is the very first step towards solving the problem. For instance, the
sum of mass of subcomponents in a process unit must be equal to overall quantity or
100%. Many students assign mass to subcomponents which is greater than overall mass
or 100%. With this existing error in the system, it is impossible to create correct set of
equations and hence a correct solution. Thus, without scaffolding or help, students may
fail to identify their mistakes early on, which in turn may accumulate into much bigger
mistakes. Eventually, it may become impossible for them to reach to the correct solution
of the problem.
As per Felder and Silverman, most college students are “visual learners” (R. M
Felder & Silverman, 1988), which mean that they understand and remember best when
they see a picture, diagram or visual representation of an item. This was replicated in
ChE110 (Introduction to Chemical Engineering) class of spring 2009 at Washington State
2

University, where we conducted learning style preference test, developed by Felder and
Silverman (R. M Felder & Silverman, 1988). Out of total 23 students enrolled in the class
21 students took the test, and only 1 student had moderate preference for verbal style of
learning. Six students had very strong preference for visual style of learning, 7 had
moderate preference and 7 students were balanced with equal preference for both visual
and verbal style of learning. Similar results of strong preference for visual style of
learning were found for the chemical engineering introductory classes of 2006 & 2007
(Zollars et al., 2008).
In this thesis, we discuss the development and empirical evaluation of a
computer-based tool that provides scaffolding to the students of introductory chemical
engineering courses as they construct process flow diagrams and solve chemical balance
problems.
Motivation for Software
Students face great difficulty in solving material balance problems. Previous
observational studies, conducted at WSU, indicate that students have trouble with two
mappings: (a) mapping the problem statement to a PFD; and (b) mapping the PFD to a set
of equations. It is observed that without guidance most of the students fail to even start
the problem, and once they start they commit mistakes early on which when left
unchecked leads further problems (Zollars et al., 2008). In this scenario, computer-based
scaffolding (Chang, Sung, & Chen, 2001) can ease this process potentially, creating
conditions under which students can succeed and ultimately learn to perform the
mappings.
3

It is very difficult for most of the students to grasp complex new concepts of
material balances only through class lectures. Also every individual understands the same
thing at different pace. Moreover many students feel shy in raising doubts in class
(Wiecha, Gramling, Joachim, & Vanderschmidt, 2003). So if we offer an out-of-class
visualization environment which provides individual visual guidance to students while
they are learning to solve material balance problem, it may help a majority of students to
explore, learn, and come over their weaknesses on their own.
Based on these observations, a computer-based tool that assists students in the
mapping of written problem to its visual representation and helps students continue
learning in their preferred ‘visual’ style may help students ultimately succeed in a an
introductory chemical engineering course.
Research Questions
Considering the need for visual scaffolding learning environment, we have been
working on the existing ChemProV (Chemical Process Visualization) tool to enhance it
to support scaffolding and provide feedback. My ultimate goal is to develop a tool that
can help students learn how to solve material balance problems. This raises the following
research question:
RQ1: How can we design a computer-based tool that helps students to solve material
balance problems and ultimately help them to learn to solve material balance problems
on their own?
4

To test the effectiveness of the tool, we conducted empirical study that pitted the
software against traditional problem solving material - pen and paper.
The second research question is:
In this thesis, we address both these questions by presenting the design of a new
software tool and the results of empirical evaluation of the tool. In the empirical
evaluation, the software did not show any significant quantitative advantage over
traditional learning material (pen-and- paper). However, the evaluation also showed that
the software did no harm—that is, that there was no difference between students’
problem solving with the software and with the current “gold standard” medium for
solving material balance problems. Moreover, exit questionnaire data that we
administered at the end of our experimental study, together with observations of the video
recordings of student problem-solving activities, indicate that students found it easy to
use the software and create process flow diagrams and algebraic equations using the tool.
In addition, their subjective feedback after the study suggests that the software assisted in
learning material balance problems, kept them motivated and helped them to organize
their thoughts. Thus, this project provides a valuable first step in the research, laying the
groundwork for future line of work to improve problem solving skills of chemical
engineering students.
RQ2: Can ChemProV promote better problem-solving accuracy and efficiency than
pen-and-paper, the medium traditionally used to solve material balance problems?
5

Thesis Outline
The remainder of this thesis is organized as follows. Chapter 2 discusses the
relevant field of research and reviews related tools. Chapter 3 describes the ChemProV
software. In Chapter 4, we present the design and results of my experimental evaluation.
Finally, in Section 5 we summarize my contributions, and outline directions for future
research.
6

CHAPTER TWO
RELATED WORK
It has been established that new incoming students of Chemical Engineering
program face great difficulty in the introductory course involving material-balance
problems (Zollars et al., 2008). To retain students in the program and keep them
motivated to pursue a Chemical Engineering degree, one must provide students with
additional guidance and support for learning and developing problem solving skills. The
interface that we present and empirically evaluate is a visualization tool that employs
“instructional scaffolding” to enhance learning and problem solving skills of the students.
In this chapter, we review relevant educational theories; educational tools related to our
interface and some of the available chemical engineering tools.
Visual Learning
Every individual has an inherent preference to one mode of learning over the
other. Some individuals learn better through auditory means (verbal lectures), some learn
better visually, some learn better kinesthetically, and so on (R. M Felder & Silverman,
1988). Many individuals learn better with mix of one or more of the mediums. Based on
an extensive study, Felder and Silverman have categorized different teaching and
learning styles (R. M Felder & Silverman, 1988). For past two decades, this
categorization has helped educators to identify and map the gaps in their teaching styles
and students’ learning styles. They have also developed a learning style test to identify
students’ learning style preferences.
As noted by Felder and Silverman, most college students are visual learners (R. M
Felder & Silverman, 1988). In accordance with the famous saying “a picture is worth a
7
thousand words”, engineering students learn and remember best when they see
something, like a picture, diagram, model or any other form of visual representation. It is
also observed that most engineering students learn by doing—exploring, testing or
experimenting with the information provided to them— which is often referred to as
active learning (R. M Felder & Silverman, 1988).
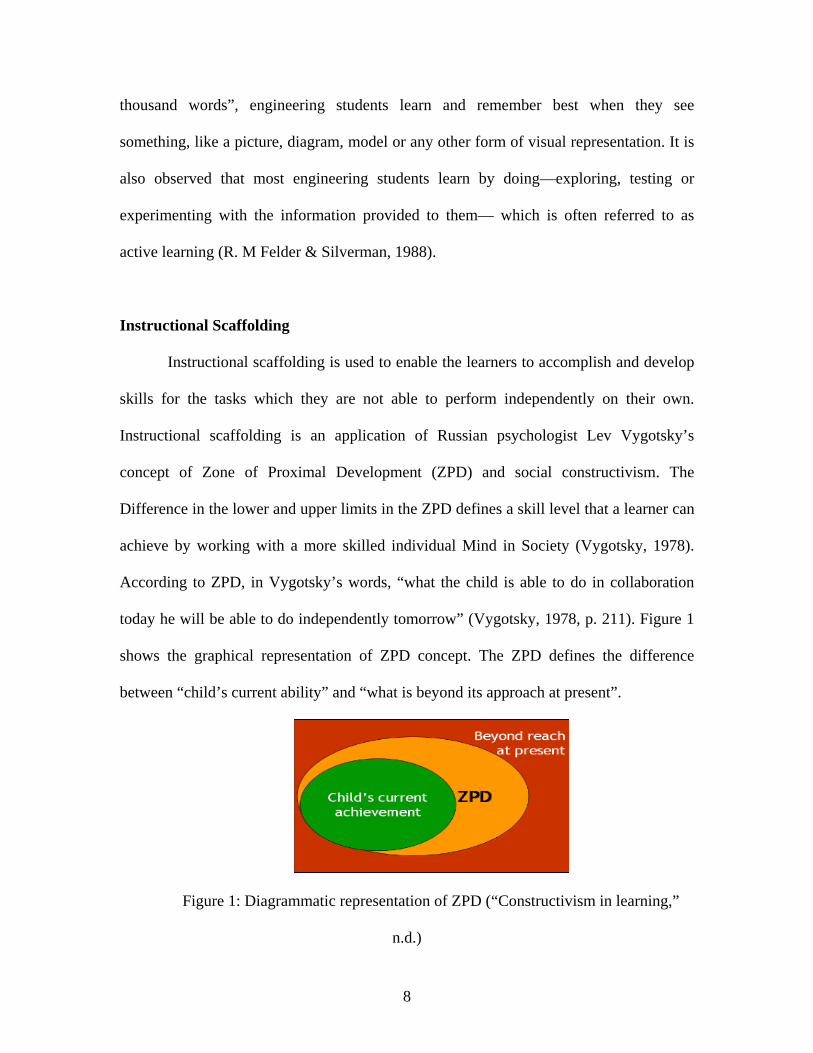
Instructional Scaffolding
Instructional scaffolding is used to enable the learners to accomplish and develop
skills for the tasks which they are not able to perform independently on their own.
Instructional scaffolding is an application of Russian psychologist Lev Vygotsky’s
concept of Zone of Proximal Development (ZPD) and social constructivism. The
Difference in the lower and upper limits in the ZPD defines a skill level that a learner can
achieve by working with a more skilled individual Mind in Society (Vygotsky, 1978).
According to ZPD, in Vygotsky’s words, “what the child is able to do in collaboration
today he will be able to do independently tomorrow” (Vygotsky, 1978, p. 211). Figure 1
shows the graphical representation of ZPD concept. The ZPD defines the difference
between “child’s current ability” and “what is beyond its approach at present”.
Figure 1: Diagrammatic representation of ZPD (“Constructivism in learning,”
n.d.)
8
Social Constructivism is an idea in which learners learn by participating in
increasingly central ways, in a community of practice (Lave & Wenger, 2000). In social
constructivism focus is on learning through interactions and to make an individual think
in correct direction (Di Vesta & Rieber, 1987). In social constructivism pedagogy the
emphasis is on “feedback”.
The term “scaffolding” was first introduced by psychologist Jerome Bruner, who
introduced the concepts of Vygotsky to the modern world (Wood, Bruner, & Ross, 1976).
To better understand the concepts of instructional scaffolding we can use an example
which Bruner used – children’s acquisition of language. As children utter some words
they initially fumble and get feedback from advance speakers. With continuous support
children build their vocabulary and learn the language. As children, new to the language,
attempt to form a sentences but due to limited knowledge initially fail. In this case an
adult provides guidance to them by completing their sentences. This scaffolding is
eventually removed as children learn to form sentences independently on their own.
The design of ChemProV is well grounded in the theory of instructional
scaffolding. In ChemProV, we want to provide scaffolding to the students in order to
make them realize their mistakes and eventually make them capable of solving the
problems on their own. Using this tool, students can reach higher expertise level which
they can not reach or have great difficulty in reaching by working on their own. In our
tool we do not intend give the correct solutions offhand, rather want to draw students’
attention towards their mistakes and ask them to fix those. The cues provide directions
for students to think in the right direction. In this way, our tool works as a guiding
medium and does not becomes a crutch for students, and can be removed once students
9

gains the desired level of skill. In “related tools section”, we discuss “Cognitive Tutor”
which successfully implements the instructional scaffolding theory to tech mathematics
to the children, and see how it motivated design of ChemProV.
Cognitive Load Theory
Human memory is divided into two parts – short term (working memory) and long term
memory. Though long term memory can be huge, working memory fairly limited and it is
this memory which is actively used in process of learning new things. The limit of
working memory was empirically established by G.A. Miller in 1956 when he first
suggested that human working memory is limited to hold seven plus/minus two digits of
information (Miller, 1994, pp. 81-97). Most often humans use previous experiences
stored in long term memory to learn new concepts. These patterns stored in long term
memory are called Schemas.
As described by Sweller, van Merriënboer, and Paas “Cognitive load theory
(CLT) has been designed to provide guidelines intended to assist in the presentation of
information in a manner that encourages learner activities that optimize intellectual
performance” (Sweller, Van Merrienboer, & Paas, 1998, pp. 251-296). CLT divides
cognitive load that is imposed on working memory during process of learning into three
categories - intrinsic load, extraneous load, and germane load.
Intrinsic load represents the amount of working memory required due to intrinsic
difficulty of the material being learned (Chandler & Sweller, 1991, pp. 293-332). As this
load is due to the inherent difficulty associated with the material, it is considered that this
10

load cannot be reduced without removing important elements of the system being
presented to the learner.
Extraneous load is the extra cognitive load imposed by the teaching method or
presentation (Chandler & Sweller, 1991, pp. 293-332). It is not directly useful to learning,
and can be viewed as the “overhead” of whatever means of presenting the material is
used.
Germane load is cognitive load directed toward a learner’s schema development,
and therefore useful. It is generally desired that instructor increase this type of load.
For effective learning to occur, it is required that the total of these three types of
cognitive load must not exceed the learner's capacity, which can vary with the experience
and motivation of an individual (Paas, Tuovinen, Van Merrienboer, & Aubteen Darabi,
2005, pp. 25-34). Thus the onus lies on the instructor to minimize the extraneous load and
increase the germane load by giving realistically complex cognitive tasks. Also, intrinsic
load can be reduced by breaking the task into smaller subtasks such that they require
subschemas to learn and can be combined later to form the whole schema. This is
analogous to breaking of complex task into smaller sub tasks.
Furthermore, research on the extent of the effects of cognitive load has shown an
Expertise Reversal Effect. Essentially, efforts to reduce cognitive load for novice learners
can have a negative impact on more advanced learners (Sweller et al., 1998, pp. 251-
296). For instance, the cuing messages generated by the system to help novice students,
at some point, can create distractions for experienced learners, making it more difficult
for them to learn (Kalyuga, Ayres, Chandler, & Sweller, 2003).
11
Due to lack of educational tools for material balance class, most often students
turn to commercial tools for help. These tools, in addition to solve material balance
problems provide features for solving many other complex problems. Many students
suffer from cognitive overload as extraneous load is very high due to plethora of options
and highly sophisticated features in the tools.
The way, in which ChemProV tool has been designed, it limits the cognitive load
on students. ChemProV is designed to specifically solve material balance problems. So it
provides only very basic components like mixer, separator and chemical stream and basic
unit operations like (, +, -, *, +,), which are required to solve the problems. Thus in our
tool students are provided with no extra information than what is inherently required to
create solution of material balance problems. Hence ChemProV provides the optimal
cognitive load that is inherent to solving material balance problem.
Also as ChemProV is directed to solve material balance problem and incurs no
extra cognitive load, instructors can easily control the germane load by simply adjusting
the difficulty level of the problem.
As CLT provides framework for design of effective educational technologies, the
careful examination of the theory gives us insights on how to improve the efficiency of
our interface.
Related educational tools
ALVIS
Computer Science educators at WSU have designed and implemented
visualization software, ALgorithm VIsualization Storyboarder (ALVIS), to foster visual,
12

active learning among novice programmers (Hundhausen & Brown, 2007, pp. 22-47).
For instance, arrays are containers which in are programming context are used to hold
fixed number of like objects. To learn the concept of arrays, in ALVIS, students can drag
and drop the array in the drawing pane and see the visual representation of an array.
Students can manipulate the arrays and play with them to learn more about how to work
with arrays. This helps students to conceptualize an array and create a visual image in
their mind whenever they use array. This approach of visual representation has been
found to be helpful in improving learning of students in the introductory programming
courses (Hundhausen & Brown, 2007, pp. 22-47).
Figure 2: ALVIS with a visual representation of an array and its corresponding code
My research differs from ALVIS in two respects. First, it is particularly designed
for chemical engineering students so it provides support which is very much required by
chemical engineers. Second, in ChemProV students are allowed to make mistakes and are
given messages to help them identify their mistakes and think in the right direction. In
ALVIS this is achieved by constraining programming choices for the students and
preventing the mistakes.
13

However the rationale to teach students by use of a “visual learning tool” and
purpose to improve learning of novice users links ChemProV to ALVIS. The
experimental data for ALVIS shows positive signs of success in improving learning
among computer science students (Hundhausen & Brown, 2007, pp. 22-47). Success of
ALVIS motivates the development of a similar tool for chemical engineering students.
The Cardio-Vascular Construction Kit
The Cardio-Vascular Construction Kit (CVCK) is a visualization tool used in
teaching biology labs at the university level (Doerry, 1995; Everse et al., n.d.). The
Cardio-Vascular Construction Kit allows the construction of real and hypothetical cardio-
vascular systems. The CVCK interface is very simple with a tool palette and a central
work space for model construction. By dragging and dropping the model components like
simple heart, lungs, blood vessels etc., users can create from very simple to complex
cardio vascular models in the work space (Everse et al., n.d.). Figure 3 shows the snap
shot of CVCK interface. This is very similar to the interface design of ChemProV, where
students can create graphical representations of PFD and can create equations by drag
and drop of the components.
14
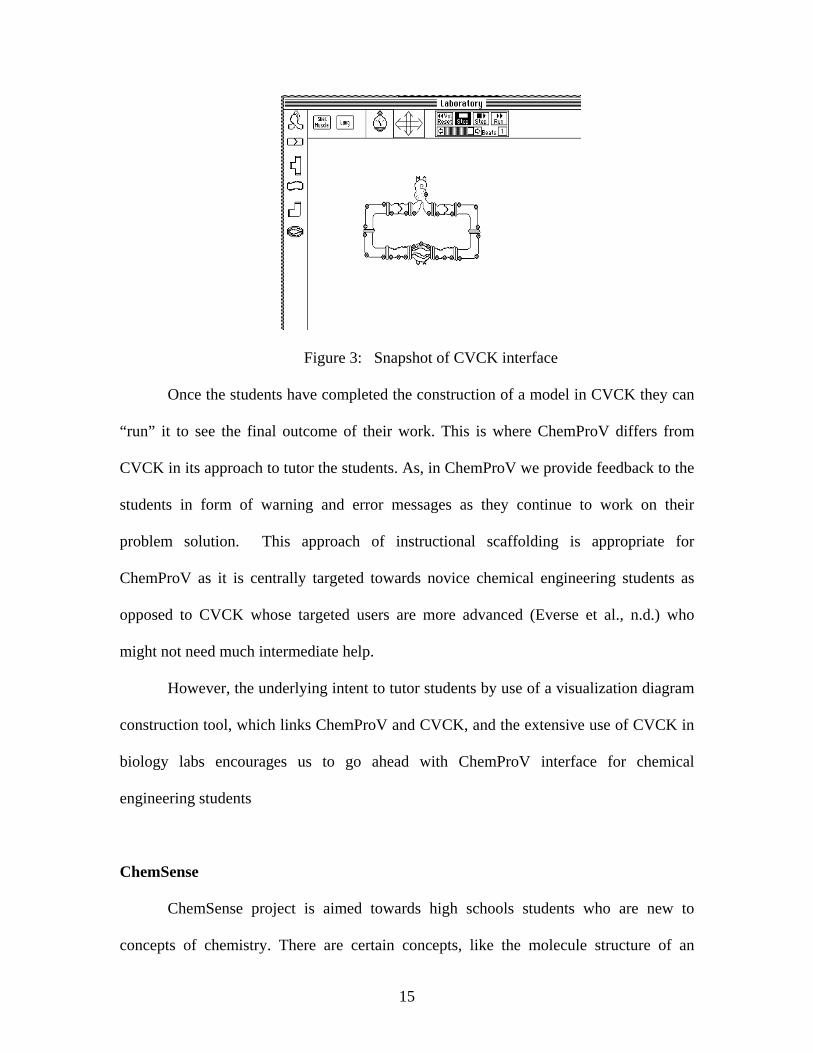
Figure 3: Snapshot of CVCK interface
Once the students have completed the construction of a model in CVCK they can
“run” it to see the final outcome of their work. This is where ChemProV differs from
CVCK in its approach to tutor the students. As, in ChemProV we provide feedback to the
students in form of warning and error messages as they continue to work on their
problem solution. This approach of instructional scaffolding is appropriate for
ChemProV as it is centrally targeted towards novice chemical engineering students as
opposed to CVCK whose targeted users are more advanced (Everse et al., n.d.) who
might not need much intermediate help.
However, the underlying intent to tutor students by use of a visualization diagram
construction tool, which links ChemProV and CVCK, and the extensive use of CVCK in
biology labs encourages us to go ahead with ChemProV interface for chemical
engineering students
ChemSense
ChemSense project is aimed towards high schools students who are new to
concepts of chemistry. There are certain concepts, like the molecule structure of an
15

element or atomic bonds, in chemistry which can not be experienced in daily life nor seen
in the chemistry lab. To help students form a mental model of these finer concepts which
are used to build other concepts, ChemSense allows students to create their own graphical
representations.
ChemSense provides a drawing tool (see figure 4) for students to create their
visual representations of the nanoscopic elements. The tool palette provides only the
basic elements like atoms, bonds, and organic structures (Michalchik et al., 2008). In
addition to the drawing tool, ChemSense provided other tools to simulate animations and
graphs. In these representations, students can make their notes and share these with the
peers and instructors. This enables discursive representations, on which peers and
instructors can comment and collaboratively reach to a new understanding
(“ChemSense,” n.d.).
Figure 4: The ChemSense drawing palette with water molecule (Michalchik et al., 2008)
16
ChemSense project is very closely related to ChemProV, as both the tools are
aimed towards chemistry learning novice students. Both the tools aim to provide students
the ability to create visual representations of their mental models. And by providing
limited number of basic elements they both limit cognitive load on the students. Both
ChemProV and ChemSense are directed towards increasing learning of the students by
providing visual representations and scaffolding. However they differ in the way they
provide scaffolding. In ChemSense, unlike ChemProV, feedback is not provided by the
system. This is so because in ChemSense, students can create any number of real or
hypothetical elements and reactions between them. In such scenario it becomes really
difficult to provide logical feedback. However it enables discourse and collaboration
among students by sharing of the annotated diagrams.
The close relatedness of ChemProV with ChemSense and the success of the later
in assisting the students learn chemistry concepts, encourage and motivate the design of
ChemProV.
Cognitive Tutor
Cognitive Tutor, developed by Carnegie Learning Company, is intelligent
educational software for improving math learning of the students (Koedinger & J. R.
Anderson, 1998). It provides multiple representations of a problem that are agreeable to
students of all the learning styles. It provides feedback in more than one way. Students
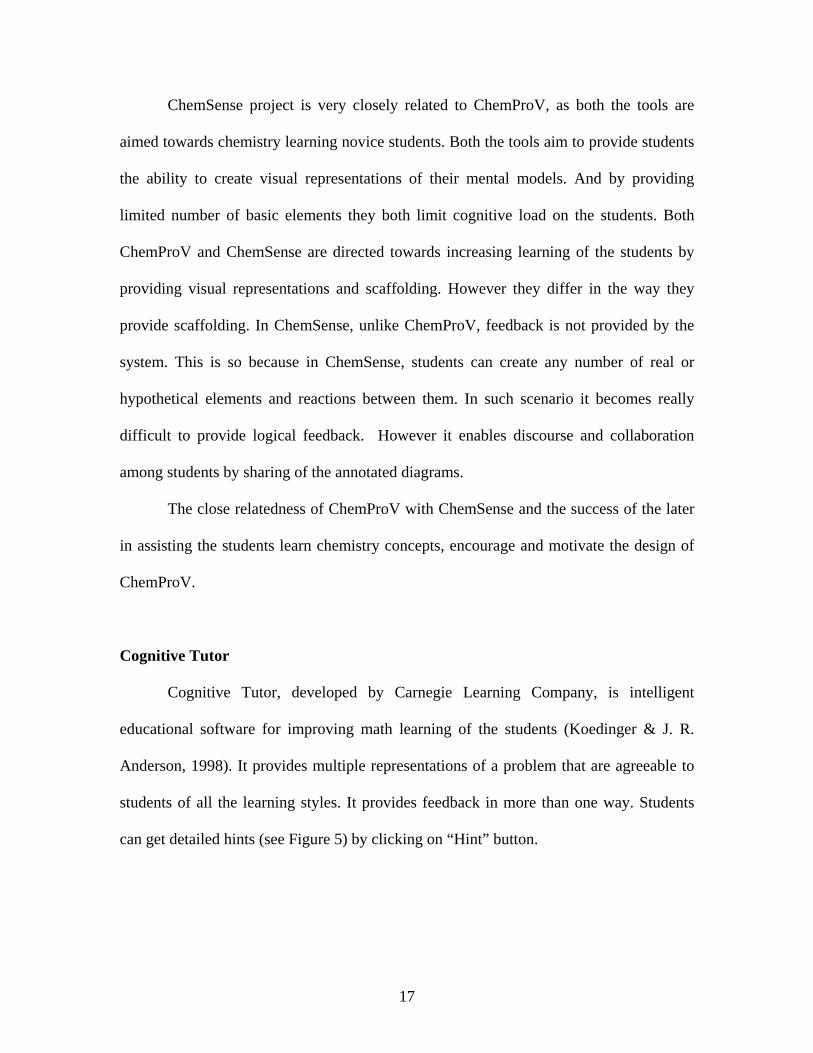
can get detailed hints (see Figure 5) by clicking on “Hint” button.
17
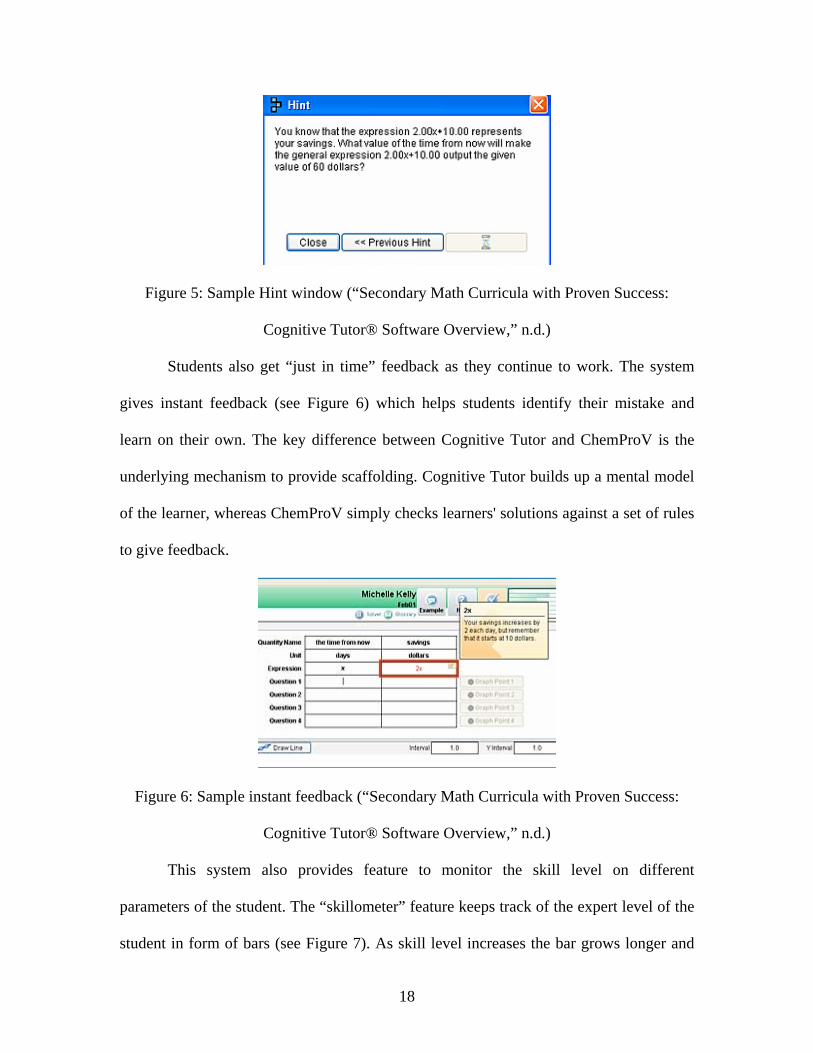
Figure 5: Sample Hint window (“Secondary Math Curricula with Proven Success:
Cognitive Tutor® Software Overview,” n.d.)
Students also get “just in time” feedback as they continue to work. The system
gives instant feedback (see Figure 6) which helps students identify their mistake and
learn on their own. The key difference between Cognitive Tutor and ChemProV is the
underlying mechanism to provide scaffolding. Cognitive Tutor builds up a mental model
of the learner, whereas ChemProV simply checks learners' solutions against a set of rules
to give feedback.
Figure 6: Sample instant feedback (“Secondary Math Curricula with Proven Success:
Cognitive Tutor® Software Overview,” n.d.)
This system also provides feature to monitor the skill level on different
parameters of the student. The “skillometer” feature keeps track of the expert level of the
student in form of bars (see Figure 7). As skill level increases the bar grows longer and
18
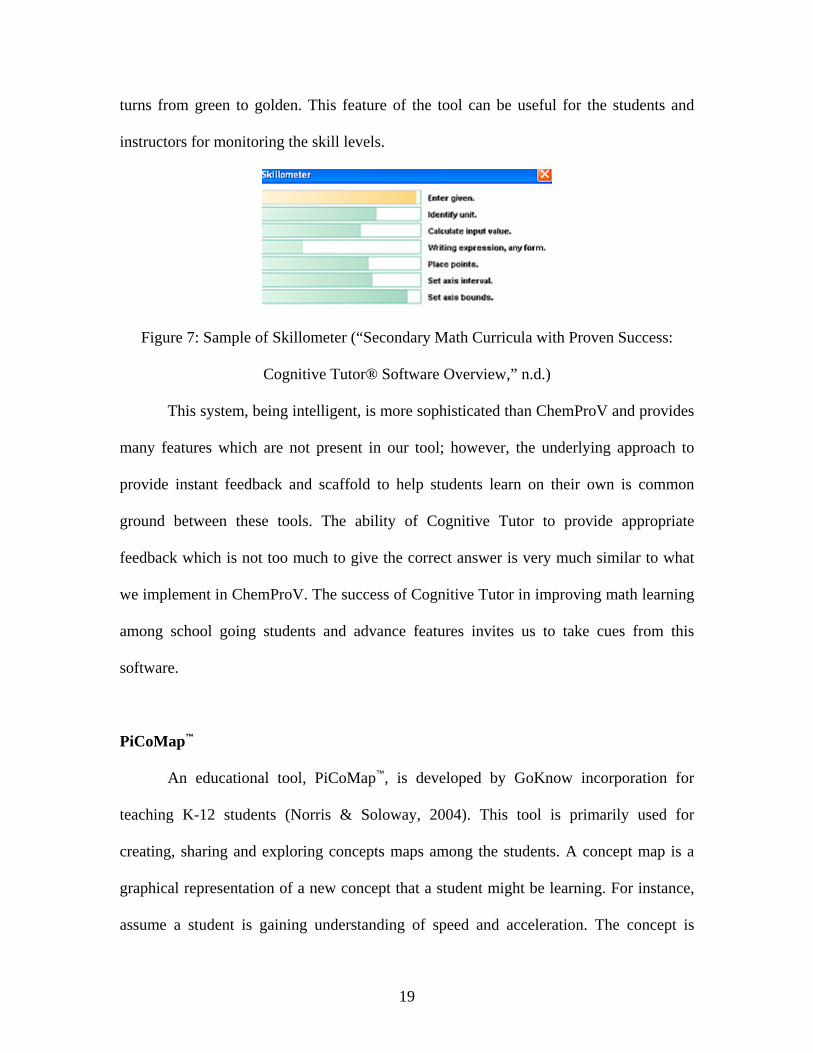
turns from green to golden. This feature of the tool can be useful for the students and
instructors for monitoring the skill levels.
Figure 7: Sample of Skillometer (“Secondary Math Curricula with Proven Success:
Cognitive Tutor® Software Overview,” n.d.)
This system, being intelligent, is more sophisticated than ChemProV and provides
many features which are not present in our tool; however, the underlying approach to
provide instant feedback and scaffold to help students learn on their own is common
ground between these tools. The ability of Cognitive Tutor to provide appropriate
feedback which is not too much to give the correct answer is very much similar to what
we implement in ChemProV. The success of Cognitive Tutor in improving math learning
among school going students and advance features invites us to take cues from this
software.
PiCoMap™
An educational tool, PiCoMap™, is developed by GoKnow incorporation for
teaching K-12 students (Norris & Soloway, 2004). This tool is primarily used for
creating, sharing and exploring concepts maps among the students. A concept map is a
graphical representation of a new concept that a student might be learning. For instance,
assume a student is gaining understanding of speed and acceleration. The concept is
19
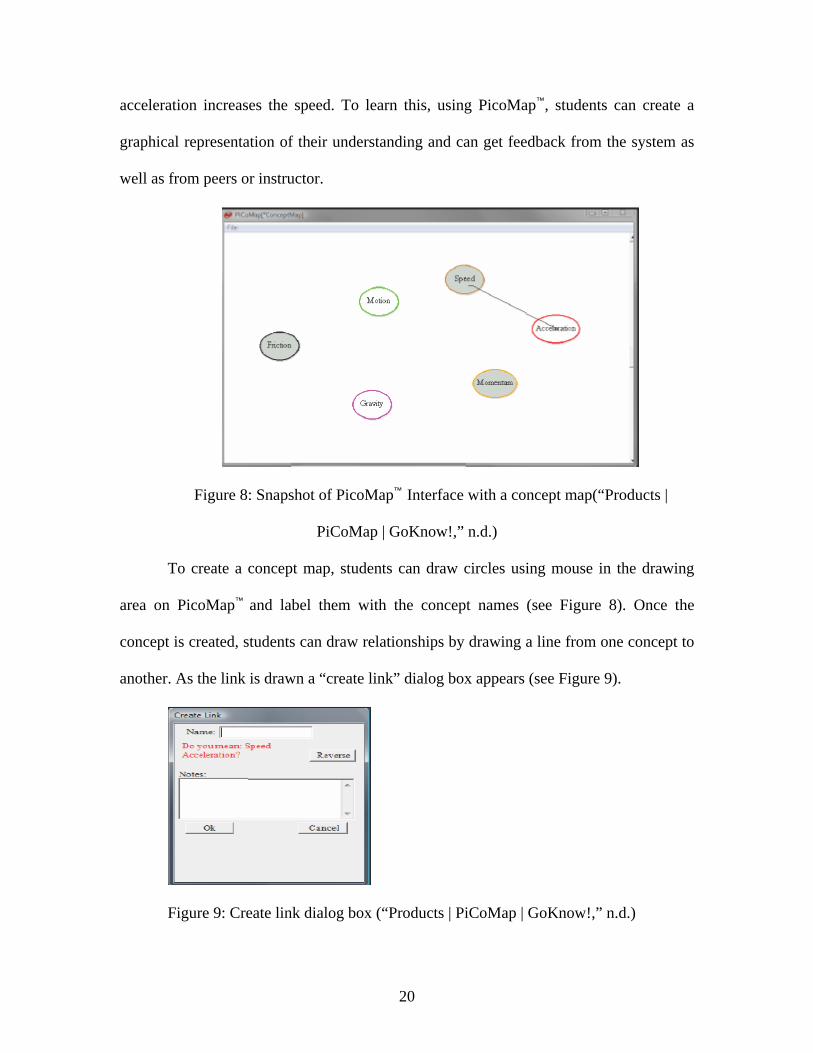
acceleration increases the speed. To learn this, using PicoMap™, students can create a
graphical representation of their understanding and can get feedback from the system as
well as from peers or instructor.
Figure 8: Snapshot of PicoMap™ Interface with a concept map(“Products |
PiCoMap | GoKnow!,” n.d.)
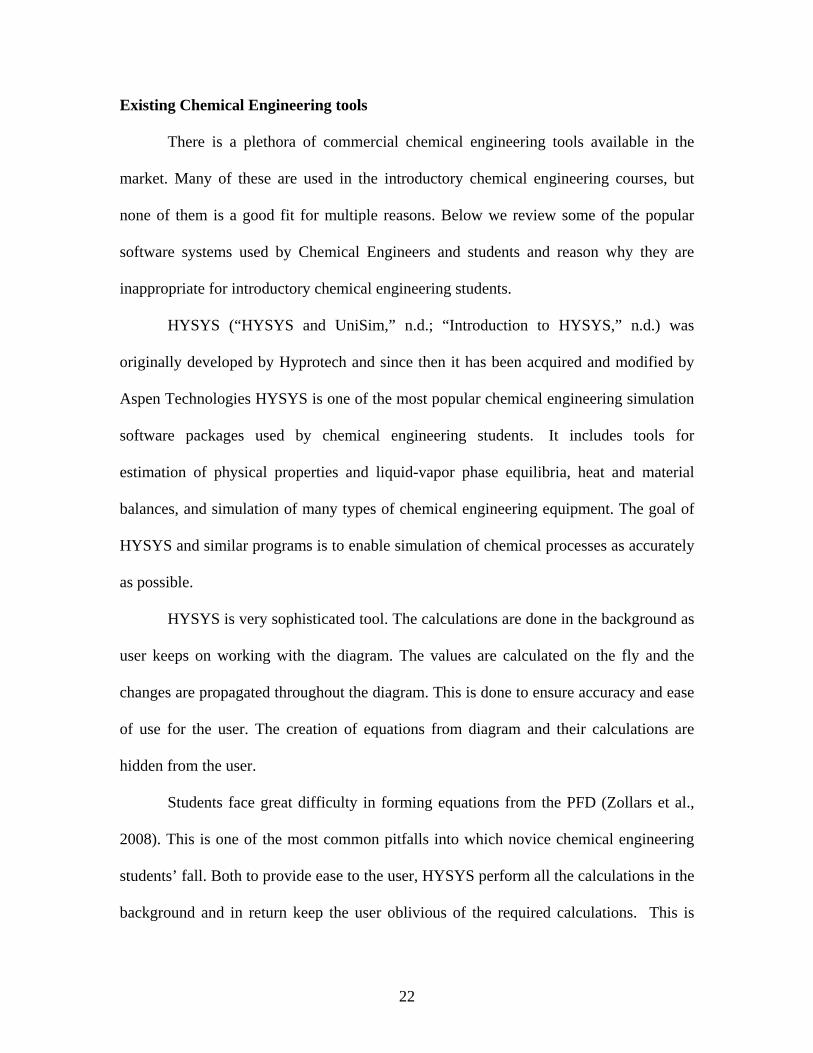
To create a concept map, students can draw circles using mouse in the drawing
area on PicoMap™ and label them with the concept names (see Figure 8). Once the
concept is created, students can draw relationships by drawing a line from one concept to
another. As the link is drawn a “create link” dialog box appears (see Figure 9).
Figure 9: Create link dialog box (“Products | PiCoMap | GoKnow!,” n.d.)
20

Students can type in the relation in this dialog box. For instance for the relation
between speed and acceleration, student can type is “is increased by”, which will be
interpreted, in this example, as “speed is increased by acceleration”. System will confirm
with the students if this is what they mean by asking “Do you mean: speed is increased
by acceleration?” Student can choose to reverse it or keep it as it is. If students were not
sure, then this question will make them rethink and maybe they can turn to an instructor
or peer to get feedback on their model of concept.
PicoMap™ is limited in its sophistication to provide feedback. This is because it is
not designed for any particular course curriculum but to promote exploration of open
ended concepts of K-12 students. However the first feedback is provided by the system in
form of a question. If in doubt, students can ask their peers or instructors for further help
and feedback. Thus by providing mechanism for visual representation of concepts and
sharing them, PicoMap™ facilitates instructional scaffolding.
Our tool, ChemProV, is similar to PicoMap™ in a way it is also a visual tool that
aims to provide scaffolding by means of messages. But ChemProV being designed for
chemical engineering students is more superior in its scaffolding abilities. In ChemProV,
a message appears only when students make some mistake unlike PicoMap™ which by
default asks the confirmation question. Also ChemProV do not asks the question rather
states that some error has occurred which needs to be fixed.
Despite the differences, PicoMap™ is closely related to ChemProV as both the
tools are based on theory of instructional scaffolding and providing visual aids with the
aim of improving learning amongst students.
21
Existing Chemical Engineering tools
There is a plethora of commercial chemical engineering tools available in the
market. Many of these are used in the introductory chemical engineering courses, but
none of them is a good fit for multiple reasons. Below we review some of the popular
software systems used by Chemical Engineers and students and reason why they are
inappropriate for introductory chemical engineering students.
HYSYS (“HYSYS and UniSim,” n.d.; “Introduction to HYSYS,” n.d.) was
originally developed by Hyprotech and since then it has been acquired and modified by
Aspen Technologies HYSYS is one of the most popular chemical engineering simulation
software packages used by chemical engineering students. It includes tools for
estimation of physical properties and liquid-vapor phase equilibria, heat and material
balances, and simulation of many types of chemical engineering equipment. The goal of
HYSYS and similar programs is to enable simulation of chemical processes as accurately
as possible.
HYSYS is very sophisticated tool. The calculations are done in the background as
user keeps on working with the diagram. The values are calculated on the fly and the
changes are propagated throughout the diagram. This is done to ensure accuracy and ease
of use for the user. The creation of equations from diagram and their calculations are
hidden from the user.
Students face great difficulty in forming equations from the PFD (Zollars et al.,
2008). This is one of the most common pitfalls into which novice chemical engineering
students’ fall. Both to provide ease to the user, HYSYS perform all the calculations in the
background and in return keep the user oblivious of the required calculations. This is
22
potentially harmful to students new to the balance problems, as they may never realize
what things they should take care of themselves and identify their mistakes.
Simimica MB is simulation software created by Applied e Simulators (Ae-S)
(“Applied e-Simulators Ae-S Process Simulation Software for Chemical, Mining,
Minerals, Energy, etc.,” n.d.). There are three basic steps to solve a material balance
problem in Simimica MB. They are 1) Create Process flow worksheet, 2) Data Input, and
3) Execution. In Process flow worksheet creation, the user creates a process flow diagram
using process units and streams to connect the process units. Once the process worksheet
is created, the numerical data is specified to the streams. Finally, Simimica automatically
calculates the material balance.
One of the biggest stumbling blocks for students in the introductory material
balance course is to devise the material balance from the process flow diagram. The layer
of abstraction in the software hides this critical step from the user.
Some of the other popular commercial chemical engineering simulation tools are
ASPEN PLUS (“AspenTech: Optimizing Process Manufacturing,” n.d.), ChemCAD
(“CHEMCAD is a suite of chemical process simulation software,” n.d.) Pro II (“SimSci-
Esscor,” n.d.), GAMS (“GAMS Home Page,” n.d.), and ChemPute (“Chempute Software
- Software Solutions for the Enginering Industry,” n.d.). All these software along with
HYSYS and Simimica MB provide large variety of features to simulate complex
chemical engineering processes. One of the potential drawbacks of these commercial
tools is that they do not require or help the students understand the underlying concepts,
like those of material balance problems (Dahm, Hesketh, & Savelski, 2002). It is most
likely that students will use these tools as a crutch to solve bigger and more complex
23
problems, without understanding the elementary concepts. Clough (Clough, 2000)
emphasizes the difference between “students using vs. students creating simulations.”
Working with ChemProV, students will develop their understanding of finer concepts of
material balance problems. As in ChemProV, if students wrongly specify a chemical
stream or create incorrect equations, the tool provides guidance to the students without
giving them the correct answer, offhand. Thus in this way, ChemProV allows students to
realize and learn from their mistakes without becoming a crutch for them.
To use the commercial tools effectively, it clearly requires a high degree of skill.
These tools offer highly sophisticated features, most of which are difficult to use by
chemical engineering students in the introductory course. Also the automation and
abstraction provided in these tools for ease of use may stand in the way of learning.
Indeed, these tools can be intimidating and create cognitive overload, especially to those
grappling with the basic concepts of material balance problems.
Summary
In this chapter we have reviewed related theories and educational tools that
provide motivation and support for the ChemProV tool. As a majority of the engineering
students are visual learners, and also as majority of students need guidance while solving
material balance problems a visual scaffolding tool would appear to be an appropriate
approach to enhancing student learning in introductory chemical engineering courses. .
The design of ChemProV aims to lower the cognitive load of the students by providing
only the basic functionality required to create solutions to material balance problems.
ChemProV offers only limited number of options to the students that are inherently
required to solve a material balance problem. This tool does not provide any extra
24

information that can create cognitive overload. Review of existing educational
visualization and simulation tools that aim to empower students to learn scientific
concepts by constructing systems motivate the development of ChemProV. These
systems use the concept of scaffolding to improve learning of novice learners of
computer science, mathematics and biology. In fact there exists no educational tool to
assist learning in material balance problems. Moreover available commercial tools that
are often used by students are too sophisticated for new learners. This sets the stage for
the development of a new computer-based tool to assist students in solving material
balance problems, as described in the next chapter.
25

Chapter Three
Interface
Background Research and Evolution of the Interface
The ChemProV interface has been designed using a user -centered Design (UCD)
process. In UCD, the needs and limitations of the users are of primary focus (Norman &
Draper, 1986). UCD is an iterative process in which, in iteration after establishing
requirements and the preliminary design of a system, one develops a working model (low
fidelity prototype or software), which is empirically evaluated using the real end users
(Norman & Draper, 1986). The result of evaluation gives direction for the next iteration.
As there is active involvement of end users in every phase of the design process,
following UCD process software eventually evolves to address the needs and wants of
the end user.
Dr. Richard Zollars, Professor in Chemical Engineering Department at WSU and
Dr. Christopher Hundhausen, Professor in Computer Science Department at WSU with
Melissa Stefik and Jon Brown graduate students at WSU started this project in Fall of
2006. Below, we discuss their efforts and how, following a UCD approach, ChemProV
has evolved to its current state.
To study the underlying difficulty in solving material balance class, the research
team conducted an exploratory study in Fall of 2006. In this study researchers observed
chemical engineering students as they solved a material balance problem, in order to gain
insights into the mistakes they made and how they went about the process (Zollars et al.,
2008). The observations of this study formed the foundation for the design of the system.
26

To establish the requirements for the software tool, researchers observed the
students as they constructed the solutions using pen and paper. Based on the
requirements established through this observational study, researchers created low
fidelity prototypes and simulated the screens on SmartBoard™. In the “wizard of oz”
prototyping studies, researched observed the chemical engineering students as they
worked with the prototypes (Zollars et al., 2008). The confusions, mistakes and
comments of the participants helped in refining the design of the system.
Once the requirements and design of the system were stabilized in the summer of
2007, ChemProV was developed using JAVA and Graphical Editing Framework (GEF).
Since then the tool has undergone several rounds of usability testing, which has helped
the researchers to refine its design and make it more usable for chemical engineering
students.
In the following section we introduce the current version of the interface, recent
developments and a walkthrough to simulate the working of the tool.
Introduction to ChemProV
ChemProV, Chemical Process Visualizer, is of prime focus in this thesis. It is
primarily designed for chemical engineering students, particularly in the gateway courses.
ChemProV tool has been under development for the past few years. This software is
developed in Java using GEF (Graphical Editing Framework) following a user centered
design process (Zollars et al., 2008).
The purpose of this software is to enhance learning by providing scaffolding to
students who are in the early phase of learning chemical material balance problems. The
software aims to provide constructive cues while students build their solutions using this
27
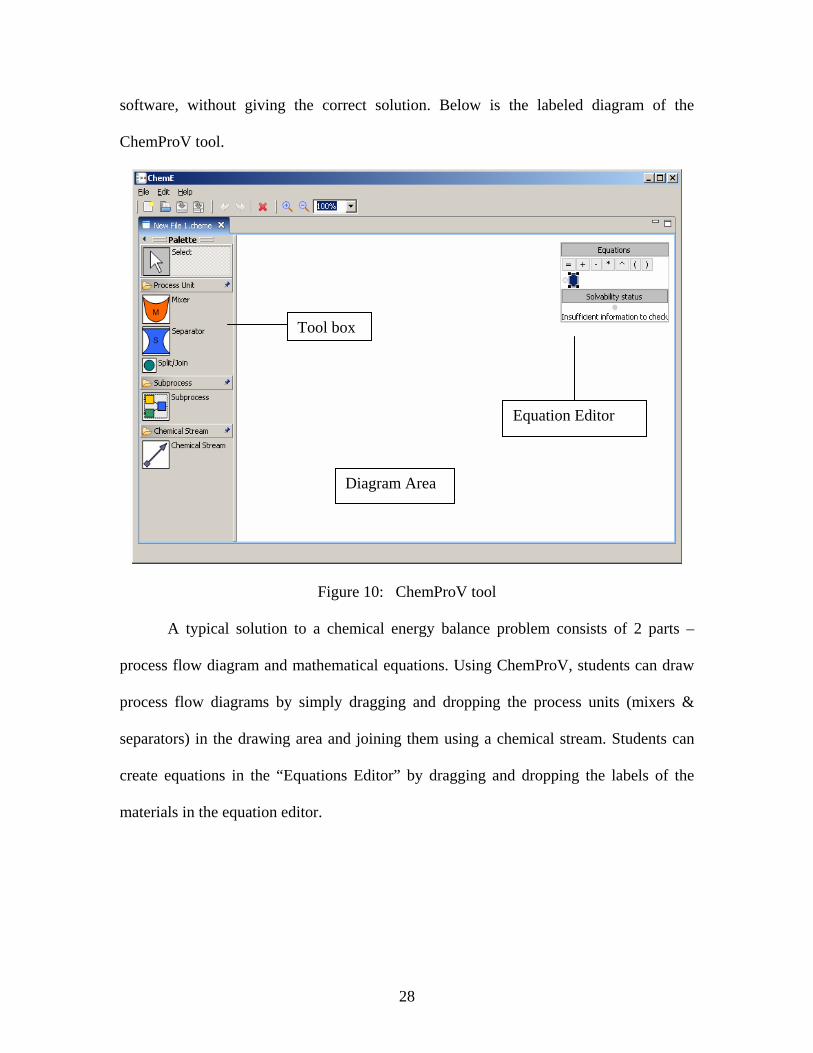
software, without giving the correct solution. Below is the labeled diagram of the
ChemProV tool.
x
A typical solution
process flow diagram and
process flow diagrams by
separators) in the drawing
create equations in the “E
materials in the equation ed
Tool bo
Equation Editor
Diagram Area
Figure 10: ChemProV tool
to a chemical energy balance problem consists of 2 parts –
mathematical equations. Using ChemProV, students can draw
simply dragging and dropping the process units (mixers &
area and joining them using a chemical stream. Students can
quations Editor” by dragging and dropping the labels of the
itor.
28

A process flow diagram consists of process units and chemical streams. In ChemProV,
two basic types of process units, mixers and separators , are supported.
Process units are connected using a chemical stream. Associated with a chemical stream
is a table that describes the chemical composition of the stream (see Figure 11).
Figure 11: Chemical stream
The first element of a chemical stream is always an ‘Overall’ element. An overall
element, as its name suggests, represents the total quantity and the unit of all the sub
elements in a chemical stream. There can be only one overall element per chemical
stream.
A chemical stream table consists of 4 fields. For every element in the chemical
stream each field needs to be specified.
1. Label - This is used to give a name to a chemical element in a chemical stream.
By default, naming convention is alpha numeric, where an overall element has uppercase
alphabet ‘M’ followed by numerical value of the order in which it was added in the
system, e.g. M1, M2. Subcomponents of the stream have alphanumeric label with
lowercase alphabet ‘m’ followed by index of the overall element and the order in which
this particular element is entered into the chemical stream, e.g. elements under M1 will
be m11, m12 and elements under M2 will be m21, m22 ( see figure 11). Students are free
29
to change the default names to whatever they wish, but with the restriction that a single
label cannot be used more than once.
2. Quantity – This field is used to specify the mass of the chemical element. Any
numerical value can be assigned to this field. By default, the value is ‘?’ which also
represents the unknown quantity (see figure 11).
3. Units – This field is used to specify the units for the mass of the chemical
element. By default, the unit of overall element is grams. Students are free to change to
any other unit from the dropdown menu (see figure 11).
4. Materials - This field is used to specify the chemical name for the element.
This field has a dropdown menu from which students can choose any chemical element.
By default, the value for overall element is ‘Overall’ and it is non editable (see Figure
11).
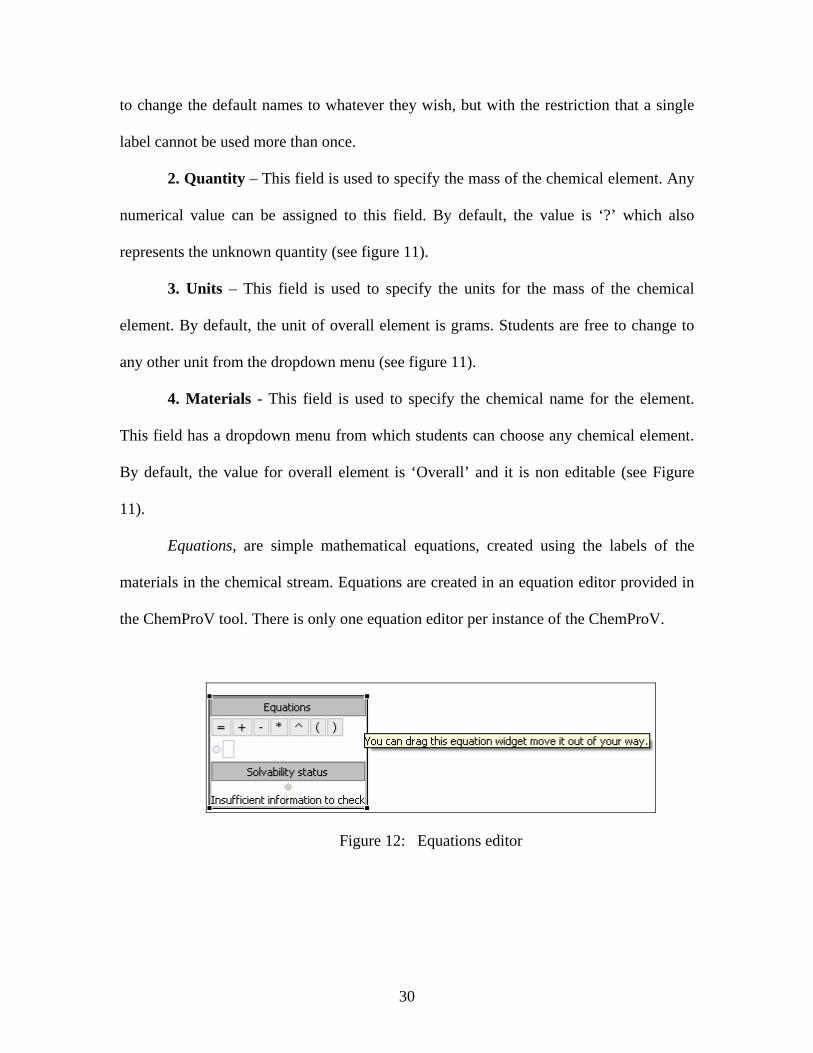
Equations, are simple mathematical equations, created using the labels of the
materials in the chemical stream. Equations are created in an equation editor provided in
the ChemProV tool. There is only one equation editor per instance of the ChemProV.
Figure 12: Equations editor
30

Students can drag and drop the mathematical operators from the operators menu.
Similarly they can drag and drop the labels in the equations editor (see Figure 12). If they
do not wish to drag and drop, students can type in the operators and the labels.
‘Solvability Status’ keeps track of required number of equations and number of
correct equations. Also it checks if the set of equation is independent or not. It is possible
that one can create the required number of correct equations but that the equations are not
independent. In this case, it will not be possible to solve for all the unknown values using
this set of equations. Users will be notified of such situation by the ‘Solvability Status’
box.
The basic functionality of this software tool is to provide a graphical
representation of the chemical energy balance problem and to provide constructive cues
(error/warning messages) to students. The main idea behind this functionality is to make
students think in the right direction without giving them the correct answer offhand. The
degree of success of this software system critically depends on the effectiveness of this
feature of scaffolding.
Validation Rules
As we mentioned earlier, a typical chemical energy problem solution consists of 2
parts – process flow diagrams and equations, so validation rules have to be designed
separately for both of them. Below we discuss validation rules for process flow diagrams
and then for equations.
Diagram Consistency
For a process flow diagram to be correct, it is required that each individual stream is
properly specified and also collectively all the chemical streams are consistent. We
31

therefore established the following validation rules for individual chemical streams and
also for the diagram on the whole.
For the stream flow tables:
1. Quantity Consistency:
Rule: The sum of all of the flow rates (amounts) of all of the sub elements in the
stream must equal the total flow rate (amount of the overall element). If one or more
of these amounts are unknown, then the sum total must not exceed the overall
amount. If the composition information is given as % then the sum of the percent
must be 100%.
Action: In the case of violation of this rule a warning message is shown with the
overall element of the chemical stream (see Figure 13).
Rationale: An overall element represents a chemical stream; showing a warning
message with it conveys that there is something wrong with the chemical stream.
Figure 13: Snapshot of warning message when Quantity consistency is violated in a stream
2. Unit Consistency:
Rule: Sub-elements under the overall element in a chemical stream must have the
same units as that of an overall element or must have ‘%’ as units. In either case,
units of all the sub elements in a chemical stream must be same.
32
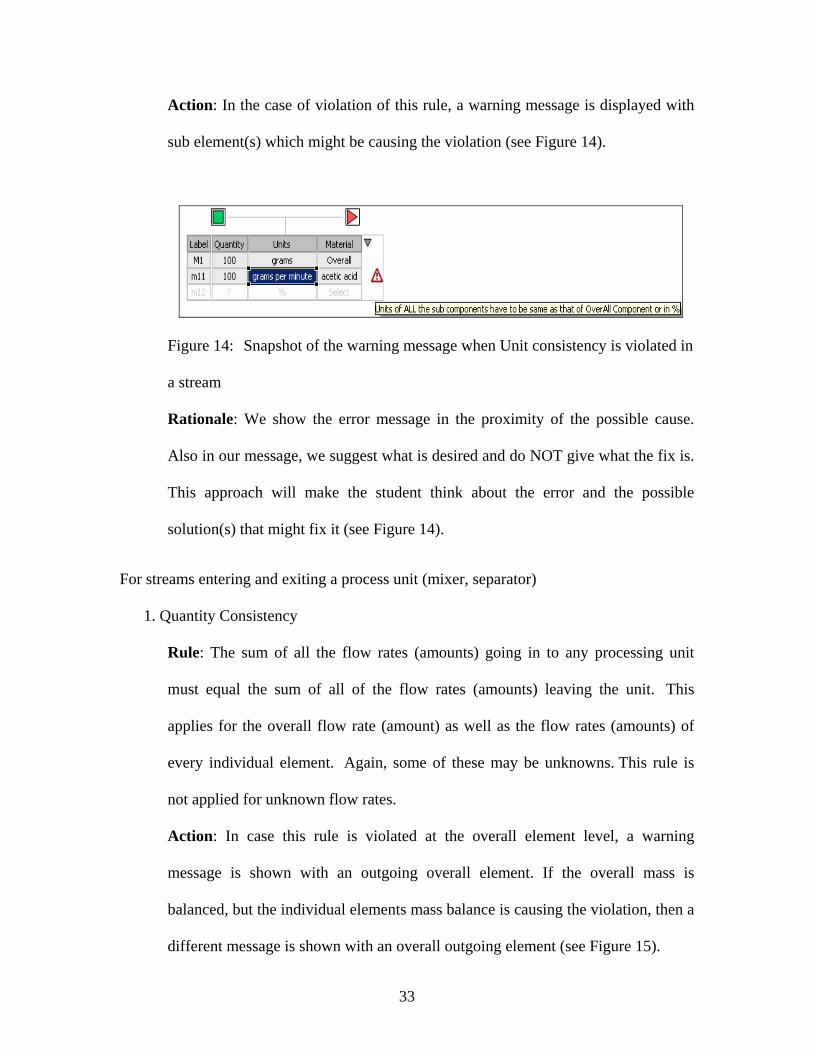
Action: In the case of violation of this rule, a warning message is displayed with
sub element(s) which might be causing the violation (see Figure 14).
Figure 14: Snapshot of the warning message when Unit consistency is violated in
a stream
Rationale: We show the error message in the proximity of the possible cause.
Also in our message, we suggest what is desired and do NOT give what the fix is.
This approach will make the student think about the error and the possible
solution(s) that might fix it (see Figure 14).
For streams entering and exiting a process unit (mixer, separator)
1. Quantity Consistency
Rule: The sum of all the flow rates (amounts) going in to any processing unit
must equal the sum of all of the flow rates (amounts) leaving the unit. This
applies for the overall flow rate (amount) as well as the flow rates (amounts) of
every individual element. Again, some of these may be unknowns. This rule is
not applied for unknown flow rates.
Action: In case this rule is violated at the overall element level, a warning
message is shown with an outgoing overall element. If the overall mass is
balanced, but the individual elements mass balance is causing the violation, then a
different message is shown with an overall outgoing element (see Figure 15).
33

Figure 15: Snapshot of the warning message when Quantity consistency is violated in a stream
Rationale: We handle this rule at two levels as it needs to satisfy both the overall
flow rate and the individual flow rates. Thus we show two different messages
depending on the reason for violation which will help the students concentrate on
the error condition.
2. Unit Consistency
Rule: Units across the process units must be consistent with the incoming units.
The rest of the rule is the same as the above-mentioned Unit Consistency Rule of
stream flow tables.
Action: In the case of violation of this rule, an error message is shown with the
overall element of the incoming as well as outgoing stream (see Figure 16).
Rationale: The message is shown with the overall elements as it represents a
chemical stream and conveys that there is something wrong with one or more of
the chemical streams and fixing any of those will fix the error.
34

Figure 16: Snapshot of warning message with the out-stream when Unit/Quantity consistency is violated across the streams.
3. Element Consistency
Rule: Every element specified in the incoming stream must be specified in the
outgoing stream.
Action: If an element is specified in the in-stream and is not specified in the
immediate out- stream, then we show a warning message with the out-stream,
having the name(s) of the missing element(s). If an element is specified in the out-
stream but is not specified in the in- stream, then we show a warning message
with the in-stream, having the name(s) of the missing element(s) (see Figure 17).
Rationale: We show the messages with the related stream’s overall element. The
list of missing name(s) in the message will directly take the attention of the
student to the error causing element.
35

Figure 17: Snapshot of warning message with the name of missing element when element consistency rule is violated
Equation Consistency:
For equation consistency it is required that each equation is correct and the set of
equations are solvable. Here we discuss in detail the rules for equation correctness and
equation solvability.
Equation Correctness:
1. Unit Rule
Rule1: The units within any equation must be consistent, e.g. all grams or all
gm/min.
Action: An error message is shown with the equation (see Figure 18).
Rationale: Message is shown at the proximity of the error and directly states what
is required.
36

Figure 18: Snapshot of the error message displayed on violation of unit rule in the equations.
Rule2: If the units are in % then they must be multiplied to an overall element
whose units are in non %.
Action: An error message is displayed with the equation (see figure 18).
Rationale: A % in itself as no meaning until we specify it as percentage of
something. So adding % to % will have no meaning thus we have to multiply it
with another element with non % units. An error message is shown at the
proximity of the cause.
2. Element Rule
Rule1: When writing an overall balance, only the terms for the overall streams
may appear in the balance equation, which means that the equation can have only
the overall elements or only the sub elements of the overall element.
Action: In the case of violation of this rule, an error message is shown with the
equation (see Figure 19).
Rationale: Message is shown in the proximity of the cause and states the cause of
the error.
Rule2: When writing a balance for an individual component, only terms involving
that individual component may be used. Note that using a term that is the product
37

of the overall flow rate (amount) multiplied by a percentage of an individual
component makes it a term involving that component and not the overall flow rate
Action: In the case of violation of this rule, an error message is shown with the
equation (see Figure 19).
Rationale: Message is shown in the proximity of the cause and states the cause of
the error.
Figure 19: Snapshot of the error message displayed with the equation when element rule is violated. In this example, m11 is acetic acid and m21 is ammonia.
Equation Independence:
To show the status of the set of equations, we have created a “Solvability Status”
box under the equation editor (see Figure 20). Current status of the equations, such as
how many equations are created, how many is required, and which of the unknown
elements are not represented any of the equations, is displayed in this box. This status
box has a small circle which turns from red to green when the set of equations is solvable
for all the unknown values in the system.
Figure 20: Snapshot of the Solvability status box
38

Rule1: There should be sufficient number of equations to solve for all the unknown
values present in the diagram. In other words, each unknown element must be
represented by at least one of the equations.
Action: If one or more of the unknown element(s) are not represented in the set of
equations created, then the Solvability status light turns “red” and the message contains
the name(s) of the unknown elements missing from the equations (see Figure 21).
Rationale: With displaying names of the missing elements, the message makes it clear to
the students that the equations they have specified are insufficient, and that they need to
include the missing elements.
Figure 21: Snapshot of the solvability status when one of the unknown elements is missing from the set of equations created.
Rule2: The set of equations must be independent.
Action: Solvability status light turns red and a message is displayed (see Figure 22).
Rationale: For a set of linear equations to be correct it is required that the determinant of
the coefficient matrix of the equations is non-zero. If the determinant of the coefficient
matrix of the unknown elements is nonzero then the set of equations is solvable.
39

Figure 22: Snapshot of the solvability status when the set of equations is not independent
The validation process for the diagrams and the equations used by the ChemProV
software can be broadly summarized in following three steps:
1. Diagram Consistency: Unit consistency, Quantity Consistency, and mass of
incoming equals mass of outgoing stream.
2. Equation Correctness: Units of the elements in the equation are same, and
elements are identical.
3. Equation Independence: Set of equations is solvable and all the unknown
quantities are represented in the equations.
All these steps are performed in the order in which they are listed. For instance,
before checking for the equation solvability, ChemProV checks to ensure that the
equations are correct.
Walkthrough
To illustrate how a student will use ChemProV to solve a material balance problem taken from Felder & Rosseau, 2005, we now step through a sample problem scenario. Assume that the following problem is to be solved:
40

Create a process flow diagram in which acetic acid (A) is extracted from a
mixture of acetic acid and water (B) into n-hexane (C), a liquid immiscible with water.
Label each stream with enough values to fully characterize that stream (flow rate,
composition, etc.). Provide a numerical value if possible. Calculate the flow rate of the
n-hexane, the extract and the raffinate streams.
The following facts are given:
1) The acetic acid/water solution enters at a rate of 400 gm/min. The acetic acid
composes 11.5 % of the solution by weight.
2) The extract phase leaving the process contains 9.6 % acetic acid by weight.
3) The raffinate phase leaving the process contains 0.5% acetic acid by weight.
Proposed Solution:
The solution will broadly have two parts – process flow diagram and equations.
First, PFD is created and then equations.
1. Process Flow Diagram:
Create Process Units and their connections:
a. Create required process units – mixer and separator
Students can easily create the two process units (see Figure 23) that are
needed by dragging and dropping the required units from the toolbox.
Figure 23: Process unit creation
b. Create input streams for mixer.
41

Similarly, the streams can be created by drag and drop of the “chemical
stream” from the toolbox. To create a stream into a process unit, students have
to drag the arrow of the stream into the unit and leave it inside the process unit
(see Figure 24).
Figure 24: Single Chemical stream creation
c. Create output streams of the mixer, which will be input stream for
separator and output streams of the separator (see Figure 25).
Figure 25: Chemical stream creation
After creating the process units and establishing connections between them, we are ready
to specify the streams.
42

Below are the streams that need to be specified:
a. the overhead stream coming into the mixer.
b. the bottoms stream coming into the mixer
c. the stream between mixer and separator
d. the overhead stream of the separator
e. the bottoms stream of the separator
For each stream, The Label field (see Figure 11) is auto generated. Students can
modify it by double clicking in the label cell and typing the new name. The Quantity
field can be specified by double clicking in the cell and typing in the value. By default,
the value of quantity filed is ‘?’, which stands for unknown quantity. The Units field can
be specified by choosing the units from the drop down menu.
The Material field can be specified by choosing a material from the drop down
menu.
Once students start specifying streams, the error/warning messages will appear if
there is any violation of rules. For instance, the default unit is ‘grams’. When it is
changed to ‘grams/min’ in one of the streams, then a message stating that units across the
streams must be same is displayed with the streams (see Figure 11).
2. Equations:
After specifying all the streams, the process flow diagram is complete. Now, students
can identify the known and unknown quantities in the diagram. In this diagram there are
eight known and seven unknown quantities. So students have to create seven equations to
solve for all the unknown quantities in the system.
43

To create an equation, students can drag and drop the labels and operators into the
equations editor. Once an equation is formed, the solvability status will be turned on and
it will keep track of number of required equations and correctly created equations in the
system (see Figure 26). Also, if there is an error with any of the equations, an error
message will be displayed with the equation.
Figure 26: Equations editor showing solvability status of the system and error with the equation.
Once all the required equations are created, the ‘red’ light of solvability status
goes ‘green’ and success message is displayed, indicating that the student has
successfully solved the problem (see Figure 27).
44

Figure 27: Complete PFD and independent set of equations.
Summary
In this chapter I have discussed the background research and how ChemProV has
evolved over time. I have presented the UCD approach, using which we have been
developing ChemProV tool. In UCD approach, software is designed keeping the central
focus on the user and their needs. The design and development of ChemProV has been
guided by the observations how users use the system, and their direct feedback. Recently
we have implemented the validation rules in the systems which are used to generate
feedback for the students. Now with scaffolding mechanism in place, ChemProV is in a
stable state from where next logical step would be to empirically evaluate it. In next
chapter I present the study that we have conducted to empirically evaluate the ChemProV
tool.
45

CHAPTER FOUR
Experimental Evaluation To evaluate the software, we conducted an experimental study in which we pitted it
against pen-and-paper, the traditional medium for solving material balance problems. As
ChemProV provides guidance to students as they continue to create their solutions, it is
expected that students will be able to create more accurate solutions with the software as
compared to paper and pen. This is the underlying rationale for our two main hypotheses
of the study:
H1: Students will be able to create more accurate process flow diagrams with
ChemProV than Pen and Paper.
H2: Students will be able to create more accurate mathematical equations from
process flow diagram with ChemProV than Pen and Paper.
To test these hypotheses, we conducted a within-subjects experimental study with
two conditions defined by the problem solving tool: Software (ChemProV) and Pen-and-
paper. Prior to conducting the main study, we conducted two rounds of pilot testing to
streamline the procedure and study materials. All the participants solved one problem
with each of the tolls. To counterbalance potential order effects, the ordering in which
participants used the tools was varied based on their class ranking. This helped us to
make sure that students of all the ability levels (high, medium and low) received both the
46

task orderings. To rank participants, we used their grades in the class assignments and
mid term exam and weighted them according to the course guidelines.
The study results were measured with respect to two dependent variables:
accuracy of solution and time on task. For accuracy of overall solution, we combined the
accuracy of the PFDs and the accuracy of equations.
Participants
We recruited 21 students (15 male, 6 female; mean age 19.7) out of the Spring,
2009 offering of Che 110, the introductory chemical engineering course at Washington
State University. Participants were recruited in the tenth week of the semester, after they
had received a week of preliminary instruction on material balance problems.
Participants received course credit for their participation.
Materials and Tasks
All participants worked on a Pentium IV computer running the Windows XP
operating system. Equipped with a mouse and keyboard, the computer had 1 GB of RAM
and a 15 inch LCD color display set to a resolution of 1024 × 768.
Prior to working with the tools (ChemProv or pen-and-paper), participants
completed informationally-equivalent tutorials for both the tools that introduced them to
the tools they would use to solve the problems. The software version of the tutorial
required the students to complete the tasks using ChemProV, whereas in the pen-and-
paper version students completed the same tasks using pen and paper.
47
All participants completed two material balance problems of equivalent difficulty.
In both the problems, participants had to create a PFD involving 2 process units. One
problem, Problem A, had total 15 variables out of which the values of 7 variables were
unknown. The other problem, Problem B, had total 16 variables out of which the values
of 8 variables were unknown. For both the problems, participants had to create a set of
equations to solve for all the unknown variables in the system; however, they did not
actually have to solve the equations to obtain an exact solution. The two problems,
designed by Dr. Richard Zollars Director of the Chemical Engineering Department at
WSU, read like this:
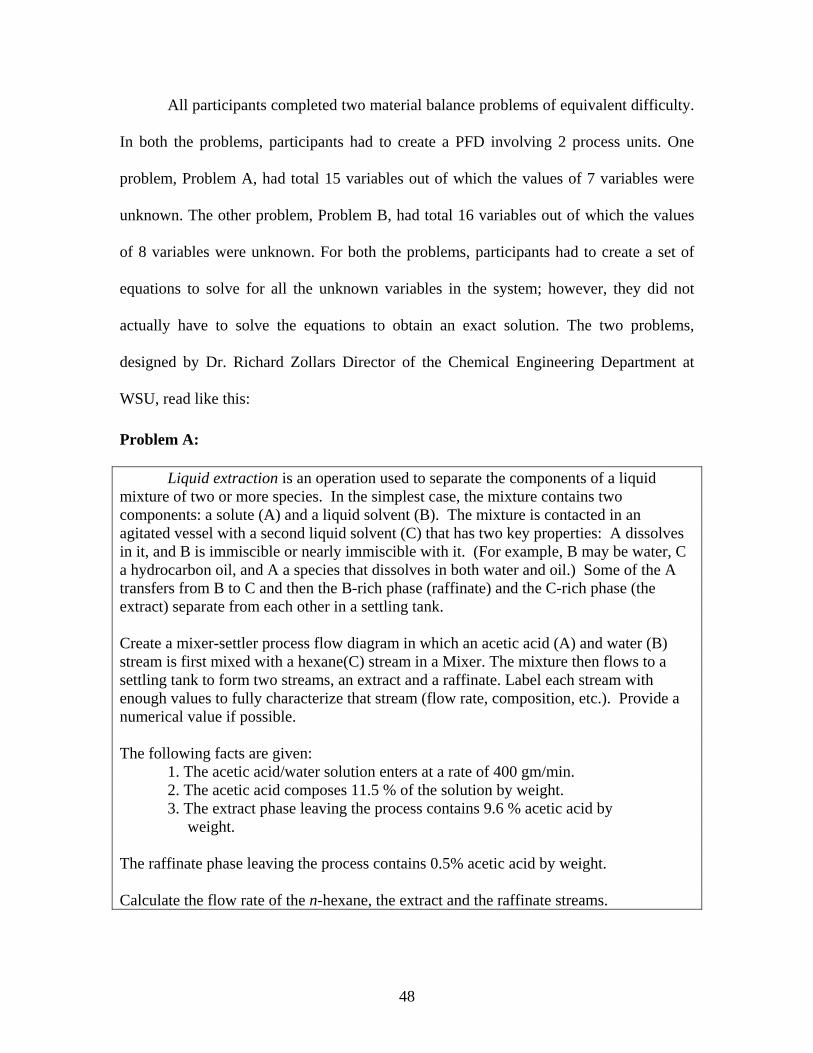
Problem A:
Liquid extraction is an operation used to separate the components of a liquid mixture of two or more species. In the simplest case, the mixture contains two components: a solute (A) and a liquid solvent (B). The mixture is contacted in an agitated vessel with a second liquid solvent (C) that has two key properties: A dissolves in it, and B is immiscible or nearly immiscible with it. (For example, B may be water, C a hydrocarbon oil, and A a species that dissolves in both water and oil.) Some of the A transfers from B to C and then the B-rich phase (raffinate) and the C-rich phase (the extract) separate from each other in a settling tank. Create a mixer-settler process flow diagram in which an acetic acid (A) and water (B) stream is first mixed with a hexane(C) stream in a Mixer. The mixture then flows to a settling tank to form two streams, an extract and a raffinate. Label each stream with enough values to fully characterize that stream (flow rate, composition, etc.). Provide a numerical value if possible. The following facts are given:
1. The acetic acid/water solution enters at a rate of 400 gm/min. 2. The acetic acid composes 11.5 % of the solution by weight. 3. The extract phase leaving the process contains 9.6 % acetic acid by weight.
The raffinate phase leaving the process contains 0.5% acetic acid by weight. Calculate the flow rate of the n-hexane, the extract and the raffinate streams.
48

Problem B:
Fractional distillation is an operation used to separate the components of a liquid mixture of two or more species by their boiling points. In the simplest case, the mixture contains two components. The mixture is heated until it boils. The vapor phase, having a higher concentration of the more volatile component, is removed from the distillation tower and condensed to give a liquid that is rich in the more volatile component (the overhead product). The liquid that is not vaporized in the tower is also removed and forms a second liquid stream that is rich in the less volatile component (the bottoms product). Create a process flow diagram in which a stream containing benzene (B), cyclohexane (C) and toluene (T) is fed to a distillation tower. The bottoms product from this first tower is recovered as a product stream. The overhead stream from this distillation tower is fed to a second distillation tower. The overhead and bottoms streams from the second tower are both recovered as product streams The following facts are given:
1. The benzene/cyclohexane/toluene mixture is fed to the first distillation tower at a rate of 100 kg/min. The composition of this stream is 25 % benzene (B), 60% cyclohexane (C) and 15 % toluene (T) by weight. 2. The overhead stream from the second tower flows at a rate of 30 kg/min. It has a composition of 66.7 % benzene (B) and 33.3 % cyclohexane (C). 3. The bottoms stream from the second tower contains 12.5 % benzene (B) and 87.5 % cyclohexane (C). 4. The bottoms stream from the first distillation tower contains only cyclohexane (C) and toluene (T).
Calculate the flow rate of the bottoms streams from both distillation towers and the composition of the bottoms stream from the first distillation tower.
We used Morae® Recorder to make lossless recordings of participants’ screens as
they worked on tasks. These recordings allowed us to recreate participants’ work if
needed, to gauge their time on task, and to analyze their behavior in detail if needed.
Procedure
Participants completed the study one-at-a-time in the Visualization and End User
Programming Lab at Washington State University. The lab has a quiet participant room
49

linked to a soundproof observer room by a one-way mirror. The experimenter watched
participants complete the study from the observer room, and issued instructions to
participants via a one-way intercom system.
At the beginning of the study, participants signed an informed consent form (see
Appendix A1). They were then given a brief overview of the study and a general set of
instructions for the study (see Appendix A2). To ensure that all the participants have
same information, we prepared a script which was read verbatim to all the participants
(see Appendix A3).
In the experiment, participants had to complete two problems using two different
tools, one each for a problem. This created 4 possible cohorts, as illustrated in Table 1.
Problem A Problem B
ChemProV Cohort I (6 students) Cohort II (4 students)
Pen and Paper Cohort III (6 students) Cohort IV (5 students)
Table1: Possible Cohorts for the experiment
To counterbalance the task and treatment order, we distributed the participants
into each cohort such that each cohort had a similar number of participants. Moreover, we
assigned students to cohorts based upon their course grades at the time of the experiment,
in order to ensure that the cohorts were equally matched with respect to course
performance.
The experiment was conducted during two-hour sessions for each participant.
Prior to working with the real problem using software or pen & paper, participants were
given a 15 minute tutorial on each medium. This allowed them to get acquainted with the
software and format for pen and paper. In the two hour session there were two 40 minute
50

sessions: one to solve one problem with each tool. Participants were instructed to solve
each problem as quickly as possible, without sacrificing accuracy, with the stipulation
that each problem had to be completed with in 40 minutes. After 40 minutes, or whenever
they finished, participants were asked to stop working and moved to the next problem.
After finishing both the problems, participants completed an exit questionnaire
which asked them about their experiences in the experiment. Most questions on the exit
questionnaire had students respond on a Likert scale of 1- 10. A few questions at the end
of the questionnaire asked for open-ended responses. (See Appendix A5 for the exit
questionnaire.)
Measuring the Dependent Variables
To measure time on task, we reviewed the video recordings of all the participants.
The time for PFD was noted when the participant first started creating a PFD and
similarly for equations. Participants frequently switched between the activities of drawing
a PFD and creating equations and thinking about how to solve the problem. We counted
the “thinking time” towards PFD or equation creation time, depending upon the activity
in which they were engaged at the time of the thinking. Participants' think-aloud
utterances provided further assistance in helping us to classify activities as either PFD or
equation editing. .
To measure the overall accuracy of the solutions, we devised a scheme for the
scoring the accuracy of the PFDs and the equations, based on the following breakdown of
the task The creation of a PFD consists of two steps: 1) create a layout of the diagram in
which participants create process units and connections between those units and 2)
51

specify the stream component table associated with the streams between the process
units. While specifying the stream table, participants had to identify known and unknown
variables, their quantity and units. All the sub tasks were weighted according to the level
of difficulty.
To create process units and connections between process units, participants were
awarded one point for correct and zero point for wrong answer. While specifying the
stream, if students identified something that is given in the question they were awarded
half a point. For inferring or deriving something which was not directly given in the
problem description, participants were awarded one full point. Finally, for specifying
something wrongly, participants were penalized with a negative point.
Depending on the number of unknown variables in the PFD, participants had to
create a set number of equations to solve for all the unknown variables. In both the
problems, there was one optional stream involving four unknown variables. If
participants chose not to create that optional stream, than they had to create fewer
equations. Each equation was classified into one of the following categories: 1) correct,
2) partially correct, 3) conceptually correct and 4) incorrect.
An equation was correct if everything about the equation i.e. the units, material
and operators were all correct. An equation was partially correct if one or more
components were omitted from the balance. An equation was conceptually correct if all
the correct materials were operated on but incorrect units were used. An equation is
incorrect if the equation did not fall into any of the above conditions. Participants were
awarded one full point if the equation was correct, three -quarters of a point if it was
52

conceptually correct, quarter of a point if it was partially correct, and zero points if it was
incorrect.
In addition to creating correct equations, participants had to create a set of
equations that were independent of each other. To solve for all the unknown variables,
one must have independent set of equations. We identified the possible sets of
independent equations that could be created. If participants created equations that were
non independent, then one- half of a point was deducted from the score. Also, if
additional incorrect equations were created, then one full point was deducted from the
score.
To verify the reliability of our grading scheme, we had two chemical engineering
instructors independently grade a random sample consisting of 20 percent of the solutions
produced in the study (8 solutions to Problem A and 8 solutions to Problem B). Table 2
presents the levels of agreement achieved by the instructors.
Activity Agreement %
Diagram 94.07%
Stream Specification 94.88%
Equation 96.77%
Table 2: Percentage Agreement achieved on grading scheme
Based on these results, we concluded that our scoring system was sufficiently
reliable, and we had a single instructor grade the remainder of the solutions.
53

Results and Discussion:
Quantitative Assessment. Table 3 presents the mean task time of each condition
and Table 4 presents the mean accuracy of each condition. Figure 28 plots each
condition’s mean time on task on a subtask-by-subtask basis, where Task 1 is
constructing the PFD, Task 2 is constructing the mathematical equations and Task 3 is
the overall task time.
Task Average Time on task ( in minutes) ChemProV Pen and Paper PFD Creation 15.24 12.52 Equation Creation 14.22 13.64 Overall time 29.46 26.16
Table 3: Mean time-on-task for each condition
Task Average Accuracy on task ChemProV Pen and Paper Diagram correctness 83.0% 85.0% Stream correctness 79.7% 78.2% Equation correctness 38.0% 51.1% Overall correctness 59.5% 64.8%
Table 4: Mean accuracy-on-task for each condition
54
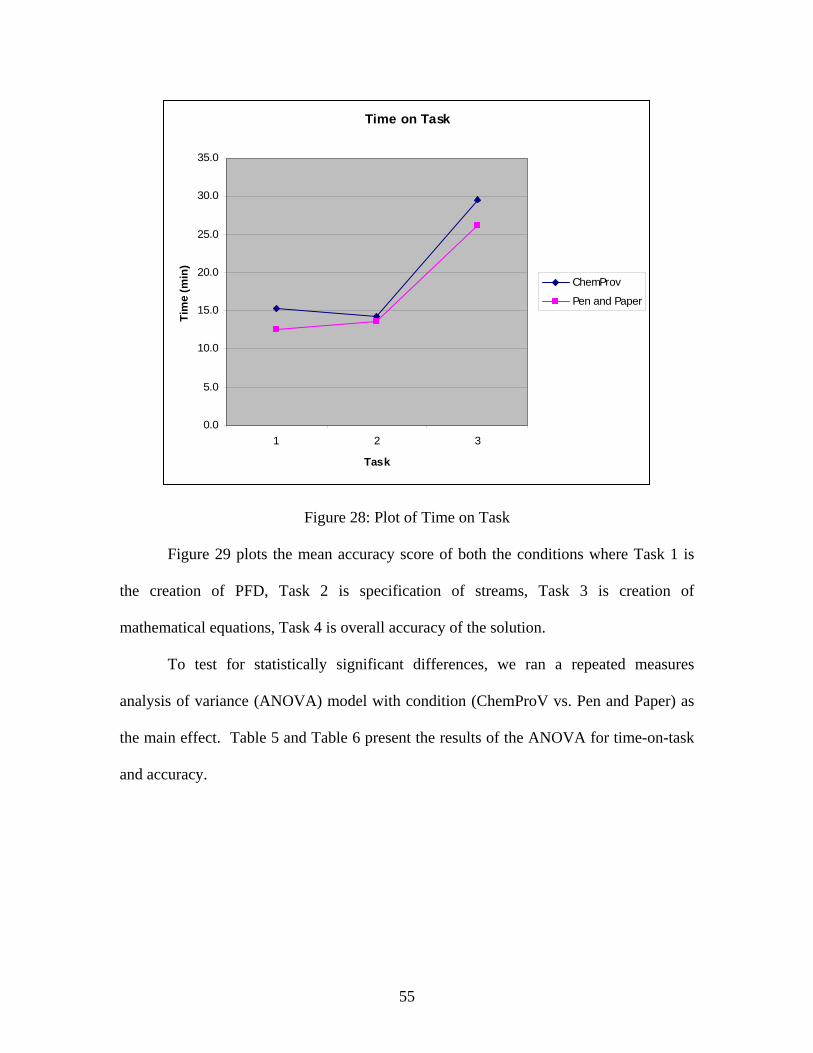
Time on Task
0.0
5.0
10.0
15.0
20.0
25.0
30.0
35.0
1 2 3
Task
Tim
e (m
in)
ChemProv
Pen and Paper
Figure 28: Plot of Time on Task
Figure 29 plots the mean accuracy score of both the conditions where Task 1 is
the creation of PFD, Task 2 is specification of streams, Task 3 is creation of
mathematical equations, Task 4 is overall accuracy of the solution.
To test for statistically significant differences, we ran a repeated measures
analysis of variance (ANOVA) model with condition (ChemProV vs. Pen and Paper) as
the main effect. Table 5 and Table 6 present the results of the ANOVA for time-on-task
and accuracy.
55
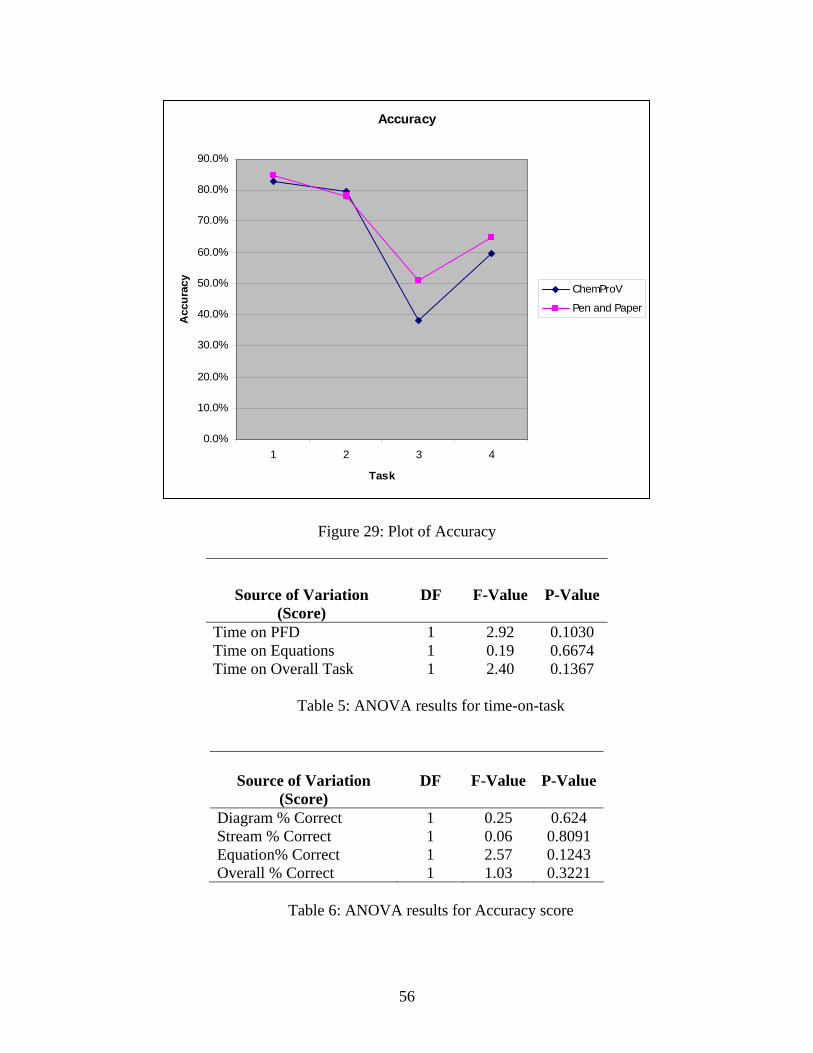
Accuracy
0.0%
10.0%
20.0%
30.0%
40.0%
50.0%
60.0%
70.0%
80.0%
90.0%
1 2 3 4
Task
Acc
urac
y
ChemProV
Pen and Paper
Figure 29: Plot of Accuracy
Source of Variation (Score)
DF
F-Value
P-Value
Time on PFD 1 2.92 0.1030 Time on Equations 1 0.19 0.6674 Time on Overall Task 1 2.40 0.1367
Table 5: ANOVA results for time-on-task
Source of Variation (Score)
DF
F-Value
P-Value
Diagram % Correct 1 0.25 0.624 Stream % Correct 1 0.06 0.8091 Equation% Correct 1 2.57 0.1243 Overall % Correct 1 1.03 0.3221
Table 6: ANOVA results for Accuracy score
56

As the tables and graphs indicate, the main effect was insignificant: There was no
statistically significant difference between the accuracy of solutions and time taken to
create solutions using ChemProV and Pen and Paper.
Quantitative Assessment of exit questionnaire data. We administered an exit
questionnaire after each study in which we asked the students to rate their experiences of
using ChemProV and Pen and paper on likert scale of 1 – 10 (see Appendix A6). In the
questionnaire we asked students to rate the two tools on several different measures,
including the difficulty of the problem, helpfulness of the medium, their confidence in the
correctness of their solutions, ease of learning of the medium, the overall effectiveness of
the medium, and their level of frustration while solving the problem. On our Likert scale,
a core of 1, for instance, meant least difficult or least helpful and a score of 10 meant
extremely difficult or extremely helpful. Table 7 presents the average rating of students
on these questions and Table 8 presents the result of an ANOVA.
Average rating Standard Deviation Measure ChemProV Pen & Paper ChemProV Pen & PaperDifficulty 6.2 6.3 2.3 2.3 Helpfulness 7.1 6.9 2.4 2.2 Confidence 5.5 5.2 3.0 2.5 Ease of Learning 8.0 7.0 2.2 2.3 Overall Effectiveness 7.4 6.6 2.3 2.4 Level of Frustration 5.9 5.8 2.4 2.4
Table 7: Average ratings and standard deviations for exit questionnaire data
Measure DF F value P value Difficulty 1 0.03 0.8567 Helpfulness 1 0.19 0.6692 Confidence 1 0.13 0.7184 Ease of Learning 1 3.5 0.0762
57

Overall Effectiveness 1 1.81 0.1937 Level of Frustration 1 0.04 0.8414
Table 8: ANOVA results for exit questionnaire data
As ANOVA results indicate, none of the responses of the students were
significantly different for either of the tools. However, with respect to "ease of learning,"
we can cautiously note a non-significant trend in favor of the ChemProV tool.
Covariance Analysis. To account for co variance due to learning style preference
and grades of students in the class, we introduced two covariates – learning style results
and final grades in Che 110 class, in an analysis of co variance (ANCOVA). Learning
style preference was not significantly related to any of our dependent variables.
Table 9 presents the results of ANCOVA for all variables. As the table indicates,
the final grades covariate significantly impacted two variables, total Correctness and
Equation Correctness. The partial-eta value indicates the degree of effect of the covariate
on the results. For instance the partial-eta value for covariate with total correctness is
0.201, which means that the trend accounts for only 20% of the variance in the data.
Similarly the partial eta value for covariate with equation correctness is 0.26, which
means that the trend accounts for 26% of the variation in the graph.
Source Type III Sum
of Squares df Mean Square F Sig.
Partial Eta Squared
Final Grades .408 1 .408 8.326 .007 .201
Table 9: ANCOVA results of final grades covariate and Total correctness
58

Source Type III Sum
of Squares df Mean Square F Sig.
Partial Eta Squared
Final Grades 1.130 1 1.130 12.130 .001 .269
Table 10: ANCOVA results of final grades covariate and Equation correctness
This indicates that the overall correctness of the solution and the equation
correctness are affected by the grades of students in the class.
Total correctnes vs. Grades
0.00%
20.00%
40.00%
60.00%
80.00%
100.00%
120.00%
51.9
58.2
63.5
66.7
69.4
74.2
76.8 80
82.3
83.8
90.4
Grades
Tota
l % C
orre
ctne
ss
ChemProv
Pen and Paper
Figure 30: Graph showing the relation of grades to Total correctness
59

Equation Correctness vs. Grades
0.00%
20.00%
40.00%
60.00%
80.00%
100.00%
120.00%
51.9
58.2
63.5
66.7
69.4
74.2
76.8 80 82
.383
.890
.4
Grades
% E
quat
ion
Cor
rect
ness
ChemProV
Pen and Paper
Figure 31: Graph showing the relation of grades to Equation correctness
Follow-up Analysis based on Grades. Since we failed to find statistically
significant evidence of the superiority of ChemProV over Pen and paper, we decided to
explore the possibility that ChemProV differentially impacted students based upon their
course performance. We suspected this might be the case not only because our original
design of the software was driven by the idea that we wanted to help retain those low
performing students who are most vulnerable to dropping out of the course, but also
because we observed that, out of total 21 participants, 10 students scored higher on
overall accuracy using ChemProV with an average of 69.07%.
To perform this follow-up analysis, we first partitioned students into “high” and
“low” categories based on their final class grades. Twelve students with grades above
class average (73) were assigned to the “high” category, and nine students whose grades
were below the class average were assigned to the “low” category. Table 11 presents the
60
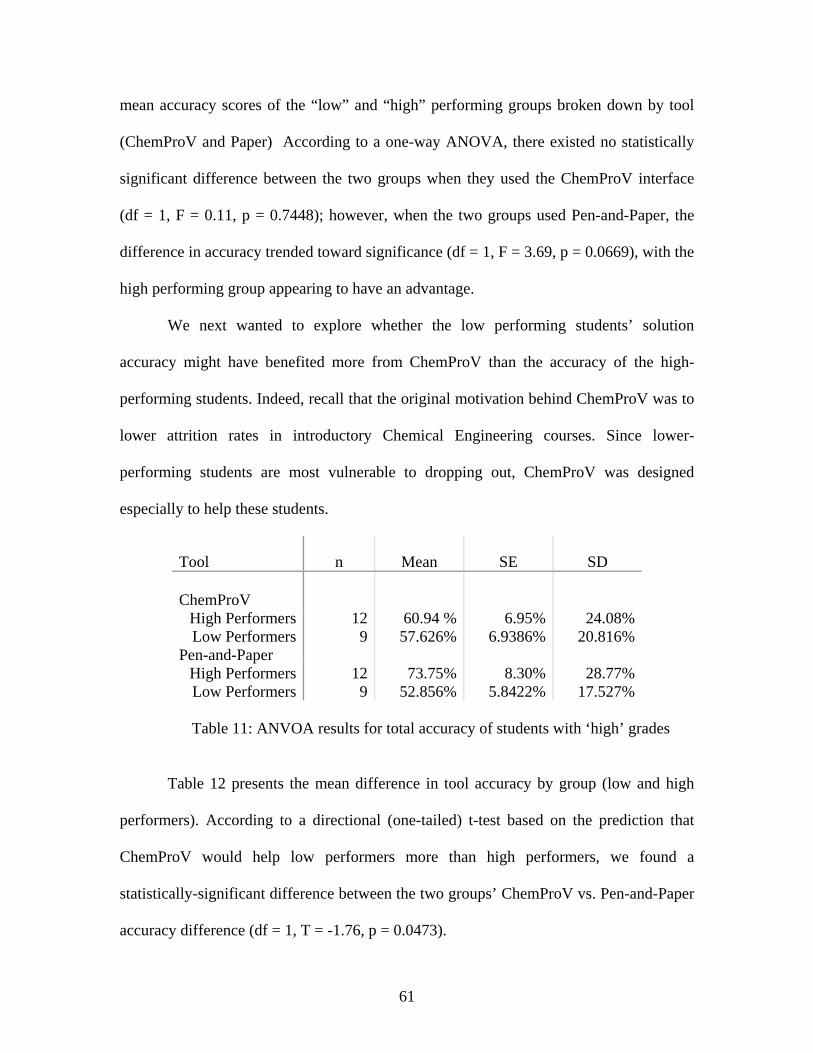
mean accuracy scores of the “low” and “high” performing groups broken down by tool
(ChemProV and Paper) According to a one-way ANOVA, there existed no statistically
significant difference between the two groups when they used the ChemProV interface
(df = 1, F = 0.11, p = 0.7448); however, when the two groups used Pen-and-Paper, the
difference in accuracy trended toward significance (df = 1, F = 3.69, p = 0.0669), with the
high performing group appearing to have an advantage.
We next wanted to explore whether the low performing students’ solution
accuracy might have benefited more from ChemProV than the accuracy of the high-
performing students. Indeed, recall that the original motivation behind ChemProV was to
lower attrition rates in introductory Chemical Engineering courses. Since lower-
performing students are most vulnerable to dropping out, ChemProV was designed
especially to help these students.
Tool n Mean SE SD
ChemProV High Performers 12 60.94 % 6.95% 24.08% Low Performers 9 57.626% 6.9386% 20.816%
Pen-and-Paper High Performers 12 73.75% 8.30% 28.77% Low Performers 9 52.856% 5.8422% 17.527%
Table 11: ANVOA results for total accuracy of students with ‘high’ grades
Table 12 presents the mean difference in tool accuracy by group (low and high
performers). According to a directional (one-tailed) t-test based on the prediction that
ChemProV would help low performers more than high performers, we found a
statistically-significant difference between the two groups’ ChemProV vs. Pen-and-Paper
accuracy difference (df = 1, T = -1.76, p = 0.0473).
61
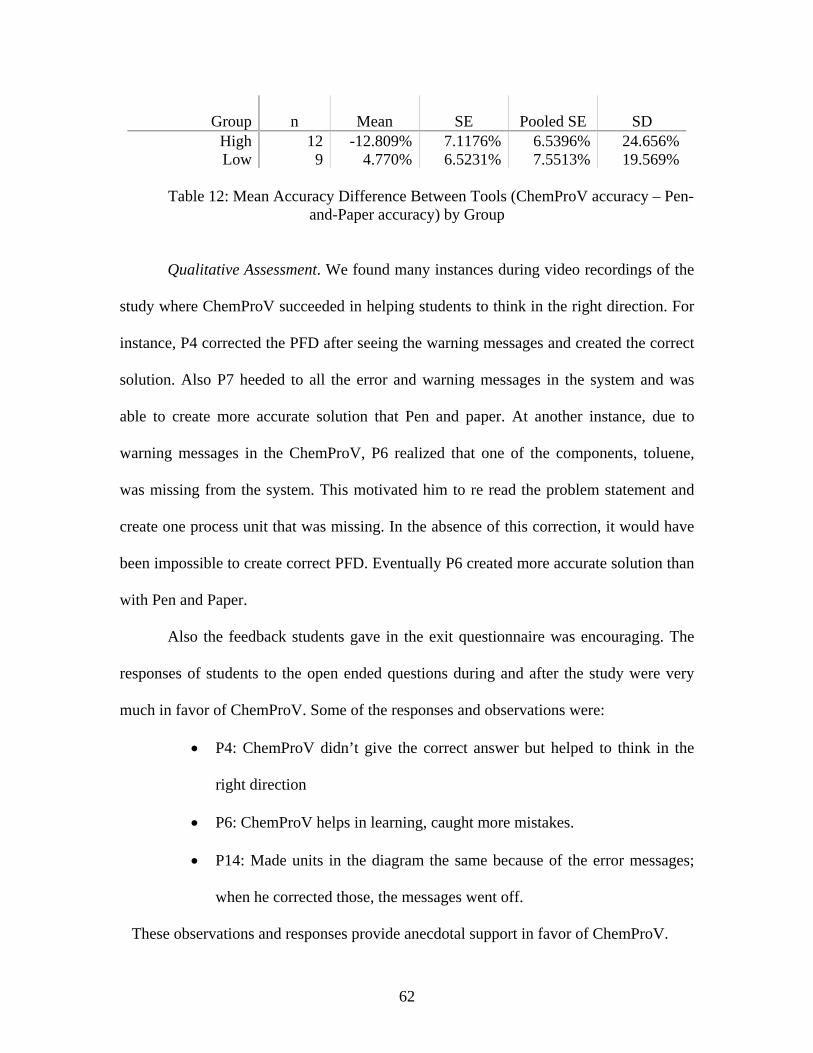
Group n Mean SE Pooled SE SD High 12 -12.809% 7.1176% 6.5396% 24.656%Low 9 4.770% 6.5231% 7.5513% 19.569%
Table 12: Mean Accuracy Difference Between Tools (ChemProV accuracy – Pen-
and-Paper accuracy) by Group
Qualitative Assessment. We found many instances during video recordings of the
study where ChemProV succeeded in helping students to think in the right direction. For
instance, P4 corrected the PFD after seeing the warning messages and created the correct
solution. Also P7 heeded to all the error and warning messages in the system and was
able to create more accurate solution that Pen and paper. At another instance, due to
warning messages in the ChemProV, P6 realized that one of the components, toluene,
was missing from the system. This motivated him to re read the problem statement and
create one process unit that was missing. In the absence of this correction, it would have
been impossible to create correct PFD. Eventually P6 created more accurate solution than
with Pen and Paper.
Also the feedback students gave in the exit questionnaire was encouraging. The
responses of students to the open ended questions during and after the study were very
much in favor of ChemProV. Some of the responses and observations were:
• P4: ChemProV didn’t give the correct answer but helped to think in the
right direction
• P6: ChemProV helps in learning, caught more mistakes.
• P14: Made units in the diagram the same because of the error messages;
when he corrected those, the messages went off.
These observations and responses provide anecdotal support in favor of ChemProV.
62
Discussion:
In trying to reconcile the anecdotal support for ChemProV with the lack of a
statistical effect we can identify two alternative explanations and two threats to validity,
as discussed below.
Alternative Explanations. One of the possible reasons that our hypothesis was not
confirmed was that participants failed to look at the warning/error messages as they were
generated. By reviewing the video recordings of all the participants we were able to
record the total number of warning/error messages generated in the system, number of
warning/error messages seen by the participants, number of warning messages heeded,
and total number of warning/error messages left unheeded at the end of participants'
problem-solving efforts. Table 13 presents the mean values and standard deviations of
these measures. . We considered a warning/error message as ‘seen” when the participant
took his/her mouse over the warning/error message symbol and read the message that
appeared. Similarly, when the correction was made after reading the message we
considered it as ‘correction made due to seeing the error/warning message’. It is
important to note that these data were coded by a single analyst (the thesis author). Thus,
they should be interpreted with caution, as the reliability of the coding system has not
been established by independent analysts.
The number of warnings seen and corrected was well below what we had
expected. Moreover, high standard deviations indicate that warning/error messages are
not uniformly noticed and addressed. Until and unless all the warning and error messages
are heeded and properly addressed by ChemProV users, we cannot expect users to
63

produce solutions with ChemProV that are more accurate than those produced with pen-
and-paper.
Mean Standard Deviation Number of Warnings
generated in 5.14 2.61
Number of Warnings Seen 1.90 1.86 Number of Warnings
heeded 1.04 1.50
Total number of warnings left unheeded
2.09 2.99
Table 13: Number of warning/error messages generated, seen, heeded, and left unheeded
per participant.
Another alternative explanation for our results could be the lack of time and
training given to the students to learn the software before solving the actual problem. In
our study, the participants were given 15 minutes to complete a brief tutorial designed to
familiarize themselves with each tool, and then were asked to solve a real problem. We
believe that, as students continue to use the ChemProV software, they will become more
familiar with the system and will start to benefit more from it. Recall that the main
objective of this software is to improve the learning of students. To expect this to happen
in one single session is quite ambitious. To improve learning and see its effects, we
believe that students will need to use this software over multiple sessions or maybe for a
semester. We believe that this will be more comprehensive test of the system's
effectiveness.
Threats to validity. We conducted an ANCOVA with final grades of the students
as covariate, to analyze our data. The interaction effect between “interface order” and
“problem order” was significant, indicating that there was some non isomorphism in the
64

tasks. Also in the exit questionnaire, some of the students mentioned that they found one
problem easier than the other, irrespective of the tool. Though we tried to create problems
of equivalent difficulty, it is possible that the way in which the problems were worded
made one problem appear difficult than the other. The non isomorphism of the problems
can be considered as a possible threat to the validity of the results.
In the study, it was found that many students were not able to complete the
tutorial or completed it just in time and at the same time there were few students who
completed the tutorial multiple times within 15 minutes. The time for tutorial was based
upon the pilot study results, which we ran with Che201 students (4 individual and 1 pair)
at WSU in the last week of Fall 08 semester. On average they took 12 minutes to
complete the tutorial. It is possible that the students of Che201 were more familiar with
computer systems so they took far less time to complete the tutorial, and that 12 minutes
was too short a time in which to expect Che110 students to complete the tutorial
Though we administered a background questionnaire to control for students’
exposure to chemical engineering software, we failed to account for their exposure to
computer systems. It is therefore possible that students’ ability to adapt to the system and
time to complete the tutorial could have been affected by their level of exposure to
computers and software in general. Our failure to account for the level of expertise of
participants in using computer systems can be seen as another possible threat to the
validity of the results.
Conclusions
Based on our, we can conclude that with the help of scaffolding in ChemProV, the
students with low grades in the class were able to create solutions equivalent in accuracy
65
to the solutions of students with high grades. On the other hand, using pen-and-paper,
which does not provide any scaffolding, the accuracy of students with low grades was
below that of their counterparts with high grades—a difference that trended toward
significance.
Recall that the rationale behind the development of ChemProV was to help
educators retain students in their curriculum. Students traditionally struggle with the
introductory material balance course, which may lead to frustration and their eventually
turning away from the program. It is more likely for students with lower grades to drop
out of the program. So implicitly, the software is targeted towards students with low
performance in the class. Our follow-up analysis suggests that the preliminary design of
ChemProV accords with this rationale.
We got mixed results from the further study of the data. Although lower
performing students appeared to benefit more from the ChemProV tool, much of this
significance of this benefit resulted from a sharp drop-off in the performance of higher
performing students when they used ChemProV. The drop in students’ performance with
ChemProV has opened new questions worth pursuing in future studies. The trend of
differential effects on students with disparate grades will be interesting to study and can
guide the future development of the tool.
66
CHAPTER FIVE
CONCLUSION AND FUTURE WORK
Chemical Engineering educators at are faced with the problem of low retention
rates of students in their program. Chemical engineering educators agree that the
introductory material balance class is a major stumbling block for the students in
chemical engineering discipline. The problem is further aggravated due to the lack of any
suitable educational tool for the material balance class. To address this issue, we have
implemented and empirically evaluated a visual learning environment, ChemProV, in
such a way that it provides scaffolding to the students new to the concepts of material
balance problems. The software provides cues to students as they work through problems
and tries to keep them on track toward a correct solution. In an experimental study,
ChemProV failed to provide a significant performance advantage over pen-and-paper, the
learning tool traditionally used to solve material balance problems. The lack of
significant statistical results yielded by the study, together with the encouraging
observations we made, opens up several directions of future research.
Video Analysis. We have collected interesting data on students' use of the
warning/error messages in the system (see Table 13); however, we do not have anything
to compare these data with. We need to collect data on how many warning/error
messages would have been generated while working with pen- and-paper and how many
of those would have been corrected. Alternately, we could conduct a follow-up study to
compare two versions of ChemProV: one with the error messages functionality and the
other without this functionality. As the efficacy of this software system is dependent on
the effectiveness of the messages generated, we believe such a follow-up study could
67

help to quantitatively gauge the effectiveness and usefulness of the warning/error
messages.
Also another study should be conducted to inspect why high performer in the
class were negatively affected by ChemProV. The analysis of data (see Table 12) in this
study shows that performance of students getting high grades dropped by nearly 13%
with ChemProV there at the same time students with low grades created 5% more
accurate solutions. The difference in effects of the interface on students with different
grades will be interesting to observe and will also provide critical insights for future
development of the tool.
Provide instant feedback. We observed in the study that only half of the messages
generated were ever heeded. Half of the error and warning messages were never seen and
hence not addressed. ChemProV presents error messages using just two symbols: one for
a warning and another for an error. After making a correction, a user gets feedback in
form of the disappearance of the warning/error symbol, only when the error or warning
has been completely resolved or warning changes into error or vice versa. In case, the
correction made introduces another warning or error, the system does not give instant
visible feedback. The symbol remains as it was, even though the cause of the error has
changed. The user can find out about it only when he/she explicitly moves the mouse
over the symbol.
This clearly violates Norman’s feedback principle. In his book, The Design of
Everyday Things (Norman, 2002), Norman explains the need and importance of the
feedback mechanism. According to the feedback principle, the effect of all user actions
should be immediately obvious through some kind of system feedback.
68

There are multiple techniques that can be employed in this situation to attract
attention to the feedback messages, such as the use of color coding, highlighting or even
modifying the instructions given before the study. Before any specific strategy is
implemented, we will need to iteratively refine it through usability testing. Irrespective
of which method is used, if we are able to draw users' attention to the warning/error
messages and word the messages in such a way that users take appropriate action to
correct them corrections, we believe that the learning of students and the accuracy of
their solutions will be greatly increased.
Implement the software over multiple sessions. To gauge the effectiveness of
ChemProV in improving the learning and problem solving abilities of the students, we
would like to conduct a between-subjects study over multiple sessions. Participants could
be divided into two groups with participants in one group working with ChemProV, and
participants in the other group working with pen and-paper. We believe that measuring
student learning outcomes over multiple sessions will provide us with greater sensitivity
to the impact of the ChemProV software, and will also result in students' becoming more
comfortable with the software and benefiting more greatly from it.
Levels of Scaffolding. Users of the software system should be given flexibility to
monitor the level of scaffolding they desire. While students first learning to solve
material balance problems may benefit from all of the error and warning messages, more
advanced learners should be able gradually to turn messages of certain types off as they
become more versed in problem solving. This is line with the common principle of
training wheels that can be gradually removed (Carroll & Rosson, 1987). At the same
time, the ability to turn certain types of error and warning messages on and off can help
69
students and instructors to concentrate on certain parts of the problem-solving process.
For instance, if students want to identify and correct their mistakes in equation creation
phase only, then they should be able to turn off rest of the warning/error messages.
The study conducted in this thesis not only has opened many new avenues of
research and development, but also shows a glimpse of success in improving learning of
students in an introductory material balance class. This research has provided directions
and a foundation for the future development of the ChemProV software, which, if
pursued, holds promise in improving the learning of chemical engineering students and
eventually helping chemical engineering educators to retain students in their program.
70
BIBLIOGRAPHY ChemSense. (n.d.). . Retrieved July 22, 2009, from http://www.chemsense.org/.
Applied e-Simulators Ae-S Process Simulation Software for Chemical, Mining, Minerals,
Energy, etc. (n.d.). . Retrieved July 22, 2009, from http://www.ae-sim.com/.
AspenTech: Optimizing Process Manufacturing. (n.d.). . Retrieved July 22, 2009, from
http://www.aspentech.com/.
Borrego, M. J., Padilla, M. A., Zhang, G., Ohland, M. W., & Anderson, T. J. (2005).
Graduation rates, grade-point average, and changes of major of female and
minority students entering engineering. In Frontiers in Education, 2005. FIE'05.
Proceedings 35th Annual Conference (pp. T3D–1).
Carroll, J. M., & Rosson, M. B. (1987). Paradox of the active user.
Chandler, P., & Sweller, J. (1991). Cognitive load theory and the format of instruction.
Cognition and instruction, 8(4), 293–332.
Chang, K. E., Sung, Y. T., & Chen, S. F. (2001). Learning through computer-based
concept mapping with scaffolding aid. Journal of Computer Assisted Learning,
17(1), 21–33.
CHEMCAD is a suite of chemical process simulation software. (n.d.). . Retrieved July
22, 2009, from http://www.chemstations.com/.
Chempute Software - Software Solutions for the Enginering Industry. (n.d.). . Retrieved
July 22, 2009, from http://www.chempute.com/.
Clough, D. E. (n.d.). Using Process Simulators with Dynamics/Control Capabilities to
Teach Unit and Plantwide Control Strategies. Proc. of the AIChE An. Meet.
71

Constructivism in learning. (n.d.). . Retrieved July 22, 2009, from
http://www.learningandteaching.info/learning/constructivism.htm.
Dahm, K. D., Hesketh, R. P., & Savelski, M. J. (2002). Is Process Simulation Used
Effectively in ChE Courses? Chemical Engineering Education, 36(3), 192–197.
Di Vesta, F. J., & Rieber, L. P. (1987). Characteristics of cognitive engineering: The next
generation of instructional systems. Educational Technology Research and
Development, 35(4), 213–230.
Doerry, E. (1995). An empirical comparison of copresent and technologically-mediated
interaction based on communicative breakdown. Citeseer.
Everse, S., Fass, M., Waterman, M., Derting, T. L., Giles, R., Gross, L., et al. (n.d.). Nils
S. Peterson Washington State University.
Felder, R. M., & Silverman, L. K. (1988). Learning and teaching styles in engineering
education. Engineering education, 78(7), 674–681.
Felder, R. M. (1986). Elementary Principles of Chemical Processes (2nd ed., p. 668).
New York: Wiley.
GAMS Home Page. (n.d.). . Retrieved July 22, 2009, from http://www.gams.com/.
Hundhausen, C. D., & Brown, J. L. (2007). What You See Is What You Code: A “live”
algorithm development and visualization environment for novice learners.
Journal of Visual Languages and Computing, 18(1), 22–47.
HYSYS and UniSim. (n.d.). . Retrieved July 22, 2009, from
http://people.clarkson.edu/~wilcox/Design/refhysys.htm.
Introduction to HYSYS. (n.d.). . Retrieved July 22, 2009, from
http://www.owlnet.rice.edu/~chbe403/hysys/intro.html.
72
Kalyuga, S., Ayres, P., Chandler, P., & Sweller, J. (2003). The expertise reversal effect.
Educational Psychologist, 38(1), 23–31.
Koedinger, K. R., & Anderson, J. R. (1998). Illustrating principled design: The early
evolution of a cognitive tutor for algebra symbolization. Interactive Learning
Environments, 5(1), 161–179.
Lave, J., & Wenger, E. (2000). Legitimate peripheral participation in communities of
practice. Strategic Learning in a Knowledge Economy: Individual, Collective and
Organizational Learning Processes, 167.
Michalchik, V., Rosenquist, A., Kozma, R., Kreikemeier, P., Schank, P., & Coppola, B.
(2008). Representational Resources for Constructing Shared Understandings in
the High School Chemistry Classroom. Visualization: Theory and Practice in
Science Education, 233.
Miller, G. A. (1994). The magical number seven, plus or minus two: Some limits on our
capacity for processing information. Psychological Review, 101(2), 343. doi:
Article.
Norman, D. A. (2002). The design of everyday things. Basic Books New York.
Norman, D. A., & Draper, S. W. (1986). User Centered System Design; New
Perspectives on Human-Computer Interaction. L. Erlbaum Associates Inc.
Hillsdale, NJ, USA.
Norris, C., & Soloway, E. (2004). Envisioning the handheld-centric classroom. Journal of
educational computing research, 30(4), 281–294.
Paas, F., Tuovinen, J. E., Van Merrienboer, J. J., & Aubteen Darabi, A. (2005). A
motivational perspective on the relation between mental effort and performance:
73
Optimizing learner involvement in instruction. Educational Technology Research
and Development, 53(3), 25–34.
Products | PiCoMap | GoKnow! (n.d.). . Retrieved July 22, 2009, from
http://goknow.com/Products/PiCoMap/.
Secondary Math Curricula with Proven Success: Cognitive Tutor® Software Overview.
(n.d.). . Retrieved July 22, 2009, from
http://www.carnegielearning.com/software_features.cfm.
SimSci-Esscor. (n.d.). . Retrieved July 22, 2009, from
http://ips.invensys.com/en/products/processdesign/Pages/SimSci-Esscor.aspx.
Sweller, J., Van Merrienboer, J. J., & Paas, F. G. (1998). Cognitive architecture and
instructional design. Educational psychology review, 10(3), 251–296.
Vygotski\uı. (n.d.). Mind in society: The development of higher psychological processes.
Wiecha, J. M., Gramling, R., Joachim, P., & Vanderschmidt, H. (2003). Collaborative e-
learning using streaming video and asynchronous discussion boards to teach the
cognitive foundation of medical interviewing: a case study. Journal of Medical
Internet Research, 5(2).
Wood, D., Bruner, J. S., & Ross, G. (1976). THE ROLE OF TUTORING IN PROBLEM
SOLVING*. Journal of child psychology and psychiatry, 17(2), 89–100.
Zollars, R., Hundhausen, C.D., & Brown, J.L. (2008), Designing a Software Environment
for Visual Learning in Introductory Chemical Engineering Classes, American
Society for Engineering Education Annual Conference & Exposition.
74

APPENDIX
A1. Consent Form to Participate in the ChemE Problem Solving Main Study
Spring, 2009 Dr. Christopher Hundhausen and Dr. Richard Zollars, Principal Investigators
Visualization and End-User Programming Laboratory School of Electrical Engineering and Computer Science
Washington State University Pullman, WA 99164-2752
509-335-4590
Description of Study: You, _________________________________________, have been asked to participate in this research project, which is exploring the use of alternative educational strategies and environments to assist in teaching introductory chemical engineering concepts and skills. You have been sked to spend about 120 minutes in the Visualization and End User Programming Lab at Washington State University to participate in this study. This will involve your doing some or all of the following:
• reading aloud and studying brief task descriptions; • using software and pen-and-paper to help you model and solve chemical balance problems;
and • interacting with researchers.
The researchers will digitally record the computer screen along with you and your voice. Although your voice, and possibly your face, will appear on the recording, your name will not be on the recording. When the researchers describe their work to other people, they will not use your name.
Risks, Benefits, and Responsibilities: Your participation in this study will not incur any risks beyond the minimal risks associated with participating in a university course. The results may help the researchers gain insights into the design of supporting software for introductory chemical engineering courses.
Costs and Payments: Your participation in this study’s activities is a required part of the ChemE 110 course in which you are presently enrolled. By signing this form, you can choose to release the data collected on you during the study for analysis in this study.
Confidentiality: Any information about you that is obtained from this study, including what you say, will be confidential. Your real name will be kept in a locked file and only the researchers will have access to it. Only your code name will appear on the recording and in reports of the study. You therefore give permission for publication and use of descriptions and recording of your participation for purposes of research and education, provided your anonymity is preserved.
Right to Refuse or End Participation: You may refuse to participate in this study or stop participating at any time. If you stop participating before completing a study session, you will still receive course participation credit commensurate with the time that you have put in. Your decision whether or not to participate in this study will NOT impact your course grade.
Certification: By signing below, you certify that you have read and that you understand the foregoing, that you have been given satisfactory answers to my inquiries concerning
75

projects procedures and other matters, and that you have been advised that you are free to withdraw my consent and to discontinue participation in the project or activity at any time, and that such refusal or withdrawal will NOT impact your course grade.
You herewith give your consent to participate in this project with the understanding that such consent does not waive any of your legal rights, nor does it release the principal investigator or the institution or any employee or agent thereof from liability for negligence. You understand that you shall remain anonymous in all written and verbal reports of this research. You will be given a copy of this form to keep.
Do you also give the principal investigators permission to show videotaped footage of your study session when they present the work to others for the purposes or research and education? Yes No (check one).
Signature of individual participant Date
Signature of Principal Investigator Date (This research project has been reviewed and approved by the WSU Institutional Review Board. If you have questions or concerns regarding the study, please contact Dr. Chris Hundhausen at 509-335-4590 or [email protected]. If you have questions or concerns regarding your rights as a participant, please contact the WSU Institutional Review Board at 508-335-3668 or [email protected].)
76

A2. Participant Background Questionnaire
I. Contact Information
1. Name:
2. E-Mail Address:
3. Phone # (so we can remind you of your appointment):
II. Demographic Information
4. Age: Gender:
5. Class standing (circle one): Freshman Sophomore Junior Senior
6. Major:
7. Approximate grade point average: 8. Have you ever used any Chemical Visualization or Material Balance Software
(circle one)? Yes No
9. If you answered “Yes” to question 7,
8.1 Name the software? 8.2 How much have you used it?
77
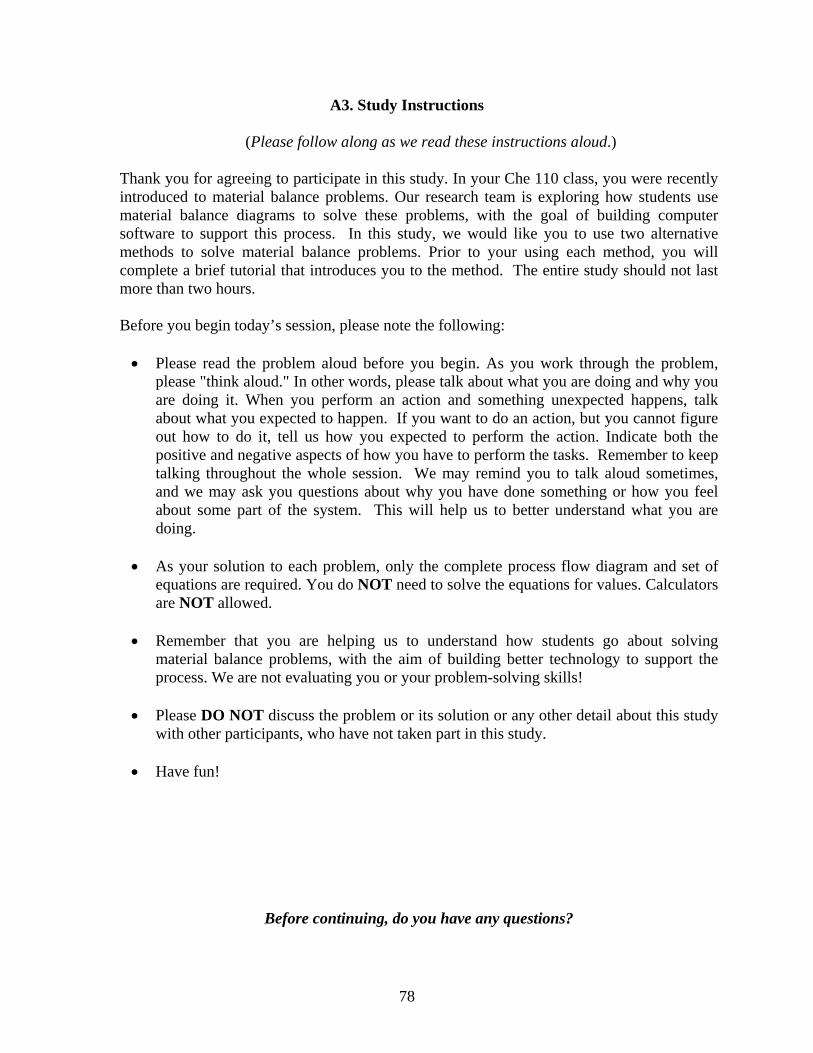
A3. Study Instructions
(Please follow along as we read these instructions aloud.)
Thank you for agreeing to participate in this study. In your Che 110 class, you were recently introduced to material balance problems. Our research team is exploring how students use material balance diagrams to solve these problems, with the goal of building computer software to support this process. In this study, we would like you to use two alternative methods to solve material balance problems. Prior to your using each method, you will complete a brief tutorial that introduces you to the method. The entire study should not last more than two hours. Before you begin today’s session, please note the following: • Please read the problem aloud before you begin. As you work through the problem,
please "think aloud." In other words, please talk about what you are doing and why you are doing it. When you perform an action and something unexpected happens, talk about what you expected to happen. If you want to do an action, but you cannot figure out how to do it, tell us how you expected to perform the action. Indicate both the positive and negative aspects of how you have to perform the tasks. Remember to keep talking throughout the whole session. We may remind you to talk aloud sometimes, and we may ask you questions about why you have done something or how you feel about some part of the system. This will help us to better understand what you are doing.
• As your solution to each problem, only the complete process flow diagram and set of
equations are required. You do NOT need to solve the equations for values. Calculators are NOT allowed.
• Remember that you are helping us to understand how students go about solving
material balance problems, with the aim of building better technology to support the process. We are not evaluating you or your problem-solving skills!
• Please DO NOT discuss the problem or its solution or any other detail about this study
with other participants, who have not taken part in this study. • Have fun!
Before continuing, do you have any questions?
78

Tutorial 1 Please take 15 minutes to complete the tutorial that the experimenter will hand to you. If you complete the tutorial before the 15 minutes are up, then go back and start the tutorial over. The experimenter will inform you when your time is up.
Stop! Please await further instructions before continuing.
79

Problem A Using the ChemProv tool, please complete the following problem by (a) constructing a process flow diagram that models the problem, and (b) formulating a set of equations that, if solved, will furnish the solution to the problem. Do not solve the equations for values! You will have up to 40 minutes to complete the problem. Work as quickly as possible, without sacrificing accuracy. Please inform the experimenter when you are done. Remember to read the problem description aloud before you begin. Liquid extraction is an operation used to separate the components of a liquid mixture of two or more species. In the simplest case, the mixture contains two components: a solute (A) and a liquid solvent (B). The mixture is contacted in an agitated vessel with a second liquid solvent (C) that has two key properties: A dissolves in it, and B is immiscible or nearly immiscible with it. (For example, B may be water, C a hydrocarbon oil, and A a species that dissolves in both water and oil.) Some of the A transfers from B to C and then the B-rich phase (raffinate) and the C-rich phase (the extract) separate from each other in a settling tank. Create a mixer-settler process flow diagram in which an acetic acid (A) and water (B) stream is first mixed with a hexane(C) stream in a Mixer. The mixture then flows to a settling tank to form two streams, an extract and a raffinate. Label each stream with enough values to fully characterize that stream (flow rate, composition, etc.). Provide a numerical value if possible. The following facts are given:
4) The acetic acid/water solution enters at a rate of 400 gm/min. The acetic acid composes 11.5 % of the solution by weight.
5) The extract phase leaving the process contains 9.6 % acetic acid by weight. 6) The raffinate phase leaving the process contains 0.5% acetic acid by weight.
Calculate the flow rate of the n-hexane, the extract and the raffinate streams.
When you are done with the problem, please inform the experimenter.
80

Tutorial 2 Please take 15 minutes to complete the tutorial that the experimenter will hand to you. If you complete the tutorial before the 15 minutes are up, then go back and start the tutorial over. The experimenter will inform you when your time is up.
Stop! Please await further instructions before continuing.
81
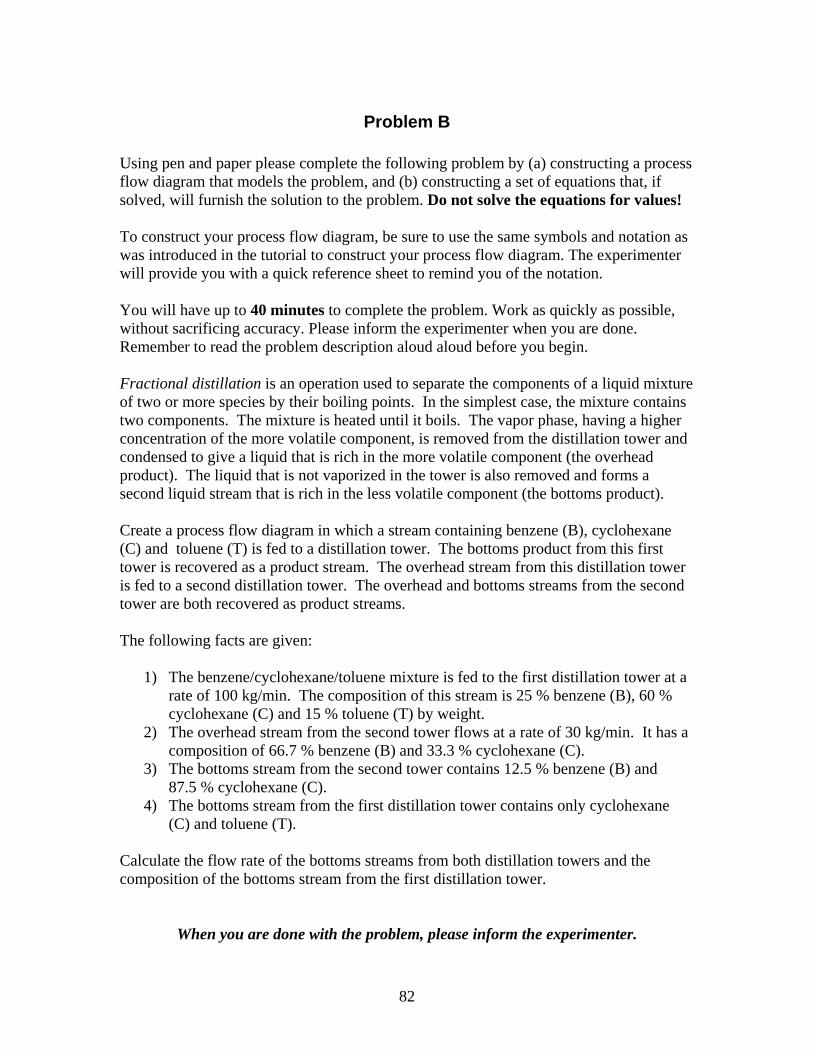
Problem B Using pen and paper please complete the following problem by (a) constructing a process flow diagram that models the problem, and (b) constructing a set of equations that, if solved, will furnish the solution to the problem. Do not solve the equations for values! To construct your process flow diagram, be sure to use the same symbols and notation as was introduced in the tutorial to construct your process flow diagram. The experimenter will provide you with a quick reference sheet to remind you of the notation. You will have up to 40 minutes to complete the problem. Work as quickly as possible, without sacrificing accuracy. Please inform the experimenter when you are done. Remember to read the problem description aloud aloud before you begin. Fractional distillation is an operation used to separate the components of a liquid mixture of two or more species by their boiling points. In the simplest case, the mixture contains two components. The mixture is heated until it boils. The vapor phase, having a higher concentration of the more volatile component, is removed from the distillation tower and condensed to give a liquid that is rich in the more volatile component (the overhead product). The liquid that is not vaporized in the tower is also removed and forms a second liquid stream that is rich in the less volatile component (the bottoms product). Create a process flow diagram in which a stream containing benzene (B), cyclohexane (C) and toluene (T) is fed to a distillation tower. The bottoms product from this first tower is recovered as a product stream. The overhead stream from this distillation tower is fed to a second distillation tower. The overhead and bottoms streams from the second tower are both recovered as product streams. The following facts are given:
1) The benzene/cyclohexane/toluene mixture is fed to the first distillation tower at a rate of 100 kg/min. The composition of this stream is 25 % benzene (B), 60 % cyclohexane (C) and 15 % toluene (T) by weight.
2) The overhead stream from the second tower flows at a rate of 30 kg/min. It has a composition of 66.7 % benzene (B) and 33.3 % cyclohexane (C).
3) The bottoms stream from the second tower contains 12.5 % benzene (B) and 87.5 % cyclohexane (C).
4) The bottoms stream from the first distillation tower contains only cyclohexane (C) and toluene (T).
Calculate the flow rate of the bottoms streams from both distillation towers and the composition of the bottoms stream from the first distillation tower.
When you are done with the problem, please inform the experimenter.
82
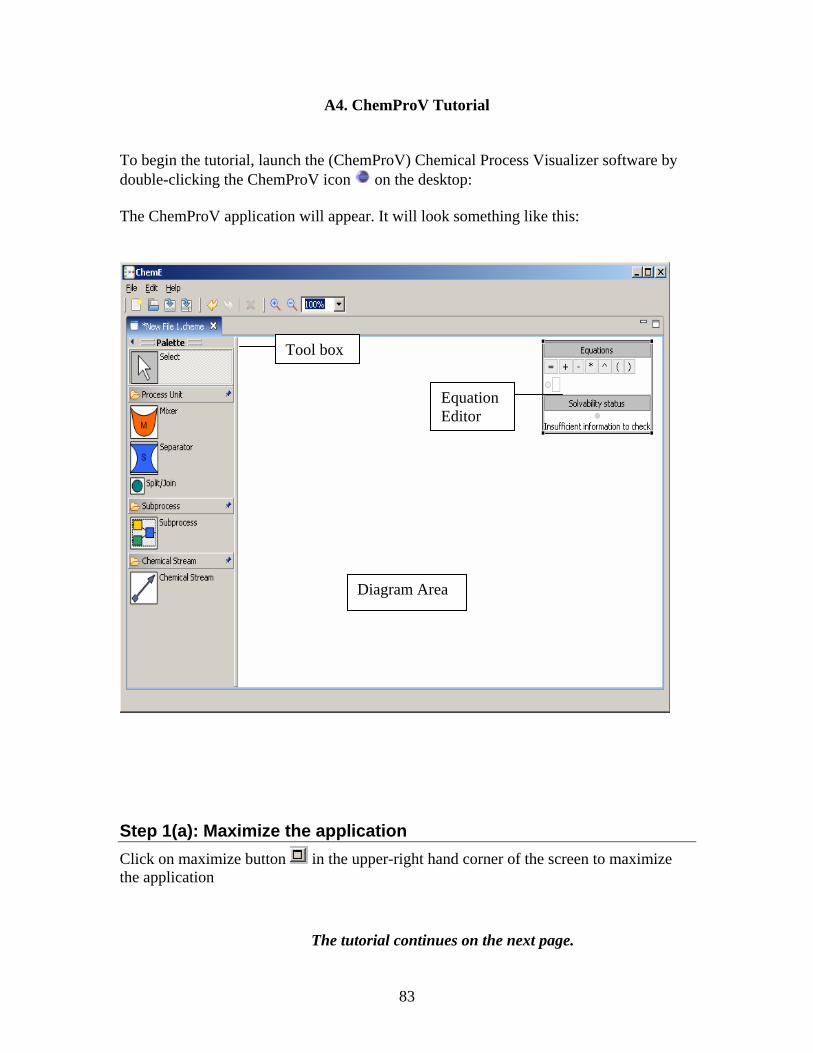
A4. ChemProV Tutorial
To begin the tutorial, launch the (ChemProV) Chemical Process Visualizer software by double-clicking the ChemProV icon on the desktop: The ChemProV application will appear. It will look something like this:
x
Step 1(a): MaximizeClick on maximize buttothe application
Tool bo
Equation Editor
Diagram Area
the application n in the upper-right hand corner of the screen to maximize
The tutorial continues on the next page.
83
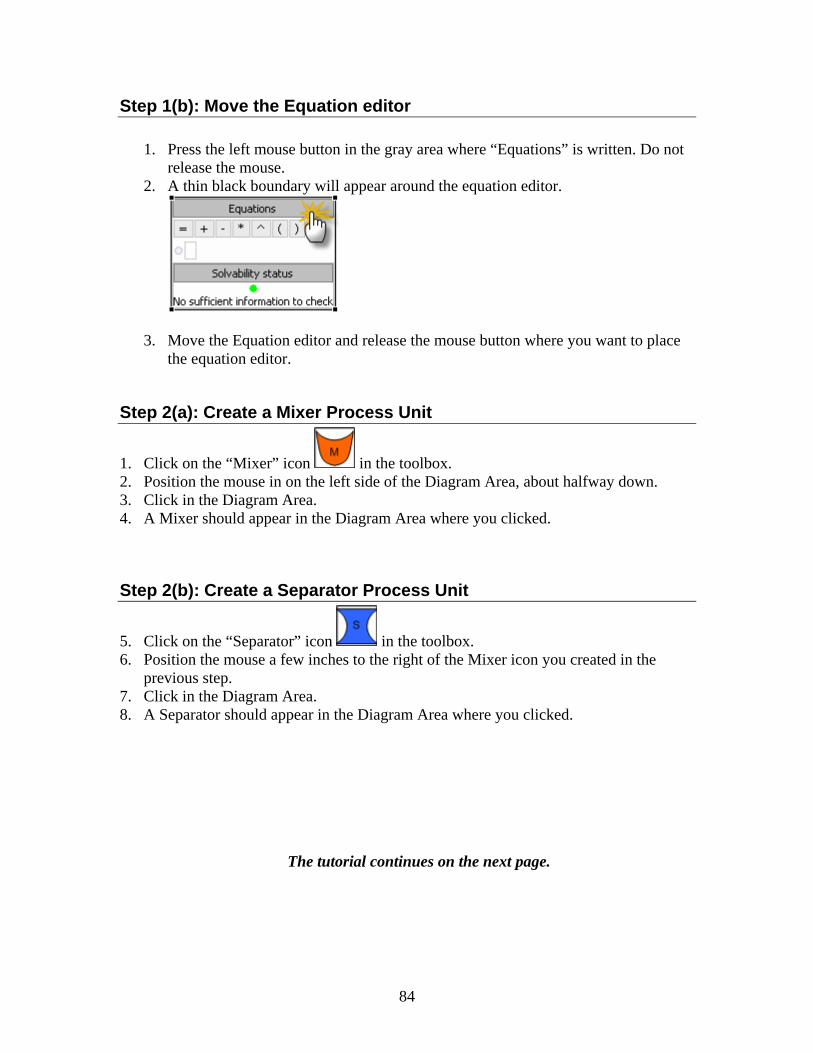
Step 1(b): Move the Equation editor
1. Press the left mouse button in the gray area where “Equations” is written. Do not release the mouse.
2. A thin black boundary will appear around the equation editor.
3. Move the Equation editor and release the mouse button where you want to place the equation editor.
Step 2(a): Create a Mixer Process Unit
1. Click on the “Mixer” icon in the toolbox. 2. Position the mouse in on the left side of the Diagram Area, about halfway down. 3. Click in the Diagram Area. 4. A Mixer should appear in the Diagram Area where you clicked.
Step 2(b): Create a Separator Process Unit
5. Click on the “Separator” icon in the toolbox. 6. Position the mouse a few inches to the right of the Mixer icon you created in the
previous step. 7. Click in the Diagram Area. 8. A Separator should appear in the Diagram Area where you clicked.
The tutorial continues on the next page.
84

After you complete steps 2a and 2b, your screen should look something like this:
The tutorial continues on the next page.
85
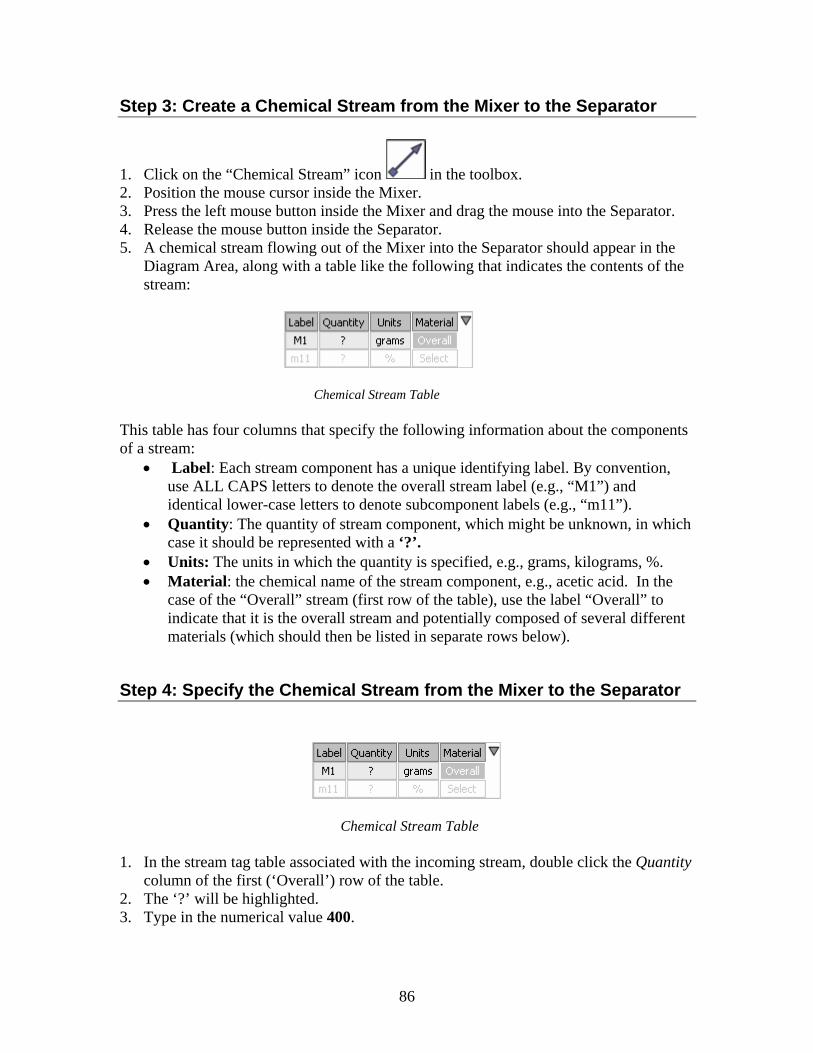
Step 3: Create a Chemical Stream from the Mixer to the Separator
1. Click on the “Chemical Stream” icon in the toolbox. 2. Position the mouse cursor inside the Mixer. 3. Press the left mouse button inside the Mixer and drag the mouse into the Separator. 4. Release the mouse button inside the Separator. 5. A chemical stream flowing out of the Mixer into the Separator should appear in the
Diagram Area, along with a table like the following that indicates the contents of the stream:
Chemical Stream Table This table has four columns that specify the following information about the components of a stream:
• Label: Each stream component has a unique identifying label. By convention, use ALL CAPS letters to denote the overall stream label (e.g., “M1”) and identical lower-case letters to denote subcomponent labels (e.g., “m11”).
• Quantity: The quantity of stream component, which might be unknown, in which case it should be represented with a ‘?’.
• Units: The units in which the quantity is specified, e.g., grams, kilograms, %. • Material: the chemical name of the stream component, e.g., acetic acid. In the
case of the “Overall” stream (first row of the table), use the label “Overall” to indicate that it is the overall stream and potentially composed of several different materials (which should then be listed in separate rows below).
Step 4: Specify the Chemical Stream from the Mixer to the Separator
Chemical Stream Table
1. In the stream tag table associated with the incoming stream, double click the Quantity
column of the first (‘Overall’) row of the table. 2. The ‘?’ will be highlighted. 3. Type in the numerical value 400.
86

4. Positioning the mouse cursor in the next row, double click in the cell under the
Material column. A drop down menu will appear that contains the names of all possible materials.
5. Choose “acetic acid” from the dropdown menu as the material.
6. Positioning the mouse cursor in the same row as in (4), double-click in the cell under the Units column. A drop down menu will appear.
7. Choose ‘grams’ from the dropdown menu as the unit.
8. Double click under the Quantity column of the second row labeled 'm11'. 9. Specify 400, a numerical value equal to the overall quantity.
The tutorial continues on the next page.
87

After you complete steps 3 and 4, your screen should look something like this:
The tutorial continues on the next page.
88

Step 5a: Create Two Outgoing Chemical Streams from the Separator
1. Click on the “Chemical Stream” icon in the toolbox. 2. Position the mouse cursor inside the Separator. 3. Click the left mouse button and drag the mouse to the right hand side of the
Separator. 4. Release the mouse to create a stream angled to the top-right of the Diagram area. 5. Follow the same procedure in steps 1-4 to create a second stream angled to the
bottom-right of the Diagram area. Once you have created the two streams, they should look something like this:
Step 5b: Specify the top Chemical Stream coming out of the Separator
1. In the table associated with the top-most stream you created in Step 5a, double click under the Quantity column of the 'Overall' component in the first row.
2. Specify 200 as the Quantity. By default, the units will be set to grams, which is what you want.
3. Double-click in the Quantity column of the second row the table (labeled 'm21'). Enter 100 as the quantity.
4. Double-click in Units column of the second row the table (labeled 'm21'). Enter '%' as the unit.
5. Double click in the Material column of the second row of the table (labeled 'm21'). From the drop-down menu, choose "acetic acid" as the material.
When you have completed this step, the table associated with the top-most stream should look like this:
89

Step 5c: Specify the bottom Chemical Stream coming out of the Separator
1. In the table associated with the bottom-most stream you created in Step 5a, double click under the Quantity column of the 'Overall' component in the first row.
2. Specify 200 as the Quantity. By default, the units will be set to grams, which is what you want.
3. Double click in the Material column of the second row of the table (labeled 'm31'). From the drop-down menu, choose "acetic acid" as the material.
4. Leave the quantity of the row labeled 'm31' as it is i.e. ‘?’ (unknown).
When you have completed this step, the table associated with the bottom-most stream should look like this:
The tutorial continues on the next page
90
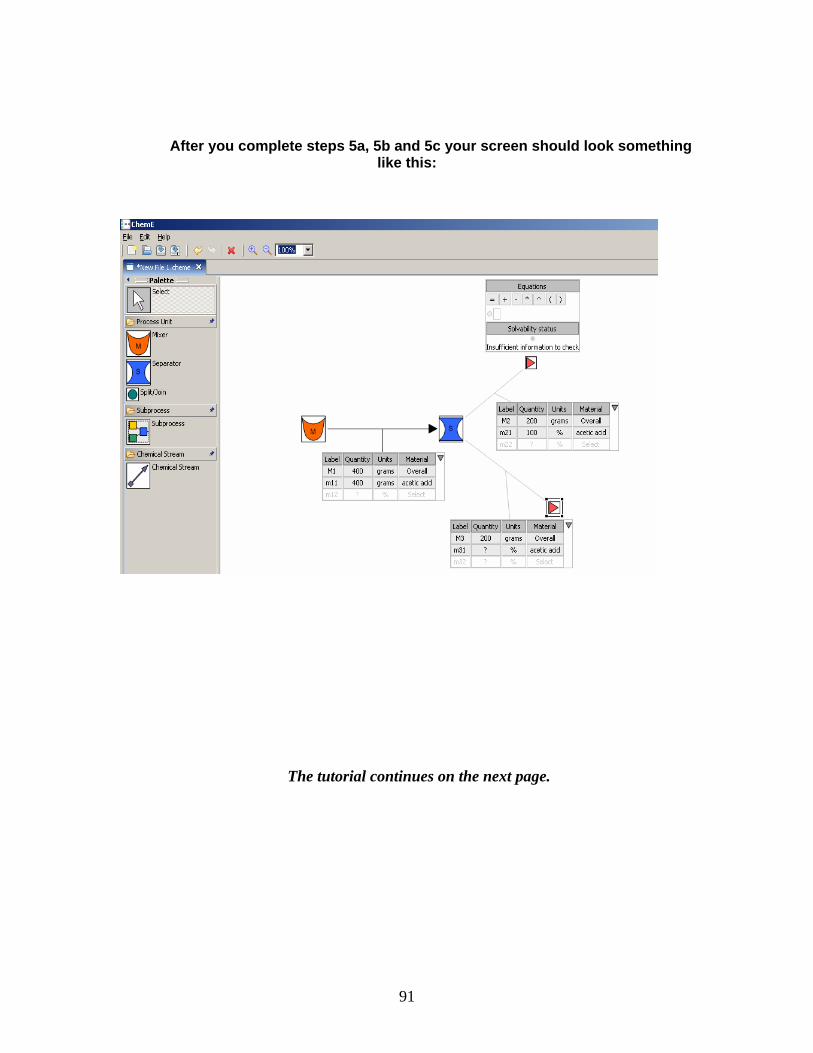
After you complete steps 5a, 5b and 5c your screen should look something like this:
The tutorial continues on the next page.
91
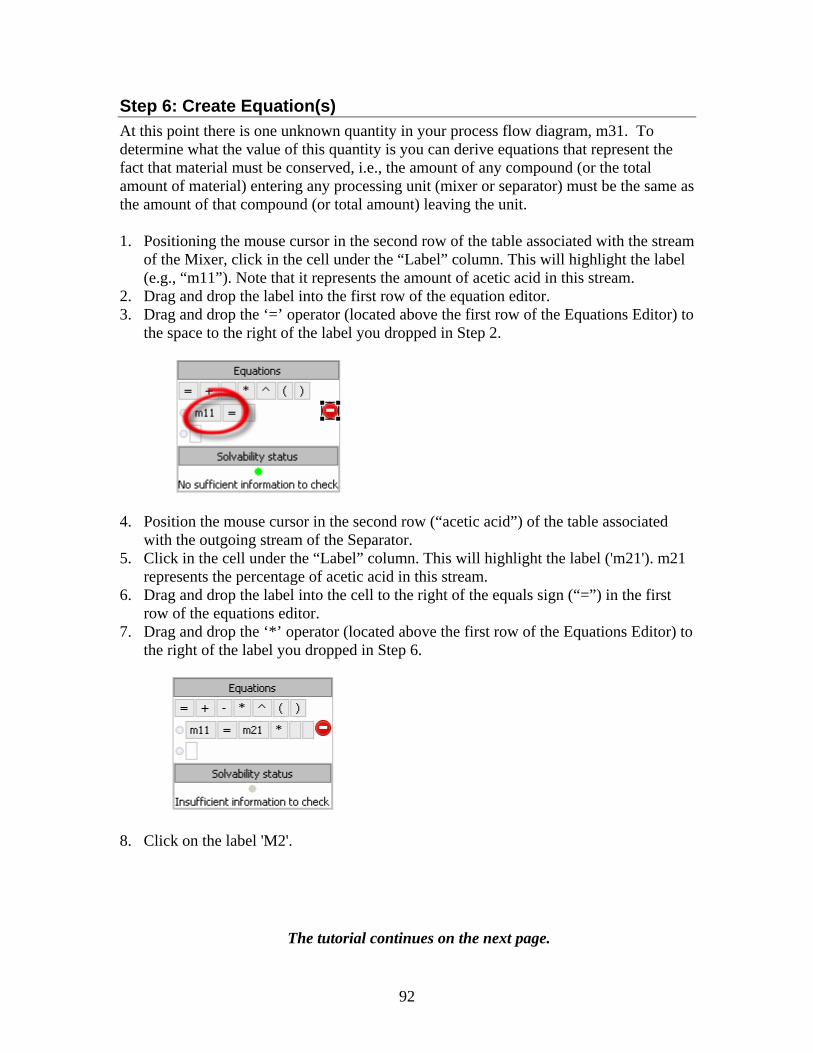
Step 6: Create Equation(s) At this point there is one unknown quantity in your process flow diagram, m31. To determine what the value of this quantity is you can derive equations that represent the fact that material must be conserved, i.e., the amount of any compound (or the total amount of material) entering any processing unit (mixer or separator) must be the same as the amount of that compound (or total amount) leaving the unit. 1. Positioning the mouse cursor in the second row of the table associated with the stream
of the Mixer, click in the cell under the “Label” column. This will highlight the label (e.g., “m11”). Note that it represents the amount of acetic acid in this stream.
2. Drag and drop the label into the first row of the equation editor. 3. Drag and drop the ‘=’ operator (located above the first row of the Equations Editor) to
the space to the right of the label you dropped in Step 2.
4. Position the mouse cursor in the second row (“acetic acid”) of the table associated with the outgoing stream of the Separator.
5. Click in the cell under the “Label” column. This will highlight the label ('m21'). m21 represents the percentage of acetic acid in this stream.
6. Drag and drop the label into the cell to the right of the equals sign (“=”) in the first row of the equations editor.
7. Drag and drop the ‘*’ operator (located above the first row of the Equations Editor) to the right of the label you dropped in Step 6.
8. Click on the label 'M2'.
The tutorial continues on the next page.
92

9. Drag and drop the label into the cell to the right of the multiplication sign (“*”) in the equations editor.
This expression (percentage*total amount) gives the amount of acetic acid in this stream.
10. Drag and drop ‘+’ operator to the right of the label you dropped in step 9. 11. Repeat, Steps 5 to 8 to add 'm31 * M3' to the equation. As in steps 5-8 the percentage
of acetic acid times a total amount gives the amount of acetic acid in the stream.
The tutorial continues on the next page.
93
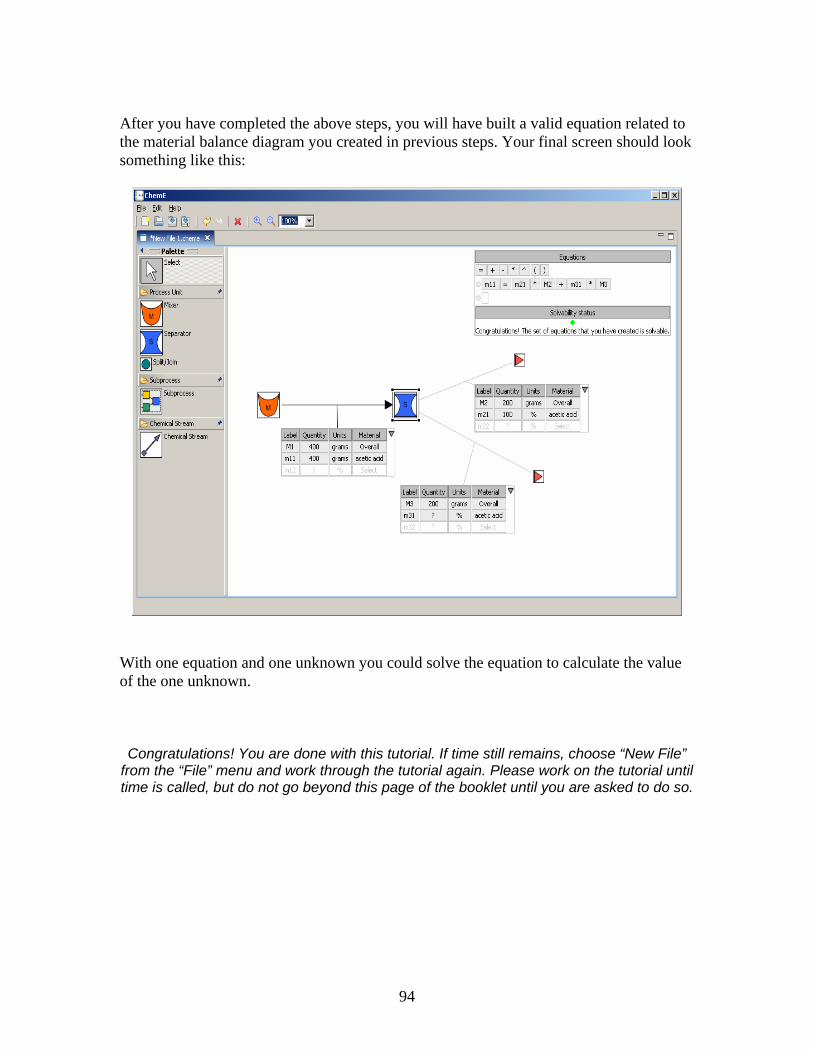
After you have completed the above steps, you will have built a valid equation related to the material balance diagram you created in previous steps. Your final screen should look something like this:
With one equation and one unknown you could solve the equation to calculate the value of the one unknown. Congratulations! You are done with this tutorial. If time still remains, choose “New File”
from the “File” menu and work through the tutorial again. Please work on the tutorial until time is called, but do not go beyond this page of the booklet until you are asked to do so.
94

A5. Pen and Paper Tutorial
To begin the tutorial, get out a pen and a blank sheet of paper.
Step 1(a): Draw a “Mixer” process unit
1. Draw a rectangular box on the left side of the paper, about halfway down. 2. Write ‘M’ inside it.
M 3. It should appear as follows:
Step 1(b): Draw a “Separator” process unit
1. Draw a rectangular box a few inches to the right of the box you drew in the previous step
2. Write ‘S’ inside it. 3. It should appear as follows:
The tutorial continues on the next page.
S
95
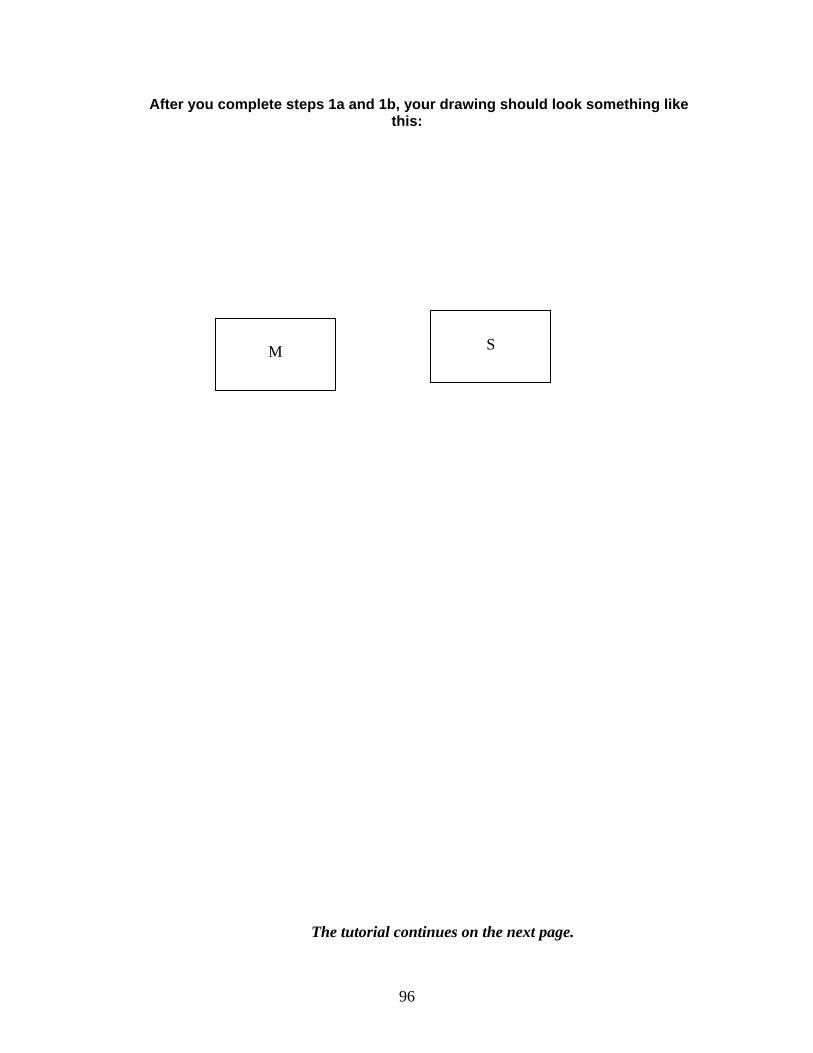
After you complete steps 1a and 1b, your drawing should look something like this:
S
M
The tutorial continues on the next page.
96

Step 2: Create Chemical Stream from the Mixer to the Separator 9. Draw a chemical stream that flows from the Mixer to the Separator that you
created in the previous steps. 10. Below the stream, create a table like the one below to indicate the contents of the
stream:
Label Quantity Units Material Overall
Chemical Stream Table This table has four columns that specify the following information about the components of a stream:
a. Label: Each stream component has a unique identifying label. By convention, use ALL CAPS letters to denote the overall stream label (e.g., “M1”) and identical lower-case letters to denote subcomponent labels (e.g., “m11”).
b. Quantity: The quantity of stream component, which might be unknown, in which case it should be represented with a ‘?’.
c. Units: The units in which the quantity is specified, e.g., grams, kilograms, %. d. Material: the chemical name of the stream component, e.g., ascetic acid. In the
case of the “Overall” stream (first row of the table), use the label “Overall” to indicate that it is the overall stream and potentially composed of several different materials (which should then be listed in separate rows below).
Step 3: Specify the Chemical Stream from the Mixer to the Separator
Label Quantity Units Material Overall
Chemical Stream Table 1. In the stream table associated with the “Mixer”, specify the components as
follows:: First Row:
• Label: M1 • Quantity: 400 • Units: grams • Material: Overall
Second Row • Label: m11 • Quantity: 400 (a value equal to the overall quantity) • Units: grams • Material: acetic acid The tutorial continues on the next page.
97
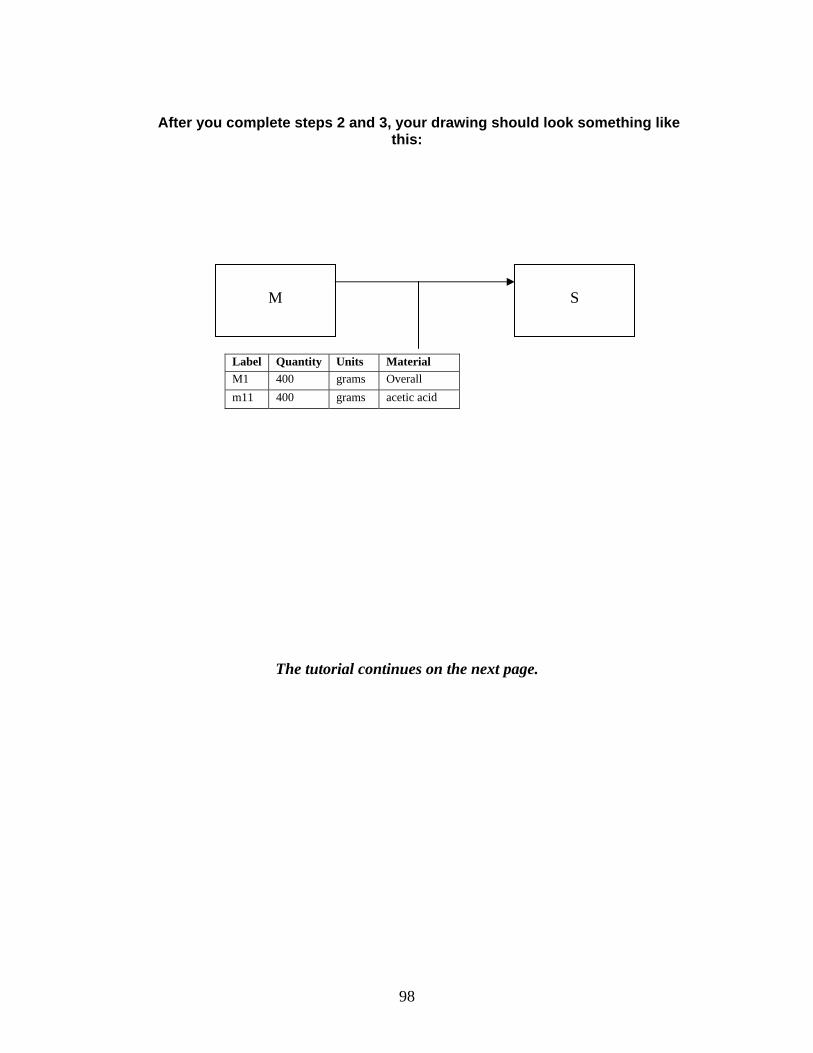
After you complete steps 2 and 3, your drawing should look something like
this:
Label Quantity Units Material M1 400 grams Overall m11 400 grams acetic acid
S
M
The tutorial continues on the next page.
98
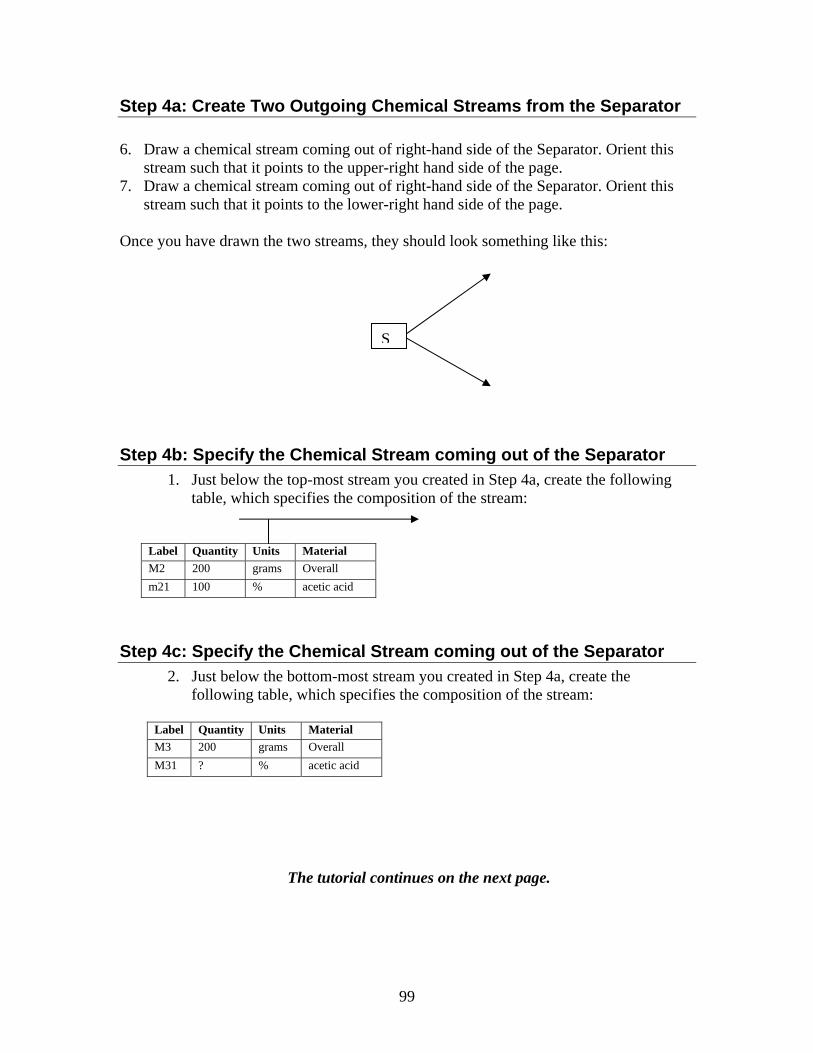
Step 4a: Create Two Outgoing Chemical Streams from the Separator 6. Draw a chemical stream coming out of right-hand side of the Separator. Orient this
stream such that it points to the upper-right hand side of the page. 7. Draw a chemical stream coming out of right-hand side of the Separator. Orient this
stream such that it points to the lower-right hand side of the page. Once you have drawn the two streams, they should look something like this:
Step 4b: Specify the Chemical S1. Just below the top-most strea
table, which specifies the com
Label Quantity Units Material M2 200 grams Overall m21 100 % acetic acid
Step 4c: Specify the Chemical S2. Just below the bottom-most
following table, which specif
Label Quantity Units Material M3 200 grams Overall M31 ? % acetic acid
The tutorial c
S
tream coming out of the Separator m you created in Step 4a, create the following position of the stream:
tream coming out of the Separator stream you created in Step 4a, create the ies the composition of the stream:
ontinues on the next page.
99
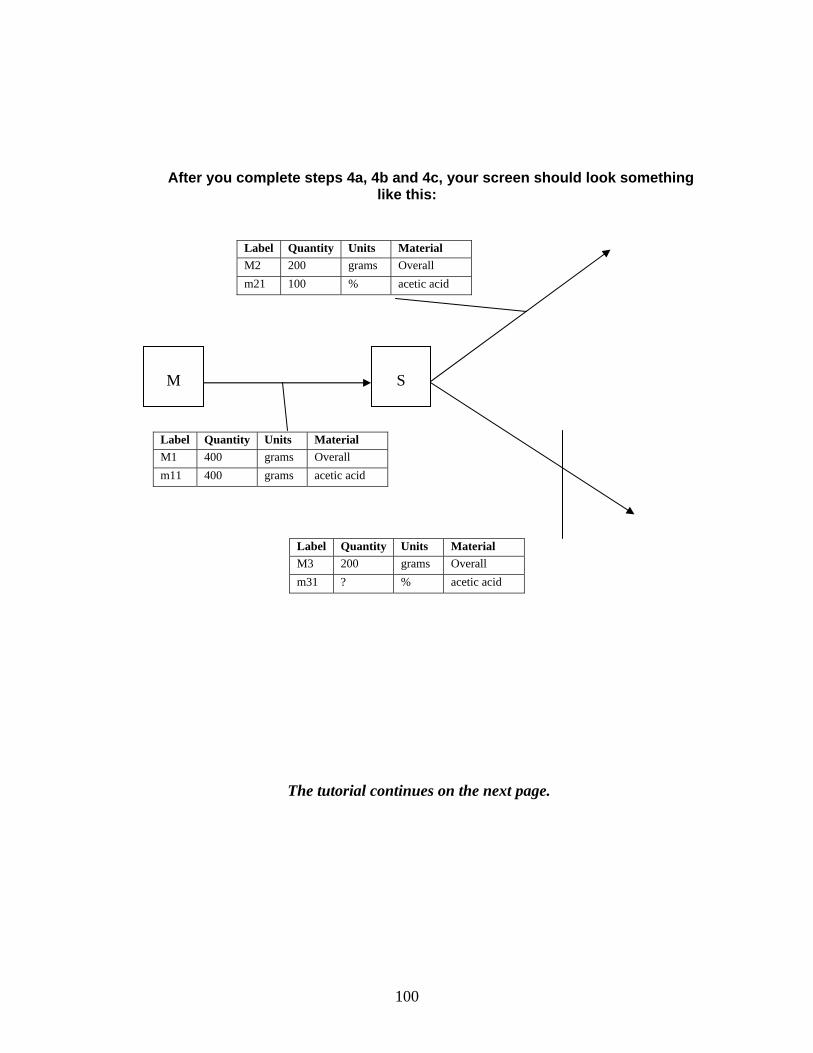
After you complete steps 4a, 4b and 4c, your screen should look something like this:
Label Quantity Units Material M2 200 grams Overall m21 100 % acetic acid
Label Quantity Units Material M1 400 grams Overall m11 400 grams acetic acid
Label Quantity Units Material M3 200 grams Overall m31 ? % acetic acid
S
M
The tutorial continues on the next page.
100
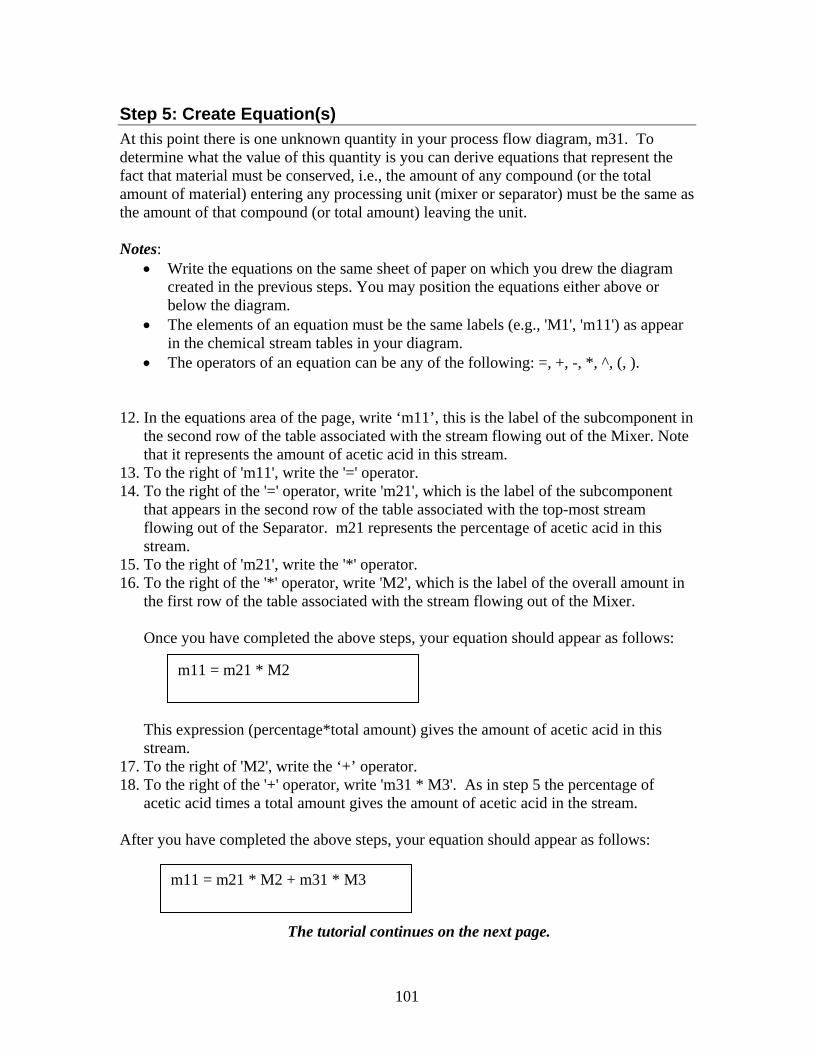
Step 5: Create Equation(s) At this point there is one unknown quantity in your process flow diagram, m31. To determine what the value of this quantity is you can derive equations that represent the fact that material must be conserved, i.e., the amount of any compound (or the total amount of material) entering any processing unit (mixer or separator) must be the same as the amount of that compound (or total amount) leaving the unit. Notes:
• Write the equations on the same sheet of paper on which you drew the diagram created in the previous steps. You may position the equations either above or below the diagram.
• The elements of an equation must be the same labels (e.g., 'M1', 'm11') as appear in the chemical stream tables in your diagram.
• The operators of an equation can be any of the following: =, +, -, *, ^, (, ). 12. In the equations area of the page, write ‘m11’, this is the label of the subcomponent in
the second row of the table associated with the stream flowing out of the Mixer. Note that it represents the amount of acetic acid in this stream.
13. To the right of 'm11', write the '=' operator. 14. To the right of the '=' operator, write 'm21', which is the label of the subcomponent
that appears in the second row of the table associated with the top-most stream flowing out of the Separator. m21 represents the percentage of acetic acid in this stream.
15. To the right of 'm21', write the '*' operator. 16. To the right of the '*' operator, write 'M2', which is the label of the overall amount in
the first row of the table associated with the stream flowing out of the Mixer.
Once you have completed the above steps, your equation should appear as follows:
This expression (percentage*total amount) gives the amount of acetic acid in this stream.
m11 = m21 * M2
17. To the right of 'M2', write the ‘+’ operator. 18. To the right of the '+' operator, write 'm31 * M3'. As in step 5 the percentage of
acetic acid times a total amount gives the amount of acetic acid in the stream. After you have completed the above steps, your equation should appear as follows:
m11 = m21 * M2 + m31 * M3
The tutorial continues on the next page.
101

You now have built a valid equation related to the material balance diagram you created in previous steps. Your final page should look something like this:
Label Quantity Units Material M2 200 grams Overall m21 100 % acetic acid
Label Quantity Units Material M1 400 grams Overall m11 400 grams acetic acid
Label Quantity Units Material M3 200 grams Overall m31 ? % acetic acid
S
M
1. m11 = m21
With one equation and one unkof the one unknown. Congratulations! You are donpaper and work through the tu
but do not go beyond t
Equations
* M2 + m31 * M3
nown you could solve the equation to calculate the value
e with this tutorial. If time still remains, take a new sheet of torial again. Please work on the tutorial until time is called,
his page of the booklet until you are asked to do so.
102

A6. EXIT QUESTIONNAIRE
Version CP
(Please do not work on this until you are instructed to do so)
TURN PAGE TO START WORKING
103
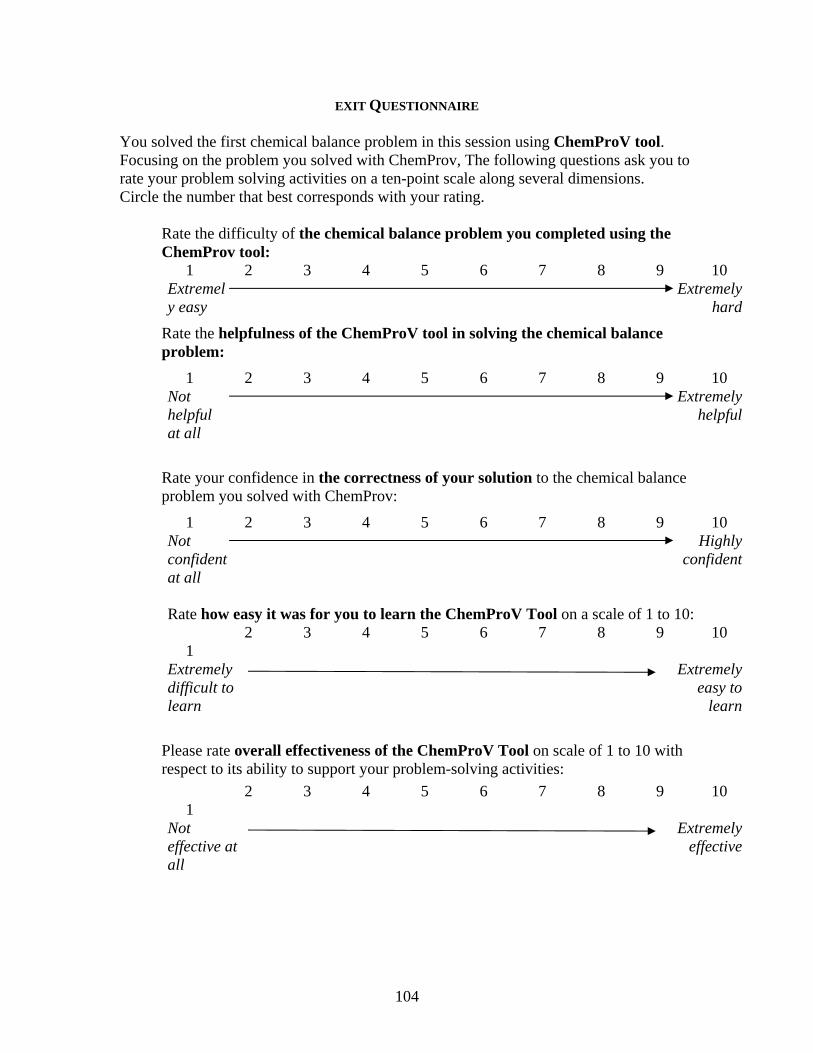
EXIT QUESTIONNAIRE
You solved the first chemical balance problem in this session using ChemProV tool. Focusing on the problem you solved with ChemProv, The following questions ask you to rate your problem solving activities on a ten-point scale along several dimensions. Circle the number that best corresponds with your rating.
Rate the difficulty of the chemical balance problem you completed using the ChemProv tool:
1 2 3 4 5 6 7 8 9 10 Extremely easy
Extremely hard
Rate the helpfulness of the ChemProV tool in solving the chemical balance problem:
1 2 3 4 5 6 7 8 9 10 Not helpful at all
Extremely helpful
Rate your confidence in the correctness of your solution to the chemical balance problem you solved with ChemProv:
1 2 3 4 5 6 7 8 9 10 Not confident at all
Highly confident
Rate how easy it was for you to learn the ChemProV Tool on a scale of 1 to 10:
1
2 3 4 5 6 7 8 9 10
Extremely difficult to learn
Extremely easy to
learn
Please rate overall effectiveness of the ChemProV Tool on scale of 1 to 10 with respect to its ability to support your problem-solving activities:
1 2 3 4 5 6 7 8 9 10
Not effective at all
Extremely effective
104
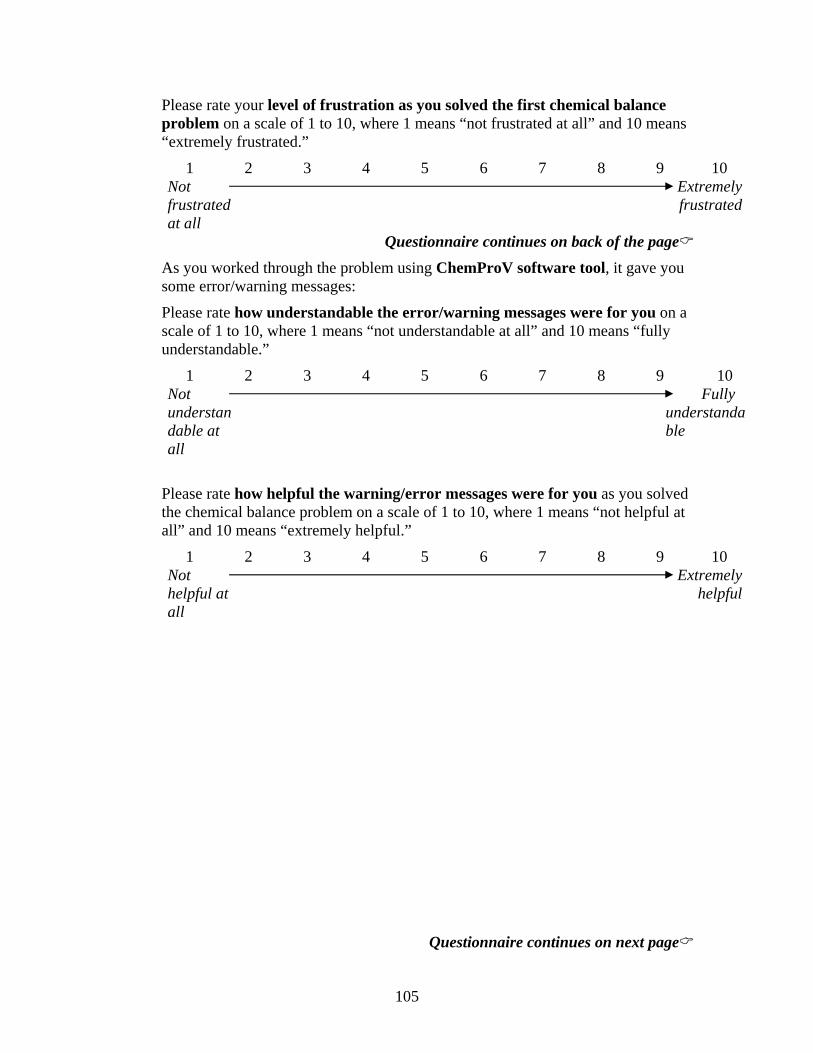
Please rate your level of frustration as you solved the first chemical balance problem on a scale of 1 to 10, where 1 means “not frustrated at all” and 10 means “extremely frustrated.”
1 2 3 4 5 6 7 8 9 10 Not frustrated at all
Extremely frustrated
Questionnaire continues on back of the page As you worked through the problem using ChemProV software tool, it gave you some error/warning messages:
Please rate how understandable the error/warning messages were for you on a scale of 1 to 10, where 1 means “not understandable at all” and 10 means “fully understandable.”
1 2 3 4 5 6 7 8 9 10 Not understandable at all
Fully understandable
Please rate how helpful the warning/error messages were for you as you solved the chemical balance problem on a scale of 1 to 10, where 1 means “not helpful at all” and 10 means “extremely helpful.”
1 2 3 4 5 6 7 8 9 10 Not helpful at all
Extremely helpful
Questionnaire continues on next page
105
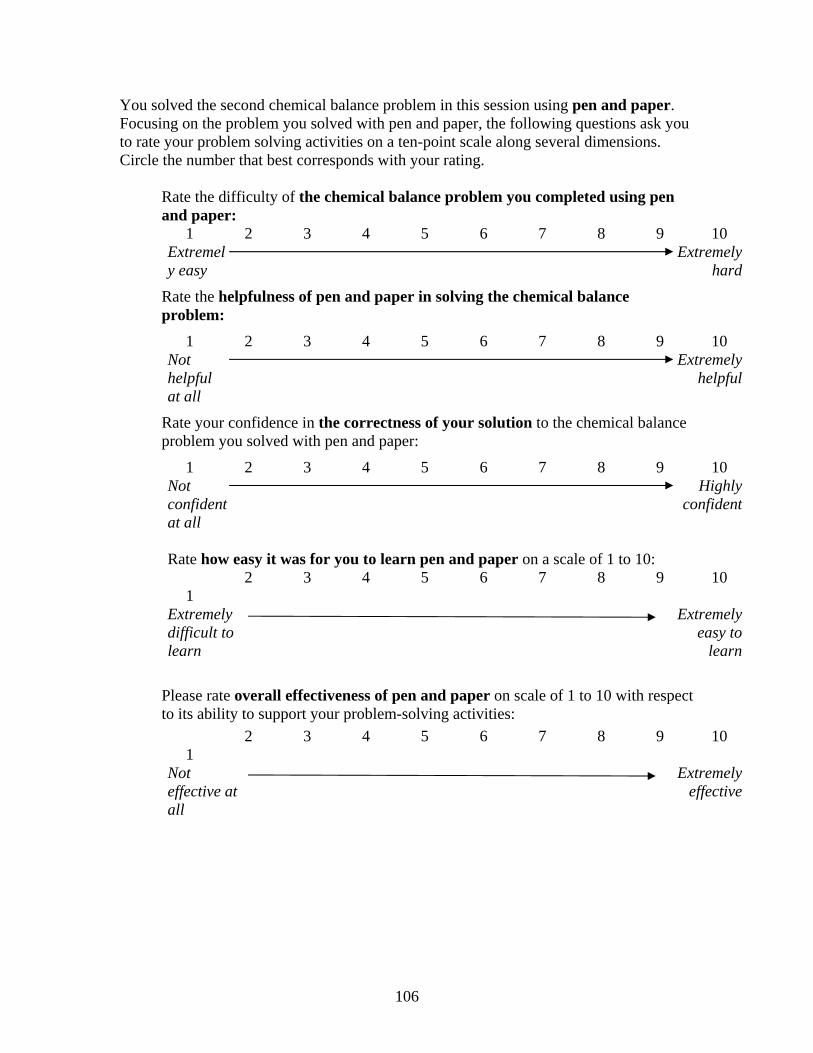
You solved the second chemical balance problem in this session using pen and paper. Focusing on the problem you solved with pen and paper, the following questions ask you to rate your problem solving activities on a ten-point scale along several dimensions. Circle the number that best corresponds with your rating.
Rate the difficulty of the chemical balance problem you completed using pen and paper:
1 2 3 4 5 6 7 8 9 10 Extremely easy
Extremely hard
Rate the helpfulness of pen and paper in solving the chemical balance problem:
1 2 3 4 5 6 7 8 9 10 Not helpful at all
Extremely helpful
Rate your confidence in the correctness of your solution to the chemical balance problem you solved with pen and paper:
1 2 3 4 5 6 7 8 9 10 Not confident at all
Highly confident
Rate how easy it was for you to learn pen and paper on a scale of 1 to 10:
1
2 3 4 5 6 7 8 9 10
Extremely difficult to learn
Extremely easy to
learn
Please rate overall effectiveness of pen and paper on scale of 1 to 10 with respect to its ability to support your problem-solving activities:
1 2 3 4 5 6 7 8 9 10
Not effective at all
Extremely effective
106
Please rate your level of frustration as you solved the second chemical balance problem on a scale of 1 to 10, where 1 means “not frustrated at all” and 10 means “extremely frustrated.”
1 2 3 4 5 6 7 8 9 10 Not frustrated at all
Extremely frustrated
Questionnaire continues on back of page
107

1. Was there anything in particular that you had difficulty with in this session? If so, please elaborate.
2. If you have any general comments or concerns about this session, or suggestions for how to make it better, please write them below.
Congratulations! You are done with the questionnaire.
108