the design and manufacture of a glass fibre …
TRANSCRIPT

University of Plymouth
PEARL https://pearl.plymouth.ac.uk
04 University of Plymouth Research Theses 01 Research Theses Main Collection
2019
The Design and Manufacture of a Glass
Fibre Reinforced Polymer (GFRP)
Bolted Flange Joint for Oil and Gas
Applications
Aljuboury, Muhsin Ali Marie
http://hdl.handle.net/10026.1/13659
University of Plymouth
All content in PEARL is protected by copyright law. Author manuscripts are made available in accordance with
publisher policies. Please cite only the published version using the details provided on the item record or
document. In the absence of an open licence (e.g. Creative Commons), permissions for further reuse of content
should be sought from the publisher or author.

by
MUHSIN ALI MARIE ALJUBOURY
THE DESIGN AND MANUFACTURE OF A GLASS
FIBRE REINFORCED POLYMER (GFRP) BOLTED
FLANGE JOINT FOR OIL AND GAS
APPLICATIONS
A thesis submitted to the University of Plymouth in partial
fulfilment for the degree of
DOCTOR OF PHILOSOPHY
School of Engineering
University of Plymouth
April 2019

Copyright@2019 Muhsin Ali Marie Aljuboury
This copy of the thesis has been supplied on condition that anyone who
consults it is understood to recognize that its copyright rests with its author
and that no quotation from the thesis and no information derived from it
may be published without the author's prior consent.

iii
Abstract
Metallic bolted flange and pipes both have been increasingly replaced by fibre
reinforced polymer (FRP) materials in many applications which deal with extreme
harsh environments such as oil, gas, marine, chemical etc. However, only a handful
of research works have been conducted regarding the bolted flange joint (BFJ) made
of FRP materials. Also, the availabilities of standards and codes are very limited for
the composite BFJ. Hence, the design guidelines for fabrication methods and
dimensional considerations of bolted FRP flange are yet to be optimised fully. For
instance, the ASME Boiler and Pressure Vessel Code, Section X, does not include
specific rules for the design of bolted FRP flange joints. As a result, it is difficult to
understand the consequences of the reliability of FRP flanges made with parametric
variations and dimensional alterations.
Therefore, the current research aims to produce a bolted GFRP flange joint with high
performance through a series of experimentations and numerical simulations. A
mould has been designed and manufactured using aluminium, glass, O-ring gasket
and bolts. The bolted GFRP flanges have been fabricated using vacuum infusion
process, polyester and fibreglass braid sleeves. Various experiments were conducted
to solve the faced issues during the manufacturing process. Several experiments were
carried out with different strain gauges to measure the bolt load. The GFRP flange
has been assembled with other required components to produce the pressure vessel
and tested under various bolt and internal pressure loads using different gaskets
(Nitrile and Viton), which are suitable for the oil and the gas applications.
Numerically, finite element analysis (FEA) of the BFJ comprised of composite
flange and pipe, flange-pipe adhesive bonding, gasket and fastener has been
conducted using ANSYS Mechanical. The FEA has been performed considering the
orthotropic properties of the composite materials and the non-linearity behaviour of
the rubber gasket. The FEA also includes the simulation of the fluid pressure
penetration (FPP) between the flange and the gasket using the contact element real
constant criterion (PPNC). Furthermore, another FEA model has been developed for
a metal flange using the same boundary conditions as the GFRP flange. This flange
has been investigated experimentally and numerically in published work [1]. The
agreements between the obtained results and the previous results are excellent. This
confirms the validity of the FEA performed in this project.

iv
The BFJ has been tested under various bolt and internal pressure loads
experimentally and numerically and the strains in three directions (axial, hoop and
radial) have been measured and calculated. The obtained results show that the
influence of the bolt load is higher than the pressure load and the leakage pressure
increases with increasing the bolt load. The effects of the flange dimensions on the
maximum axial, hoop and radial strains, axial displacement, flange rotation and
leakage pressure have been investigated using the FEA. The dimensions considered
are the flange outer diameter and thickness, hub length and thickness. Most of the
flange joint dimensions (within the selected range) have a small effect on the results
and that confirms that the flange dimensions should be reduced to save the materials
cost. The current flange is very strong and this is due to the good selection of the
materials, fabric structure and the fabrication process, which gives high fibre content.
In addition, the results show that the gasket materials and thickness has very small
influences on the flange strains, axial displacement and rotation. The leakage
pressure is affected by the gasket materials more than the thickness.

v
Acknowledgements
First of all, I would like to express my sincere gratitude to my supervisors, Md Jahir
Rizvi, Stephen Grove and Richard Cullen, School of Engineering at Plymouth
University, for their assistance, encouragement, guidance, criticism and support
throughout the present research project. I am also grateful to them for allowing me to
develop my own ideas.
I dedicate this PhD work to my lovely wife Marwa Aljuboury for her unceasing
encouragement, support and attention, my mother the most important person in my
life and my kids Adam and Mawa for providing a balance in my life, which made
this PhD work easier.
I take this opportunity to express gratitude to all of the members of staff at
University of Plymouth, who directly or indirectly, have lent their hands in this PhD
study, especially the technicians team, Terry Richards, Zoltan Gombos, Mike
Sloman, Neil Fewings, Rick Preston, Julian Seipp and Sam Thorpe who provided
the technical supports.
Special thanks must be given to Casper Kruger of Pipex px® for supplying some of
the materials and technical advices. Also, I would like to thank Keith Lawrence at
Vishay Measurements Group UK Ltd and Andrew Ramage at Techni Measure for
their technical supports.
I have to express my gratitude to the Higher Committee for Education Development
(HCED) in Iraq, who provided all the financial supports for my stays in Plymouth and
study expenses.
I am also grateful to the anonymous referees for their respective comments on the
manuscripts of journal and conference papers.
Finally, I want to express now my most sincere thanks to all who contributed to the
development of this thesis during the last four years.

vi
Author's declaration
At no time during the registration for the degree of Doctor of Philosophy has the
author been registered for any other University award without prior agreement of the
Doctoral College Quality Sub-Committee.
Work submitted for this research degree at the University of Plymouth has not
formed part of any other degree either at the University of Plymouth or at another
establishment.
This PhD study was financed with the aid of a scholarship from the Higher
Committee for Education Development (HCED) in Iraq.
Paper presentations were given at relevant conferences and several papers have been
published.
Word count of the thesis: 55,931 words
Figure count of the thesis: 165 figures
Table count of the thesis: 11 tables
External Contacts:
Email: [email protected] or [email protected]
Researchgate: https://www.researchgate.net/profile/Muhsin_Aljuboury
Linkedin: https://www.linkedin.com/in/muhsin-aljuboury-730458111/
ORCID: https://orcid.org/0000-0002-7300-3056
Signed…………………….…………………………..
Date………….... 1st April 2019 ..….………………..
vii
List of contents:
Abstract .................................................................................................................. iii
Acknowledgements .................................................................................................. v
Author's declaration ................................................................................................ vi
List of contents: ...................................................................................................... vii
List of figures: ....................................................................................................... xiv
List of tables: ...................................................................................................... xxiii
Nomenclature: ..................................................................................................... xxiv
1.1 Introduction ................................................................................................... 1
1.2 Motivation of the research ............................................................................. 3
1.3 Methodology ................................................................................................. 4
1.4 Structure of the thesis .................................................................................... 6
1.5 Outline of the research .................................................................................. 7
1.6 Skills development training attended ............................................................ 8
1.7 Publications work from this PhD work ......................................................... 9
1.7.1 Submitted journal articles .................................................................... 10
2.1 Introduction ................................................................................................. 11
2.2 Overview of metallic bolted flange joints ................................................... 12
2.3 Overview of composite bolted flange joints ................................................ 16
2.3.1 Materials system................................................................................... 16
2.3.2 Fibres reinforcement ............................................................................ 18
2.3.3 Manufacturing techniques of bolted GFRP flange............................... 19
2.3.4 Use of Braided fabric ........................................................................... 21
2.4 Performance of metallic bolted flange joints............................................... 23
2.4.1 Effects of nominal flange diameter ...................................................... 24

viii
2.4.2 Effects of flange thickness ................................................................... 24
2.4.3 Effects of hub thickness ....................................................................... 25
2.4.4 Effects of hub length ............................................................................ 25
2.4.5 Effects of flange rotation ..................................................................... 25
2.4.6 Effects of thermal loading .................................................................... 26
2.4.7 Effects of material’s stiffness ............................................................... 27
2.4.8 Effects of bolt preload .......................................................................... 27
2.4.9 Effects of bolt spacing ......................................................................... 28
2.4.10 2D Axisymmetric and 3D FE modelling of the flange ........................ 28
2.4.11 Considerations for FRP flanges ........................................................... 29
2.5 Published research on Composite flange joints........................................... 29
2.6 Research gap and justification of the project .............................................. 31
2.7 History of standards development ............................................................... 33
2.8 Compressed gaskets .................................................................................... 34
2.8.1 Metallic gaskets ................................................................................... 34
2.8.2 Semi-metallic gaskets .......................................................................... 36
2.8.3 Non-metallic gaskets ............................................................................ 39
2.9 The characteristics composite pipes commonly used with flanges ............. 40
2.10 Co-bonding of composite flange with composite pipe ............................ 42
2.11 Fasteners of flange joint .......................................................................... 45
2.12 Issues with drilling of composite materials ............................................. 47
2.13 Summary .................................................................................................. 52
3.1 Introduction ................................................................................................. 53
3.2 Design variables .......................................................................................... 54
3.2.1 Flange dimensions ............................................................................... 55
3.2.2 Hub dimensions ................................................................................... 55

ix
3.2.3 Gasket material and thickness .............................................................. 55
3.2.4 Bolt load ............................................................................................... 55
3.2.5 Internal fluid pressure .......................................................................... 56
3.3 Design constants .......................................................................................... 56
3.4 Analytical design analysis (based on the ASME code) ............................... 57
3.4.1 Full face flange geometry..................................................................... 57
3.4.2 Gasket loads ......................................................................................... 58
3.4.3 Flange loads ......................................................................................... 59
3.4.4 Gasket seating (Bolt up) conditions ..................................................... 60
3.4.5 Operating conditions ............................................................................ 62
3.4.6 Flange stresses calculations.................................................................. 65
3.5 Design loads ................................................................................................ 66
3.6 Summary ..................................................................................................... 66
4.1 Introduction ................................................................................................. 67
4.2 Mould design ............................................................................................... 68
4.2.1 Mandrel ................................................................................................ 68
4.2.2 Plate ...................................................................................................... 69
4.2.3 The mould assembly ............................................................................ 70
4.3 GFRP Flange fabrication ............................................................................. 70
4.4 Issues with the manufacturing process ........................................................ 75
4.4.1 Resin flow problem .............................................................................. 75
4.4.2 Voids and cracks problem .................................................................... 76
4.5 Solving the issues ........................................................................................ 77
4.5.1 Inlet and outlet positions ...................................................................... 77
4.5.2 Resin Viscosity .................................................................................... 81
4.6 Composite flange drilling ............................................................................ 83

x
4.7 Flange-pipe adhesive bonding ..................................................................... 86
4.8 Other end of the pipe ................................................................................... 88
4.9 Blind flanges ............................................................................................... 88
4.10 Assembly of the joint components .......................................................... 89
4.11 Summary .................................................................................................. 90
5.1 Introduction ................................................................................................. 91
5.2 Materials characterisations .......................................................................... 92
5.2.1 Fibre volume fraction (Vf) ................................................................... 92
5.2.2 Fibre orientation (Braiding angle) ....................................................... 93
5.2.3 Fibre orientation (Crimp angle) ........................................................... 95
5.3 Autodesk Helius composite validation ........................................................ 96
5.4 Flange-Gasket friction ................................................................................. 98
5.5 Data measuring equipment ........................................................................ 100
5.5.1 Strain indicators and recorders........................................................... 100
5.5.2 Composite flange strain gauges ......................................................... 101
5.5.3 Bolt strain gauges ............................................................................... 101
5.6 Construction of the test rig ........................................................................ 110
5.6.1 Digital torque wrench ........................................................................ 110
5.6.2 Fittings ............................................................................................... 110
5.6.3 Pump test ............................................................................................ 110
5.6.4 Pressure Gauges ................................................................................. 110
5.7 Testing procedure ...................................................................................... 111
5.8 Summary ................................................................................................... 112
6.1 Introduction ............................................................................................... 113
6.2 FEA model of bolted GFRP flange joint ................................................... 114

xi
6.2.1 Geometry and the dimensions of the flange joint .............................. 114
6.2.2 GFRP flange simulation ..................................................................... 116
6.2.3 Filament winding pipe modelling ...................................................... 118
6.2.4 Bonded flange-pipe modelling ........................................................... 118
6.2.5 Fasteners modelling ........................................................................... 118
6.2.6 Modelling the rubber gasket............................................................... 119
6.2.7 Elements selection and contact interfaces .......................................... 122
6.2.8 Boundary and loading conditions....................................................... 123
6.3 Summary ................................................................................................... 126
7.1 Introduction ............................................................................................... 127
7.2 Experimental validation ............................................................................ 128
7.2.1 Bolt up condition ................................................................................ 129
7.2.2 Operating conditions .......................................................................... 133
7.3 Numerical validation ................................................................................. 151
7.3.1 Metallic flange joint geometry and material properties ..................... 151
7.3.2 3D CAD model .................................................................................. 152
7.3.3 2D FEA axisymmetric models ........................................................... 154
7.3.4 Simulation results ............................................................................... 155
7.4 Summary ................................................................................................... 158
8.1 Introduction ............................................................................................... 159
8.2 ASME code predictions ............................................................................. 160
8.3 Bolted flange joint deformation ................................................................ 162
8.4 Flange diameter effect ............................................................................... 162
8.5 Flange thickness effect .............................................................................. 172
8.6 Hub length effect ....................................................................................... 177

xii
8.7 Hub thickness effect .................................................................................. 182
8.8 Comparison of design variables effect ...................................................... 187
8.9 Flange axial displacement ......................................................................... 188
8.9.1 Axial displacement vs hoop angle ...................................................... 189
8.9.2 Axial displacement vs radial distance................................................ 191
8.10 Flange rotation ....................................................................................... 194
8.11 Leakage pressure ................................................................................... 197
8.11.1 Leakage pressure vs flange diameter ................................................. 197
8.11.2 Leakage pressure vs flange thickness ................................................ 199
8.11.3 Leakage pressure vs hub length ......................................................... 201
8.11.4 Leakage pressure vs hub thickness .................................................... 203
8.12 Results contribution ............................................................................... 204
8.13 Summary ................................................................................................ 206
9.1 Conclusions ............................................................................................... 207
9.1.1 Composite flange standards or design codes ..................................... 207
9.1.2 Manufacturing of the GFRP flange.................................................... 208
9.1.3 Bolted GFRP flange testing ............................................................... 208
9.1.4 FEA model of GFRP flange joint ...................................................... 209
9.1.5 Validation of results ........................................................................... 209
9.1.6 Effect of the applied loads ................................................................. 210
9.1.7 Effect of the flange dimensions ......................................................... 210
9.1.8 Effect of the gasket materials and thickness ...................................... 210
9.2 Recommendations for future work ............................................................ 211
Appendix (A): Helius composite validation properties of the composite properties
.............................................................................................................................. 213

xiii
Appendix (B): Calibration of the strain indicators and recorder (P3’s) ............... 215
Appendix (C): Calibration of the digital torque adaptor ...................................... 217
Appendix (D): Calibration of the pressure gauge ................................................ 218

xiv
List of figures:
Fig. 1.1: The flow chart of the project ......................................................................... 7
Fig. 2.1: Bolted flange (a) Full face gasket flange (b) Ring type joint
(c) Flat ring gasket flange .......................................................................................... 13
Fig. 2.2: Metallic flange (a) Raised face flange (b) Tongue and groove flange ........ 15
Fig. 2.3: Vacuum bagging process ............................................................................. 21
Fig. 2.4: Mandrel over-braiding ................................................................................. 21
Fig. 2.5: Circular braiding around a complex shape .................................................. 22
Fig. 2.6: Flange failure at the flange neck ................................................................. 22
Fig. 2.7: Loading analysis of the flange ..................................................................... 23
Fig. 2.8: Metallic gaskets (a) Ring joint gasket (b) Lens ring gasket (c) Corrugated
gasket ......................................................................................................................... 35
Fig. 2.9: Semi-metallic gaskets (a) Spiral wound gasket (b) Metal jacketed gasket (c)
Kammprofile gasket ................................................................................................... 38
Fig. 2.10: Three different types of flange-pipe adhesive bonded joint ...................... 43
Fig. 2.11: Delamination (a) Peel-up delamination (b) Push-out delamination .......... 47
Fig. 2.12: (a) Helical flute ‘‘Stub Length’’ K10 drill; (b) ‘‘Brad & Spur’’ K10 drill 50
Fig. 2.13: Drills used in the experimental work: (a) EDP27199, (b) A1141, (c)
A1163 and (d) A1167A ............................................................................................. 50
Fig. 2.14: Photographs for various step-core drills .................................................... 51
Fig. 3.1: Schematic diagram of the flange joint ......................................................... 54
Fig. 3.2: FFG Flange geometry .................................................................................. 57
Fig. 3.3: Flange under gasket seating conditions ....................................................... 61
Fig. 3.4: Flange under operating conditions .............................................................. 63

xv
Fig. 4.1: The mandrel ................................................................................................. 69
Fig. 4.2: The glass plate ............................................................................................. 69
Fig. 4.3: The Mould of the composite flange ............................................................. 70
Fig. 4.4: Schematic diagram of the vacuum infusion process.................................... 71
Fig. 4.5: Common failure on the GFRP flanges [34] ................................................. 72
Fig. 4.6: Laid braided fiberglass fabric on the mandrel and the plate ........................ 73
Fig. 4.7: Diffusion mesh distribution ......................................................................... 74
Fig. 4.8: Bagging and resin infusion .......................................................................... 74
Fig. 4.9: Machining of the composite flange ............................................................. 75
Fig. 4.10: Flange with dry regions on the face ........................................................... 76
Fig. 4.11: Microscopy image for the flange-hub intersection .................................... 77
Fig. 4.12: Glass mould of the experiments ................................................................ 78
Fig. 4.13: The vacuum infusion process of the experiments...................................... 78
Fig. 4.14: Inlet & outlet positions of the conducted experiments .............................. 79
Fig. 4.15: Flange without dry fabric on the face ........................................................ 79
Fig. 4.16: Microscope images at the flange-hub intersection (a) model A, (b) model
B, (c) model C. ........................................................................................................... 80
Fig. 4.17: Thermocouple position in the flange-hub intersection .............................. 81
Fig. 4.18: The temperature variation during the infusion and curing process at the
flange-hub intersection ............................................................................................... 81
Fig. 4.19: The variation of the polyester viscosity with the time at different
temperature (without catalyst).................................................................................... 82
Fig. 4.20: The variation of the polyester viscosity with the time at different
temperature (1% catalyst) .......................................................................................... 83
Fig. 4.21: Drilling tools of the composite .................................................................. 84

xvi
Fig. 4.22: 22 mm drilled holes of used tools in the experimental work .................... 85
Fig. 4.23: Drilled holes with different speeds ............................................................ 86
Fig. 4.24: During the drilled and the final GFRP flange ........................................... 86
Fig. 4.25: Chamfering the composite pipe ................................................................. 87
Fig. 4.26: Flange-pipe bonding .................................................................................. 87
Fig. 4.27: HD and blind flanges: (a) Acrylic blind flange attached to the fabricated
flange and (b) HD and steel blind flange attached to the HD flange. ........................ 89
Fig. 4.28: Schematic diagram of the pressure vessel ................................................. 89
Fig. 5.1: Composite samples for calculating the Vf ................................................... 93
Fig. 5.2: Braiding angle of the flange disc and the hub ............................................. 94
Fig. 5.3: Filament-winding angle of the composite pipe ........................................... 94
Fig. 5.4: Microscope picture of the crimp angle ........................................................ 95
Fig. 5.5: Calculated orientation distribution factor for a plain weave
tow with varying crimp angle .................................................................................... 96
Fig. 5.6: Composite laminate (a) under the vacuum (b) samples of the test .............. 97
Fig. 5.7: Illustration of the 3-points bending test ....................................................... 97
Fig. 5.8: Inclined plane friction tester ........................................................................ 99
Fig. 5.9: Relationships of ramp weight components.................................................. 99
Fig. 5.10: Strain indicator and recorder ................................................................... 100
Fig. 5.11: The strain gauges set up on the composite flange body .......................... 101
Fig. 5.12: Bolts with two strain gauges bonded on the shank .................................. 102
Fig. 5.13: Quarter Bridge with two gauges connected in series method [106] ........ 103
Fig. 5.14: Bolts with embedded strain gauges ......................................................... 104
Fig. 5.15: Holding attachment for the bolt testing ................................................... 105
Fig. 5.16: Tensile test data of the bolt SSG1 ........................................................... 106

xvii
Fig. 5.17: Tensile test data of the bolt SSG2 ........................................................... 107
Fig. 5.18: Tensile test data of the bolt CSG1 ........................................................... 107
Fig. 5.19: Tensile test data of the bolt CSG2 ........................................................... 108
Fig. 5.20: Comparison of the tensile test data of all the bolts .................................. 109
Fig. 5.21: Comparison of the tensile test data of the CSG bolts .............................. 109
Fig. 5.22: Bolt tightening diagram [108] ................................................................. 111
Fig. 6.1: Symmetric of the bolted flange joint ......................................................... 115
Fig. 6.2: 3D FEA model of the bolted flange joint .................................................. 115
Fig. 6.3: Dimensions of the bolted flange joint (mm) .............................................. 116
Fig. 6.4: Fastener modelling .................................................................................... 119
Fig. 6.5: Characteristics of the Nitrile gasket obtained experimentally ................... 120
Fig. 6.6: Characteristics of the Viton gasket obtained experimentally .................... 120
Fig. 6.7: Boundary conditions during the bolt-up and the operating conditions ..... 124
Fig. 6.8: Schematic diagram of the fluid pressure penetration modelling ............... 125
Fig. 7.1: FEA model ................................................................................................. 129
Fig. 7.2: Pressure vessel during the test ................................................................... 129
Fig. 7.3: Hub axial strain, µε .................................................................................... 131
Fig. 7.4: Hub hoop strain, µε ................................................................................... 132
Fig. 7.5: Flange hoop strain, µε................................................................................ 133
Fig. 7.6: Axial strain, µε (top-left) ........................................................................... 135
Fig. 7.7: Axial strain, µε (top-right) ......................................................................... 135
Fig. 7.8: Axial strain, µε (bottom-left) ..................................................................... 136
Fig. 7.9: Axial strain, µε (bottom-right) ................................................................... 137
Fig. 7.10: Hoop strain, µε (top-left) ......................................................................... 138
Fig. 7.11: Hoop strain, µε (top-right) ....................................................................... 139

xviii
Fig. 7.12: Hoop strain, µε (bottom-left) ................................................................... 140
Fig. 7.13: Hoop strain, µε (bottom-right) ................................................................ 140
Fig. 7.14: Flange hoop strain, µε ............................................................................. 141
Fig. 7.15: Flange radial strain, µε, (bolt centre) ....................................................... 143
Fig. 7.16: Flange radial strain, µε, (mid-point) ........................................................ 144
Fig. 7.17: Bolt axial strain, µε.................................................................................. 145
Fig. 7.18: Bolt axial stress, MPa .............................................................................. 145
Fig. 7.19: Distribution of contact pressure on gasket .............................................. 147
Fig. 7.20: Leakage propagation with the internal pressure up to leakage pressure . 148
Fig. 7.21: Leakage pressure variation of Flange-Nitrile gasket with the bolt load .. 149
Fig. 7.22: Leakage pressure variation of Flange-Viton gasket with the bolt load ... 150
Fig. 7.23: Bolted flange joint (All dimensions in mm) ............................................ 151
Fig. 7.24: (a) 3D model flange joint with mesh (b) Boundary conditions ............... 153
Fig. 7.25: (a) 2D FEA model flange joint with mesh (b) Boundary conditions ...... 154
Fig. 7.26: Flange hub stress variation with the internal pressure up to leakage point
.................................................................................................................................. 155
Fig. 7.27: Fluid pressure penetration of the 3D FEA (a) Internal pressure 2 MPa (b)
Internal pressure 8 MPa (c) Internal pressure 14.05 MPa (Leakage point) ............. 156
Fig. 7.28: Fluid pressure penetration of the 2D FEA (a) Internal pressure 2 MPa (b)
Internal pressure 8 MPa (c) Internal pressure 13.87 MPa (Leakage point) ............. 157
Fig. 7.29: Variation of the leakage pressure with the bolt load for the 2D and 3D
FEA .......................................................................................................................... 157
Fig. 8.1: Total deformation of the bolted flange joint.............................................. 162
Fig. 8.2: Axial strain (mm/mm) ............................................................................... 164

xix
Fig. 8.3: Maximum axial tensile strain (µε) variation with the flange diameter for
range of gasket types and thickness ......................................................................... 164
Fig. 8.4: Maximum axial tensile strain (µε) variation with the bolt load and internal
pressure for range of the flange diameter ................................................................. 165
Fig. 8.5: Maximum axial compression strain (µε) variation with the flange diameter
for range of gasket types and thickness ................................................................... 167
Fig. 8.6: Hoop strain (mm/mm) ............................................................................... 168
Fig. 8.7: Maximum hoop strain (µε) variation with the flange diameter for range of
gasket types and thickness ....................................................................................... 168
Fig. 8.8: Radial strain (mm/mm) .............................................................................. 170
Fig. 8.9: Maximum radial strain (µε) variation with the flange diameter for range of
gasket types and thickness ....................................................................................... 170
Fig. 8.10: Bolt axial strain (µε) ................................................................................ 171
Fig. 8.11: Bolt axial strain (µε) variation with the flange diameter for range of gasket
types and thickness ................................................................................................... 171
Fig. 8.12: Maximum axial tensile strain (µε) variation with the flange thickness for
range of gasket types and thickness ......................................................................... 172
Fig. 8.13: Maximum axial compression strain (µε) variation with the flange
thickness for range of gasket types and thickness .................................................... 173
Fig. 8.14: Maximum axial compression strain (µε) variation with the bolt load and
the internal pressure for range of the flange thickness ............................................. 174
Fig. 8.15: Maximum hoop strain (µε) variation with the flange thickness for range of
gasket types and thickness ....................................................................................... 175
Fig. 8.16: Maximum radial strain (µε) variation with the flange thickness for range
of gasket types and thickness ................................................................................... 176

xx
Fig. 8.17: Bolt axial strain (µε) variation with the flange thickness for range of
gasket types and thickness ....................................................................................... 177
Fig. 8.18: Maximum axial tensile strain (µε) variation with the hub length for range
of gasket types and thickness ................................................................................... 178
Fig. 8.19: Maximum axial compression strain (µε) variation with the hub length for
range of gasket types and thickness ......................................................................... 179
Fig. 8.20: Maximum hoop strain (µε) variation with the hub length for range of
gasket types and thickness ....................................................................................... 179
Fig. 8.21: Maximum hoop strain (µε) variation with bolt load and internal pressure
for range of the hub length ....................................................................................... 180
Fig. 8.22: Maximum radial strain (µε) variation with the hub length for range of
gasket types and thickness ....................................................................................... 181
Fig. 8.23: Bolt axial strain (µε) variation with the hub length for range of gasket
types and thickness .................................................................................................. 182
Fig. 8.24: Maximum axial tensile strain (µε) variation with the hub thickness for
range of gasket types and thickness ......................................................................... 183
Fig. 8.25: Maximum axial compression strain (µε) variation with the hub thickness
for range of gasket types and thickness ................................................................... 184
Fig. 8.26: Maximum hoop strain (µε) variation with the hub thickness for range of
gasket types and thickness ....................................................................................... 185
Fig. 8.27: Maximum radial strain (µε) variation with the hub thickness for range of
gasket types and thickness ....................................................................................... 186
Fig. 8.28: Maximum radial strain (µε) variation with the bolt load and internal
pressure for range of the hub thickness .................................................................... 186

xxi
Fig. 8.29: Bolt axial strain (µε) variation with the hub thickness for range of gasket
types and thickness ................................................................................................... 187
Fig. 8.30: Flange axial displacement variation with the hoop angle at the inner and
outer diameters ......................................................................................................... 189
Fig. 8.31: Flange axial displacement variation with the hoop angle for range of the
bolt load, P 0 bar ...................................................................................................... 190
Fig. 8.32: Flange axial displacement variation with the hoop angle for range of the
internal pressure, BL7.4 kN ..................................................................................... 191
Fig. 8.33: Flange axial displacement variation with the radial distance at the right
and left edges............................................................................................................ 192
Fig. 8.34: Flange axial displacement variation with the radial distance at the right
edge for range of the bolt load ................................................................................. 192
Fig. 8.35: Flange axial displacement variation with the radial distance at the right
edge for range of the internal pressure ..................................................................... 193
Fig. 8.36: Schematic diagram of the flange bending ............................................... 194
Fig. 8.37: Flange rotation variation with the hoop distance for range of the bolt load
.................................................................................................................................. 195
Fig. 8.38: Flange rotation variation with the internal pressure for range of the bolt
load ........................................................................................................................... 196
Fig. 8.39: Flange rotation variation with the hoop a for range of the internal pressure
.................................................................................................................................. 196
Fig. 8.40: Leakage pressure variation with the flange diameter for different gasket
materials and thickness ............................................................................................ 197
Fig. 8.41: Contact pressure between the flange and the gasket ............................... 198

xxii
Fig. 8.42: Leakage pressure variation with the bolt load for different flange diameter
.................................................................................................................................. 199
Fig. 8.43: Leakage pressure variation with the flange thickness for range of the
gasket materials and thickness ................................................................................. 200
Fig. 8.44: Leakage pressure point ............................................................................ 200
Fig. 8.45: Leakage pressure variation with the bolt load for different flange thickness
.................................................................................................................................. 201
Fig. 8.46: Leakage pressure variation with the hub length for range of gasket
materials and thickness ............................................................................................ 202
Fig. 8.47: Leakage pressure variation with bolt load for different hub length ........ 202
Fig. 8.48: Leakage pressure variation with the hub thickness for various gasket
materials and thickness ............................................................................................ 203
Fig. 8.49: Leakage pressure variation with the bolt load for different hub thickness
.................................................................................................................................. 204
Fig. A.1: Design of GFRP lamina ............................................................................ 213
Fig. A.2: GFRP lamina properties ........................................................................... 213
Fig. A.3: Design of GFRP laminate ......................................................................... 214
Fig. A.4: 2D and 3D mechanical properties of the GFRP laminate ........................ 214
Fig. B.1: Calibration data of P3, SN 0161615 ......................................................... 215
Fig. B.2: Calibration data of P3, SN 0169299 ......................................................... 215
Fig. B.3: Calibration data of P3, SN 0170024 ......................................................... 216
Fig. B.4: Calibration data of P3, SN 0170060 ......................................................... 216
Fig. C.1: Calibration data of digital torque adaptor ................................................. 217
Fig. D.1: Calibration data of pressure gauge ........................................................... 218

xxiii
List of tables:
Table 2.1: The difference between composites materials and steel materials for 1 m
pipe in the marine environment.................................................................................. 32
Table 3.1: Gasket parameters for elastomers without fabric or high percent of
asbestos fibre .............................................................................................................. 58
Table 5.1: Fibre volume fraction experimental data .................................................. 93
Table 5.2: Comparison of the Young’s modulus for a composite laminate............... 98
Table 6.1: Mechanical properties of the glass fibre, polyester resin and the adhesive
.................................................................................................................................. 117
Table 6.2: Typical orthotropic mechanical properties of the flange and the pipe.... 117
Table 6.3: Compressive response of the Nitrile rubber gasket ................................ 121
Table 6.4: Compressive response of the Viton rubber gasket .................................. 121
Table 6.5: Shear modulus and transfer shear stiffness of the rubber gaskets .......... 122
Table 8.1: Stress values comparison for ASME code and FEA .............................. 161
Table 8.2: Summary of design variables and their effect on the maximum strains . 188

xxiv
Nomenclature:
BFJ Bolted flange joint
PRP Fibre reinforced polymers
GFRP Glass fibre reinforced polymers
FEA Finite element analysis
Vf Fibre volume fraction
PPNC The contact element real constant criterion
G Diameter of gasket load reaction
B Inside diameter of flange
C Diameter of bolt circle
hG Radial distance from bolt circle to circle on which HG acts
B Inside diameter of flange
y Seating stress of the gasket
m Gasket factor
HG Difference between bolt load and hydrostatic end force
W Flange design bolt load
H Total hydrostatic end force
HD Hydrostatic end force on area inside of the flange
P Design internal pressure
hD Radial distance from bolt circle to circle on which HD acts
R Radial distance from outer edge of the hub to the bolt circle
g1 Thickness of hub at back of flange
HT Difference between total hydrostatic end force and the hydrostatic end force
area inside of flange
hT Radial distance from bolt circle to circle on which HT acts
Wm2 Minimum bolt loading for bolt-up conditions
Wm1 Minimum bolt loading for design conditions
HGy Bolt load for gasket yielding

xxv
𝑯𝑮𝒚′ Compression load required to seat gasket outside G diameter
b Effective gasket width or joint-contact-surface seating width
𝒉𝑮′ Radial distance from bolt circle to gasket load reaction
A Outside diameter of flange
A1 Minimum bolting area required for the operating conditions
A2 Minimum bolting area required for the bolt-up conditions
Am Total required cross-sectional area of bolts
AB Total cross-sectional area of bolts at root diameter of thread or section of
least diameter under stress
Sa Allowable bolt stress at ambient temperature
Sb Allowable bolt stress at design temperature
SFa Allowable flange stress at ambient temperature
SFo Allowable flange stress at design temperature
MG Component of moment due to HG
MT Component of moment due to HT
MD Component of moment due to HD
Mo Total moment
𝒉𝑮 ′′ Flange lever arm
Hp Total joint-contact-surface compression load
𝑯𝑷′ Total adjusted joint-contact-surface compression for full-face gasketed flange
N Number of bolts
SH Longitudinal or axial hub stress
SR Radial flange stress
SRAD Radial stress at bolt circle
ST Tangential or hoop flange stress
T Shape factor (Fig. RD-1176.5 in the standard)
t Flange thickness
U Shape factor (Fig. RD-1176.5 in the standard)
V Shape factor (Fig. RD-1176.2 in the standard)

xxvi
Y Shape factor (Fig. RD-1176.5 in the standard)
Z Shape factor (Fig. RD-1176.5 in the standard)
Ai Internal cross section area of the pipe
Ak Cutting section area of the pipe
Pk Equivalent pressure of the hydrostatic end force HD
FN3 Flange with 3 mm Nitrile gasket
FN5 Flange with 5 mm Nitrile gasket
FV3 Flange with 3 mm Viton gasket
FV5 Flange with 5 mm Viton gasket
LP Leakage pressure

Chapter one Introduction
1
CHAPTER ONE
INTRODUCTION
1.1 Introduction
Bolted flange joints are increasingly used in pressure containing equipment, such as
pressure vessels and pipes due to the convenience in forming reliable joints between
two pieces of equipment. Most of these flanges are made of traditional materials
(mostly metallic materials). However, in many applications such as in oil, gas, and
offshore applications or in chemical industries, the corrosion resistance of these
materials are low compared with their non-metallic counterparts such as composite
materials. A study in the USA indicated that during 1980’s, the corrosion cost was
approximately $8 billion a year and this was the 60% of the U.S steel output that
went into replacement products [2]. A further study [3] in the USA also has claimed
that the annual direct cost of corrosion for drinking water and sewer systems was $36
billion /year and for the gas-distribution network it was $5 billion/year [3]. Hence,
the high costs of installation and/or maintenance of the equipment and products
made of conventional materials have led the designers and engineers to find
sustainable solutions of corrosion problems. One of the best solutions that can be
utilized to overcome the corrosion related problems, which are linked with the

Chapter one Introduction
2
metallic materials, is to use a material with good corrosion resistance, such as
composite materials (fibre reinforced polymers) instead of metallic materials.
Continuous fibre reinforced composites are preferred in pressure vessels, pipelines,
marine, automotive, aerospace, sporting goods and infrastructure, oil and gas
industries due to their unique combination of properties which include high strength
and modulus to weight ratio and high corrosion resistance [4, 5]. For instance, the
weight of a 12 inch diameter pressurized fuel line for carrying liquid hydrogen in a
space shuttle has been reduced by 20% when it has been manufactured from
composite materials [6]. In addition, fibre reinforced polymer (FRP) has long life
expectancy, less environmental concerns and low installation and maintenance costs
[7]. Another important advantage of FRP is that the designers have the ability to vary
the material properties for a specific application. For example, high resin content
provides maximum corrosion resistance; high fibre content provides maximum
physical strength. Therefore, the designers can combine these two elements to
produce a satisfactorily reliable design. Similarly, they can also vary the mechanical
properties by changing the directions of the fibres to resist a specific loads in a
specific directions.
In spite of good performance of FRP materials in the applications of pressure vessels
and piping systems over the last four decades, only a few research works [7, 8] can
be found regarding the bolted FRP flange joints. In addition, standardization and the
relevant design codes, which could be used as design guidelines for fabrication
methods and dimensional considerations of bolted FRP flange joints, are inadequate.
Currently, all design methods are modified from their counterpart of metallic design
methods neglecting the composite flange behaviours, which are different from those
of the metal flanges. Therefore, the use of currently available standards leads to
additional challenges when applied to composite flange manufacturing process.
Therefore, the current research is aiming to develop a good manufacturing process of
bolted glass fibre reinforced polymers (GFRP) flange joints using 2D fibreglass
braid and vacuum infusion process (VIP). This included the design and manufacture
of the required mould for the composite flange, which has a complex geometry.
Experimental work has been carried out to identify the strength and the reliability of
the manufactured flange joint. Two failure mechanisms have been examined; (1) the

Chapter one Introduction
3
standpoint of strength or stuffiness (mechanical failure) and (2) failure from joint
leakage. In order to maximize the performance and to understand the physics of
failure, finite element analysis has also been developed for a detailed 3D model of
the flange joint. The simulation has taken into account the orthotropy of the
composite materials and the nonlinear behaviour of the rubber gaskets as well as
fluid pressure penetration (FPP), which leads to the leakage pressure.
This chapter presents an introduction about this PhD project on the bolted GFRP
flange joint for oil and gas applications.
1.2 Motivation of the research
The main motivation of this research is to maximize the performance of the bolted
FRP flange joints, which currently face many problems, and to reduce the materials
cost of manufacturing the FRP flange. The main objectives of this research are:
To design and manufacture a mould with high quality and performance
To propose a new technique for manufacturing FRP flange, connecting it to
the composite pipe and testing the joint’s reliability through experiments.
To develop a 3D model of the composite pipe joint that includes flange, pipe,
gasket and fasteners and to perform FEA using ANSYS software.
To validate the simulation results (strains and leakage pressure) with the
experiments. This reduces both the costs and the time required for
experimental investigations.
To investigate the effect of the applied loads and the flange dimensions on
the strain distributions, flange axial displacement, flange rotation and leakage
pressure in the bolted GFRP flange joints and find the possibility of reducing
some of these dimensions.

Chapter one Introduction
4
1.3 Methodology
This research is conducted by the methodology shown below:
Designing and manufacturing the required mould for the composite flanges.
Fabricating the composite flanges using glass fibre braid, polyester and
vacuum infusion process and carrying out experiments to find out the fibre
volume fraction and fibre direction in many places over the flange body.
Assembling the pressure vessel components, which are composite flanges,
pipe blind flanges and other, and conducting tests under various bolt and
internal pressure loads.
Manufacturing composite laminates using the same materials and the
manufacturing process as used for the composite flange to conduct
experiments such as bending, drilling and measuring the coefficient of
friction between composite and rubber gaskets.
Conducting compression test for the rubber gaskets to find out their non-
linear behaviour during the loading and unloading conditions.
Carrying out tensile tests for the used stainless steel bolts to find out the
Young’s modulus and comparing the strain readings of the fixed strain
gauges with the Instron data as well as the theoretical results.
Based on the experimental results, Helius composite software is used to
calculate all the mechanical properties of the composite flange and the pipe.
Finite element analysis (FEA) is used to simulate the GFRP joint system,
which includes flange, pipe, adhesive bonding, fastener (bolt and washer) and
rubber gasket.
The fluid pressure penetration (leakage propagation) between the flange and
the rubber gasket has been simulated using the contact element real constant
(PPNC) criterion.

Chapter one Introduction
5
Developing another FEA model and use the same boundary conditions and
PPNC criterion for a metal flange, which has been studied experimentally
and numerically by somebody else.
Comparing the experimental results with the FEA result for the validation
purposes.
Numerically, studying the effects of the flange dimensions, the gasket
thickness and the gasket material on the flange joint performance and
investigate the possibility of reducing the manufacturing cost of the flange.

Chapter one Introduction
6
1.4 Structure of the thesis
Chapter 1 presents general introduction about the PhD work.
Chapter 2 provides overview of metallic and composite flanges and related literature.
Also, it includes the details about gaskets types, composite pipes, adhesive bonding,
fasteners and composite drilling.
Chapter 3 reports the design parameters (variables and constants) and the
comprehensive analytical approach of the ASME code, Section X, for the FRP
bolted flange joint.
Chapter 4 provides the details about the manufacturing process of the composite
flange including design and manufacture the mould, solving the manufacturing
issues identified and assembly of all components to make the pressure vessel.
Chapter 5 describes tests that are needed to calculate all the mechanical properties of
the composite flange in Helius composite (Autodesk) software. It also contains
explanation about the data measurement equipment and the test rig.
Chapter 6 provides all details of the finite elements analysis models of the composite
and the metal flange joints including the simulation of the fluid pressure penetration.
Chapter 7 compares the experimental and the numerical results to validate the FEA
for using it in further investigations. In addition, it discusses details of the other FEA
model for the metal flange and compares results with previous work.
Chapter 8 reports the effect of the flange dimensions and gasket thickness and
material on the maximum flange axial, hoop and radial strains, flange axial
displacement, flange rotation and the leakage pressure.
Chapter 9 summarizes the findings of this study and provides recommendations for the
future work.

Chapter one Introduction
7
1.5 Outline of the research
Fig. 1.1: The flow chart of the project

Chapter one Introduction
8
1.6 Skills development training attended
Laser Safety Awareness Training, Plymouth University, 13 July 2018, UK.
Introduction to teaching and learning (PGCAP711), Plymouth University, 7
Feb.-11 June 2018, UK
Ph.D. course: “Fracture Mechanics for Laminated Composite Structures”, 13-
17 Nov. 2017, Aalborg University, Denmark.
GRAD school: Residential Development Programme for Postgraduate
Researcher, 04-07 July 2017, Universities of the West of England, Plymouth
and Bath Spa.
ANSYS Fluent Turbulence Modelling, 15 - 18 May 2017, ANSYS Training
Centre.
ANSYS Fluent Combustion Modelling, 18 - 21 April 2017, ANSYS Training
Centre.
Introduction to ANSYS Fluent Meshing, 27 - 31 March 2017, ANSYS
Training Centre.
ANSYS Mechanical Rotordynamics, 20 - 23 March 2017, ANSYS Training
Centre.
Introduction to ANSYS Meshing, 16 - 19 Jan. 2017, ANSYS Training Centre.
Introduction to ANSYS DesignModeler, 09 - 12 Jan. 2017, ANSYS Training
Centre.
ANSYS Mechanical User Programmable Features (UPFs), 12 - 14 Dec. 2016,
ANSYS Training Centre.
Introduction to ANSYS nCode DesignLife, 28 Nov. - 02 Dec. 2016, ANSYS
Training Centre.
Introduction to ANSYS LS-DYNA, 28 Nov. - 09 Dec. 2016, ANSYS
Training Centre.
Introductory to ANSYS Fluent, 17 - 27 Oct. 2016, ANSYS Training Centre.
ANSYS CFX Multiphase, 17 - 26 Oct. 2016, ANSYS Training Centre.
Introduction to ANSYS Explicit Dynamics, 30 Aug - 6 Sept. 2016, ANSYS
Training Centre.
ANSYS Mechanical Rigid Body Dynamics, 22 - 25 Aug. 2016, ANSYS
Training Centre.

Chapter one Introduction
9
ANSYS Mechanical Linear and Nonlinear Dynamics, 25 July-3 Aug. 2016,
ANSYS Training Centre.
Introduction ANSYS Mechanical, 11-22 July 2016, ANSYS Training Centre.
Introduction to ANSYS CFX, 20 - 30 June 2016, ANSYS Training Centre.
ANSYS Mechanical Heat Transfer, 06 –09 June 2016, ANSYS Training
Centre.
ANSYS Mechanical Material Nonlinearities, 06 –13 June 2016, ANSYS
Training Centre.
Introduction to ANSYS Composite PrepPost (ACP), 10-18 May 2016,
ANSYS Training Centre.
ANSYS Mechanical Advanced Connections, 21 April - 4 May 2016, ANSYS
Training Centre.
Introduction to ANSYS, 16 – 17 November, 2015, ANSYS Training Centre.
Course MAT347 Composites Design and Manufacture at the Plymouth
University by John Summerscales, 2015.
Academic English for research student, Sep. 2014-March, 2015, Plymouth
University, UK.
1.7 Publications work from this PhD work
Aljuboury, M., Rizvi. Md, Grove S., Cullen, R., ’’ Bolted flange joint made
of glass fibre reinforced polymer (GFRP) for pipelines’’, The ASME 2018
Pressure Vessels and Piping Conference (PVP2018), 15-20 July 2018,Prague,
Czeck Republic. Available at: http://proceedings.asmedigitalcollection.asme.
org/proceeding.aspx?articleid=2711945
Aljuboury, M., Rizvi. Md, Grove S., Cullen, R., ’’ Development of
manufacturing a bolted flange joint from glass fibre braid reinforced
polymer using a vacuum infusion process (VIP)’’, International Conference
on Manufacturing of Advanced Composites (ICMAC 2018), 10-12 July 2018,
Nottingham university, UK.
Aljuboury, M., Rizvi. Md, Grove S., Cullen, R., ’’Stress analysis of bolted
FRP flange connections under internal pressure’’, 5th PRIMaRE Conference,
Bristol University 5-6 July 2018, UK.

Chapter one Introduction
10
Aljuboury, M., Rizvi. Md, Grove S., Cullen, R, ’’ Bolted flange joint made of
glass fibre reinforced polymer (GFRP) for oil and gas applications’’,
Postgraduate Society Research Showcase, Plymouth University, June 2018.
Aljuboury, M., Rizvi. Md, Grove S., Cullen, R., ‘’ Bolted FRP flange joints
for pipelines: A review of current practice and future challenges’’, IMechE,
Part L: Journal of Materials: Design and Applications, April 2018. Available
at: http://journals.sagepub.com/doi/abs/10.1177/1464420718766563
Aljuboury, M., Rizvi. Md, Grove S., Cullen, R., ’’ A numerical investigation
of the sealing performance of a bolted GFRP flange joint with rubber
gasket’’, Eleventh International Conference on Composite Science and
Technology /ICCST/11 April 4–6, 2017, UAE.
Aljuboury, M., Rizvi. Md, Grove S., Cullen, R, ’’Manufacturing glass fibre
reinforced polymer (GFRP) bolted flange connections by using a vacuum
infusion process’’, Eleventh International Conference on Composite Science
and Technology /ICCST/11 April 4–6, 2017, UAE.
Aljuboury, M., Rizvi. Md, Grove S., Cullen, R, ’’Manufacturing glass fibre
reinforced polymer (GFRP) bolted flange connections by using a vacuum
infusion process’’, Postgraduate Society Research Showcase, Plymouth
University, March 2017.
1.7.1 Submitted journal articles
Aljuboury, M., Rizvi. Md, Grove S., Cullen, R., ’’ A numerical investigation
of the sealing performance of a raised face metallic bolted flange joint ’’,
International Journal of Pressure Vessel and Piping, June 2017. Status: Under
revision.
Aljuboury, M., Rizvi. Md, Grove S., Cullen, R., ’’ Bolted GFRP flange joints
for pipelines: A design and manufacture’’, IMechE, Part B: Journal of
Engineering and manufacture: Design and Applications, Nov. 2018. Status:
Under revision.
Chapter two Literature review
11
CHAPTER TWO
LITERATURE REVIEW1
2.1 Introduction
Bolted flange joint (BFJ) refers to a structure that includes flange disc, hub, pipe,
gasket and fasteners. Based on the geometry, flanges can be categorized into many
types, which will be described in detail in the next section. Regardless of the type,
flanges are fabricated using traditional materials, however, some of those can be
manufactured from non-metallic materials such as FRP composites. The flanges that
can be manufactured from both metallic and composite materials are full faced
gasket flange and raised face flange. On the other hand, ring type gasket or O-ring
gasket flange, ring gasket flange, tongue and groove flange, male and female flange
so far cannot be manufactured using composite materials due to the complex shapes
of these flanges near the contact faces. However, more studies are required to
achieve these big challenges. Regarding the gaskets, which seal the matched flanges,
they are divided into three types (metallic, semi-metallic and non-metallic gaskets)
based on the materials. In addition, each one of these has different geometries and
used for certain applications.
The chapter includes an overview of the BFJ, which are made of metallic and
composite materials as well as the previous relevant research works. [9]
1 This chapter has been published as an article in IMechE Part L: Journal of Materials: Design and
Applications [9].
Chapter two Literature review
12
2.2 Overview of metallic bolted flange joints
Based on the contact faces, bolted flanges are categorized into several types. The
main purpose of these categorizations is to seat the sealing gaskets to meet the
requirements of the design conditions, such as internal pressure and design
temperature specified by ASME B16.5 [10] and B16.47 [11]. Among others, most
common flanges are the full face gasket, ring gasket or O-ring gasket, raised face,
male-female and tongue-groove flanges. All these flanges, will be discussed in this
chapter.
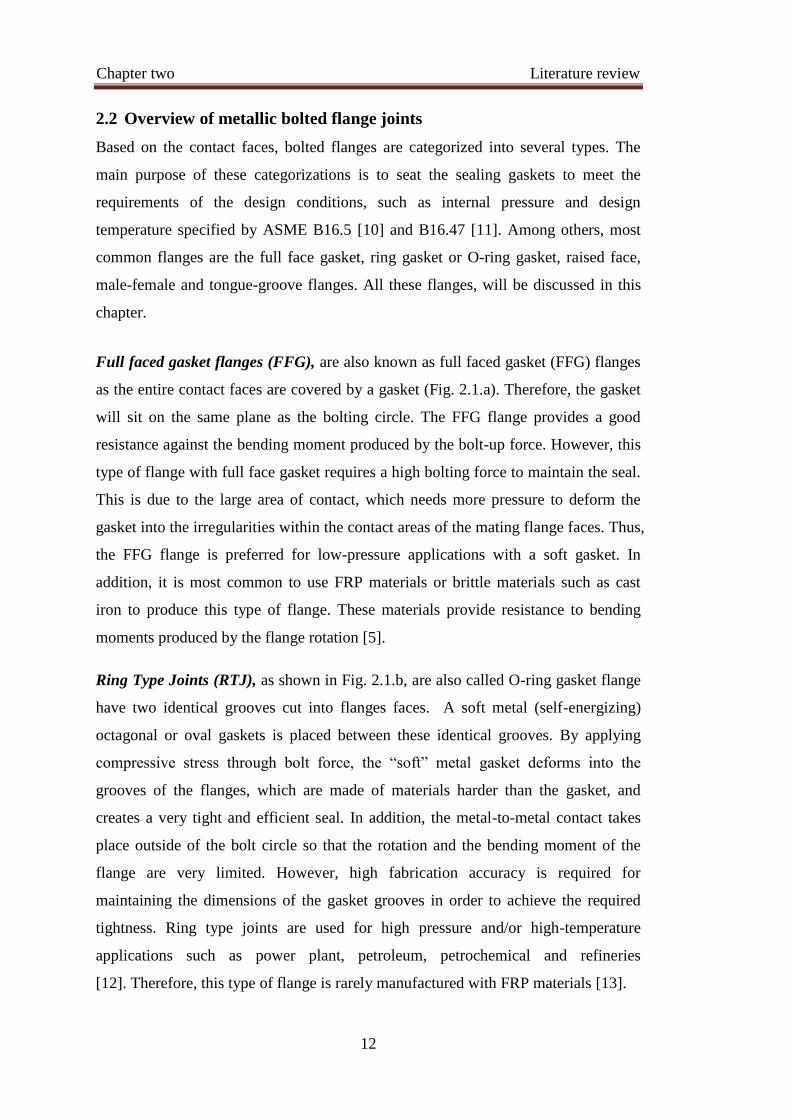
Full faced gasket flanges (FFG), are also known as full faced gasket (FFG) flanges
as the entire contact faces are covered by a gasket (Fig. 2.1.a). Therefore, the gasket
will sit on the same plane as the bolting circle. The FFG flange provides a good
resistance against the bending moment produced by the bolt-up force. However, this
type of flange with full face gasket requires a high bolting force to maintain the seal.
This is due to the large area of contact, which needs more pressure to deform the
gasket into the irregularities within the contact areas of the mating flange faces. Thus,
the FFG flange is preferred for low-pressure applications with a soft gasket. In
addition, it is most common to use FRP materials or brittle materials such as cast
iron to produce this type of flange. These materials provide resistance to bending
moments produced by the flange rotation [5].
Ring Type Joints (RTJ), as shown in Fig. 2.1.b, are also called O-ring gasket flange
have two identical grooves cut into flanges faces. A soft metal (self-energizing)
octagonal or oval gaskets is placed between these identical grooves. By applying
compressive stress through bolt force, the “soft” metal gasket deforms into the
grooves of the flanges, which are made of materials harder than the gasket, and
creates a very tight and efficient seal. In addition, the metal-to-metal contact takes
place outside of the bolt circle so that the rotation and the bending moment of the
flange are very limited. However, high fabrication accuracy is required for
maintaining the dimensions of the gasket grooves in order to achieve the required
tightness. Ring type joints are used for high pressure and/or high-temperature
applications such as power plant, petroleum, petrochemical and refineries
[12]. Therefore, this type of flange is rarely manufactured with FRP materials [13].

Chapter two Literature review
13
Flat ring gasket flanges have physical geometry similar to the FFG flange, but both
the gasket shape and the applications are different. This type of flange uses a flat ring
gasket that sits at the inside area of the bolt circle. Therefore, no contact occurs
between the flanges outside the bolt circle and this leads to rotation of the flange
when the connection is tightened. This rotation also produces high bending stresses
at the hub-flange intersections. These bending (axial) stresses with hubless flanges
(Fig. 2.1.c1) are higher than those with the hubbed flanges (Fig. 2.1.c2) [8]. This
difference is due to the additional materials that resist rotation in the hubbed flange.
However, these flanges are simple in shape and easy to manufacture. Both metallic
and the non-metallic gaskets are used with this type of flange. The main use of the
ring gasket flange can be found in low and medium pressure applications.
(c1) Hubless flange (c2) Hubbed flange
(c)
(a) (b)
Fig. 2.1: Bolted flange (a) Full face gasket flange (b) Ring type joint
(c) Flat ring gasket flange
A half of the ring type gasket
Gasket
Hub
Flange or flange disc

Chapter two Literature review
14
Raised face flanges (Fig. 2.2.a) have the area inside the bolt circle higher than the
bolting surface area. This is to reduce the contact area between the flange and the
gasket and to achieve high pressures on a small gasket area. Consequently, the
pressure containment capability of the joint increases but a high flange rotation,
which is considered one of the disadvantages of this flange, is produced in the hub
region due to the moment of the bolt force, and hence no flange contact outside the
bolt circle is established [13]. Nevertheless, many types of gaskets are used with this
type of flange such as flat ring, spiral wound and double-jacketed. Raised face
flanges are very popular for applications that have medium and low-pressure service.
Tongue and groove flanges have matched faces. One of the flange faces has a rib
(tongue) machined on its face, while the mating flange face has a groove (Fig. 2.2.b).
The gasket is placed onto the groove and it cannot be pushed to the outside due to
the hydrostatic force produced by the internal pressure [13]. The main difference
between this flange and the O-ring gasket flange is that it has a raised ring on one
flange face and a groove on the other face of the mating flange, whereas the O-ring
gasket flange has two identical grooves on each matching flange face [13].
Advantages include self-alignment, evenly distributed compressive forces on the
gasket, less erosive or corrosive contacts of the gasket with the fluid in the pipe and
better sealing performance. However, the replacement of the gasket is very difficult
for some applications and this leads to damage to the flange especially for high-
temperature applications. Also, this type of flange incurs high manufacturing costs
[12]. The main applications are pump covers, valve bonnets, toxic fluids and
explosives.
Male and female flanges, the male and female flanges have two matched faces. One
of the mating flanges named as male flange has a ring area that is extruded from its
contact face whereas the other mating flange names as female flange has a groove
machined into its face. For this type of flange, the gasket is squeezed into a narrow
place and is prevented from moving to outside by the outer surfaces of the female
flange as shown in Fig. 2.2.c. This flange differs from the tongue and groove flange
as well as the raised face flange. This is because both the inside diameter of the
extruded area of the extruded ring and the depression matched extend into the flange
base. This retains the gasket on its outer diameter for this type of flange and makes it

Chapter two Literature review
15
distinct from the tongue and groove flange as well as the raised face flange [13]. This
type of flange is easy to assemble and it can be used in any position. Its sealing is
very good and better than the raised face flange. Thus it is used for the service
pressures that is higher than those used with the raised face flange but lower than
those used with the tongue and groove flange. This type of flange is also used with
the heat exchanger shell to channel and cover flanges.
(a)
(c) (b)
Fig. 2.2: Metallic flange (a) Raised face flange (b) Tongue and groove flange
(c) Male and Female flange

Chapter two Literature review
16
2.3 Overview of composite bolted flange joints
Bolted flange joints made of fibre reinforced plastic (FRP) are widely used in many
industries such as chemical, power plants, petrochemical and offshore oil and gas
industries. This is because the systems in these industries usually include pumps,
valves and other fittings that require periodic removal for maintenance. The FRP
bolted flanges were developed in response to significant corrosion problems with
either metallic and non-metallic pipes [14]. In addition, the use of composite flanges
to connect composite pipe helps to avoid the mismatches during thermal expansion
of metal connecting pieces and composite pipes [15].
In this study, full face gasket (FFG) flange has been chosen for study. As the gasket
covers all its face, the FFG flange has a good ability to reduce or minimize the
applied bending moment. It has therefore become attractive to designers, especially
for use with brittle materials such as cast iron, glass, porcelain and other ceramic
materials [16].
2.3.1 Materials system
2.3.1.1 Matrix Materials
The main purpose of the matrix in a composite material is to support the fibres and to
transfer the load between them. In the through-thickness direction of composites (at
right angles to the plane of the reinforcement), mechanical properties are very much
matrix dominated, and designers must pay particular attention to transverse
interlaminar shear stresses. These matrix-dependent properties are also affected by
the operating temperatures. Moreover, the matrix protects the fibres from the
environment such as water absorption, chemical or acidic attack as well as
mechanical abrasion. Generally, matrix materials can be polymer, metals or ceramic.
Due to the low costs and the ease of manufacturing, thermosetting polymer matrices
(such as polyester, epoxy and vinylester) are commonly used in composites
structures [17].
Polyester resins, polyester resins are widely used in many applications that require
good resistance against water or chemical attack as well as good weather ability
characteristics such as tanks, pipes, liners, automobiles and aircrafts [7, 17-20].

Chapter two Literature review
17
Polyester resins are; low in cost, fast in cure, have relatively high shrinkage [18] and
good capability of releasing the mould after curing. In this present study, these
features of polyester helped to remove the GRP flanges from the mould after curing.
In addition, they have high insulation, high UV resistance and moderate strength.
Moreover, polyester resins are very versatile material. At room temperature, the
liquid polymer that is available at varying viscosity is stable for months or even
years. In spite of this great stability, it can be triggered to cure within few minutes by
adding a peroxide catalyst [17, 21, 22]. Considering the above advantages, polyester
resin has been chosen as a matrix to fabricate the GRP flange in the present study.
Epoxy resins provide higher mechanical performance, good resistance against
corrosion and chemical attack and lower water absorption compared to other
commonly-available resins [7, 17, 18]. They are used with various fibres
reinforcement for many composite structures such as aircraft, missiles, boats and
automotive. In addition, epoxy resins are used as adhesives, caulking compounds,
casting compounds, sealants, vanishes and paints. Epoxies are cured quickly and
easily at temperatures between 5˚C and 150˚C (depending on the curing agent)
without releasing any volatiles. This results in low shrinkage (1.2% - 4% by volume),
and hence helps to achieve accurate dimensions of fabricated structures. However,
epoxy resins are more expensive and care is required with regard to mould release.
[19, 21].
Vinyl ester resins are widely used in chemical-resistant FRP equipment such as pipe,
ducts, scrubbers, flue stocks and storage tanks, which represent their largest
commercial usage of Vinylester [19]. This type of resin has excellent resistance to
acid, base, solvents, hypochlorites and peroxides and can be used in a neat form (e.g.
no diluent). Moreover, Vinylester resins are superior to the polyester resins due to
low viscosity and fast curing as well as are superior to the epoxy resins due to better
chemical resistance and tensile strength. Vinylester resins have less volumetric
shrinkage upon curing compared to polyester resins but the shrinkage is greater than
epoxy resins. The cost of Vinylester resin lies between the costs of epoxy and
polyester resins. However, Vinylester resins exhibit only moderate adhesive strength
because of high volumetric shrinkage values [7, 17, 18].

Chapter two Literature review
18
2.3.2 Fibres reinforcement
Glass Fibres, glass fibres are produced by melting glass at/around a temperature of
1200˚C and extruding it through a large number of holes that exist in a spinneret.
The diameter of those holes is usually 1 or 2 mm and between 5 to 15 μm is the
diameter of the glass filaments that are drowned around a mandrel. Glass fibres are
widely used to reinforcement for general composites due to better hardness,
corrosion resistance and inertness properties. Furthermore, they are flexible, light
weight and cheaper than most other relatively high modulus fibres. These
characteristics have made glass fibres the most common type of fibre reinforced used
in low cost industrial applications. Glass fibres are divided into five types. E-glass
fibres are preferred where high tensile strength, good corrosion or chemical
resistance and low costs are required. S and R glass fibres are used where enhanced
mechanical properties are required but the cost is three to four times higher than that
of E-glass fibres. C-glass fibres are used for corrosion resistance in an acid
environment. D-glass fibres are used for dielectric properties in electrical
applications [17, 23]. In this study, E - glass fibres have been used due to the
advantages discussed earlier.
Carbon fibres, carbon fibres are generally fabricated using two types of procedures:
textile procedures which is named polyacrylonitrile (PAN) and pitch precursors.
Generally, carbon fibres are lightweight, strong and have high tensile strength-
weight ratio as well as high tensile modules-weight ratio. Unlike glass fibres, these
are available with various tensile modulus and strength values. Therefore, carbon
fibres are dominant in the aerospace applications where the high performance and
the weight saving are considered as more critical than the costs. In addition, carbon
fibres have good fatigue strength, high thermal conductivity which is even higher
than that of copper and have very low coefficient of linear thermal expansions (CTE)
All together, those properties provide dimensional stability in applications that have
a large range of variations in temperature such as aerospace applications. In contrast,
carbon fibres have low impact resistance, low strain-to-failure and high electrical
conductivity which may cause electric shock or short-circuiting in unprotected
electrical machinery [17, 21].

Chapter two Literature review
19
Aramid fibres, aramid fibres are man-made organic polymer (an armatic polyamide)
manufactured by extruding an acidic solution of a proprietary precursor (a
polycondensation product of terephthaloyol chloride and p-phenylene diamine) from
a spinneret. Aramid fibres, which are also known as Kevlar, absorb energy during
failure. As a result, these fibres have good resistances to impact and ballistic. In
addition, these fibres have low density and high strength which contribute to achieve
high strength to weight and high modules to weight ratios. Hence, these fibres are
ideal for the aircraft and for body Armor [17, 18, 21]. Furthermore, Aramid fibres
have very low thermal conductivity and very high coefficient of vibration damping.
There are several disadvantages of Aramid fibres. For example: lower resistance to
compression, temperature dependent mechanical properties and the fibre loses about
75-80% of its tensile strength when the environmental temperature is increased from
a room temperature to 177˚C. Therefore, these fibres are not preferred for high
temperature applications. Moreover, Aramid fibres are very sensitive to ultraviolet
lights and a significant percentage of tensile strength is lost during prolonged direct
exposures to the sun. The most common commercially available Aramid fibres are
known as Kevlar 29, Kevlar 49 and Kevlar 149.
2.3.3 Manufacturing techniques of bolted GFRP flange
There are various fabrication processes to combine fibre reinforcements and resins
for producing composite components or structures. The American Society of
Mechanical Engineers (ASME) [24] has recommended four methods for producing
GRP flanges: contact moulding, filament-winding, resin transfer moulding and
vacuum infusion process.
Contact moulding or hand lay-up is a simple, low cost process and suitable for large
structures. This is an open moulding process and only one male or female mould is
used. The layers of fibres (in the form of mat, woven roving and cloth) impregnated
with resin are placed inside the mould and compacted using a roller to eliminate air
bubbles and to facilitate uniform resin distribution. This process is repeated many
times until the required thickness is reached. Usually, curing of hand lay-up is done
at ambient temperature but heating could be applied to accelerate the process. It is a
slow process (up to 500 units per year per mould) [7, 17, 23, 25].

Chapter two Literature review
20
Filament winding is primarily used for hollow products such as pipes, pillars,
storage tank and containers. This is done by impregnating continuous fibre
reinforcement with resin, then winding onto a rotating mandrel using a delivery eye.
The delivery eye moves back and forth along the axis of the mandrel, so the angle of
the fibre orientation and the thickness of the composite laminate are both dependent
on the mandrel’s rotational speed and the linear speed of the delivery eye. Various
physical strengths can be obtained by varying the winding angle of the fibre. Most
commercial companies prefer to use this process to fabricate GRP flange due to its
high production rate (up to 500 kg of composites per day) [17, 18, 25].
Resin transfer moulding (RTM) injects pre-catalysed resin (at relatively low
pressure) into a matched mould cavity containing fibre reinforcement. The
dimensions of the product are directly controlled by the tool cavity thus a moulding
of consistent shape and weight can be obtained. The advantages of this technique are:
(1) the fibre volume fraction can be controlled very well; (2) usually very consistent
mechanical properties; (3) a wide variety of resin systems and fibre reinforcements
can be applied; and (4) very complex components can be produced. However,
matched moulds with high dimensional accuracy as well as higher capital costs of
equipment and moulds are required [26-28].
Vacuum infusion moulding (VIP), this process is similar to the contact moulding
process. The only difference is that a uniform pressure is applied in this method on
the parts before curing to improve the consolidation of fibre, to remove the trapped
air and volatiles. As shown in Fig. 2.3, this pressure is generated by drawing a
vacuum in the space between the parts once a sheet of soft plastic is placed over it
and sealed at the edges. Before applying the vacuum, release film or release agent is
used to avoid the sticking between the parts and the mould. Also, the layers of fibre
are laid up onto the tool (mould) with peel ply and the resin distribution medium.
The porous of the peel ply helps to prevent sticking between the laminate and the
resin distribution medium and also leaves an imprint or pattern of the surface to
improve adhesive bonding. The resin distribution medium works as channels of air
and volatiles and helps distributing the resin injected through inlet port. The main
advantage of this method is to achieve high fibre content with low void numbers.
This method is also suitable for production of large, high quality, lower cost

Chapter two Literature review
21
composite parts. However, this method creates health and safety issues as the
volatiles are emitted during curing. [25, 26, 29]. As the advantages of the vacuum
moulding method supersedes the disadvantages, this method has been chosen to
fabricate the GFRP flange in the present study. In addition, this method can be used
for commercial production of the composite flange but it requires braiding machine,
which expedites the lay-up of the fabric. In this study, the fabric is laid-up manually
due to the machine is not exist in the lab. [18]
2.3.4 Use of Braided fabric
Two-dimensional braids are available in two types: (1) biaxial and (2) triaxial.
Biaxial braid is the most commonly used and is produced using two sets of yarn
carriers that rotate around the braiding axis. One of these two sets rotates in
clockwise direction whereas the other set moves to the opposite direction creating a
single layer of braided fabric [30]. Triaxial braid is involves a third yarn carrier
which adds longitudinal yarns to the biaxial interlacing yarns (Fig. 2.4) [31]. [31]
Fig. 2.4: Mandrel over-braiding
(a) (b)
[31]
Fig. 2.3: Vacuum bagging process [18]

Chapter two Literature review
22
Biaxial yarn angles can be varied from 25˚ to 75˚ [18] so the braid can be dropped
over the top of mandrels that vary in cross-sectional shapes and/or dimensions along
their length without needing to cut the yarn (Fig. 2.5). The attachment points or
holes can be preformed into the fabric to reduce the steps in component finishing and
to improve the mechanical performance of the components. This is because biaxial
braid helps to avoid cutting the fibre reinforcements at the attachment site [31]. In
contrast, triaxial braid cannot be used with a mandrel which has varying cross-
sectional areas as the axial/warp yarn locks the diameter of the braid and prevents the
internal expansion and contraction.[32]
A previous study [33] has indicated that the most common types of failures in
commercially available GRP flanges manufactured by hand lay-up or filament
winding processes occur at the flange-hub intersections, due to the discontinuity of
fibres in this region (Fig. 2.6). Therefore, in this study, biaxial braid has been chosen
to manufacture the GFRP flange joint. [33]
Fig. 2.5: Circular braiding around a complex shape [32]
Fig. 2.6: Flange failure at the flange neck [33]

Chapter two Literature review
23
2.4 Performance of metallic bolted flange joints
The flat face flange has been widely used in the early years of the process industries.
At that time, cast iron was commonly used to manufacture the flange. Without
having any existing standards, full face (FF) flanges were manufactured and widely
used because the gasket covers a large area of its face and this reduces the undue
stress on the flange. The FF flanges were usually used to connect pipe-to-pipe, pipe
to pump or any other equipment such as pressure vessels at various levels of the
pressure and temperature.
When the use of flanges started to grow, wrought-iron rolled plate replaced cast iron.
The new method used a rolled angle section which was then riveted to the vessel’s
shell. When the welding technique was introduced to join pipes, tanks and pressure
vessels at high-pressure levels, manufacturers preferred to use forged-steel materials
to produce FF flanges.
To date, many theories, methods, and standards such as ASME, JIS, BS, CODA and
DIN have been developed to make the design of the flange viable and reliable. Most
of these standards has been built up based on the structural geometry and applied
loads. Fig. 2.7 shows analysing of the applied loads on the flange. The following
sections will discuss in detail the factors that affect the performance of metallic
flange joints.
Fig. 2.7: Loading analysis of the flange

Chapter two Literature review
24
2.4.1 Effects of nominal flange diameter
The variation of the nominal diameter of bolted flange connection has an effect on
the flange performance and is considered as a key to optimise the design. Omiya et al.
[34] has studied stress analysis of flange joint using Elasto-Plastic (EP) FEA and
ASME method. They have found that the hub stress with larger diameter is smaller
than that with a smaller diameter. However, they have found opposite trends when
the ASME design method has been used. Also, a variation in the axial bolt force
(load factor) was observed as positive with the smaller nominal diameter and as
negative with the larger nominal diameter. According to the EP-FEA analysis based
on the JIS B 2490 standards, leakage of gas was predicted. It has been seen that the
sealing performance of smaller nominal diameter with a non-asbestos gasket was
better than that of larger nominal diameter with an asbestos gasket. Naser [35] has
studied the influence of the nominal diameter of the bolted flange. The study has
shown that all the stresses in tangential flange, hoop and longitudinal hub have
decreased with the increase in the nominal flange diameter.
2.4.2 Effects of flange thickness
The most important factors that have significant effects on the performance of the
flange and its optimum design are the flange geometry and the dimensions. The
variation of flange thickness has been studied by many researchers. Nash et al [36]
has developed a finite element model of a full face metal-to-metal tapered-hub flange.
They found that the flange thickness had a large effect on the radial flange stress, but
had no significant effect on either the longitudinal or the tangential hub stresses. In
addition, they have compared the results with ASME and PD5500 codes and found
that the flange radial stress of these codes was conservative (i.e. safe, since they
predict high stress) whereas the flange tangential stress was not conservative (i.e.
unsafe) when compared to the FEA results. Naser [35] performed analytical, FE
modelling and experimental investigations for the bolted flange connection and it has
been observed that the thickness has a positive effect on the flange stress (hoop and
radial), which is decreased with the decrease in the flange thickness. The study also
proposed a new design method for bolted flanges.

Chapter two Literature review
25
2.4.3 Effects of hub thickness
Stress concentration at the hub/flange intersection due to flange bending is one of the
important problems that probably lead to failure of the flanges. A number of studies
have focused on this problem and tried to solve it by varying the hub thickness.
Naser [35] studied the relationship between hub thickness and flange stress (hoop
and radial). It has been claimed that the flange hoop stress is increased but the flange
radial stress is decreased with the increase in the hub thickness.
2.4.4 Effects of hub length
Hub length plays an important role for maximizing the bolted flange design because
of its influence on the stresses of the joint system, especially, for the hub stress and
for the strength of the pipe-flange adhesive bonded connection. Nash et al [36] stated
that the hub longitudinal stress is reduced significantly as the hub length is increased
but the flange radial stress is almost independent of the hub length. It has also been
observed that the flange tangential stress is reduced slightly as the hub length is
increased.
2.4.5 Effects of flange rotation
Applying bolt load and internal pressure together tend to bend the flange and cause
rotation. This generates a deformation of the gasket accompanied by uneven
compression which has a significant effect on the sealing performance. Shoji and
Nagata [37] conducted a comparison study of raised face bolted flange joint with
nonlinear gasket using a 2D axisymmetric and 3D FE (finite element) models. The
results of the numerical simulations indicate that the flange rotation is larger in
pressurized condition for both 2D and 3D models. Furthermore, they have noted that
the modelling of bolt holes in 3D has no significant effect on the results.
The influence of variation in taper angle (different flange’s surface profiles), flange
thickness and bolt preload were studied by Abid and Nash [38] using two-
diamensional axisymmetric model. They found that the highest values of
longitudinal, radial and tangential stresses are at the hub/flange intersection, at bolt
circle diameter and at inside diameter, respectively. The maximum longitudinal
stress was recorded for the positive taper angle. The highest value of radial stress

Chapter two Literature review
26
was observed for the negative taper angle. In addition, the tangential stress is
increased with an increase in the flange thickness for positive angles, but it is
decreased for negative and no taper angles. It has been observed that the longitudinal
stress is decreased with an increase in the flange thickness up to 20 mm and then
becomes constant above 20 mm in all three flange profiles. In contrast, the flange
rotation is reduced as flange thickness is increased. Other researchers [39, 40] have
observed that the flange rotation is decreased by increasing the temperature of the
joint system.
2.4.6 Effects of thermal loading
In high temperature applications, the effects of thermal loading (internal fluid
operating temperature) should be taken into account in the analysis of the structural
integrity and sealing ability for the bolted flange joint. Unfortunately, many the
current codes and standards for flange joints do not account for the influence of
temperature [39, 41]. Abid [39] and Abid and Ullah [40] developed a 3D nonlinear
FE model to investigate bolted flange joint strength and sealing capacity under
combined internal pressure and different steady-state thermal loadings. The results
indicated that both the sealing and the strength are greatly influenced by the thermal
load. The radial variation of the temperature distribution through the flange and the
gasket is greater in the hub because the flange ring works as a cooling fin. Apart
from bolt axial stress, the stresses of the flange, bolt and gasket decreased by
applying the internal pressure and all the stresses decrease further with additional
thermal loads. However, the internal pressure does not affect the axial bolt stress
when the thermal load is decreased. Guruchannabasavaiah et. al [42] carried out a
non-linear finite element analysis to study the effect of internal fluid temperature
and bolt load on the gasket sealing between a flange and blind flange in a pressure
vessel. The results showed that the vertical deformation in the blind flange increased
with both the bolt load and thermal load and the maximum stress intensity was
affected significantly as bolt load increased. In addition, the contact stress between
the gasket and the flange interfaces was greatly increased by increasing the bolt load
but reduced rapidly as thermal load is applied. Therefore, a gap occurs at the lower
values of the applied bolt force.

Chapter two Literature review
27
2.4.7 Effects of material’s stiffness
Sawa et al [1] have studied the influence of the material stiffness of the hub, flange
and gasket (E1, E2 and E3, respectively) as well as gasket thickness. A 3D theory of
elasticity was used to analyse the distribution of the contact stress which dictates the
sealing performance. The results revealed that the distribution of the contact stress
tends to be uniform as the ratio of E1/E3 and the thickness both are increased. Also,
the gasket seating width and the moment arm were both increased by increasing both
the ratio of E1/E3 and the thickness of the gasket, whereas it has been considered
constant in JIS and ASME standards. On the other hand, the hub stress is increased
as the internal pressure and the thickness of the gasket both are increased and the
stress for aluminium gasket was larger than that of the mild steel gasket.
2.4.8 Effects of bolt preload
To avoid bolt failure during the operating condition, it is necessary to understand the
relationship between the axial bolt force and the internal pressure. The bolt load has
been calculated during bolt up or the operating conditions in many standards or
codes such as EN1591-1 [43], ASME PCC-1-2013 Appendix O [44] and the ASME
Boiler and Pressure Vessel Code, section X [24]. Nash et al. [36] found that the hub
longitudinal stress was largely affected by the bolt preload, but the flange radial
stress was slightly influenced and the maximum flange tangential bending stress was
almost independent of the bolt loads. On the other hand, increasing the pre-stress
bolts has a positive effect on the longitudinal displacement to prevent the leakage.
Omiya et al. [34] proposed a new method of calculating the preload bolt by taking
into account the allowable leak rate and the scattered bolt preloads. In addition,
previous studies [41,42] have clarified that the internal pressure has insignificant
influence on the pre-bolt load, in contrast, the maximum allowable internal pressure
largely depends on the axial bolt force [1, 45]. Furthermore, other researchers have
commented that the bolt load is affected by the temperature of the internal fluid due
to different thermal expansion values of the bolt flange and gasket [39, 40]. Zahavi
[46] has conducted nonlinear FEA analysis for bolted flange connections by taking
into account the changes in the geometry and the friction between flange-gasket
faces subjected to the loads to increase the accuracy of the results obtained for bolt
force and to accurately predict the leakage point. Moreover, Rotscher diagram has

Chapter two Literature review
28
been used and the results have been compared with the experimental results from
other published papers. In the study, it was noted that the incremental bolt force was
almost independent on the internal pressure and a good agreement could be found
between of the compared results.
2.4.9 Effects of bolt spacing
Do et al [47] have investigated the impact of bolt spacing on the circumferential
distribution of gasket contact stress in bolted flange joints. This study [48] has
applied an analytical approach which was developed based on the theory of circular
beam on elastic foundation as well as a finite element based numerical method
together with an analytical models developed by Koves. Two bolted heat exchanger
(HE) flange joints with various bolt dimension and bolt numbers were studied. One
of the flanges was 24 inch HE flange and the other was 52 inch HE flange. Also,
they have studied the influence of the gasket modulus. The results have indicated
that the bolt spacing has a great effect on the circumferential gasket contact stress. It
has also been found that both the flange thickness and the stiffness of the gasket have
a significant influence on the stress distribution.
2.4.10 2D Axisymmetric and 3D FE modelling of the flange
In order to save time and data volume, many studies have carried out the
comparisons between 2D axisymmetric and 3D FE analyses. Hwang and Stallings
[49] have performed a comparison study between 2D axisymmetric finite element
model and a 3D solid finite element model for the bolted flange connections. This
study has applied axisymmetric and non-axisymmetric loadings for both 2D and 3D
models and non-axisymmetric bolt pretensions for 3D model only. Both the bending
and the shear forces were unevenly distributed and both the torque and the axial
forces were evenly applied on the top boundary surfaces of the pipe section. The
results have indicated that the 2D axisymmetric model provides accurate results with
axisymmetric loading. When non-axisymmetric bolt pretension is applied, the
differences in results between the 2D and the 3D models were found between -1 and
+ 1 % in the pipe sections and between -3 and + 21% in the joint sections.
Approximately 35% variation in results between 2D and 3D models was observed in

Chapter two Literature review
29
the pipe sections for the non-axisymmetric loading representing the operating
conditions.
2.4.11 Considerations for FRP flanges
Most of the above parameters are still valid for the FRP bolted flange but the natural
behaviour of the composite materials should be taken into account by the designers.
These parameter are the orthotropy of the FRP material, which can be used to
reinforce the composite in the direction that is subjected to high loads, the
orthotropic thermal conductivity, the range of the working temperature and others,
which some of them will be mentioned in next section. Therefore, in this study, some
of the above parameters will be selected to investigate their effect on the
performance of the GRP flange joints.
2.5 Published research on Composite flange joints
A review of literature reveals that only a few studies have focused on composite
flange joints. Tao et al. [15] investigated the development of connection between
carbon fibre poles and advanced composite material flanges rather than the
traditional flanges manufactured by aviation aluminium alloy in stratosphere truss
structure. A Toray T700S–12K carbon fibre in three-dimensional full five directional
braiding technology and tri-functioned epoxy resin TDE - 85# were used to
manufacture the flange through RTM (resin transfer moulding) process. FEA has
been applied for the numerical analysis. The results reveal that the joint of carbon
fibre poles with the carbon-fibre composite flange performed better than the aviation
aluminium alloy flange under the same operating conditions.
Sanjay et al. [50] have conducted analytical stress analyses of a non-gasket
composite flange and a metallic flange. They have also conducted finite element
analysis for carbon-epoxy composite flange to calculate the radial and the axial
stresses. Both flanges were subjected to internal pressure of 15.32 MPa. The results
show that the composite flange has better performance compared to the metallic
flange, and the fibre orientations should be [0/45] and [0/60] to ensure the best
performances.

Chapter two Literature review
30
Whitfield et al. [51] carried out both numerical and experimental studies for creep
and unsymmetrical shrinkage during the post-cure of GFRP pipe flange
manufactured by hand lay-up method. Chopped strand mat fibre and Derakane
Momentum 411-350 vinylester resin and a steel mould have been used for
manufacturing the flange. The steel mould represented the inside dimensions of the
flange. A number of strain gauges were embedded during lamination between the
layers and on the outer surfaces. From the investigations, they have noted that the
correlations between spring back results are poor but for strain, results are good. The
authors listed two possible reasons, firstly, due to the thermal stress related creep in
the resin at the elevated temperature during post-cure and secondly, various cure
profiles have been applied at various stages of lamination process. Sun [7] has
studied the FRP bolted flange connections. Analytical approach using classical and
shear deformable laminated plate and shell theory as well as finite element analysis
have been carried out for identical flanges. An experimental investigation has been
carried out for non-identical flanges (e.g. blind flange). E glass woven roving and
mat, and Vinylester resin were used to manufacture the flanges along with two types
of gaskets (rubber and asbestos). A good agreement has been found between the
analytical and the numerical results.
Estrada and Parsons [8, 52] have investigated the strength and the leakage of a
modified glass fibre reinforced plastic (GFRP) stub flange joint by using three-
dimensional analysis and axisymmetric finite element models. It has been found that
over three-quarters of the contact between the gasket and the flange are lost, however,
the pressure in the remaining contact portion is greater than the internal pressure.
Most of the contact between the hub and the stub has been lost due to the stub
rotation whereas the pressure remains almost uniform in the circumferential direction
except at the ends where the contact pressure is higher on the sides of the bolts.
Kurz [53] performed analytical, experimental and numerical investigations on the
design of floating type bolted flange connections (better known as Loose Flange)
made of GRP materials capable of working at temperatures up to 80 ͦC in chemical
industries. Various types of gaskets made of rubber (EPDM) and
polytetrafluoroethylene (PTFE) were used to check the performances of the gaskets
with GRP bolted flange at that elevated temperature. It has been found that both the
PTFE-gasket and PTEF-gasket with diffusion barrier perform better than EBDM-

Chapter two Literature review
31
gaskets with sufficient tightness to achieve the leak rate criterion of the TA Luft and
are capable of tolerating the creep relaxation. In terms of the design analysis of other
parts of the components, the bolt-force has been decreased with heating up to 80 ͦC
but bending occurred at the top surface of loose flange between bolts in the
circumferential direction. It has also been noted that the loose flange rotates due to
the moment. The results of analytical, experimental and FEA simulations all have
shown good agreements with each other.
Kittel [54] have studied the optimisation of GRP-Loose flange joints. Two models
including PTFE gaskets have been used to simulate the optimisation of material
properties and geometric shapes. An evolutionary algorithm has been used for the
optimisation. They have observed that a number of parameters such as thickness of
flat washer, height of collar and number of materials in lower layer have no
influence on the characteristics of the flange connection. In contrast, other
parameters such as type of screw, width of flat washer, materials of upper layer and
the thickness of the loose flange have a large effects on the performance of the
flange connection.
Fangueiro [55] has performed experimental investigations on the development of
fibrous preforms of FRP T-pipe connections. 3D weft-knitted fleecy fabrics with
different structures such as fleece yarn linear, average ground yarn and average
fleece yarn have been tested to optimize the mechanical properties. Glass fibre and
polyester resin were used with RTM to manufacture the T-tube connection. The
results obtained from the tests indicate that the sample PA Glass 544 Tex exhibit the
best performance to manufacture the T-connection with 43% fibre mass fraction and
this is close to the desired value of 40%.
2.6 Research gap and justification of the project
As shown earlier and during the recent decades, a few studies have focused on the
fibre reinforced polymer bolted flange joint. In 1997, Estrada [8] studied the design
and analysis of a fibre reinforced plastic joint for filament wounding pipes using
finite element analysis. Later in 1999, Estrada and Parsons [52] investigated the
strength and leakage of a GFRP flange joint using FEA. In 2004, the creep and
unsymmetrical shrinkage during the post curing of GFRP pipe flanges have studied

Chapter two Literature review
32
by Whitfield et al. [51]. In 2007, Kittel [54] conducted an optimisation of GRP-
Loose flange joints. In 2011, Tao et al. [15] carried out an investigation to
manufacture a composite flange for poles joining of the stratosphere truss structure
instead of the metal materials. In 2012, Kurz [53] studied the design of floating type
bolted flange connection with composite flange at range of temperatures. In 2014,
Sanjay et al. [50] carried out an analytical stress analyses of a non-gasket composite
flange and a metallic flange.
So far, the found research works indicated there is a shortage in the research of this
field and also there were gaps during the recent years. This was one of the reasons
for choosing this project as the replacing of metallic pipes and flanges by composite
pipe and flange has widely increased recently. This is not only due to the ability of
the FRP materials’ resistance to chemical reaction but also due to their inherent
mechanical properties of high strength and larger modulus to weight ratio. Table 2.1
shows a ccomparison of composites materials and steel materials (traditional
materials) for 1 m pipe and 6-inch diameter in the offshore environment.
The commercial available composites flanges are suffering from a weakness at the
neck as shown in Fig. 2.6 due to the distribution of the used fabric. So that the
chosen structure of the fabric can contribute significantly to tackle the problem and
reduce flange bending.
Composites materials Steel materials
Weighs 36 Kg/m Weighs 6 Kg/m
The estimated life cycle 7 year The estimated life cycle 20 years
Less corrosion resistant High corrosion resistant
High life cost Low life cost
Low strength to weight ratio High strength to weight ratio
Table 2.1: The difference between composites materials and steel materials for 1
m pipe in the marine environment

Chapter two Literature review
33
Furthermore, a technical report [56], which was titled a technology gap review of
composites in the UK oil and gas industry, has been prepared by Martin for The UK
National Composite Network in 2007. This report indicated that there is a gap in the
research of joints of the composite pipes, which are used for the oil and gas in the
UK. This another reason for selecting this study.
Finally, the other reason that encouraged us for developing this project is the good
support from a local company (Pipex). This company has a wide range of the
experiences in the joints of the composite pipes. Also, they accepted to provide us
some of the required materials and use their machines.
2.7 History of standards development
Over the last few decades, many theories and methods have been proposed about the
design of a flange based on an elastic analysis of the interaction of flange bending
and gasket compression mechanisms. The first method is called Taylor-Forge
method. This method has been developed during 1920s and 1930s by D. B.
Wesstrom and E.O. Waters [57] and published as an Engineering Department
Bulletin by Taylor-Forge in 1951 [58]. Later, it was included in a booklet, Modern
Flange Design, by the same company.
This method is based on using two separate ring gaskets instead of a full face gasket,
one lies outside and the other is in the inside of the bolt circle [16]. Based on Taylor-
Forge method, a number of design codes and standards have been published such as
ASME, CODAP, DIN, JIS and BS [57, 59]. In 1961, Schwaigerer published the
second method using the basic design rules of the full face gasket flange connection
[60]. A third method has been published by Blach et al. in 1986 [61]. These two
methods were based on uneven gasket compression to resist the applied bending of
the flange under the operating condition. For composite flange, section X has been
added in 1968 to the ASME Boiler and Pressure Vessel Code with the following title
“Fibre-Reinforced Plastic Pressure Vessels” [24] . This section, Fibre-Reinforced
Plastic Pressure Vessels, is adopted in this study to design the FRP full face flange.

Chapter two Literature review
34
2.8 Compressed gaskets
When placed between two objects (e.g. flanges) gasket create a static seal,
preventing leakage under various operating conditions such as high pressure and/or
temperatures. Once axial load is applied through bolts, gaskets deform and fill the
microscopic spaces and surface irregularities between the mating flange faces.
Gaskets also compensate for any dimensional changes in the flange geometry caused
by pressure or temperature variations during operation [12]. Depending on the nature
of the applications, gaskets are required to have a number of characteristics such as
good recovery, limited relaxation, good compressibility, face adaptability, high
strength and chemical and temperature resistance. Based on the materials used,
gaskets can be as: metallic, semi-metallic and non-metallic [62, 63] which are
discussed in details in the following sections.
2.8.1 Metallic gaskets
Metallic gaskets are manufactured from one or a combination of more than one
metal with various geometries and sizes. These gaskets are often used for high
pressure and/or high temperature applications thus require bolt loads higher than
those applied for semi-metallic and non-metallic gaskets to ensure high quality
sealing. Ring joint, lens joint and corrugated metal gaskets (Fig. 2.8) are considered
as the dominant types in the current market.
Ring gasket joints are usually fabricated as oval or octagonal cross sections (Fig.
2.8.a) depending upon the geometry of the flange grooves [13, 64]. Various metals
and alloys are used to make the ring gaskets. These materials should be softer than
the materials used for the flange so that the gasket plastically deforms (rather than
the groove) and flows into groove’s irregularities. This deformation occurs due to
high axial bolt load which is applied upon a small bearing area of the ring gasket.
Ring gaskets are mainly used in the petroleum industries for high pressure and
temperature applications that require high integrity sealing and with valves and
pipework assemblies [13, 63].
Lens ring gaskets have spherical sealing faces especially designed to suit mating
flange recesses (Fig. 2.8.b). These gaskets provide high integrity and are used for
high pressure/temperature applications [63]. As for all the metallic gaskets the

Chapter two Literature review
35
materials must be softer than the flange materials. Therefore, the deformation will
occur on the gaskets rather than on the flanges when compressive load is applied.
Both the compressive load and some of the hydrostatic pressure force increase the
contact pressure between the flange and the gasket to insure the sealing
Corrugated metal gaskets are divided mainly into two categories, which are
corrugated gasket without layers or corrugated solid metal and corrugated gaskets
with soft layers. The corrugated gaskets without layers can be made like flat, tongue,
groove and sectional ones. They are preferred in the applications that require
mechanical strength, good thermal conductivity as well high corrosion resistance and
high pressure [13]. The corrugated gaskets with soft layers are usually covered with
soft layers on both sides. However, based on the sealed medium, additional layers
can be used with uneven or distorted sealing surface. These layers are made of
graphite, ceramic or PTFE materials. These type of gaskets are suitable with low
pressure and higher temperature applications with acids, oils and chemical mediums.
Fig. 2.8.c illustrates the corrugated gaskets with soft layers.
Finally, most of the metallic gaskets are not common gasket with the FRP bolted
flanged joints, which require a soft gaskets such as rubber gaskets.
(c)
(a)
Octagonal Oval
(b)
Fig. 2.8: Metallic gaskets (a) Ring joint gasket (b) Lens ring gasket
(c) Corrugated gasket

Chapter two Literature review
36
Żyliński [45] performed a numerical analysis of bolted flange connection using an
aluminium gasket. FEA has been developed to model the bolted joint with special
elements, hexahedral 21-node and 28-node isoparametric, for the contact zone. Due
to the cyclic symmetry of the joint, a 1/16th portion of the bolt joint has been
modelled. The effect of internal pressure in the gap between the gasket and the
arising flange was taken into account during the progression of joint opening.
Experimental results were used for comparison. The results reveal that the contact
pressure is increased along the gasket radius direction but it is decreased as the
internal pressure is increased. Apparently, there is no clear difference between the
results for 21-node and 28-node elements. In addition, the working load (internal
pressure) has insignificant influence on the pre-bolt load, but the pre-bolt load has a
decisive effect on the maximum permissible internal pressure. On the other hand, the
maximum permissible internal pressure was independent of the gasket thickness.
Furthermore, the maximum von-Mises stress is observed at contact surfaces between
the bolt head and the flange.
2.8.2 Semi-metallic gaskets
Semi-metallic gaskets consist of both metallic and non-metallic materials. The
metallic portion provides the strength to the gaskets while the non-metallic part is
intended to offer resiliency, conformability and sealability. These types of gaskets
are used for various operating conditions and can generally be used at higher
pressures and temperatures than the non-metallic gaskets [62]. Mainly, semi-metallic
gaskets are used with most types of the flange such as raised face, tongue and groove
and male and female flange.
The spiral wound gasket (SWG) is one of the important semi-metallic types. This
gasket is a composite structure of metal strip, sealing strip of fillers and outer/inner
steel rings as shown in Fig. 2.9.a. The mechanical properties of the SWG are
dominated by the metal spiral strips which are usually stainless steel. Therefore, the
SWG has a good resilience and recovery due to V-shape of the metallic spiral strip.
Also, it meets the most accurate conditions for both loads; temperature and pressure
in the flange joint and has a good resistance in corrosive and toxic mediums.
However, complete parallel flange faces are required to install it [63, 65, 66].
Krishna et al [59] had carried out a comparison of the gasket’s influence on the

Chapter two Literature review
37
sealing performance of a bolted flange. A three-dimensional FE model of bolted
flange connections with gaskets has been developed and analysed using ANSYS.
Spiral wound gaskets with various filling such as; asbestos (AF), graphite (GF) and
PTFE (TF) filled have been used with their nonlinearity characteristics obtained
from experiments. The results show that the distribution of the contact stress is non-
uniform in the radial direction across the gasket width and depends on both the
gasket type and the flexibility of the flange. These factors are not accounted by the
ASME code, so the leakage may occur even at the flange rotation of less than 3 ͦ that
is specified by ASME. The highest and the lowest axial bolt force have been
observed with TF and GF gaskets respectively when the internal pressure is
increased. This is due to low and high stiffness of TF and GF gaskets respectively. It
is also apparent from the results that the TF spiral wound gasket has the least
variations in the contact stress distributions whereas the GF spiral wound gasket has
an opposite trend.
Omiya et al. [34] have studied the influence of non-linear characteristics of non-
asbestos and asbestos spiral wound gaskets (SWG) on the sealing performance.
Contact stress distribution has been calculated and the leak rate has been examined.
It has been found that the radial variations of gasket stress distributions with a
smaller nominal diameter of the flange joint (around 3 inch) are smaller than those
with a larger nominal diameter (around 20 inch). In addition, the sealing
performance with smaller nominal diameter and non-asbestos gasket is better than
those with larger nominal diameters and asbestos gaskets.
The metal jacketed gasket consists of a metallic shell that surrounds either metallic
or non-metallic compressed filler (Fig. 2.9.b) The metal jacket provides blow out
resistance and resists the pressure, temperature and corrosion, whereas the filler
provides the gasket resilience and compressibility. Generally, this type of gasket is
used with heat exchangers, pumps and valves. However, it requires flatness of flange
with smooth surface finishes and high bolt loads.
Another type of semi-metallic gasket is named as Kammprofile (grooved) gasket.
This gasket consists of a metal ring (outer) made of steel. Kammprofile ring with
concentring grooves made of steel, sealing and sealing layers made of either graphite
or PTFE or even metals (e.g. aluminium and silver) as shown in Fig. 2.9.c..

Chapter two Literature review
38
Kammprofile gaskets are used for high pressure and temperature applications such as
power plant, nuclear industries, heat exchanger and pipelines. However, it is very
expensive and could be damaging to the flange faces if it is used without soft
covering layers and/or subjected to a high bolt load. The Kammprofile gaskets have
the same concept of the metal reinforced gasket which consists of core material and
two soft layers covering the faces.
(c)
(a)
(b)
Fig. 2.9: Semi-metallic gaskets (a) Spiral wound gasket (b) Metal jacketed gasket
(c) Kammprofile gasket

Chapter two Literature review
39
2.8.3 Non-metallic gaskets
Non-metallic gaskets are usually fabricated as composite sheets and then punched
according to the required geometry. Often, these gaskets are used in low to medium
pressure applications. However, these gaskets could be used for extreme chemical
environment and temperature if chosen correctly. Non-metallic gaskets are suitable
for the use with flat face flange and raised face flange. The advantages of these
gaskets are: good chemical resistance, low bolted load is required, they can be
deformed easily and fill the irregularities of flange faces to keep the seal and do not
require the flange surfaces to be perfectly finished. However, the blowout resistance
for these gaskets is low. Depending on the types of materials used, non-metallic
gaskets are classified into the following types: PTFE, rubber, graphite and fibre
reinforced gaskets.
PTFE gaskets have good chemical resistance. These types of gaskets are easy to
adapt perfectly to the flanges and have good ability to maintain the sealing.
Furthermore, these gaskets have excellent isolation properties. However, there are a
few drawbacks, for example, poor mechanical properties, creep and limited
temperature resistance. Moreover, PTFE gaskets are not suitable to use with fluorine
gas and Melton alkali metals.
One of the most common non-metallic gaskets is rubber such as EPDM, Neoprene,
Nitrile, Viton and Silicone. EPDM and Neoprene gaskets are widely used throughout
the water industry due to excellent resistance to water, steam, heat, weathering,
chemical, mechanical and wear. Nitrile gaskets are mainly used in the oil industries
and have high resistance to aliphatic hydrocarbon oil.
Viton gaskets have excellent resistance to chemical attack by oxidation and are
widely used in the chemical industries. Also, these gaskets have good resistance to
oil at low temperature and hot air. These gaskets are not influenced by sunlight and
ozone. However, the resistance is weaker against steam, aliphatic and aromatic
hydrocarbons. Therefore, the Nitrile and Viton rubber gaskets have been chosen in
this study.
Graphite gaskets are usually reinforced with a stainless steel insert. These gaskets
have good corrosion resistance is excellent against a wide variety of acids, alkalis,
salt solution, organic components and heat transfer fluids even at high temperatures.

Chapter two Literature review
40
Furthermore, graphite gaskets are used in oxidizing conditions at temperatures from -
200˚C to +500˚C. However, these gaskets are affected by sulphuric and phosphoric
acids, and it is recommended to avoid using this type of gasket in such cases.
Fibre reinforced gaskets are usually manufactured as sheets and then cut or punched
depending on the required shape and size. These sheets consist of three components,
fibres, fillers and binders. The quality and the properties of the gaskets are dependent
on the properties of these components as well as production processes. The fibres
aramid, carbon, cellulose, glass and mineral fibres are often used as reinforcement
fibres and NBR (Nitrile Butadiene Rubber) is most commonly used as a binder.
Generally, fibre reinforced gaskets are cheap and easy to cut or punch to obtain the
required size but the temperature resistance is low because of the rubber binder.
Shoji and Nagata [37] presented FE analysis of a raised flange with nonlinear gasket
using a 2D axisymmetric and 3D solid element FE models. Based on the load
condition, the analysis has been carried out in two steps- pre-load and pressurized.
Due to the nonlinearity of the gasket, they have used two values of modulus of
elasticity (compression and decompression) depending on the states of the gasket
whether in compression or decompression. Results of the numerical simulations
indicate that the gasket stress increased from the inner radius toward the outer radius
of the gasket for both the 2D and the 3D models, and the stresses are higher in pre-
load condition than in pressurized condition.
2.9 The characteristics composite pipes commonly used with flanges
Filament winding technology is the most favourable process for the manufacture of
FRP pipe because of its high rate of productivity. Therefore, the use of these pipes
has been increased in various applications alongside the further development of this
technology [67, 68]. Xia [69] developed an analytical procedure to assess the
influence of stacking sequence for the multi-layers filament wound structures using
three-dimensional (3D) anisotropic elasticity theory. Three specific carbon
fibre/epoxy angle-ply pipe designs, A [+55/-55/+55/-55], B [+55/-55/+30/-30] and C
[+55/-30/+30/-55], were analysed. All these pipes were tested under internal pressure
and the stress, strain and displacement distributions calculated. The pipe of type A
has almost constant hoop and axial stresses through the thickness and its hoop to

Chapter two Literature review
41
axial stress ratio is 2. However, types B and C show discontinuous variations of the
hoop and axial stresses at the interface laminas and their hoop to axial stress ratio is
no longer constant. In terms of shear stress, all three types show discontinuities, but
the smallest range was with type A. Moreover, all three types exhibit continuous
variations of hoop strain and the smallest values are observed with type A.
Furthermore, only types B and C show discontinuous radial strain and the variation
is higher with +/-55 lay-up angle than that of +/-30 lay-up angle. The radial
displacement is not affected significantly by the stacking sequence whereas the hoop
rotation depends largely on the stacking sequence, especially for type C.
Merting et al. [70] carried out an experimental investigation for tubular filament-
wound structures which were made using a state of the art production method. Three
winding angles ±30, ±45 and ±60 were utilized for winding eight tows of Owens-
Corning E-glass fibre. The specimens were tested under internal pressure and axial
force. The results indicate that the multi-angle wound pipe exhibits overall better
performance in resisting damage compared to the ±60 angle-ply lay-up.
Meijer and Ellyin [71] conducted a study of the strength of [±60˚3]T glass fibre
reinforced epoxy tubes to produce a baseline failure envelope when they subjected to
multiaxial stress. These pipes are manufactured by filament winding and tested under
14 different ratios of hoop to axial stress. These stresses are the consequences of
applying internal pressure together with tensile and compressive axial loads.
According to the results, they observed five distinct modes of axial tensile structure
failure such as weepage, local leakage, burst and axial compressive failures. They
also developed the maximum strain failure criterion that was fitted to the failure
strain data but was observed to be unsatisfactory for two regions of the data.
Moreover, it is found that when the local leakage failure occurred under an axial
compressive stress, the maximum strain failure criterion over-predicted the strength
at the stress ratios.
Onder et al. [72] studied the influence of winding angle and temperature on the burst
pressure of the filament wound composite pressure vessel. They utilized FEM,
experimental approaches and an elastic solution procedure developed based on
Lekhnitskii’s theory to verify the optimum winding angle. In addition, the Tsai-Wu
failure criterion, maximum stress and strain theories were used to predict the burst

Chapter two Literature review
42
pressure of tubes, which were tested under the closed-ended condition. The glass
fibre reinforced (GRP) pipes were manufactured with four layers, which were
oriented symmetrically and anti-symmetrically at [+45˚/-45˚]s, [+55˚/-55˚]s, [+60˚/-
60˚]s, [+75˚/-75˚]s and [+85˚/-85˚]s. They concluded that the optimum winding angle
of the composite pressure vessel under internal pressure loading should be +/-55˚.
Hygrothermal loading has insignificant influence on the burst pressure, whereas it is
affected significantly by temperature, especially at high temperatures. Arikan [73]
conducted a failure analysis of filament wound composite pipes with an inclined
surface crack under static internal pressure. The pipes were made from glass/ epoxy
with antisymmetric layers at (±55o)3 winding angles with different angles of the
cracks. According to the results, the burst pressure increases with the increase in the
crack angles. The delamination area also increases with an increase in both the burst
strengths and the crack’s angles.
Based on the above findings and the others, the optimum winding angle of filament
wound composite pipes subjected to internal pressure is +/-55˚ which leads to
produce equal circumferential and axial stresses [8]. Therefore, a filament winding
pipe with ±55˚ winding angle will be used to test the flange in this study.
2.10 Co-bonding of composite flange with composite pipe
The use of adhesive bonding methods with very large and complex composite
structures [74] made of similar or dissimilar materials is continuously increasing.
The parts of such complex structures are usually manufactured separately and
bonded using adhesives to reduce labour and fabricating costs [75, 76]. Both the
adhesive properties and the joining methods significantly affect the performance and
the behaviour of adhesively bonded composite structures [77]. In many applications,
traditional mechanical joints with fasteners have been replaced by adhesively bonded
joints because of its advantages; these include fast and unexpansive joining
techniques, uniform stress distribution over large area without holes (holes cause
stress concentration) and high dynamic strength [78-81].
For the FRP flange-pipe joint, industry prefers the convenience of adhesive bonding.
The bonding technique is generally divided into three categories: Taper-taper,

Chapter two Literature review
43
straight-taper and straight-straight joint [82]. There are a few other types which can
also be used, however, these are the most common (Fig. 2.10).
1. Taper-Taper joint: the inner diameter of fitting or flange bell or socket is tapered
and the outer diameter of the end of the pipe is also tapered (shaved). Then, they are
matched and joined by a thin glue line and no integral pipe stop is required. Due to
the largest contact area between the matching components, taper-taper joint is
considered the strongest option. However, this type of joint requires more
manufacturing time compared to the others.
2. Straight- Tapered joint: the flange bell, fitting, or socket is tapered internally and
the end of the pipe is shaved with uniform outer diameter (i.e. straight pipe end). A
thin glue line is not often achieved and this results in lower joint strength. However,
the required installation time is less than the taper-taper joint.
3. Straight –Straight joint: the end of the pipe is prepared with straight shave or
standing, and the flange bell or fitting or socket has no tapered surfaces. The main
advantages of this type of joint are shortest fit up time requiring fewer tools.
However, this type of adhesive joining technique offers medium strength and it
requires an integral pipe stop. [82]
Fig. 2.10: Three different types of flange-pipe adhesive bonded joint
Straight–Straight Joint
Taper–Taper Joint Straight–Taper Joint
[82]
.

Chapter two Literature review
44
Nemes [83] examined the adhesive bonded joints for pipes made from different
materials (hybrid materials) like titanium, aluminium and carbon/epoxy. They
discovered that the maximum values of orthoradial stress (θθ) exist on the free edges
of adhesive and the shear stress has two peaks that are located at equal distances
from the free ends. Moreover, the shear stress (τrz) decreases with the length of
overlap which has an optimum dimension of 80 mm. Furthermore, increasing the
thickness of the adhesive has a positive effect on the orthoradial stress but reduces
shear stress values.
Yang [14] studied the design of adhesive joint for composite pipes which is
subjected to tensile loads. It has been found that the maximum peel and shear
stresses occur at the free edges of adhesive length but both stresses are nearly zero in
elsewhere. The optimal lengths of the joints are 65 mm and 90 mm for 54º wound
pipe and 20º coupling respectively.
Cheng [84] presented a study about adhesive bonding for smart composite pipes by
using piezoelectric layers within composite layers of coupler under tensile loading.
The piezoelectric layers work as a sensor for the deformation produced by the
applied mechanical load and provide signals which are used to calculate the peel and
the shear stresses. According to the results, maximum peel and shear stresses are
located at the edges of adhesive layer. The optimal design conditions could be
achieved by choosing suitable piezoelectric materials.
Oh [85] investigated the tubular adhesive joint for the steel-composite adherents
piping under thermal expansion and mechanical torsion. A finite element was
utilized to calculate the thermal residual stresses generated by the cooling of the joint
from 80 ºC to 20 ºC. It has been discovered that the torque transmission capability
increases with the increase of stacking angles up to ±25 degrees and then decreases.
Thermal stress has a significant effect on the adhesive joints. Oh [86] in a separate
article discussed the torque capacity of tubular adhesive joints with different
composite adherent. It has been illustrated that the steel-carbon/epoxy joint is much
affected by the thermal stress compared with the steel-glass/epoxy joint, so at a
stacking angle ϕ = 45 the failure might occur due to thermal stress only even
without any external loads. The strength of steel-carbon/epoxy is lower at high

Chapter two Literature review
45
values of ϕ. However, the strength of steel-glass/epoxy joint increases with ϕ.
However, the effect of residual stress reduces when ϕ is increased.
Kumar [87] has presented a study of tubular adhesive bonds with functionally
modules graded bond line (FMGB) and mono-modules line (MMB) under tensile
loads. Based on the findings, it can be said that the peel and shear stress peaks of
FMGB are much smaller than those in state of mono-modules adhesive joint under
the same load conditions. Spaggiari and Dragoni [88] have carried out an analytical
investigation on the tubular lap bonded joint under torsion to regularize the torsional
stresses by using functionally graded modulus adhesive (FGA). The aim of that is to
change theoretically the elastic properties of the adhesive as a function of the
reinforcement inside the bond line. This will allow to minimize the stresses
considerations which are usually high at the edges.
EDO [82] performed comparative studies of butt and strap joints with adhesively
bonded joints (taper-taper joint, straight-taper joint and straight- straight joint). All
the joints were experimentally tested under various loads such as tensile, bending,
allowable wind loads and thermal load. The results have shown that the butt and the
strap joints are stronger than all other types of adhesively bonded joints when
subjected to environmental loads. Results from bending and tensile tests have shown
that taper-taper joint has a superior strength over other types of adhesively bonded
joints. However, taper- taper joint is slightly weaker under thermal and wind loads.
2.11 Fasteners of flange joint
In most flange and gasket joints, fasteners apply the compressive pressure on the
gasket through flanges. The main function of these fasteners is to clamp the
connection sufficiently for maintaining the seal and preventing the slip of the gaskets.
Therefore, the fasteners must be made of strong materials to keep the tension that is
induced on the initial preload as well as the additional loads that are induced during
the operating condition due to the internal pressure, temperature and corrosion. To
achieve a successful installation, all components of the flange assembly should be
taken into account by the designers. However, one of the most neglected components
in the joining process is the fasteners and this negligence results in frequent joint
leakage. Hence, the principal fastener components such as bolts or studs, nut and

Chapter two Literature review
46
washers should be chosen carefully depending on the application requirements. On
the other hand, the bolt load should be applied correctly as one of the major
weaknesses in the FRP flange industry at the moment is that most FRP
manufacturers publish torque values but with no bolt load or lubricant on which they
are based. This creates confusion/ignorance at installation resulting in cracking of
flanges at one end or leakage of gaskets at the other.
The bolt is a threaded fastener with a nut at each end. Since the performance of the
seal is dependent upon the level of the tension in the fasteners, ASME recommends
applying a preload of 40% to 70% of a bolt’s yield stress. Therefore, the materials
should be chosen with a good safety factor based on the application conditions. The
standards also recommend that the number of fasteners should be chosen in such a
way that the distribution of pressure across the gasket remains as uniform as possible.
Due to the flange bowing, the compression stress of the gasket is greater near the
fasteners’s holes.
Nuts are always associated with fasteners of flanged joints in which finished hex
nuts and heavy hex nuts are most commonly used. Heavy hex nuts are slightly
thicker and larger than finished hex nuts and used with high temperature and high
pressure applications which require high axial forces. This load is generated by
tightening nuts along the threads of the fasteners, so the threads play a major role in
clamping operation. To avoid stripping these threads, it is necessary to choose
fasteners and nuts with sufficient size, materials strength and length of engagement.
The other problem between fastener components that should be avoided is galling,
which is a cold welding (partial or full) and occurs between the mating faces that are
under high loads due to the molecular bonds between them. To avoid this problem, it
is recommended to use correct lubricant, coarse thread surfaces rather than fine and
appropriate fastener components materials that are resistant to galling.
Washers are very important in bolted flange joints. They are recommended with FRP
joints to distribute the applied loads of the bolts around the bolt holes. Consequently,
a more even gasket load will be achieved, reducing potential leak paths of contained
media. In addition, the use of washers is to protect the nut seating area and improve
translation of torque inputs into bolt preload during the tightening process by
reducing the friction between the turning nut and joint components resulting more

Chapter two Literature review
47
accurate torque readings when using a torgue wrench. Moreover, washers prevent
embedding the nuts against the flange faces or inside the fasteners holes, thus the
damage at joint surfaces.
2.12 Issues with drilling of composite materials
As the field of composite applications expands, the need for various types of
machining such as drilling, milling, turning and cutting have increased. For example,
it has been reported that over 100,000 holes [89] are made for a small single engine
aircraft so in a large transporter aircraft, millions of holes are made. Consequently,
drilling account for as much as 40% for all machining processes [90]. It has been
found that the FRP flange with drilled bolt holes performs better in terms of strength
than those with moulded holes [91]. However, drilling is a complex process and
requires better understanding of drilling composites because of the inhomogeneous
and anisotropic properties [92]. Typical damage in composites after drilling include
peel-up and push out delaminations [93-95] as shown in Fig. 2.11, intralaminar
cracking, fibre/matrix debonding and thermal damage by the heat produced during
drilling. The most serious defect is delamination as it leads to decrease the load
carrying capacity of composite laminates [96]. Delamination generally occurs
between adjacent laminas. Therefore, the properties of resin and the fibre as well as
its configuration play important roles in its occurrence. [92]
Fig. 2.11: Delamination (a) Peel-up delamination (b) Push-out delamination
(b) (a)
[92]

Chapter two Literature review
48
It is worth mentioning that peel-up delamination occurs due to the cutting force
when the drill starts to abrade the laminate. This is because an upward peeling force
is created with the forward movement of the drill. This force tends to separate the
upper laminas from the uncut portion held by the downward thrust force. The value
of this force depends on the friction between drill and composite and drill tool
geometry [96, 97]. On the other, the push-out delamination is caused by the
compression, which is applied on the workpiece by the drilling tool. This force
pushes and breaks the interlaminar bond between adjacent laminas in the regions
around the hole. At some point, the push-out delamination will occur when the uncut
portion becomes smaller and its resistance of the deformation is decreased and the
thrust force exceeds the bond strength between the composite layers. Thereby, the
adjacent layers at the bottom surface of the laminate are deboned before completing
the drilling process. In order to avoid delamination, it is recommended to reduce the
thrust force by changing the geometry of the drill tools [96, 97].
Tagliaferri et al. [98] conducted an experimental investigation about drilling of
composite panels, which were made of six layers of glass fabric VR 181/ epoxy
prepreg with autoclave curing. High speed steel (HSS) tool of 8 mm in diameter has
been used with cutting fluid but without backing. The experimental results show that
the damage extent is significantly affected by the cutting parameters. Increasing the
cutting speed shows less damage extent whereas higher feed speed leads to poorer
cut quality. They also observed that the damage extent does not influence the tensile
strength of GFRP laminate that contains the holes. They have recommended that the
optimal cutting speed/feed speed ratio can be obtained for maximum bearing
strength by lowering the drilling speeds.
Khashaba [99] has carried out a study for randomly oriented GFRP laminates to
evaluate the influence of the varying fibre volume fraction (Vf) and drill size on the
notched tensile strength and pin bearing strength. The results indicate that the fibre
volume fraction plays a significant role on the notched tensile strength, pin bearing
strength and stress intensity factor. Due to the important effect of the ratio of
randomly oriented GFRP laminate to drill diameter, it is recommended that this ratio
must be greater than 5 for the development of full bearing strength.

Chapter two Literature review
49
In a separate work, Khashaba [94] carried out an experimental study to determine the
influence of the drilling variables and material variables on the thrust force, torque
and delamination of GFRP (thermoset) composites. The drilling variables considered
are cutting speed and feed rate whereas material variable involved fibre shape, filler
and matrix type such as cross-winding/polyester, continuous-winding with
filler/polyester, chopped/polyester, woven/polyester and woven/epoxy composites.
In this study, a more accurate but inexpensive technique for measuring the
delamination size within 10-3 mm has been demonstrated. The results have revealed
that the sand filler in the continuous–winding composite raises the values of cutting
forces and push-out delamination and increases further with increasing cutting
speeds. In contrast, the push-out delamination decreases with an increase in cutting
speeds for drilling cross-winding, woven and chopped composites. This happens due
to a decrease in the thrust force. It is worth noting that the woven fabric composites
have higher push-out delamination than that made of chopped fibres. For the same
fibre shape (woven), the matrix has significant influence on the delamination and the
torque. Both the peel-up and the push-out delamination as well as the torque of
woven/polyester composite are higher than that for woven/epoxy composites. The
thrust forces in drilling continuous-winding composite are more than three orders of
magnitude higher than those in the cross-winding composites. During drilling both
the chopped and the continuous-winding composites; delamination, chipping and
spalling damage mechanisms were observed, however, the delamination was
observed at different edge position angles with drilling woven composites.
Davim et al. [100] have studied the effect of cutting parameters (cutting speed and
feed rate) and drill geometry on the thrust force, damage, surface roughness and
cutting pressure. Two different types of 5 mm diameter drills (helical flute ‘‘Stub
Length’’ and brad & spur) as illustrated in Fig. 2.12 have been used to drill a disc
made of GFRP material using a hand lay-up process. They have also utilized analysis
of variance (ANOVA) and Taguchi technique for identifying the impacts of drilling
conditions. Based on their experimental findings, they have concluded that both the
specific cutting pressure and the thrust force have been significantly affected by the
cutting parameters. Damage increases with cutting speed and the feed rate. On the
other hand, the cutting speed has the highest influence on the surface roughness. It

Chapter two Literature review
50
has also been observed that better cutting performance could be achieved with the
Bard & Spuer tool than the Helical flute ‘‘Stub Length’’.[100]
Abrao et al. [101] carried out comprehensive investigations to identify the influence
of drill geometries on the drilling performances of GFRP composites. A number of
drills (EDP27199, A1141, A1163 and A1167A as can be seen in Fig. 2.13) have
been used and the effect of the cutting parameters has been investigated. Results
from this work indicate that the lowest and the highest thrust forces could be
obtained from EDP27199 and A1167A drills respectively. The thrust force increases
as the feed is increased and this happens due to the elevation in the shear area. The
effect of cutting speed on the thrust force can be considered as negligible. The least
damage on the laminate has been observed with tool drill EDP27199 which provides
lowest thrust force. The second smallest delamination area has been found with drill
tool A1167A with the highest thrust force. The damaged area increases considerably
with feed rate and moderately with cutting speed.[101]
Fig. 2.12: (a) Helical flute ‘‘Stub Length’’ K10 drill; (b) ‘‘Brad & Spur’’ K10 drill [100]
Fig. 2.13: Drills used in the experimental work: (a) EDP27199, (b) A1141,
(c) A1163 and (d) A1167A [101]

Chapter two Literature review
51
Tsao [90] investigated the drilling of carbon fibre reinforced plastic (CFRP)
laminates using three types of step-core drills (step-core twist drill, step-core saw
drill and step-core candle stick drill) as shown in Fig. 2.14. The study examined the
effects of drilling parameters such as diameter ratio, feed rate and spindle speed on
the thrust force. By analysing the variation of these types of drills and their drilling
parameters, it has been concluded that the step-core saw drill offers the highest
drilling thrust force compared to the other step-core drills and the thrust force is
influenced significantly by the selected cutting parameters. The thrust force has
inverse relations with both the diameter ratio and the spindle speed but has a
proportional relation with the feed rate. It has been concluded that a combination of
low feed rate (e.g. 8 mm/min), high spindle speed (e.g. 1200) rpm and the high
diameter ratio (e.g. 0.74 mm/mm) could be the best experimental condition of
drilling CFRP with various step-core drills.[90]
Finally, the GFRP laminate of the flange will be drilled to create the holes of the
bolts with high cutting speed/feed rate ratio to minimize the damage of the
composite flange. In addition, Brad & Spur’’ K10 drill or EDP27199 drill tool has
been recommended for the drilling holes. It will be compared with other drill tools to
choose the best for this project.
Fig. 2.14: Photographs for various step-core drills [90]

Chapter two Literature review
52
2.13 Summary
Metallic bolted flange joints (BFJ) are heavy and susceptible to corrosion in the
presence of water and other liquids. Fibre reinforced polymers (FRP) are an
alternative material, but relatively little published work on their design and
manufacture has been found. In addition, agreed standards and relevant design codes
for bolted FRP flange joints appear to be inadequate. Currently, used design
procedures are modified forms of metallic design methods, which neglect the unique
characteristics of composite laminates. The manufacturing process, together with the
reinforcement and laminate specification, are not defined adequately, although they
affect the strength of the flange. This has resulted in the failure of some of the
current BFJ designs, which are available in the market. Furthermore, the mismatch
between the mechanical properties of metallic flange and composite pipe can result
in weak points in the structure of pipelines – differential thermal expansion can be
avoided by using a composite flange, and this is especially important in high
temperature applications.
Other areas that need more investigation include the composite pipe-flange adhesive
bond, which is subjected to an unsymmetrical load around the axis of the pipe, due to
the bolt loads as well as the internal pressure. Optimizing the composite drilling
parameters could produce bolt holes with less damage. The rubber sealing gasket
plays an important role in the joint performance, and an understanding of its
nonlinear behaviour and its influence on leakage propagation is required so that
material selection can be optimised.
Next chapter includes design parameters of the bolted flange joint and the
comprehensive analytical approach of the ASME code, which is used in this project.

Chapter three Design & analysis
53
CHAPTER THREE
DESIGN & ANALYSIS
3.1 Introduction
During analysis of the bolted flange connection, there are several design parameters
affect the performance of the flange joint and they should be taken into account.
These parameters can be divided into three groups: (1) flange dimensions and
materials, (2) gasket type and thickness and (3) applied loads. Selecting the
parameters that have significant effects is very important for the current project.
Therefore, among the above groups, several important parameters have been chosen
in this study to obtain a bolted flange joint with high quality and performance for the
oil and gas applications. Most of these parameters have been determined by the
ASME Boiler and Pressure Vessel Code, Section X, but they will be varying to
investigate their effects and the possibility of reducing the flange dimensions and the
materials, which lead to reduce the flange cost. The ASME approach was modified
from its counterpart of the metallic flange codes, which neglect the composite
material behaviour. In addition, the analytical approach of ASME code, which is
explained in this chapter, does not take into account of the mechanical properties of
the composite material and the type of manufacturing process. However, it has been
used as a benchmark to develop further investigations.

Chapter three Design & analysis
54
The present chapter includes the explanations of the selected design variables,
constants and the parameters, which have been neglected. In addition, it contains
comprehensive analytical approach of the ASME code for the bolted flange joint
made of composite materials.
3.2 Design variables
In this study, various variables are considered for improving the design of the bolted
flange connection. These variables include flange dimensions (flange and hub),
gasket materials and thickness and applied loads (bolt load and internal pressure).
See Fig. 3.1. These parameters are used as design factors and the other, which will
be discussed in section 3.3, are applied as fixed parameters. The variable parameters
are selected due to the expectation of their significant influences in obtaining a high
performance GFRP bolted flange joint system in terms of; durability, cost, lifetime
and good corrosion and chemical resistances, which represent a big problem for the
metallic flanges, during the operating conditions. These factors are discussed in the
following sections.
Fig. 3.1: Schematic diagram of the flange joint

Chapter three Design & analysis
55
3.2.1 Flange dimensions
Flange dimensions mean the dimensions of the flange disc; thickness and the outer
diameter as shown in Fig. 3.1. These dimensions have significant effects on the
flange deformation, flange bending, strain distribution, flange rotation and the
leakage pressure. Minimizing these dimensions can lead to reduce the required
materials, thereby the material cost of the flange joint.
3.2.2 Hub dimensions
Similarly, hub dimensions include two parameters; hub thickness and hub length,
which are illustrated in the Fig. 3.1. The flange bending is affected significantly by
the hub thickness, especially at the flange-hub intersection when the bolt load is
applied. High strain concentration usually occurs at this area and it represents the
weakest points for the current commercial flanges. For the hub length, it affects
mostly on the axial and hoop strains as well as the required materials and the pipe
machining. Therefore, the effect of the hub dimensions will be investigated in this
study to find out the possibility of reducing them while keeping sufficient required
strength and thickness of the flange joint.
3.2.3 Gasket material and thickness
As mentioned earlier, Nitrile and Viton rubber gaskets have been chosen for this
study with two thicknesses (3 and 5 mm) to investigate their impacts on the joint
performance. These types of the rubber gaskets are usually used for the oil and gas
industries. Furthermore, their non-linear behaviours during the loading and the
unloading conditions have been taken into account in the FE analysis of this study.
Therefore, the relationships between the flange strains in three directions (axial,
hoop and radial) and the leakage pressure with the gasket material and thickness
have been investigated in this project.
3.2.4 Bolt load
Initial clamping of the flange pairs is done by the axial bolt force, which is the main
load in the bolt up conditions. The impact of this force on the flange performance,
strains distribution, axial displacement, flange rotation and leakage pressure
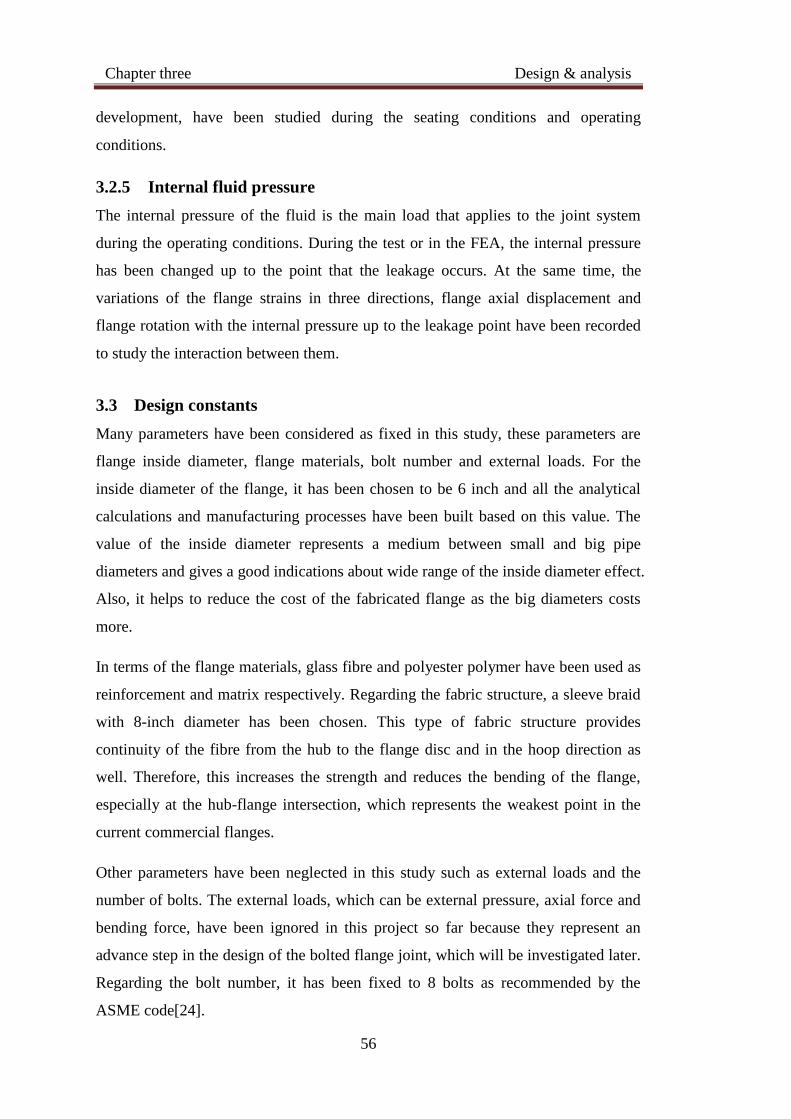
Chapter three Design & analysis
56
development, have been studied during the seating conditions and operating
conditions.
3.2.5 Internal fluid pressure
The internal pressure of the fluid is the main load that applies to the joint system
during the operating conditions. During the test or in the FEA, the internal pressure
has been changed up to the point that the leakage occurs. At the same time, the
variations of the flange strains in three directions, flange axial displacement and
flange rotation with the internal pressure up to the leakage point have been recorded
to study the interaction between them.
3.3 Design constants
Many parameters have been considered as fixed in this study, these parameters are
flange inside diameter, flange materials, bolt number and external loads. For the
inside diameter of the flange, it has been chosen to be 6 inch and all the analytical
calculations and manufacturing processes have been built based on this value. The
value of the inside diameter represents a medium between small and big pipe
diameters and gives a good indications about wide range of the inside diameter effect.
Also, it helps to reduce the cost of the fabricated flange as the big diameters costs
more.
In terms of the flange materials, glass fibre and polyester polymer have been used as
reinforcement and matrix respectively. Regarding the fabric structure, a sleeve braid
with 8-inch diameter has been chosen. This type of fabric structure provides
continuity of the fibre from the hub to the flange disc and in the hoop direction as
well. Therefore, this increases the strength and reduces the bending of the flange,
especially at the hub-flange intersection, which represents the weakest point in the
current commercial flanges.
Other parameters have been neglected in this study such as external loads and the
number of bolts. The external loads, which can be external pressure, axial force and
bending force, have been ignored in this project so far because they represent an
advance step in the design of the bolted flange joint, which will be investigated later.
Regarding the bolt number, it has been fixed to 8 bolts as recommended by the
ASME code[24].

Chapter three Design & analysis
57
3.4 Analytical design analysis (based on the ASME code)
The first ASME Boiler and Pressure Vessel Code was issued in 1915. This code was
published as one volume and was later divided into many sections. Other sections
were added or deleted as well as some of these sections were divided into many
divisions.
In 1968, section X was added to the ASME Boiler and Pressure Vessel Code with
the following title “Fibre-Reinforced Plastic Pressure Vessels”. This section included
the design method calculations of the FFG flange made of fibre reinforced plastic
materials that allowed for the design engineers to obtain a safe flange design.
Therefore, it is necessary to review briefly the theoretical calculations of this code.
This design method has been developed based on the following conditions: in the
operating conditions, it should resist the hydrostatic force, and also the gasket must
be placed under adequate compression stress to keep the tightness of the joint. In the
gasket seating (Bolt-up) conditions, the compression required to seat the gasket is
completely governed by the gasket material’s properties, bolt cross section area and
contact area [35]. The following sections will describe the theoretical approaches of
the flange design.
3.4.1 Full face flange geometry
Due to the axisymmetric nature of the flange around the axial axis, half of the full
face flange geometry is drawn as can be seen in Fig. 3.2. The nomenclatures of the
flange dimensions are the same as the nomenclatures of the ASME code [24].
Fig. 3.2: FFG Flange geometry

Chapter three Design & analysis
58
3.4.1.1 Effective gasket diameter
The effective gasket diameter (𝐺) represents the diameter of the circle on which HG,
the difference between bolt load and hydrostatic end force, acts.
𝐺 = 𝐶 − 2ℎ𝐺 . . . (3.1)
Where ℎ𝐺 is the radial distance from bolt circle to circle on which HG acts
ℎ𝐺 =(𝐶 − 𝐵)(2𝐵 + 𝐶)
6(𝐵 + 𝐶) . . . (3.2)
3.4.2 Gasket loads
The design of the flange must create adequate compression load on the gasket to
achieve a good sealing during the operating conditions. Gasket and their behaviour
play an important role in the sealing performance, so the gasket must be sufficiently
compressed by the flange to compensate internal voids or space, which might lead to
leakage. To design a bolted flange joint, the designer needs to know the gasket
constants. As shown in Table 3.1, these constants are y (seating stress) and m (gasket
factor), which are used in the calculations of the bolted flange design. The seating
stress (y) is defined as the minimum gasket stress required for achieving the initial
sealing.
To find the required compressive load on the gasket to keep the tightening, the
gasket factor (m) is used when the joint system is pressurized. This factor is
employed to ensure that the flange has sufficient strength and bolt load to maintain
the joint tightness when withstanding the force effect due to the internal pressure.
The hardness (Shore A) of the rubber gaskets used in the study is 75. Due to the
compression load on the gasket, the gasket will produce reaction forces and these
forces are discussed below.
Gasket material Gasket factor
m
Min. Design Seating Stress y
Pis (MPa)
Below 75A Shore Durometer 0.5 0 (0)
75A or Higher Shore Durometer 1 200 (1.4)
Table 3.1: Gasket parameters for elastomers without fabric or high percent of
asbestos fibre

Chapter three Design & analysis
59
3.4.2.1 Total gasket load (HG) in seating conditions
When a flange is bolted up and the flange rotation is neglected, the compressive
stress applied on the gasket will be uniform. The amount of this stress depends on
the physical properties of the gasket materials and the effective gasket area as well as
the bolt cross section area. Since no internal pressure is applied and the gasket
compression force is the only force reacting to the bolt load, the bolt load is balanced
by the gasket compression force [102]
3.4.2.2 Total gasket load (HG) in operating conditions
In the operating conditions, as the internal pressure is applied, the hydrostatic force
will be produced on the face of the flange. The bolt load is balanced by the sum of
gasket compression force and the total hydrostatic force which acts on the flange
face and can be expressed as:
𝐻𝐺 = 𝑊 − 𝐻 . . . (3.3)
Where, H is the total hydrostatic force.
3.4.3 Flange loads
3.4.3.1 Hydrostatic end force (HD)
When the pipe connection system is pressurized by a fluid, forces develop on the
internal surfaces of the joint system as well as in the area of the inside diameter of
the flange. Therefore, the hydrostatic end force is the normal force exerted on the
area inside the flange due to the hydrostatic pressure of the internal fluid, and it
reaches the flange through the hub. Hydrostatic pressure is defined as the force per
unit area. Therefore, the hydrostatic end force is equal to:
𝐻𝐷 =𝜋
4𝐵2𝑃 . . . (3.4)
And the lever arm of the hydrostatic end force is equal to the radial distance from
bolt circle to circle on which HD acts:
𝐻𝐷 = 𝑅 + 𝑔1 = 𝐶 − 𝐵 . . . (3.5)
Chapter three Design & analysis
60
3.4.3.2 Hydrostatic force under the gasket (HT)
According to the ASME code for designing flat face flanges with gaskets, a partial
leakage has been assumed to take place between the flange and the gasket. This
leakage causes an additional hydrostatic force on somewhere in the area between the
inner diameter of the flange and the diameter of the bolt hole circle.
𝐻𝑇 = 𝐻 − 𝐻𝐷 . . . (3.6)
The lever arm can be expressed as:
ℎ𝑇 = 0.5(R + 𝑔1 + ℎ𝐺) . . . (3.7)
3.4.3.3 Total hydrostatic force (H)
It represents the total hydrostatic end forces, which act in the area of the effective
gasket diameter.
𝐻 =𝜋
4𝐺2𝑃 . . . (3.8)
3.4.4 Gasket seating (Bolt up) conditions
3.4.4.1 Bolted load during seating conditions
Gasket seating is a first stage when no internal pressure is applied. To prevent a
leakage and to achieve a seal, all facing surface irregularities of the flange must be
filled with gasket material. This is done with direct force by bolting the flanges as
illustrated in Fig. 3.3. The minimum required bolted load, which is calculated by
ASME code, is equal to:

Chapter three Design & analysis
61
𝑊𝑚2 = 𝐻𝐺𝑦 + 𝐻𝐺𝑦′ . . . (3.9)
Where, HGy is the bolt load for gasket yielding and 𝐻𝐺𝑦′ is a compression load
required for seating gasket outside G diameter.
𝐻𝐺𝑦 = 𝑏𝜋𝐺𝑦 . . . (3.10)
𝐻𝐺𝑦′ = (
ℎ𝐺
ℎ𝐺′ ) 𝐻𝐺𝑦 . . . (3.11)
ℎ𝐺′ is the radial distance from the bolt circle to the circle of the gasket load reaction.
ℎ𝐺′ =
(𝐴 − 𝐶)(2𝐴 + 𝐶)
6(𝐶 + 𝐴) . . . (3.12)
The bolting area required for the seating conditions (𝐴2) is:
𝐴2 =𝑊𝑚2
𝑆𝑎 . . . (3.13)
Fig. 3.3: Flange under gasket seating conditions
Chapter three Design & analysis
62
3.4.4.2 Flange moment during seating conditions
As mentioned earlier, the gasket compression force is the only force that resists the
bolt force during the bolt-up conditions, so the total moment produced as a result of
this force is:
𝑀𝐺 = 𝐻𝐺ℎ𝐺 ′′ . . . (3.14)
And the flange lever arm (ℎ𝐺 ′′ ) is:
ℎ𝐺 ′′ =
ℎ𝐺ℎ𝐺′
ℎ𝐺 + ℎ𝐺′′ . . . (3.15)
3.4.5 Operating conditions
When the joint system is pressurized, the two forces will be applied on the flange.
The first one, as mentioned earlier, is named as hydrostatic end force (HD), which
comes from the applied pressure on the inside area of the flange. The second one is
the Hydrostatic Force under the Gasket which acts on the face of the flange. The sum
of these forces produces the total hydrostatic force (H). In addition, there are three
loads, bolt load (W), the total gasket load required to maintain the seal (HP) and total
adjusted joint-contact surface compression for the gasket flange (𝐻𝑃′ ), which already
existed from the bolt-up stage, but the values and the names are changed. These
loads are illustrated in Fig. 3.4 and calculated as shown in the following equations.

Chapter three Design & analysis
63
The minimum gasket load required (HP) is equal to:
𝐻𝑃 = 2𝑏𝜋𝐺𝑚𝑃 . . . (3.16)
𝑏 = (𝐶 − 𝐵)/4 . . . (3.17)
And the total adjusted joint-contact surface compression for the gasket flange (𝐻𝑃′ ) is:
𝐻𝑃′ = (
ℎ𝐺
ℎ𝐺′ ) 𝐻𝐺 . . . (3.18)
3.4.5.1 Bolted load during operating conditions
When designing the bolted flange connection, it is necessary to calculate the
minimum required bolt load for the operating conditions (Wm1) based on the
requirement for a particular situation. Therefore, the minimum bolt load required for
the design conditions is:
𝑊𝑚1 = 𝐻𝑃 + 𝐻 + 𝐻𝑃′ . . . (3.19)
Fig. 3.4: Flange under operating conditions

Chapter three Design & analysis
64
The bolting area required for the operating condition (A1) is:
𝐴1 =𝑊𝑚1
𝑆𝑏 . . . (3.20)
So, the total cross-section area required for the bolt is:
𝐴𝑚 = Greater ( 𝐴1 𝑜𝑟 𝐴2) . . . (3.21)
Based on the value of 𝐴𝑚, 𝐴𝐵 will be calculated by summing up the areas of the
selected bolts at the root diameter of a thread or section of least diameter under stress.
The flange design bolt load (𝑊𝑎) can be determined from the following equation:
𝑊𝑎 = 0.5 (𝐴𝑚 + 𝐴𝐵)𝑆𝑎 . . . (3.22)
3.4.5.2 Flange moment during operating conditions
The moment acts on the flange during the operating conditions is produced by the
hydrostatic force, so the component of the moment due to the HD is:
𝑀𝐷 = 𝐻𝐷ℎ𝐷 . . . (3.23)
And the component of the moment due to the hydrostatic force under the gasket (HT)
is
𝑀𝑇 = 𝐻𝑇ℎ𝑇 . . . (3.24)
The total moment during the operating conditions is
𝑀𝑜 = 𝑀𝐷 + 𝑀𝑇 . . . (3.25)
Chapter three Design & analysis
65
3.4.6 Flange stresses calculations
The flange stresses in three directions (axial, radial and tangential or hoop) have
been calculated using the following equations:
The radial stress at the bolt hole (SRAD):
𝑆𝑅𝐴𝐷 = 6𝑀𝐺
𝑡2(𝜋𝐶 − 𝑁𝑑1) < 𝑎𝑙𝑙𝑜𝑤𝑎𝑏𝑙𝑒 . . . (3.26)
The radial flange stress (SR):
𝑆𝑅 = 𝛽𝑀
𝜆𝑡2 < 𝑎𝑙𝑙𝑜𝑤𝑎𝑏𝑙𝑒 . . . (3.27)
𝑀 = 𝑀𝑚𝑎𝑥
𝐵 . . . (3.28)
The hub stress (SH):
𝑆𝐻 = 𝑀
𝜆𝑔12 < 𝑎𝑙𝑙𝑜𝑤𝑎𝑏𝑙𝑒 . . . (3.29)
And the tangential or hoop stress (ST):
𝑆𝑇 = (𝑀𝑌
𝑡2) − 𝑍𝑆𝑅 < 𝑎𝑙𝑙𝑜𝑤𝑎𝑏𝑙𝑒 . . . (3.30)
Where,
t: The flange thickness
N: Number of bolts
d1: Bolt hole diameter
β, λ, Y, and Z: Shape factors that are obtained from the chart figures in the code.

Chapter three Design & analysis
66
3.5 Design loads
The design internal pressure for bolted flange joint for this study has been chosen to
be 3.4 bar and it will be varied to investigate its effect. Based on the selected design
pressure, inside flange diameter, gasket materials and the comprehensive analytical
approach of the ASME code, the flange dimensions and the bolt load have been
found. As the outside diameter is variable in this study, the bolt load has been
calculated at outside diameter of 300 mm and 320 mm as 9.69 kN and 7.4 kN
respectively. However, the bolt load is variable in this study but the above is the
design bolt load.
3.6 Summary
The current chapter includes the design parameters and the comprehensive analytical
approach of the ASME code for the glass fibre reinforced polymer bolted flange
joint. The design parameters have been divided into groups, which are design
variables and design constants. The design includes flange and hub dimensions,
gasket materials and thickness and the applied load, which are bolt and internal
pressure loads. The design constants involve the fixed parameters in this study,
which are the flange inside diameter and the flange materials (i.e. glass fibre braid
and polyester). In addition, other parameters have been neglected such as the
external loads as well as the number of bolts. The analytical approach includes all
the required equations for calculating all the flange loads, moments and stresses
during the gasket seating (bolt up) conditions and the operating conditions.
The next chapter will describe all the details of the manufacturing process for the
bolted GFRP flange joint including the designing and the manufacturing the required
mould and all the required components for making the pressure vessel.

Chapter four GFRP flange fabrication
67
CHAPTER FOUR
GFRP FLANGE FABRICATION
4.1 Introduction
Producing any product with high quality and performance requires many steps.
These steps are understanding the conditions of the intended application, choosing
suitable materials, identifying the tools required for design and manufacture and
selecting the suitable fabrication process. In terms of the conditions, the product
should have sufficient resistances against the internal and the external conditions.
For instance, choosing the composite materials instead of metal for oil and gas
industries due to their high strength to weight ratio, corrosion resistance etc. Also,
the structure of the fabric should be selected carefully to optimize the mechanical
properties of the composites. The required tool such as the mould for the GFRP
flange should be designed and manufactured with high quality to achieve the
requirements of the flange. For the manufacturing process, it should also achieve the
design requirements and be quicker as well as cheapest.
In the present chapter, an experimental investigation is conducted to manufacture a
GFRP bolted flange by using glass fibre braid, polyester resin, vacuum infusion
process and the designed and manufactured mould. This particular type of fabric has

Chapter four GFRP flange fabrication
68
been chosen in this study because of its continuity over the entire flange body.
Therefore, it is anticipated that the failure that usually occurs at the flange-hub
intersections due to the discontinuity of fibres in this region will be minimised. In
addition, a number of experiments have been conducted to improve the method of
flange fabrication thus to obtain a composite flange with high quality and
performance.
4.2 Mould design
Designing the mould is one of the important factors that has significant effects on the
manufacturing of composite flange using vacuum infusion process. Therefore,
designing and manufacturing the mould with high quality not only determines the
inherent quality of the composite material, but also controls the surface grade of the
composite. Furthermore, appropriate mould plays a significant role in maximising
the properties of the composite material that are greatly affected by fabricating
process. In this study, the mould has been designed and manufactured with mainly
two parts to facilitate the flange removal from the mould after the curing. These parts
are the mandrel and the plate, as well as the O-ring gasket and the bolts.
4.2.1 Mandrel
The mandrel has been made of aluminium bar with 7ʺ diameter. Aluminium alloy
material (6082 T6) has been chosen due to its sufficient strength and dimensional
stability to withstand the bag pressure loads and compressive load during the
forming and curing cycles. To achieve the required dimensions, the rod is machined
and tapered from one edge as shown in the Fig. 4.1. The purpose of this taper, which
is equal to 1.75˚, is to achieve the requirements of the taper-taper joint between the
flange and the pipe and also to facilitate the removal of the flange from the mould
and to avoid the stacking problem or damage to the flange. The external surface of
the mandrel that is in contact with composite is subjected to surface finishing process
to remove all asperities that increase the chance of the flange mould bonding and
also to obtain a flange with good internal surface. This will improve the bond
strength between the flange and the pipe. In addition, the tapered end face of the
mandrel has been machined to create a groove for a O-ring gasket (3.53 mm of cross

Chapter four GFRP flange fabrication
69
sectional diameter) and four holes with threads have been created for inserting the
bolts during assembly.
4.2.2 Plate
The second main part of the mould is the plate, which is placed at the bottom and in
direct contact with the lower flange face. Therefore, it requires a good surface finish
to avoid stacking over this area. Initially, the plate has been made of aluminium alloy
(6082 T6) with dimensions 650 mm x 650 mm x 10 mm and 4 holes have been
drilled around the centre of the plate for the assembly purposes. During the infusion
process, the resin flow has been found as problematic and this will be discussed in
details later. This led to change the aluminium plate by another one that has been
made of glass. See Fig. 4.2. The reason of choosing glass material is to observe the
resin flow during the infusion process and find the best inlet and outlet positions for
the resin.
Fig. 4.1: The mandrel
Groove and O-ring
gasket Bolts holes
Fig. 4.2: The glass plate

Chapter four GFRP flange fabrication
70
4.2.3 The mould assembly
As showing in the Fig. 4.3, the parts of the mould have been assembled by using four
bolts of size M10 as well as O-ring rubber gasket. These bolts pass through the plate
holes and are fastened to the identical holes that have been drilled in the taper end
face of the mandrel by using a thread tool. Before the assembly, the gasket has been
fitted in the grove. The purpose of using this gasket is to prohibit the leakage through
holes of the bolts during the vacuum and to prevent the resin from reaching the
contact area between the mandrel and the plate during the infusion.
4.3 GFRP Flange fabrication
As mentioned earlier, the vacuum infusion process (bag moulding) has been chosen
to manufacture the composite flange of 6-inch nominal diameter. This manufacturing
method has been selected due to its flexibility for manufacturing composite with
complex geometry. It is unexpansive and it provides good strength compare with
other methods such as hand layup or RTM, which also require close system mould.
Fig. 4.4 illustrates a schematic of manufacturing GFRP flange by using a vacuum
infusion process. This manufacturing process has included a number of steps which
are described briefly as follows:
Fig. 4.3: The Mould of the composite flange

Chapter four GFRP flange fabrication
71
1. Release agent: after assembling the mould parts, all its surfaces that are in
contact with the composite flange are coated with a released agent
(FREKOTE 770-NC PT CN) to avoid composite sticking and to facilitate the
removal of flange from the mould. In addition, to stop any reaction between
the resin and the mould materials, which might affect on the composite
mechanical properties.
2. Peel ply: the peel ply is used in two instances. At the first instance, it is used
to cover the surface of the mould, which is in contact with the flange before
putting the fabric. This helps the trapped air bubbles between the fabric and
the mould to leave during the vacuum and the resin infusion, thereby,
reducing the voids or porosities and improving the mechanical properties of
the composite flange. The other purpose of using the first peel ply is to leave
an imprint or pattern on the flange surface to enhance adhesive bonding
between the flange and the pipe. In addition, to increase the coefficient of
friction between the rubber gasket and the flange face and preventing the
pushing out of the gasket during the operating condition.
Fig. 4.4: Schematic diagram of the vacuum infusion process

Chapter four GFRP flange fabrication
72
For the second instance, it is used between the fabric and the diffusion mesh
as well as the bag to prevent them from sticking to the composite flange after
the curing action and to improve the outer surface finish of the flange.
3. Fabric layup: braid fibreglass has been chosen to fabricate the composite
flange in this study. This type of the fabric has been chosen due to its
continuity from the hub to the flange around the entire flange (flange neck)
and the continuity in the radial and hoop directions, which minimize the
flange rotation under the uneven distribution of the bolt loads. In addition,
this will reduce the bending moment, thereby reducing the flange rotation
that encourages the leakage propagation. A number of previous studies [33]
[9] have indicated that the most common types of failures in commercially
available GRP flanges manufactured by hand lay-up or filament winding
processes occur at the flange-hub intersections, due to the discontinuity of
fibres in this region. See Fig. 4.5. The layers of the braid fibreglass sleeves
are laid up over the mandrel and expanded out over the plate more than the
required diameter of the flange as shown in Fig. 4.6. This process is repeated
many times until the required thickness is achieved. [33]
Fig. 4.5: Common failure on the GFRP flanges [33]
Crack at the flange neck
Crack at the flange neck

Chapter four GFRP flange fabrication
73
4. Diffusion mesh: after covering the fabric by a peel ply as explained earlier, a
diffusion mesh (breather) is placed to ensure that all air pockets are
eliminated and to facilitate the flow of the resin from the inlet tube, which is
placed near the neck of the flange during the infusion process, to the outlets.
See Fig. 4.7.
5. Vacuum infusion process: a flexible bag is used to cover all the components.
The edges of the bag are stacked on the edges of the plate to close the system
as shown in the Fig. 4.8. Meanwhile, the outlets of the infusion process have
been kept fixed at the top and along the outer diameter of the flange. After
that, a vacuum is applied and the polyester resin, which is mixed with 1% of
a catalyst, is infused through the inlet of the system. In addition, the vacuum
process is continued until the flange is completely cured at the room
temperature. After the curing, the vacuum process is stopped, vacuum bag,
diffusion mesh, and peel ply all are stripped off and the flange is removed
from the mould.
Fig. 4.6: Laid braided fiberglass fabric on the mandrel and the plate

Chapter four GFRP flange fabrication
74
6. Flange machining: as the wastage of the braiding at the edges cannot be
avoided, initially the braiding fabric has been kept larger than the required
physical dimensions of the flange and finally has been shortened by cutting
off the unwanted regions of the manufactured flange as can be seen in Fig.
4.9.
Fig. 4.8: Bagging and resin infusion
Fig. 4.7: Diffusion mesh distribution

Chapter four GFRP flange fabrication
75
4.4 Issues with the manufacturing process
During the manufacturing of the GFRP flange, two issues have been identified: (1)
dry region and (2) voids and cracks at the flange neck. Details of these issues are
discussed below.
4.4.1 Resin flow problem
The main issue that has been faced during the GFRP flange fabrication process is the
dry region (inadequate resin flow). This has led to have dry regions around the
diameter of the bolts holes circle and at the lower face as illustrated in Fig. 4.10.
Initially, the inlet of the resin has been placed at the outer diameter or edge of the
flange disc while the outlet has been fixed on the top. The first flow flows from the
flange edge (outer dimeter) toward the centre through the diffusion mesh and the
other, reverse flow, flows from the internal diameter of the flange toward the outer
diameter of the flange and at the bottom face of the flange. The arrangement forces
the resin to flow in the opposite directions and produces trapped air at the meeting
regions. Thus, the resin doesn’t fill the meeting regions properly and leads to have
dry regions.
Fig. 4.9: Machining of the composite flange
After the cutting Before the cutting

Chapter four GFRP flange fabrication
76
4.4.2 Voids and cracks problem
After curing the composite flange, it has been cut into many pieces for a number of
purposes such as performing mechanical tests, measuring the fibre volume fracture
(Vf) and capturing optical microscopy images. In order to investigate the voids and
the cracks, many samples have been taken from the flange-hub region (flange neck),
which represents the critical point in the flange. Fig. 4.11 shows an image of the
flange neck region. It can be seen that many voids and cracks occur at this region
when the inlet of the infusion was in the flange edge and the outlet was in the top of
the flange. This case is named as Model A, which will be discussed elaborately later.
In addition, most of the voids and cracks were found close to the upper face of the
flange. This occurs due to the resin shrinkage and exothermal behaviours at the
flange neck. As this region connects the flange and the hub, it experiences the most
effects of the flange shrinkage. Also, it is the thickest part in the flange, thus high
temperature is produced due to exothermal reaction.
The reason of concentrating the voids and the cracks at the upper half of the flange is
that the lower surface and the internal faces of the flange are bigger than the upper
face and they have direct contacts with the mould, which is made of aluminium and
glass. The mould helps to cool the composite by transferring the heat through it to
Fig. 4.10: Flange with dry regions on the face

Chapter four GFRP flange fabrication
77
the environment. In contrast, the upper face of the flange-hub intersection area is less
and covered by peel ply and the vacuum bag, which are inhibiting the heat transfer.
Therefore, the amount of the transferred heat from the lower and the internal faces of
the flange is more than that from the upper face. As a result, most of the voids and
the cracks have been formed at the upper half of the composite instead of the lower
half.
4.5 Solving the issues
To solve or minimize the issues faced during manufacturing the GFRP flange, two
investigations have been carried out. The first investigation, which involves
substantial number of experiments studies the effect of the inlet and the outlet
positions on the formation of the dry areas, voids and cracks. The other investigation
is conducted by changing the infusion temperature to study its influence on the
viscosity of the resin.
4.5.1 Inlet and outlet positions
Changing the inlet and the outlet positions is one of the important parameter that has
significant effect on flange strength and especially on the faced issues, i.e. dry
region, voids and cracks. To do this investigation, another mould has been
manufactured using just glass material as shown in the Fig. 4.12. This mould has
allowed to see all the resin flow in the regions.
In addition, in each experiment, a portion of the flange has been fabricated as
illustrated in the Fig. 4.13 using the same fabric, resin and manufacturing process.
Fig. 4.11: Microscopy image for the flange-hub intersection

Chapter four GFRP flange fabrication
78
Three experiments (Model A, Model B and Model C) with different inlet and outlet
positions, which are shown in the Fig. 4.14, have been carried out. Model A has the
inlet at the flange edge and the outlet in the top of the flange as shown earlier in the
above sections. Model B has the inlet at the top of the flange and the outlet at the
flange disc edge. The third one is model C that includs the inlet at the flange neck
and two outlets- one at the flnage disc edge and the other at the top of the flange hub.
The results showed that the model C has achieved the best resin flow and also
quicker than the other models. This helps to distribute the resin over all the flange
body within a short time and avoid any dry fabric which occurred with the model A.
(See Fig. 4.15).
Fig. 4.13: The vacuum infusion process of the experiments
Fig. 4.12: Glass mould of the experiments

Chapter four GFRP flange fabrication
79
In addition, the voids and the cracks percentages have been calculated by using
Image J software for the smaples that have been cut from the the neck of the flange
(flange-hub intersection) for each experiment as shown in the Fig. 4.16. The
obtained results showed that the voids and the crack precentages have been reduced
siginificantly with the Model C (4.3% for Model A, 4.24% for Model B and 1.58%
for Model C). This has been taken into account to choose Model C for
manufacturing the final form of the composite flange.
Fig. 4.15: Flange without dry fabric on the face
Fig. 4.14: Inlet & outlet positions of the conducted experiments
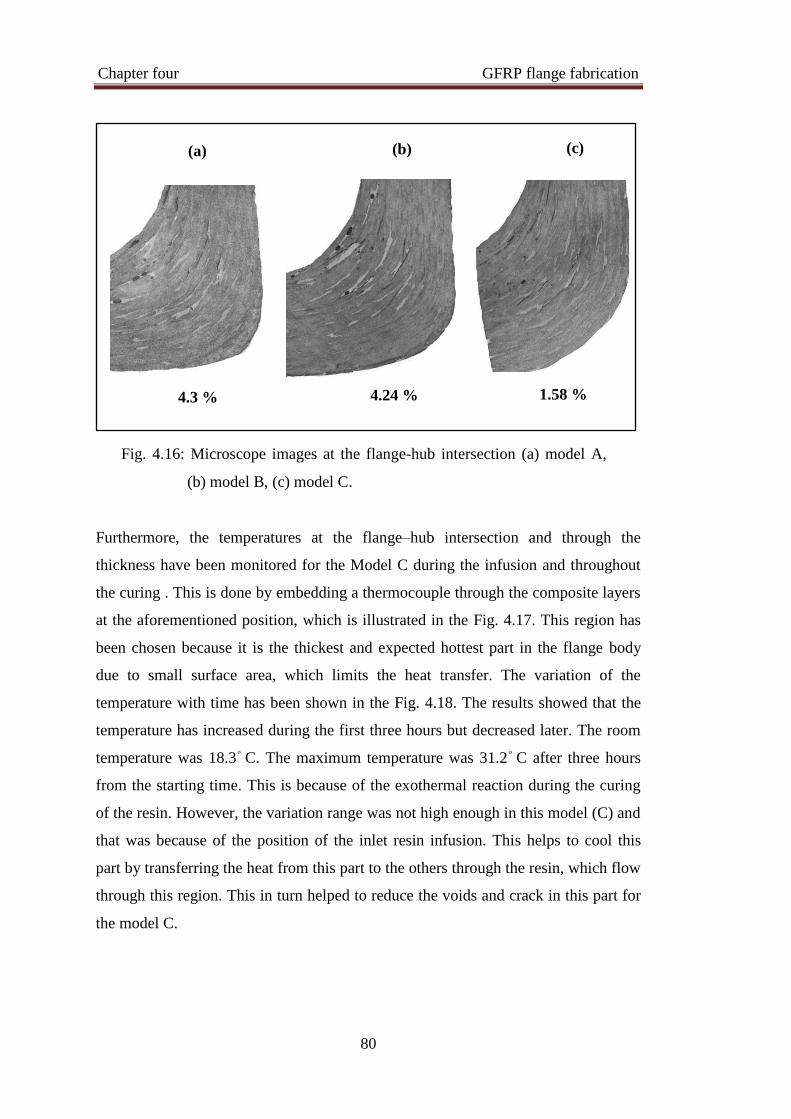
Chapter four GFRP flange fabrication
80
Furthermore, the temperatures at the flange–hub intersection and through the
thickness have been monitored for the Model C during the infusion and throughout
the curing . This is done by embedding a thermocouple through the composite layers
at the aforementioned position, which is illustrated in the Fig. 4.17. This region has
been chosen because it is the thickest and expected hottest part in the flange body
due to small surface area, which limits the heat transfer. The variation of the
temperature with time has been shown in the Fig. 4.18. The results showed that the
temperature has increased during the first three hours but decreased later. The room
temperature was 18.3 ͦ C. The maximum temperature was 31.2 ͦ C after three hours
from the starting time. This is because of the exothermal reaction during the curing
of the resin. However, the variation range was not high enough in this model (C) and
that was because of the position of the inlet resin infusion. This helps to cool this
part by transferring the heat from this part to the others through the resin, which flow
through this region. This in turn helped to reduce the voids and crack in this part for
the model C.
4.3 % 4.24 %
(a) (b) (c)
Fig. 4.16: Microscope images at the flange-hub intersection (a) model A,
(b) model B, (c) model C.
1.58 %

Chapter four GFRP flange fabrication
81
4.5.2 Resin Viscosity
The viscosity of the resin has also significant impact on the resin flow and on the
curing time. The resin viscosity can be changed by varying the temperature.
Therefore, series of experiments have been conducted to find out the best infusion
temperature that reduces the viscosity and facilitates the flow of the resin through the
layers of the fabric. The experiments have been carried out using the Brookfield
rheometer machine for the polyester resin with zero% and 1% catalysts at various
10
14
18
22
26
30
34
38
0 2 4 6 8 10 12 14 16 18
Tem
per
ature
, ◦
C
Time, hr
Fig. 4.18: The temperature variation during the infusion and curing
process at the flange-hub intersection
Fig. 4.17: Thermocouple position in the flange-hub intersection
Thermocouple
position

Chapter four GFRP flange fabrication
82
ranges of temperature. The resin without catalyst has been tested to see the effect of
the evaporation on the resin viscosity. The 1 % catalyst has been chosen because the
manufacturer has recommended the ideal range of the catalyst as 1-2%. Therefore, it
has been fixed to 1% to increase the curing time thereby ensuring good distribution
of the resin.
Fig. 4.19 explains the viscosity variation of the resin with the time for various ranges
of temperature. The results show that the viscosity increases from 0.25 Pas to almost
2.2 Pas during the first 30 minutes of the time regardless the temperature. After that,
the recorded viscosity has decreased. In reality, it should not decrease but it has been
happened as the resin film has been separated into two layers. One of them has
sticked onto the upper plate and the other sticked onto the lower plate of the device.
The recorded viscosity after the peak is affected by the friction between the two
layers. The temperature has insignificant effect on the viscosity when the resin is
used without catalyst.
Fig. 4.20 illustrates the variation of the resin viscosity with time for different
temperatures (20 to 50 ͦ C) for the resin mixed with 1% of the catalyst. It seems that
the temperature has significant effect on the resin viscosity. At the high temperatures,
35 to 50 ͦ C, the resin viscosity is increased rapidly and the resin is cured quickly. In
addition, the torque has reached the maximum allowable torque of the device and the
break has occurred. The time of the break decreases with the increase in the
0
0.5
1
1.5
2
2.5
3
3.5
0 5 10 15 20 25 30 35 40 45 50
Vis
cosi
ty,
Pas
Time, min
20 C
25 C
30 C
35 C
40 C
45 C
Fig. 4.19: The variation of the polyester viscosity with the time at
different temperature (without catalyst).

Chapter four GFRP flange fabrication
83
temperature. At the temperatures 25 and 30 ͦ C, the viscosity has increased up to 2.5
Pas during the first 30 minutes but dropped after that. This means the resin film has
splitted into two layers. At the room temperature (20 ͦ C), the viscosity has also
increased up to 2.5 Pas during the first 35 minutes and reduced gradually after that.
The longest period with less viscosity has been achieved at the temperature 20 ͦ C.
Therefore, this temperature has been chosen to infuse the composite flange. This
temperature allows the resin to distribute gradually over all regions of the fabric
before curing. Furthermore, it lets the trapped air to move and leave the resin. Finally,
at the room temperature, it does not require any heating system thus makes the
manufacturing process efficient and reduces the costs.
4.6 Composite flange drilling
Drilling the composite flange is one of the main fabrication steps after the curing.
The bolts holes are also critical regions in the GFRP flange due to the applied bolt
force. So that the holes performance have significant effect on the flange
performance as most of the maximum strains concentrate at the bolts holes. In
addition, it was found that the flange with drilled bolts holes performed better, in
terms of strength, than those with moulded holes [91]. A number of researchers [9,
100] have carried out comparative studies on the drilling of the glass fibre reinforced
plastics (GFRP), which are manufactured by hand lay-up, using Stub Length drill
0
0.5
1
1.5
2
2.5
3
3.5
4
4.5
5
5.5
0 5 10 15 20 25 30 35 40 45 50
Vis
cosi
ty,
Pas
Time, min
20 C
25 C
30 C
35 C
40 C
45 C
50 C
Break
Fig. 4.20: The variation of the polyester viscosity with the time at
different temperature (1% catalyst)
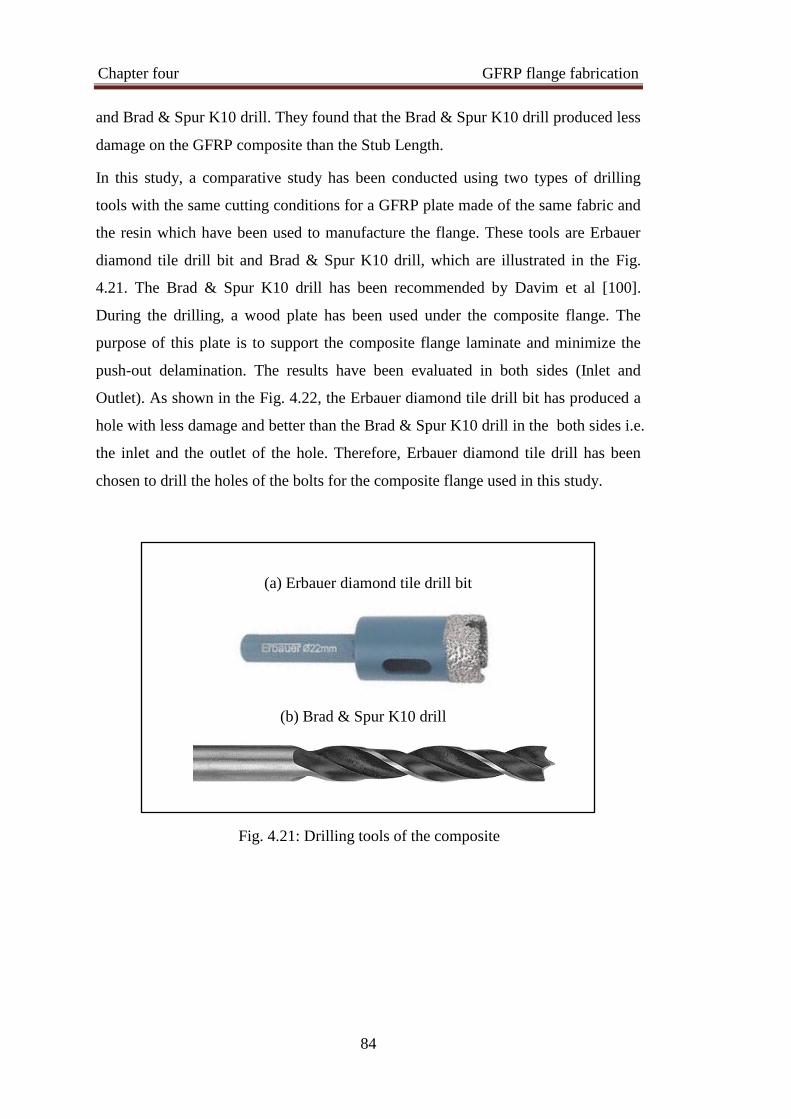
Chapter four GFRP flange fabrication
84
and Brad & Spur K10 drill. They found that the Brad & Spur K10 drill produced less
damage on the GFRP composite than the Stub Length.
In this study, a comparative study has been conducted using two types of drilling
tools with the same cutting conditions for a GFRP plate made of the same fabric and
the resin which have been used to manufacture the flange. These tools are Erbauer
diamond tile drill bit and Brad & Spur K10 drill, which are illustrated in the Fig.
4.21. The Brad & Spur K10 drill has been recommended by Davim et al [100].
During the drilling, a wood plate has been used under the composite flange. The
purpose of this plate is to support the composite flange laminate and minimize the
push-out delamination. The results have been evaluated in both sides (Inlet and
Outlet). As shown in the Fig. 4.22, the Erbauer diamond tile drill bit has produced a
hole with less damage and better than the Brad & Spur K10 drill in the both sides i.e.
the inlet and the outlet of the hole. Therefore, Erbauer diamond tile drill has been
chosen to drill the holes of the bolts for the composite flange used in this study.
(a) Erbauer diamond tile drill bit
(b) Brad & Spur K10 drill
Fig. 4.21: Drilling tools of the composite

Chapter four GFRP flange fabrication
85
In addition, other experiments have been conducted to find out the best rotation
speed for the Erbauer diamond tile drill bit. Various speeds, e.g. 600, 800, 1200 and
2200 rpm have been used to drill the same composite laminate as shown in the Fig.
4.23. The findings show that the best hole in both sides has been achieved at the
rotation speed of 800 rpm as illustrated in the Fig. 4.24. During drilling, water has
been used to reduce the heat and to avoid the burning of the composite around the
holes.
Fig. 4.22: 22 mm drilled holes of used tools in the experimental work
(Outlet)
Erbauer diamond tile drill bit Brad & Spur K10 drill
(Inlet) (Inlet)
(Outlet)

Chapter four GFRP flange fabrication
86
4.7 Flange-pipe adhesive bonding
Flange-pipe bonding is important and it has been done through many steps. Firstly,
the filament winding pipe shown in Fig. 4.25 has been chamfered at its ends to
achieve the requirements of the taper-taper joint between the flange and the pipe.
The internal face of the flange has been sanded to improve the bonding strength.
During the drilling Final GFRP flange
Fig. 4.24: During the drilled and the final GFRP flange
Fig. 4.23: Drilled holes with different speeds
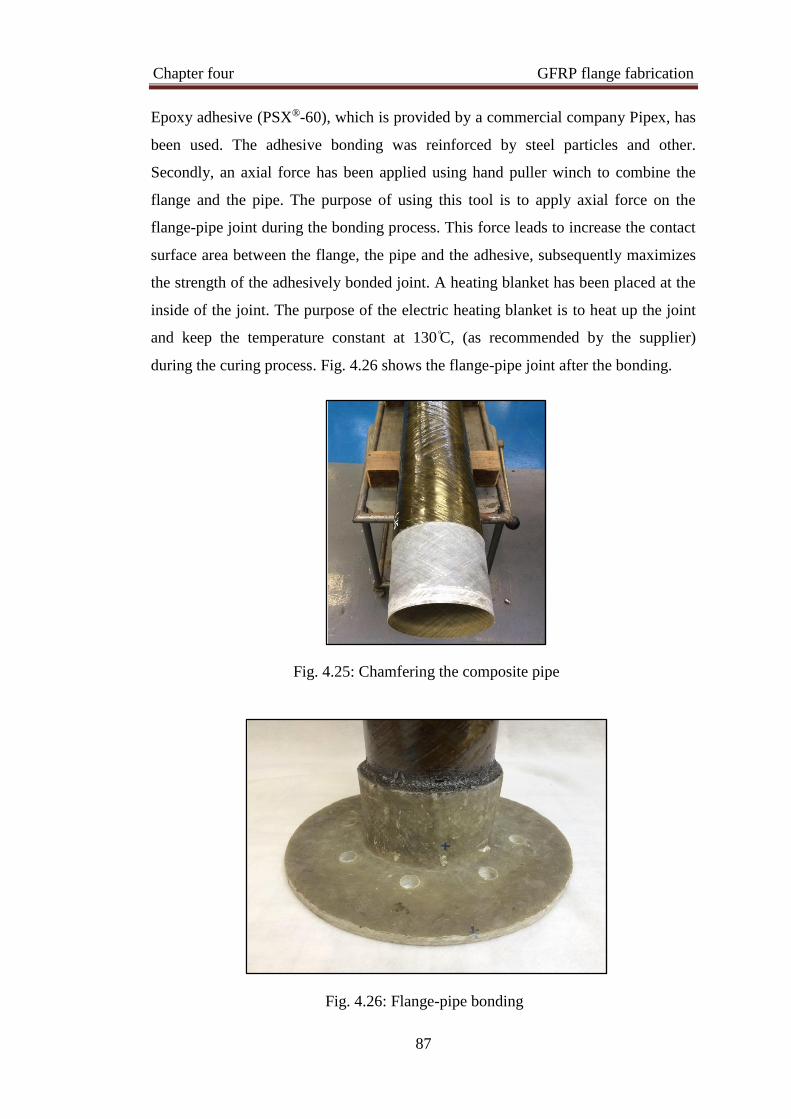
Chapter four GFRP flange fabrication
87
Epoxy adhesive (PSX®-60), which is provided by a commercial company Pipex, has
been used. The adhesive bonding was reinforced by steel particles and other.
Secondly, an axial force has been applied using hand puller winch to combine the
flange and the pipe. The purpose of using this tool is to apply axial force on the
flange-pipe joint during the bonding process. This force leads to increase the contact
surface area between the flange, the pipe and the adhesive, subsequently maximizes
the strength of the adhesively bonded joint. A heating blanket has been placed at the
inside of the joint. The purpose of the electric heating blanket is to heat up the joint
and keep the temperature constant at 130 ͦC, (as recommended by the supplier)
during the curing process. Fig. 4.26 shows the flange-pipe joint after the bonding.
Fig. 4.26: Flange-pipe bonding
Fig. 4.25: Chamfering the composite pipe

Chapter four GFRP flange fabrication
88
4.8 Other end of the pipe
The other end of the pipe has been closed by using a Heavy Duty (HD) flange
supplied and bonded by Pipex in additional to the adhesive bonding. This end of the
pipe has been chamfered by the same method as is used for the other end of the pipe.
The applied chamfering method has been described in earlier sections. See Fig. 4.27
(b).
4.9 Blind flanges
Two blind flanges have been used to close the ends of the pipe, which have been
bonded with the fabricated flange in one end and the HD flange in other end of the
pipe. The blind flange, which is used for closing the fabricated flange, has been
made of Acrylic material of thickness 50 mm as shown in the Fig. 4.27 (a). The
reason for choosing this type of the material is that it is strong and provides clear
views for flow observations across the compressed gasket and the leakage
propagation. Unfortunately, the leakage propagations have taken place between the
gasket and the flange, which cannot be seen. However, the blind flange has been
made as thick as possible to avoid any deformation on the blind flange. Eight holes,
which are identical with holes of the flanges have been made to insert the bolts.
Initially, water jet cutter (Flow Mach 2 203Ib) has been used to make the holes but
unfortunately, many cracks around the holes have been appeared. As a result, a
CNC machine has been used instead of the water jet cutter to make holes for the
bolts.
The blind flange for the other end, which is bonded to the HD flange, has been made
of mild steel of thickness 25 mm. Eight holes have been made for the bolts. In
addition, three holes have been drilled for the inlet, outlet and the pressure gauge.
See Fig. 4.27 (b).

Chapter four GFRP flange fabrication
89
4.10 Assembly of the joint components
After manufacturing all the components of the pressure vessel, the final assembly
has been carried out as shown in the schematic diagram in the Fig. 4.28. Other tools
that have been added to the assembly for conducting the test will be described in the
next chapter.
Fig. 4.28: Schematic diagram of the pressure vessel
Fig. 4.27: HD and blind flanges: (a) Acrylic blind flange attached to the
fabricated flange and (b) HD and steel blind flange attached to the HD flange.
Steel blind flange
Acrylic bind flange HD flange
(b) (a)

Chapter four GFRP flange fabrication
90
4.11 Summary
A bolted composite flange made of glass fibre braid reinforced polymer provides
good solutions to stop the most common types of failures found in commercially-
available GFRP flanges manufactured by hand lay-up or filament winding processes.
Therefore, in this chapter, the bolted GFRP flanges have been fabricated using a
bespoke made mould and vacuum infusion process (bag moulding). In addition, a
number of experiments have been conducted to solve the faced issues, to improve the
manufacturing process and to obtain a GFRP flange with high quality and strength.
Furthermore, to improve the quality of the drilled flange holes, a comparative study has
been carried out using two types of drill bits. Several GFRP flanges have been
manufactured to conduct the tests discussed in the next chapter where the discussion
will be evolved around the experiments of the material characteristics, the fittings,
the strain gauges’ set up for the composite flange and the bolts and the required test
rigs as well as the testing of the pressure vessel.

Chapter five Experimental methodology
91
CHAPTER FIVE
EXPERIMENTAL METHODOLOGY
5.1 Introduction
The other main part of the experimental work carried out in this study is the testing
of the manufactured pressure vessel (bolted GFRP flange joint, which has been
discussed in the previous chapter). Experimental testing of the composite flange
usually requires many tools and the accuracy of the test depends on the quality of the
fabricated product, the tools used and the procedure followed as well as the skills of
the persons involved in testing. The required tools can be divided into three groups.
The first group includes the tools for all the experiments that lead to perform the
materials characterisations of the composite joint system. The second group consists
of all the equipment for measuring the required data. These equipment are the strain
indicator and recorder, the required software, the strain gauges for the composite
flange and the pipe. The third group contains all other rigs, which are necessary for
the test, such as fittings, torque wrench, pump and pressure gauge. Therefore, all
these tools should be calibrated to ensure the best performances. In addition, the
procedure of the test is very important and it has significant influence on the results,
therefore, it should be done based on the standards.

Chapter five Experimental methodology
92
In this chapter, all the details of the experimental testing will be discussed including
the experiments of the materials characterisations, the required tools for measuring
or testing the bolted flange joint, the methods of their calibrations and the procedure
of the testing.
5.2 Materials characterisations
To specify any composite materials theoretically or numerically, many parameters
should be determined initially. These parameters are the fibre volume fraction, fibre
direction, the thickness of the layers and the number of each layers. These
parameters have been measured experimentally as explained in the following
sections.
5.2.1 Fibre volume fraction (Vf)
Fibre volume fraction (Vf) has significant effect on the characteristics of the
composite materials. Increasing the Vf leads to increase the strength of the composite
materials. To calculate the mechanical properties of the composite flange, the Vf
should be calculated first. Therefore, during the manufacturing process, many
samples have been cut from the fabricated flanges for different purposes. Generally,
the composite flange has been divided into two main parts, which are flange disc and
the hub. Five samples have been taken from each part (flange disc and hub) at
different zones. Tangentially, one sample is taken from each zone at every 72˚. In
total 10 samples of the composite flange were obtained to measure the fibre volume
fraction. In addition, five samples of the filament winding pipe have been taken to
measure the Vf. The fibre volume fraction (Vf) has been calculated using burn off
method (shown in Fig. 5.1) based on the published standard mentioned in the
reference [103]. The average for each group of five samples located on the same part
are obtained. These average values are used in the calculations of the properties of
the composite. All experimental data are shown in the Table 5.1.

Chapter five Experimental methodology
93
5.2.2 Fibre orientation (Braiding angle)
After laying up the glass fibre braid over the mould, many images have been taken at
different layers of the fabric for each part (flange disc and hub). Then, the images
have been analysed using the image J software to measure the fibre angle, which is
illustrated in the Fig. 5.2. The results showed that the average braid angle (Θ) of the
fibre at the flange disc was 65, whereas it was 44.5 at the hub region.
Parts
Samples
Flange
Vf %
Hub
Vf %
Pipe
Vf %
Sample 1 62.65 60.05 51.56
Sample 2 63.12 61.23 53.15
Sample 3 59.63 60.48 51.35
Sample 4 60.05 60.29 52.40
Sample 5 58.18 58.47 51.52
STDEVA 2.09 1.01 0.76
Ave. Vf % 60.70 60.10 52
Table 5.1: Fibre volume fraction experimental data
During the burning in furnace After the burning
Fig. 5.1: Composite samples for calculating the Vf

Chapter five Experimental methodology
94
Furthermore, the filament-winding angle (Φ) of the composite pipe has been
measured experimentally to obtain the accurate value. Many photos have been taken
for the used composite pipe and analysed using image J as shown in the Fig. 5.3. The
results showed that the average of the filament winding angle is +/-55 ͦ . This value is
the same that is provided by the supplier. Also, it is the optimal angle for the
composite pipe subjected to the internal pressure based on many studies [8, 72].
Therefore, it has been used for calculating the mechanical properties of the
composite pipe.
Fig. 5.3: Filament-winding angle of the composite pipe
Fig. 5.2: Braiding angle of the flange disc and the hub
Fibre direction
Flange disc Hub

Chapter five Experimental methodology
95
5.2.3 Fibre orientation (Crimp angle)
The crimp angles of the braiding fibreglass have also been investigated in this study.
Many samples, which were taken along the fibre direction at the flange disc and the
hub, have been analysed using optical microscope after grinding and polishing them
as shown in the Fig. 5.4. The crimp angle has been measured for the obtained images
using image J software. The results have shown that the average value of the crimp
angle for all the samples were less than 5˚. Fig. 5.5 shows the influence of the
orientation distribution factor on the longitudinal tensile modulus of carbon (60% Vf)
and glass (50% Vf) unidirectional composites. It is observed that the crimp angle has
insignificant effect on the young’s modulus of the glass UD composite at the small
values. When the crimp angle is 9 ͦ, the effect of the orientation distribution factor on
the young’s modulus is 5%. In addition, it is very difficult to take into account the
effect of the crimp angle on the mechanical properties as there is no software that
takes this effect into account. Therefore, the effect of crimp angle has been ignored
in this study. [104]
Fig. 5.4: Microscope picture of the crimp angle

Chapter five Experimental methodology
96
5.3 Autodesk Helius composite validation
Autodesk Helius composite software has been used in the current study to calculate
the mechanical properties of the composite flange and the pipe. The reason for using
the software is that it is very difficult to calculate all the mechanical properties
experimentally, especially, for the three dimensional composite materials. These
properties are used in the FE analysis that will be discussed in the next chapter.
Therefore, an experiment has been conducted to validate the results of the Helius
composite. This has been done by manufacturing a composite laminate using glass
fibre braid and polyester, which are the same as the materials of the composite flange
as well as the same as the manufacturing process (VIP) as illustrated in the Fig. 5.6.
The composite laminate has been made of eight layers having a thickness of 3.47
mm. The braid angle of the fabric has been measured using image J software and the
average value was 28.3 ͦ. The fibre volume fraction has been measured for many
samples of the laminate and the average value was 49.33%.
Young’s modulus has been measured in different ways. Experimentally, six samples
have been cut from the composite laminate (Fig. 5.6) and tested using flexural test
(3-point bending), which is explained in the standard (BS EN ISO 14125) [105]. Fig.
5.7 illustrates a simple diagram of the 3-point bending tests. The Young’s modulus
has been calculated through standard calculations, Instron software, excel
Fig. 5.5: Calculated orientation distribution factor for a plain weave
tow with varying crimp angle [104]

Chapter five Experimental methodology
97
calculations and Helius composite. In the Helius composite, the above characteristics
(Braid angle, Vf, thickness) have been used to model the composite laminate and to
calculate it’s mechanical properties. For more details, see appendix A.
The results show that the difference between the Helius composite and standard
equation is 7.6 %, between the Helius and the Instron is 4.5 %, whereas the
difference with excel calculations, which was calculated based on the obtained test
data, is 7.3 %. See Table 5.2. This means there is a good agreement between all the
methods. Although, the Helius composite does not take into account the effects of
the crimp angle and the voids.
Fig. 5.6: Composite laminate (a) under the vacuum (b) samples of the test
(a) (b)
Fig. 5.7: Illustration of the 3-points bending test

Chapter five Experimental methodology
98
5.4 Flange-Gasket friction
During the operating condition of the joint, the friction force tries to resist the
pushing out of the gasket due to the applied internal pressure. The friction between
the composite flange and the rubber gasket has been taken into account in the current
study. Based on the TAPPI T-815 standard method [106], the static coefficient of the
friction between the composite plate and the rubber gasket has been calculated using
inclined plane friction tester shown in the Fig. 5.8. The composite plate has been
manufactured using the same materials as the composite flange, the same
manufacturing process and the same glass plate as used for the mould. The reason of
that is to obtain a composite plate with a face that has the same geometrical
similarities as the flange face, which is in direct contact with rubber gasket. A piece
of the rubber gasket has been attached to a metal cuboid and weighed. The
composite plate was fixed on the inclined plane. The coefficient of the friction has
been measured at an angle when the metal cuboid has started to slide as shown in the
Fig. 5.9 using the following equations.
Samples No.
Young’s modulus (GPa)
Standard
calculations
Instron
software
Excel
calculations
Helius
composite
Sample 1 21.28 21.73 21.32 20.72
Sample 2 15.21 16.33 15.33 20.72
Sample 3 16.65 17.13 16.78 20.72
Sample 4 17.72 18.45 17.85 20.72
Sample 5 22.38 23.06 22.38 20.72
Sample 6 21.58 22.01 21.57 20.72
Average 19.14 19.785 19.21 20.72
% difference with
Helius composite -7.6 % -4.5% -7.3 % ----
Table 5.2: Comparison of the Young’s modulus for a composite laminate

Chapter five Experimental methodology
99
Many readings (10) had been taken and the average value of the static coefficient
between the composite plate and the rubber gasket was determined as 1.1. This value
was considered as the same for all the rubber gaskets used (e.g. Nitrile and Viton).
𝐹 = W sin(𝛼) … (5.1)
𝑁 = W cos(𝛼) … (5.2)
µ =𝐹
𝑁 … (5.3)
Fig. 5.8: Inclined plane friction tester
Fig. 5.9: Relationships of ramp weight components

Chapter five Experimental methodology
100
µ =W sin(𝛼)
W cos(𝛼) … (5.4)
µ = tan 𝛼 … (5.5)
5.5 Data measuring equipment
When the pressure vessel are tested under the bolt load along with the internal
pressure, many tools are required to collect the data, for example: data collector,
strain gauges, a computer installed with a specialised software.
5.5.1 Strain indicators and recorders
In this study, four strain indicators have been used to collect the data from the
bonded strain gauges that will be discussed in the next sections. The strain indicators
used are called P3 and they have been made by Vishay Measurements Group. UK
Ltd. See Fig. 5.10. Each P3 has four channels, so the total channels are 16. Before
conducting the test, these P3’s have been sent to the manufacturer (Vishay
Measurements Group UK Ltd) for the calibration purposes. All the calibration data
has been documented in the appendix B. In addition, multiple P3-D4 software has
been used to record the data in the computer.
Fig. 5.10: Strain indicator and recorder

Chapter five Experimental methodology
101
5.5.2 Composite flange strain gauges
For the composite flange, biaxial strain gauges (FCA-6-11) have been used. This
type of strain gauges has been made by Tokyo Sokki Kenkyujo Co., Ltd. in Japan. It
is also called cross strain gauges, which can measure the strain in two directions at
the same point and time. They have been distributed and bonded on two lines. One
of these lines passes through the centre of the bolt and the other one passes through
the mid-point between the two adjacent bolts as shown in the Fig. 5.11. In addition,
four of the strain gauges were located on the flange disc to measure the radial and
hoop (circumferential) strains. The other four were bonded on the hub to measure the
axial and hoop strains during the testing process. All the strain gauges connected to
electric circles using quarter bridge method. This allowed to study the relationship
between the applied load (the internal pressure and the bolt load) and the flange
deformation.
5.5.3 Bolt strain gauges
The main loads in this study are the bolt load and the internal pressure. During the
bolt up conditions, only the bolt load is applied whereas during the operating
conditions, the internal pressure is applied in addition to the bolt load. The flange
deformation and the leakage pressure both depend on the bolt load and measuring
Fig. 5.11: The strain gauges set up on the composite flange body
Cross strain
gauge

Chapter five Experimental methodology
102
the applied load on the bolt accurately is very important. The bolts that have been
chosen for this study are M18 (304 stainless steel) and comply with standard DIN
931.
Therefore, an additional study has been conducted to find out the best method for
measuring the applied load during the test. This has been done by using two types of
strain gauges and tensile test machine. The types of strain gauges used for two bolts
are uniaxial strain gauge and embedded strain gauge.
5.5.3.1 Uniaxial strain gauge
Initially, the bolts have been machined at the shank with a depth of 2 mm as shown
in the Fig. 5.12. This was done to prepare places for mounting the strain gauges at
the threaded area (shank). As shown in the Fig. 5.12, two holes have been drilled for
making the connections using the wires. For each of the bolts, two strain gauges
have been bonded at the machined area and each one is placed on the opposite
position of each other.
Initially, each strain gauge has been connected to the data collector using a quarter
bridge and tested in the tensile machine. Unfortunately, the results of the two strain
Fig. 5.12: Bolts with two strain gauges bonded on the shank
Actual bolts
Schematic diagram of the bolt
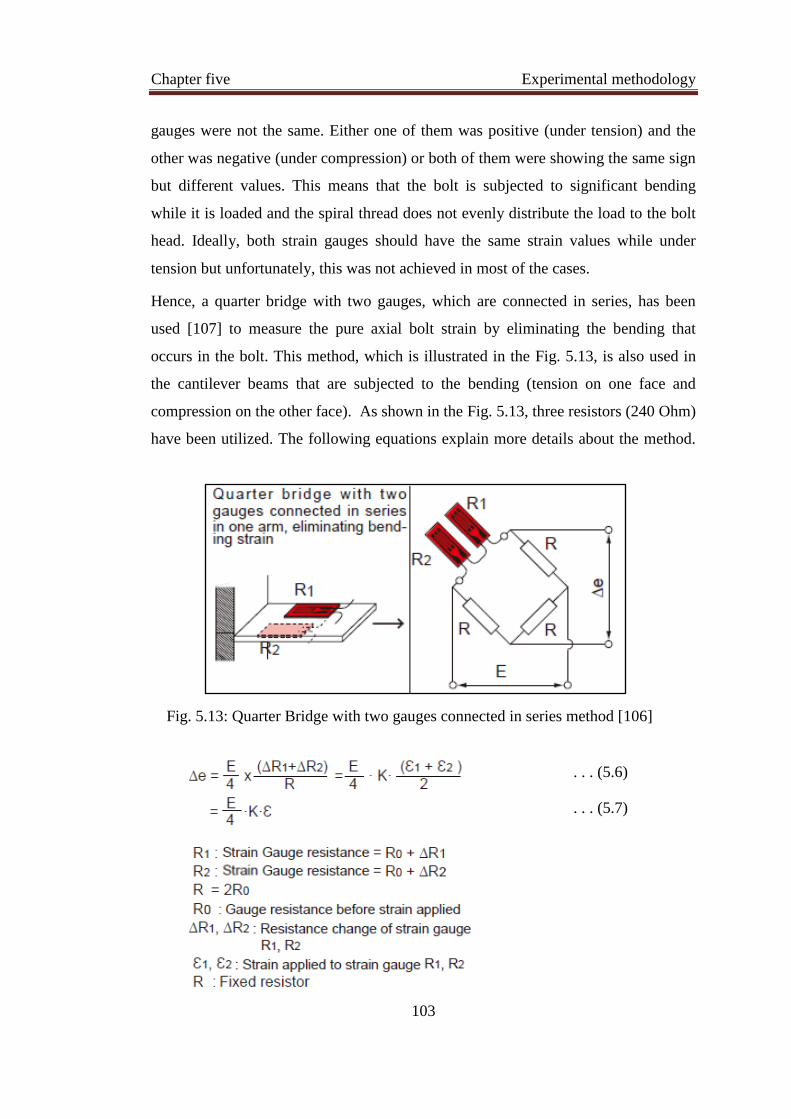
Chapter five Experimental methodology
103
gauges were not the same. Either one of them was positive (under tension) and the
other was negative (under compression) or both of them were showing the same sign
but different values. This means that the bolt is subjected to significant bending
while it is loaded and the spiral thread does not evenly distribute the load to the bolt
head. Ideally, both strain gauges should have the same strain values while under
tension but unfortunately, this was not achieved in most of the cases.
Hence, a quarter bridge with two gauges, which are connected in series, has been
used [107] to measure the pure axial bolt strain by eliminating the bending that
occurs in the bolt. This method, which is illustrated in the Fig. 5.13, is also used in
the cantilever beams that are subjected to the bending (tension on one face and
compression on the other face). As shown in the Fig. 5.13, three resistors (240 Ohm)
have been utilized. The following equations explain more details about the method.
[107].
Fig. 5.13: Quarter Bridge with two gauges connected in series method [106]
. . . (5.6)
. . . (5.7)

Chapter five Experimental methodology
104
5.5.3.2 Embedded strain gauge
The other type of bolt strain gauges that have been used in this study is the
embedded bolt strain gauge called BTMC-3-D20-006LE and has been made by
Tokyo Sokki Kenkyujo Co., Ltd. The main characteristics of this strain include easy
installation. This type of strain is also not affected by the bolt bending. The
installation requires drilling a hole in the centre of the bolt head, filling the hole with
appropriate adhesive and embedding the strain gauge. The installation process is
very easy compare to the installation of the previous type of strain gauge. As shown
in the Fig. 5.14, the position of this strain gauge is considered at the centre of the
bolt to eliminate the influence of bending that creates unequal strains in all the bolt
sides. Therefore, this strain gives better results of the pure axial strain for the bolt
during the test.
5.5.3.3 Bolt testing results
Before testing any of the bolts mentioned earlier, a tensile test has been done for
three samples that have been taken from the bolts, which were made of stainless steel
304 (A2-70). The sample has been made by machining the bolts and prepared for
testing based on the standard ASTM A370-03a [108]. The purpose of this tensile test
Fig. 5.14: Bolts with embedded strain gauges
Actual bolts
Schematic diagram of the bolt

Chapter five Experimental methodology
105
was to calculate the Young’s modulus and to compare with the standard value of the
stainless steel 304, which is 193 GPa. The average obtained value from the tensile
test was 194.3 GPa. Therefore, a good agreement has been obtained and the standard
Young’s modulus of 193 GPa will be used as the bolt property in the FEA
simulations and also in the theoretical calculations.
In terms of testing the bolts with fitted strain gauges, a special holding attachment
has been manufactured to hold the bolt during the tensile test. This tool is shown in
the Fig. 5.15.
For each type of the strain gauges, two bolts have been tested using the tensile test
machine (Extensometer) along with the bonded strain gauge. The bolts with bonded
stain gauges on the opposite sides of the shank were called SSG1 and SSG2 (Side
Strain Gauges), whereas, the bolts with embedded strain gauges at the centre were
called CSG1 and CSG 2 (Central Strain Gauges). In addition, all the data that were
collected from the strain gauges were named with the same symbols (SSG1, SSG2,
CSG1 and CSG2). The experimental results of the axial load vs axial strain have
been compared with the theoretical results, which have been calculated based on the
Hooke’s law when the Young’s modulus is considered as 193 GPa.
The variation of the axial strain with the axial load for the SSG bolt1 has been
illustrated in the Fig. 5.16. The results represent the data of the strain gauge in
extensometer and the data from the calculation of the theoretical axial strain. The
axial strain that has been obtained from the travelling cross is ignored due to the
complexity of the holding attachment, which causes errors. The results showed that
when the axial load increases, the axial strain increases as well and there is a good
Fig. 5.15: Holding attachment for the bolt testing

Chapter five Experimental methodology
106
agreement between the values from the experiments and from the theoretical
calculations. In terms of the extensometer data, it is clear that there is instability and
this is because of the extensometer movement. Due to the complex geometry of the
bolt (head and threaded region) as well as the holding attachment, the extensometer
was always in slip and gave inaccurate data. As a result, the extensometer has been
ignored for the rest of the bolts. However, it gave a good indication about the
accuracy of the other data (theoretical and strain gauge).
Fig. 5.17 shows the relationship between the axial loads with the axial strain for the
other bolt called SSG2 measured using the strain gauge and the theoretical
calculations. As shown in the figure, the agreement between the strain gauge data
and the theoretical calculation is excellent. This proves that the connection method
of the strain gauges, which is discussed earlier is appropriate to be used for the bolts
to measure the pure axial strain with minimal bending effect.
Fig. 5.16: Tensile test data of the bolt SSG1
0
20
40
60
80
100
120
0 0.6 1.2 1.8 2.4 3
Ax
ial
stra
in, µ
ε
Axial load, kN
Theoretical
SSG1
Extensometer

Chapter five Experimental methodology
107
For the other bolt type called CSG, which has embedded strain gauge at the centre of
the bolt, a calibration has been done. Each bolt has been tested several times with
different strain gauge factor (SGF) and all the data has been compared with the
theoretical results. Fig. 5.18 shows the variation of the axial strain with the axial load
for a range of SGF for the CSG bolt 1. The SGF has been varied from 1.5 to 2.5 to
find the accurate value of the axial strain. An increase in the SGF leads to decrease
the axial strain and thus the accurate axial strain was found at SGF 1.75 as it is very
close to the theoretical axial strain.
Fig. 5.17: Tensile test data of the bolt SSG2
0
20
40
60
80
100
120
0 0.6 1.2 1.8 2.4 3
Ax
ial
stra
in,
µε
Axial load, kN
Theoretical
SSG2
Fig. 5.18: Tensile test data of the bolt CSG1
0
20
40
60
80
100
120
0 0.6 1.2 1.8 2.4 3
Ax
ial
stra
in,
µε
Axial load, kN
Theoretical
CSG1, GF 1.5
CSG1, GF 1.75
CSG1, GF 2.06
CSG1, GF 2.25
CSG1, GF 2.5

Chapter five Experimental methodology
108
Fig. 5.19 illustrates the calibration data of the CSG bolt 2. The axial load has been
applied, SGF has been changed and the axial strain has been recorded. As with the
previous bolt, the best result was obtained at SGF 1.75. Therefore, this value of the
strain gauge factor will be considered whenever this type of strain gauge is used in
the study.
In the Fig. 5.20, a comparison has been made between the obtained results from the
theoretical calculations for the SSG and the CSG bolts using the strain gauge factor
as 1.75 as well as from the extensometer. As shown in the figure, most of the results
are very close to the theoretical data except for the SSG bolt1 which has slightly
higher extensometer data. The extensometer data of the bolt SSG1 was not stable due
to a particular reason that has been discussed earlier. Also, it is observed that the data
of the CSG bolts are stable, almost the same and has a very good agreement with the
theoretical data (as can be Seen in the Fig. 5.21). Practically, using a bolt with
embedded strain gauge at the centre (CSG bolt) for testing the bolted flange joint is
better that the bolt with bonded strain gauges on the outer surface of its shank (SSG
bolt). The SSG bolts are affected by the bolt bending and thus require machining.
Bonding two strain gauges with a special connection method takes long time and
incurs additional costs. In addition; the SSG bolts can be damaged during the GFRP
flange test as the strain gauges are bonded on the outer surface.
Fig. 5.19: Tensile test data of the bolt CSG2
0
20
40
60
80
100
120
140
0 0.6 1.2 1.8 2.4 3
Ax
ial
stra
in,
µε
Axial load, kN
Theoretical
CSG2, GF 1.5
CSG2, GF 1.75
CSG2, GF 2.06
CSG2, GF 2.25
CSG2, GF 2.5

Chapter five Experimental methodology
109
On the other hand, the CSG bolts are easy to set up the strain gauge, are not affected
by the bolt bending, as the strain gauge is located at the bolt centre, and has less
chance to be damaged as the strain gauge has been embedded inside the bolt.
Furthermore, CSG bolts provide better results in comparison with SSG bolts.
Therefore, the CSG bolts have been chosen for testing the bolted GFRP flange joint.
0
20
40
60
80
100
120
0 0.6 1.2 1.8 2.4 3
Ax
ial
stra
in,
µε
Axial load, kN
Theoretical
SSG Bolt 1
SSG Bolt 2
CSG Bolt 1
CSG Bolt 2
Extensometer
Fig. 5.20: Comparison of the tensile test data of all the bolts
0
20
40
60
80
100
120
0 0.6 1.2 1.8 2.4 3
Ax
ial
stra
in,
µε
Axial load, kN
Theoretical
CSG Bolt 1
CSG Bolt 2
Fig. 5.21: Comparison of the tensile test data of the CSG bolts

Chapter five Experimental methodology
110
5.6 Construction of the test rig
In additional to the data measuring equipment, several test rigs have been used
during testing of the pressure vessel. These rigs are comprised of digital torque
wrench, fittings, pump, and pressure gauge.
5.6.1 Digital torque wrench
Applying the same load on all the bolts is very important during the bolt up stage as
the bolt load affects the flange deformation and the leakage pressure. To achieve a
consistent bolt load, ACDelco digital torque adapter has been used to measure the
applied torque. Then the same torque from the bolt that has strain gauge has been
applied to the others, which have no strain gauges. This digital torque adapter has
been calibrated by the manufacturer. The calibration data is shown in the appendix C.
In addition, all the bolts have been lubricated by a grease to minimize the friction
between the threads, which might affect the reading of the digital torque adaptor and
also to keep the same conditions for all the bolts, thereby, increasing the accuracy of
the applied torque.
5.6.2 Fittings
Two stop valves have been used in the pressure vessel. One of them for the inlet,
which is connected to the pump, and the other one is for the outlet, which is used for
draining the compressed liquid after finishing the test. Furthermore, a number of
other fittings have been used for the connection purposes including the connection of
the gauge pressure.
5.6.3 Pump test
A hand pump has been used to pump the pressure vessel through the inlet point. In
addition, through this rig, the applied pressure has been controlled. This hand pump
has been manufactured by TANGYE Ltd. in the England.
5.6.4 Pressure Gauges
A special pressure gauge manufactured by WIKA has been used for this project. The
pressure gauge has many features, which were necessary for the desired test

Chapter five Experimental methodology
111
conditions, especially, the increments of the readings. The resolution of the
increments has been selected to be every 0.2 bar, which increases the accuracy in
reading the internal pressure. In addition, the pressure gauge has been calibrated by
the manufacturer. The data of the calibration has been included in the appendix D.
5.7 Testing procedure
Initially, the tests have been divided into four groups based on the gasket type and
thickness. Each group has also been divided into two stages. The first one is the bolt
up stage. In this stage, the bolts have been tightened in several steps based on the
bolt-tightening diagram illustrated in the Fig. 5.22, The tightening sequence for the
bolts is important to distribute the bolt loading evenly to compress the gasket surface
[109]. In each step, the tightening starts from the bolt number one, that has a strain
gauge. The required bolt load as well as the applied torque both were read by the
strain gauge and the digital torque wrench, respectively, and the measured torque
was transferred to the rest of the bolts. The data has been recorded for each step. The
second stage is the operating stage, in which, the pressure vessel has been
pressurized in a number of steps by keeping the bolt load same as the design value.
In each step, the data has been recorded up to the leakage pressure. In both stages,
the entire procedure has been repeated five times and an average value has been
obtained for strain or leakage pressure. [109]
Fig. 5.22: Bolt tightening diagram [109]
108

Chapter five Experimental methodology
112
5.8 Summary
The experimental methodology explained in this chapter can be summarised in the
following points:
The methods applied for measuring the materials characterisations (i.e. the
fibre volume fraction and the fibre orientations) are appropriate and provides
accurate results.
Helius composite (Autodesk) is a useful tool to calculate the mechanical
properties of the composite materials, which are very difficult to be
measured in physical testing laboratory, especially, the orthotropic material
properties. The validation of results has shown that there is an excellent
agreement between the experimental and the Helius composite results.
Therefore, the software tool is very effective in saving time and cost.
The data measuring equipment (e.g. strain indicator, composite strain gauges
and bolt strain gauges) used in this study have shown good performances
during the test.
The chosen test rig can produce very good and accurate data set once
calibrated properly.
The test procedure was selected based on the recommendations of the
previous studies. It has produced good experimental results discussed in the
chapter 7.
In the next chapter, FEA simulations of the GFRP flange joint system will be
discussed including the method used for modelling the geometry, characterising the
material properties, applying the boundary conditions and obtaining the results.

Chapter six Numerical simulation methodology
113
CHAPTER SIX
NUMERICAL SIMULATION
METHODOLOGY
6.1 Introduction
FEA has become popular with fast digital computers because it is very useful and
supportive practice in every design. The main features that encourage designers to
use FEA for analysis complicated structures are its ability to solve a large number of
a simultaneous equations in a relatively short time, simulating various physical
problems with arbitrary shapes. Various loads and support conditions can be applied
easily. In terms of bolted flange joint, FEA can be used to simulate this system of
connection with its parts such as; flange, pipe, pipe-flange adhesive bonded, rubber
gasket and fastener, which includes bolt and washer. Modelling of this type of joints
can be very helpful because of its flexibility and ability to calculate stress, strain,
deflection and gasket contact pressure at anywhere in the structure. In contrast,
experimental verification can measure only on the surfaces and at limited points,
costly and time consuming. The effect of some parameters cannot be measured
experimentally or too expensive, so that the FE model is a good tool to be used for
studying the performance of the bolted GFRP flange connection.

Chapter six Numerical simulation methodology
114
In this chapter, the methodology used for finite element analysis of the bolted glass
fibre reinforced polymer flange joint will be presented. The FEA model will include
all the joint parts, which are flange, pipe, adhesive bonding, rubber gasket and
fastener (bolt and washer). In addition, the methodologies used for fluid pressure
penetration and the leakage pressure simulations will be discussed in this chapter.
6.2 FEA model of bolted GFRP flange joint
A three dimensional finite element model has been developed for glass fibre
reinforced plastic (GFRP) bolted flange using ANSYS version 18.1. The model
includes flange, pipe, adhesive bonding, gasket and bolt with dimensions and shapes
compliant with the ASME Boiler and Pressure Vessel Code, Section X [24]. Using
symmetry in the geometry, a primary segment is repeated at equally spaced intervals
about the axis of symmetry, so 1/16th portion of the total circumference of the joint
has been considered for the analysis as shown in Fig. 6.1. This option has been
chosen to reduce the total simulation time and computer resources. Especially, the
selected diameter of the pipe for this study is 6ʺ, which is relatively large. This
portion of the joint includes 1/16th from the flange, pipe, adhesive bonding, gasket
and a half of the bolt and the washer as shown in the Fig. 6.2.
6.2.1 Geometry and the dimensions of the flange joint
As mentioned earlier, the full-face gasket flange has been investigated in this project
as can be seen in the Fig. 6.3. The dimensions of the fabricated flange joint have
been chosen based on the ASME Boiler and Pressure Vessel Code, Section X [24],
when the design internal pressure is 340 kPa. See Fig. 6.3. FEA identifies the effects
of some of these dimensions on the flange strains and the leakage pressure.
Therefore, some of the dimensions have been varied. These dimensions are flange
diameter, flange thickness, hub length and thickness. The purpose of this variation is
to find the possibility of reducing these dimensions as the preliminary experimental
results showed that the strains of the flange were low under the design loads (bolt
load and internal pressure).

Chapter six Numerical simulation methodology
115
Fig. 6.1: Symmetric of the bolted flange joint
Fig. 6.2: 3D FEA model of the bolted flange joint

Chapter six Numerical simulation methodology
116
6.2.2 GFRP flange simulation
The bolted GFRP flange has been simulated in this FEA by taking into account its
orthotropic characteristics. Since the orthotropic mechanical properties are not the
same in all regions of the flange, the composite flange is divided into two main parts
and are named as flange (flange disc), and the hub. As illustrated in the chapter five,
the fibre volume fractions (Vf) were measured for all the parts and they were found
60.7% for the flange and 60.1% for the hub. In addition, the braid angles of the braid
fiberglass sleeves were measured for all the parts and were considered as fixed at
±65˚, ±44.5 for the flange and the hub, respectively.
Using the above parameters and through the Helius composite software, composite
laminate were modelled for each part by using the micro mechanical properties of
the fibre (glass fibre) and the resin (polyester), which are explained in the Table 6.1.
Fig. 6.3: Dimensions of the bolted flange joint (mm)

Chapter six Numerical simulation methodology
117
The orthotropic mechanical properties of these laminates represent the elastic
properties of the composite flange, which are used in this FE model. The properties
are shown in the Table 6.2.
Table 6.1: Mechanical properties of the glass fibre, polyester resin and the adhesive
Glass fibre Polyester Adhesive epoxy
E (GPa) 72.4 3.24 1.3
G (GPa) 30.34 1.17 0.46
ν 0.2 0.38 0.41
Tensile strength (MPa) 45
Compressive strength (MPa) 80
Shear strength (MPa) 30
Table 6.2: Typical orthotropic mechanical properties of the flange and the pipe
Young’s
modulus (GPa)
Shear
modulus (GPa) Poisson’s ratio ----
Flange (disc)
Ex 11.90 xy 9.45 xy 0.25
Ey 29.53 yz 4.22 yz 0.12
Ez 13.77 xz 4.34 xz 0.35
Hub
Ex 14.38 xy 4.20 xy 0.19
Ey 13.00 yz 13.02 yz 0.59
Ez 13.36 xz 4.20 xz 0.18
Filament winding pipe
Ex 18.99 xy 6.72 xy 0.15
Ey 24.36 yz 12.12 yz 0.48
Ez 17.69 xz 6.64 xz 0.30

Chapter six Numerical simulation methodology
118
6.2.3 Filament winding pipe modelling
As mentioned earlier, a number of previous studies [8, 72] have indicated that the
optimum wounding angle of filament wound composite pipes subjected to internal
pressure is 55˚. Subsequently, in this study, an angular portion of 1/16th of filament
wound composite pipe made of GRP materials with wounding angle of 55˚ has been
selected and modelled in 3D FEA model. As same the procedure of the flange, the
fibre volume fraction and the wounding angle both have been measured
experimentally and they were 52% and 55˚, respectively. Then, the material
properties have been calculated using the Helius composite. These properties of the
filament wounding pipe are listed in the Table 6.2.
6.2.4 Bonded flange-pipe modelling
As mentioned earlier, taper-taper joint type has been chosen to connect the GFRP
flange with the GFRP pipe because it is stronger than other types of joints due to the
larger surface contact areas. These two bodies (flange and pipe) are bonded by using
epoxy as an adhesive material. An FEA model has been developed to simulate a
1/16th angular portion of adhesively bonded components made of non-identical
materials and properties. The mechanical properties of the adhesive (epoxy) are
shown earlier in the Table 6.1. In addition, all contact surfaces are considered as
smooth (in other words, the roughness does not exist).
6.2.5 Fasteners modelling
In this study, one-half of the upper half of the bolt has been modelled (as shown in
the Fig. 6.4 because of symmetry with respect to the plane that passes through the
gasket mid thickness and the bolts as well as the symmetry about the axial axis. The
bolt material characteristics are assumed to be homogeneous, isotopic and linearly
elastic. The bolts were chosen as stainless steel 304 (A2-70) and their mechanical
properties are Young's modulus E=193 GPa and poison’s ratio v=0.3.

Chapter six Numerical simulation methodology
119
6.2.6 Modelling the rubber gasket
In this study, Nitrile and Viton rubber gaskets have been chosen to seal the flange
joint due to their high performances with oil and gas industries. Rubber materials are
usually in compressible mode and its overall response is quite nonlinear. Therefore,
it is not appropriate to use the Young's modulus and the Poisson’s ratio to define a
gasket in FEA as a linear material. However, it is required to apply a complete
pressure-closure response which gives the actual behaviour of the rubber material
exhibiting nonlinear behaviour in loading and unloading conditions. ANSYS offers a
number of elements to model gaskets. These elements consider geometric and
material nonlinearities. Therefore, based on the standard ASME D575-91 [110], a
load compressive mechanical tests have been conducted for finding the mechanical
characteristics of each gasket and during the loading and the unloading conditions.
The data of both gaskets (Nitrile and Viton), which were used in the FEA model, are
explained in Fig. 6.5 and Fig. 6.6 and the values are documented in Table 6.3 and
Table 6.4.
In addition, the FEA model has taken into account the effect of the transverse shear
stiffness TSSxy= TSSxz= G/h. The G is the shear modulus and the h is the thickness
of the rubber gasket. The shear modulus has been measured experimentally
Bolt
Washer
Fig. 6.4: Fastener modelling
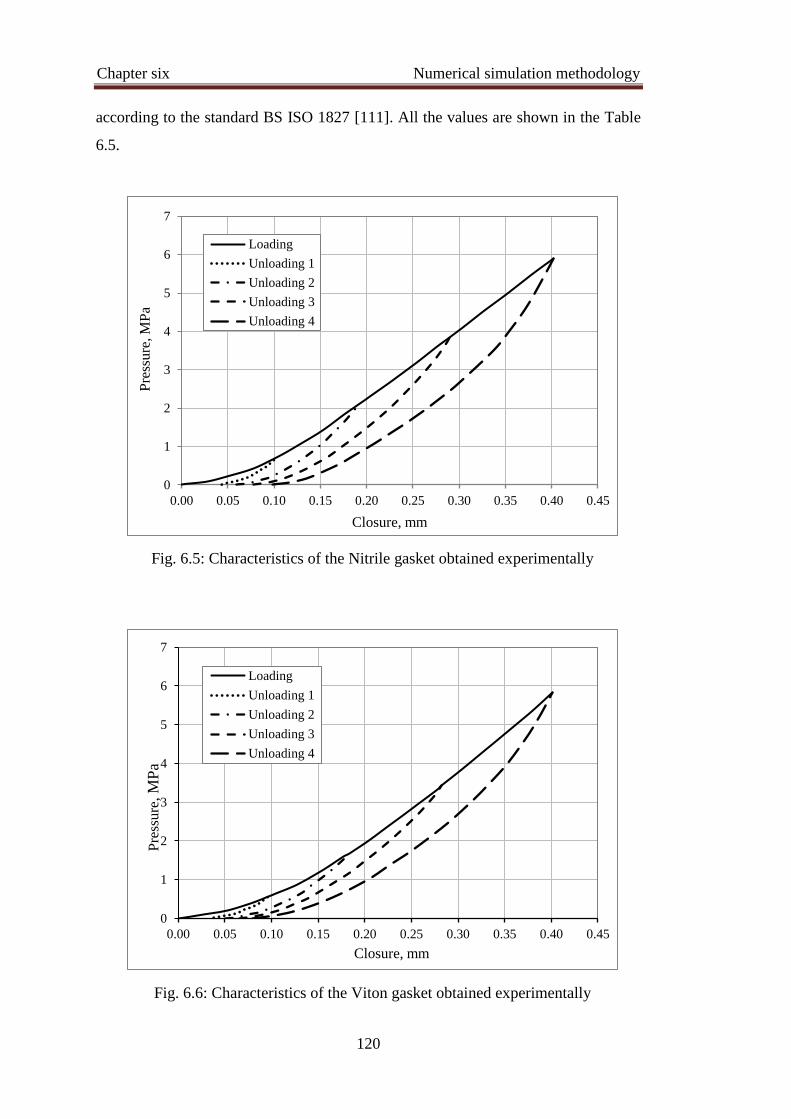
Chapter six Numerical simulation methodology
120
according to the standard BS ISO 1827 [111]. All the values are shown in the Table
6.5.
0
1
2
3
4
5
6
7
0.00 0.05 0.10 0.15 0.20 0.25 0.30 0.35 0.40 0.45
Pre
ssu
re, M
Pa
Closure, mm
Loading
Unloading 1
Unloading 2
Unloading 3
Unloading 4
Fig. 6.5: Characteristics of the Nitrile gasket obtained experimentally
0
1
2
3
4
5
6
7
0.00 0.05 0.10 0.15 0.20 0.25 0.30 0.35 0.40 0.45
Pre
ssu
re, M
Pa
Closure, mm
Loading
Unloading 1
Unloading 2
Unloading 3
Unloading 4
Fig. 6.6: Characteristics of the Viton gasket obtained experimentally
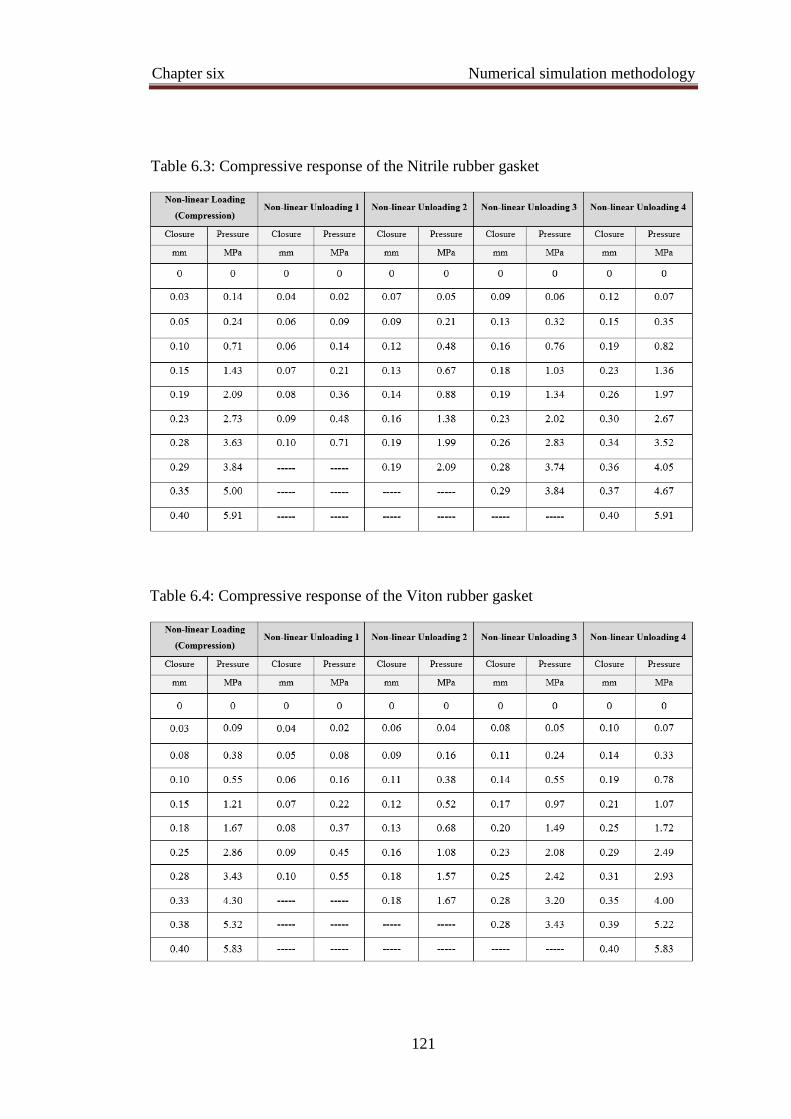
Chapter six Numerical simulation methodology
121
Table 6.3: Compressive response of the Nitrile rubber gasket
Table 6.4: Compressive response of the Viton rubber gasket
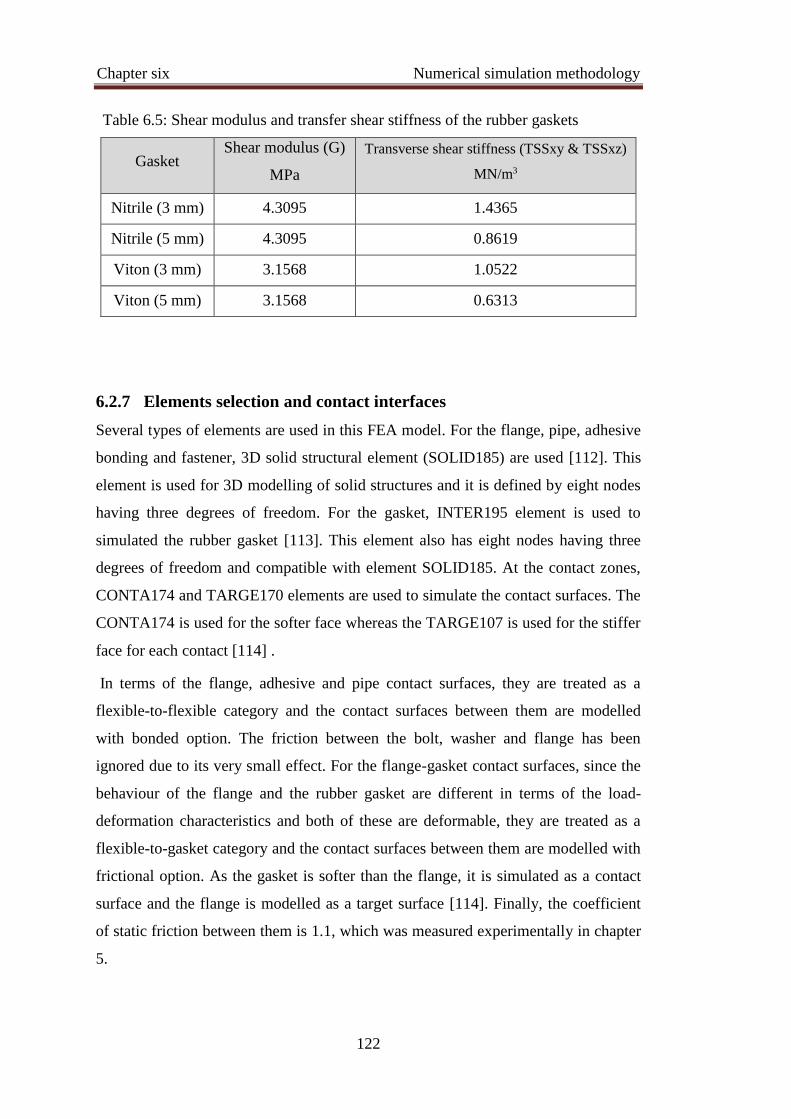
Chapter six Numerical simulation methodology
122
6.2.7 Elements selection and contact interfaces
Several types of elements are used in this FEA model. For the flange, pipe, adhesive
bonding and fastener, 3D solid structural element (SOLID185) are used [112]. This
element is used for 3D modelling of solid structures and it is defined by eight nodes
having three degrees of freedom. For the gasket, INTER195 element is used to
simulated the rubber gasket [113]. This element also has eight nodes having three
degrees of freedom and compatible with element SOLID185. At the contact zones,
CONTA174 and TARGE170 elements are used to simulate the contact surfaces. The
CONTA174 is used for the softer face whereas the TARGE107 is used for the stiffer
face for each contact [114] .
In terms of the flange, adhesive and pipe contact surfaces, they are treated as a
flexible-to-flexible category and the contact surfaces between them are modelled
with bonded option. The friction between the bolt, washer and flange has been
ignored due to its very small effect. For the flange-gasket contact surfaces, since the
behaviour of the flange and the rubber gasket are different in terms of the load-
deformation characteristics and both of these are deformable, they are treated as a
flexible-to-gasket category and the contact surfaces between them are modelled with
frictional option. As the gasket is softer than the flange, it is simulated as a contact
surface and the flange is modelled as a target surface [114]. Finally, the coefficient
of static friction between them is 1.1, which was measured experimentally in chapter
5.
Gasket Shear modulus (G)
MPa
Transverse shear stiffness (TSSxy & TSSxz)
MN/m3
Nitrile (3 mm) 4.3095 1.4365
Nitrile (5 mm) 4.3095 0.8619
Viton (3 mm) 3.1568 1.0522
Viton (5 mm) 3.1568 0.6313
Table 6.5: Shear modulus and transfer shear stiffness of the rubber gaskets

Chapter six Numerical simulation methodology
123
6.2.8 Boundary and loading conditions
As mentioned earlier, due to the rotational symmetry and also due to the symmetry
about the plane that passes through the gasket mid thickness, the boundary
conditions and the loads are applied to an upper single segment in the analysis. For
the model created in the cylindrical coordinate system, the circumferential
displacements in the normal direction on the surface of the cyclic symmetry are
assumed as fixed, i.e. Uθ=0. Also, the displacements of elements that located at the
bottom surface of the gasket are considered as fixed, i.e. Uz=0. See Fig. 6.7. These
boundary conditions are assigned for both bolt up and pressure loading stages, which
will be discussed in the next sections. These boundary conditions have been applied
as suggested in previous studies [39, 40, 45].
6.2.8.1 Bolt up loading conditions
Initially, a bolted flange connection system is analysed to obtain the initial stress and
deformation during the seating condition in all its parts when the initial clamping
force is applied during assembly. In this stage, the rubber gasket is subjected to
compressive pressure that deforms the gasket to fill the irregularities on the flange
face ensuring full contact over the surfaces. For achieving this initial stress value in
this FE model, only the bolt pre-load force is applied to the lower bolt surface.
6.2.8.2 Pressure loading conditions
This research work includes modelling the bolted flange system under combined bolt
pre-load and internal pressure to study the strain, stress and the deformation of the
joint and to investigate the sealing performance. Hydrostatic end force and pressure
induced on the joint system as well as the bolt load have been applied in the initial
clamping phase. The hydrostatic end force is calculated based on the inner diameter
of a pipe as shown in the Eq. (6.1)
𝑃𝑘 =𝐴𝑖
𝐴𝑘𝑃 . . . (6.1)
This force has been converted to equivalent pressure load and applied uniformly in
the axial direction at the end of the pipe. The working pressure load is applied over
all elements of the internal surfaces of the pipe and the gasket.
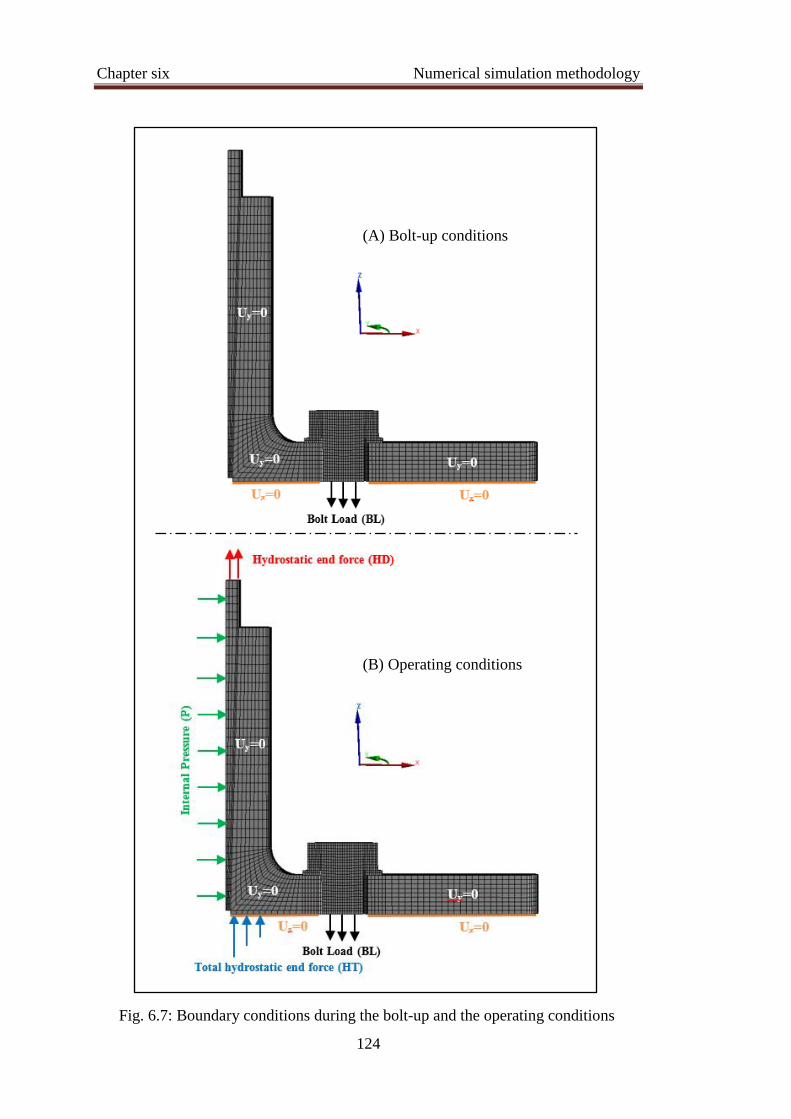
Chapter six Numerical simulation methodology
124
Fig. 6.7: Boundary conditions during the bolt-up and the operating conditions
(A) Bolt-up conditions
(B) Operating conditions
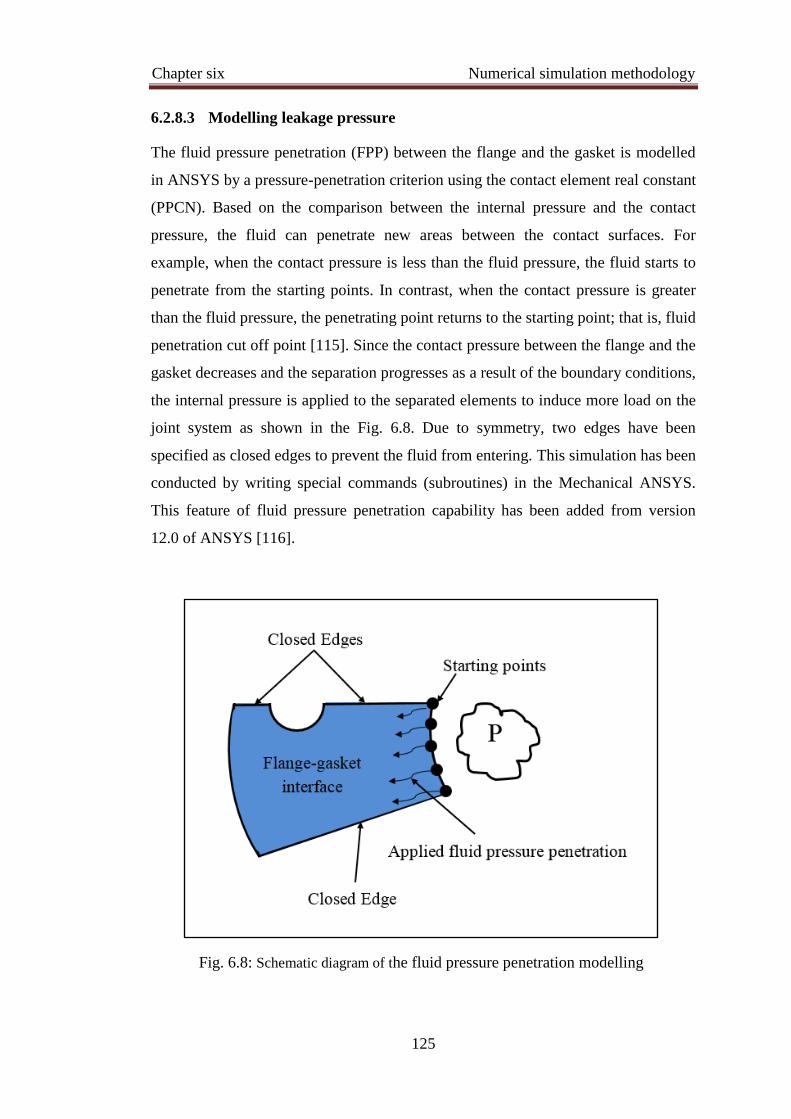
Chapter six Numerical simulation methodology
125
6.2.8.3 Modelling leakage pressure
The fluid pressure penetration (FPP) between the flange and the gasket is modelled
in ANSYS by a pressure-penetration criterion using the contact element real constant
(PPCN). Based on the comparison between the internal pressure and the contact
pressure, the fluid can penetrate new areas between the contact surfaces. For
example, when the contact pressure is less than the fluid pressure, the fluid starts to
penetrate from the starting points. In contrast, when the contact pressure is greater
than the fluid pressure, the penetrating point returns to the starting point; that is, fluid
penetration cut off point [115]. Since the contact pressure between the flange and the
gasket decreases and the separation progresses as a result of the boundary conditions,
the internal pressure is applied to the separated elements to induce more load on the
joint system as shown in the Fig. 6.8. Due to symmetry, two edges have been
specified as closed edges to prevent the fluid from entering. This simulation has been
conducted by writing special commands (subroutines) in the Mechanical ANSYS.
This feature of fluid pressure penetration capability has been added from version
12.0 of ANSYS [116].
Fig. 6.8: Schematic diagram of the fluid pressure penetration modelling

Chapter six Numerical simulation methodology
126
6.3 Summary
In this chapter, the methodologies to simulate the bolted flange joint system using
ANSYS FEA has been discussed. This FEA includes all components of the bolted
flange joint; such as composite flange and pipe with their orthotropic mechanical
properties, adhesive bonding and fastener with their isotropic properties and the
rubber gaskets with their non-linear behaviour during the loading and unloading
conditions. Nitrile and Viton rubber gaskets with different thicknesses have been
used in this FEA. Various types of elements have been used based on the ANSYS
guidelines and they have shown high performances.
Boundary conditions have been applied in two stages, bolt up and operating
conditions. The symmetry boundary conditions (zero displacements) have been
applied in both stages. In the bolt up condition, the bolt force has been applied
whereas the internal pressure and the fluid pressure penetration along with the bolt
force have been applied in the operating conditions. The fluid pressure penetration
simulation has been set up using PPNC criterion and applied between the flange and
the rubber gasket.
The results of this FEA will include the flange joint deformation, axial, hoop and
radial strains, displacements, rotation and the leakage pressure. The effect of the
applied loads, flange dimensions as well as the gasket type and thickness on all the
above results will be investigated.
In the next chapter, two validations of the FE model will be conducted. The first
validation will be carried out through the experimental work, which will include
manufacturing of the bolted GFRP flange joint and its testing in the laboratory. The
other validation will be done using an FE model, which has been investigated
experimentally and numerically by a previous study. Finally, the results will be
compared and discussed.

Chapter seven Validation
127
CHAPTER SEVEN
VALIDATION
7.1 Introduction
Validation is a method to verify the predictive capabilities of any mathematical or
numerical model that are tested against experimental data. Validation is usually used
to validate a mathematical or a numerical model of large projects, which cannot be
tested at full scale, such as dams, siting of nuclear power plants [117]. In such cases,
designers make a small model and test under the same conditions that are applied to
the real (large) model. Then, they develop mathematical/numerical model and
compare with the information collected during the test. The main reason for
developing mathematical or numerical model is to eliminate the high costs of
experiments that are time consuming and complex in nature [118]. Usually, the cost
of experiments increases with the complexity of the test procedure. Therefore, the
finite element analysis (FEA) method is considered as one of the most powerful
numerical methods that are widely used for finding approximate solutions to
complex methodical or physical problems.
This chapter aims to validate the numerical results obtained for an FEA model of
bolted GFRP flange connection (shown in Fig. 7.1) through laboratory experiments.
The numerical results will also be validated against published simulation results
available elsewhere in the literature [1].

Chapter seven Validation
128
7.2 Experimental validation
As explained in chapter 4 and 5, the bolted GFRP flange joint (Hub flange) has been
manufactured based on the ASME Boiler and Pressure Vessel Code, Section X [24]
using vacuum infusion process. However, both the flange outside diameter and the
hub length are considered to be more than the specified to perform a range of
experiments with various dimensions. The flange has been bonded to GFRP pipe
after chamfering its ends. Another type of composite flange, which is called heavy-
duty (HD) flange, was bonded to the other end of the pipe. Both flanges, hubbed
flange and HD flange, were sealed by using Acrylic and metallic blind flanges,
respectively, along with different types of rubber gaskets such as Nitrile and Viton
(both are 3 mm in thickness). For both ends, 16th bolts were used to close the system
for producing a complete pressure vessel as shown in Fig. 7.2. During the test,
several equipment were used such as pump, pressure gauge, digital torque wrench
and various types of valves. Due to the radial symmetry, a 1/16th region of the flange
joint has been chosen to collect the data from a total of 16 strain gauges that are either
distributed on the flange body of the selected sector or embedded inside the bolts
situated around the selected region. Four strain gauge boxes and two laptops were
used during the test to construct a computerised data acquisition system. The loads
were applied in two steps. These steps are categorised as (1) bolt up condition or
gasket seating stage and (2) operating condition or pressurised stage. For the first
stage, bolt loads from 0 up to 9.69 kN were applied at zero pressure. For the second
stage, bolt loads were applied from 0 up to 9.69 kN, which is the bolt load design at
the flange diameter 300 mm, with an internal pressure from 0 up to the pressure at
which leak occurs.

Chapter seven Validation
129
7.2.1 Bolt up condition
During this stage, various bolt preloads were applied (from 0 up to 9.69 kN) using
digital torque wrench. The purpose of the digital torque wrench is to maintain the
same axial loads for all the bolts. Strain gauges were attached to some of the bolts to
measure the axial strain on the bolts along with the measurement of torque with the
Fig. 7.1: FEA model
Right edge
Left edge
Top right corner
Bottom right corner
Top left corner
Bottom left corner
Mid-point
Selected
area
Fig. 7.2: Pressure vessel during the test
HD flange
Data
collector
GFRP
flange
Pump
Pressure
gauge
Laptops

Chapter seven Validation
130
help of torque wrench. It has been ensured that the same torque is applied to all the
bolts in order to achieve required compressive pressure on the gasket. The
compressive pressure deforms the gasket and fills the gaps on the flange face ensuring
full contact over the entire surface. The bolt up loads and other boundary conditions
explained in the chapter 6 have been applied in the numerical simulation.
7.2.1.1 Hub axial strain
The interfacial region between the flange disc and the hub is one of the most
important areas that are subjected to axial strain. This is due to the axial bolt loads,
which are required to seat the gasket and to create a sufficient contact pressure
between the flange and the gasket. The axial strain values near the bolts in the
circumferential directions are higher than any other regions between the bolts.
Fig. 7.3 shows the axial strain at the lower part of the hub measured at the front of
the bolt centre and just above the flange-hub intersection. Fig. 7.3 clearly shows the
variations in experimental and numerical values of the axial strain for different types
of gasket (Flange-Nitrile (FN) gasket and Flange-Viton (FV) gasket).
It is obvious in this figure that the hub axial strain increases with the increase in the
bolt loads, however, the strain values are small which indicates high performance of
the proposed flange joint. The experimental data shows non-linear trend especially at
the lower bolt loads whereas the FEA results are linear. This is because the lower
face of the flange in the experiment was not flat. The outside diameter edge of the
flange was not at the same level as it was at the edge of the inner diameter. This
phenomenon is called flange spring back and it usually occurs for the hub composite
flange due to the polymer shrinkage during the curing process [51]. The effect of the
spring back on the axial strain is appeared clearly at the beginning of the bolt preload
stage when bolt loads are low. The flange face was not in full contact with the gasket,
as a result, the flange required extra bolt loads to close the gap between the flange
and the gasket. This caused bending to the flange as well as reduced gasket reaction
in some contact areas especially near outside the bolt circle. Therefore, higher strain
values were generated. This phenomenon could not be implemented into the FEA
model as a boundary condition, hence, the numerical results showed different trends
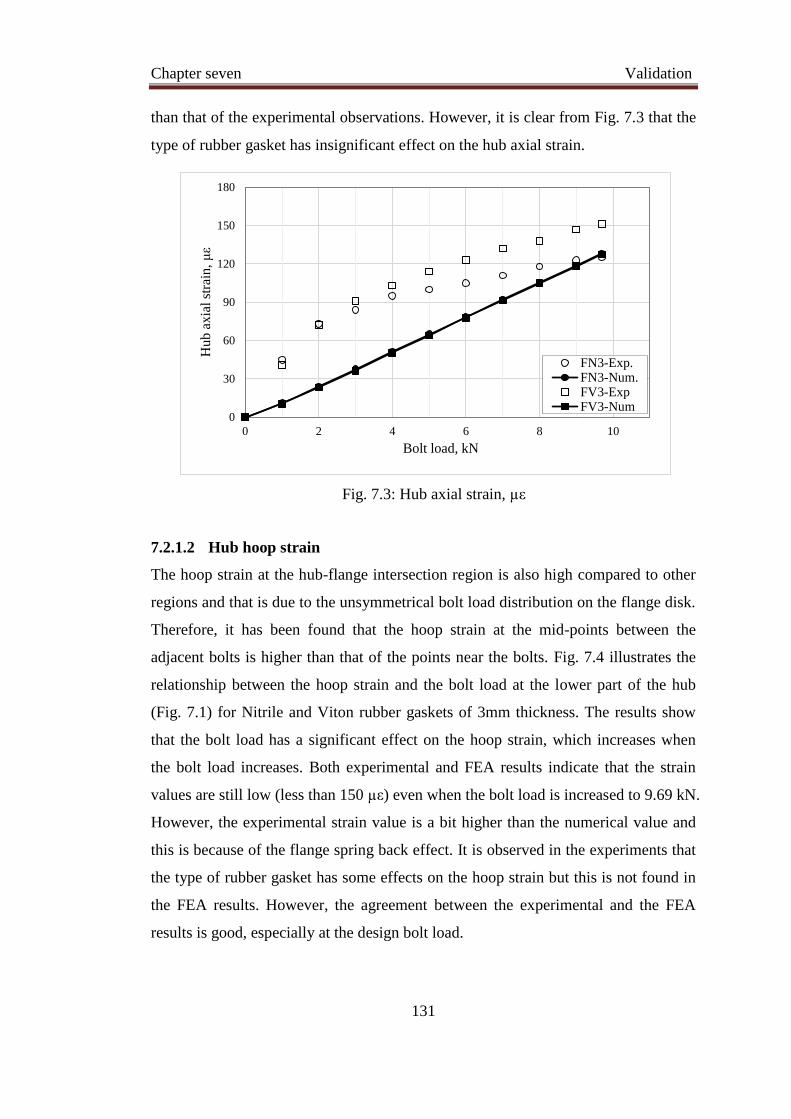
Chapter seven Validation
131
than that of the experimental observations. However, it is clear from Fig. 7.3 that the
type of rubber gasket has insignificant effect on the hub axial strain.
7.2.1.2 Hub hoop strain
The hoop strain at the hub-flange intersection region is also high compared to other
regions and that is due to the unsymmetrical bolt load distribution on the flange disk.
Therefore, it has been found that the hoop strain at the mid-points between the
adjacent bolts is higher than that of the points near the bolts. Fig. 7.4 illustrates the
relationship between the hoop strain and the bolt load at the lower part of the hub
(Fig. 7.1) for Nitrile and Viton rubber gaskets of 3mm thickness. The results show
that the bolt load has a significant effect on the hoop strain, which increases when
the bolt load increases. Both experimental and FEA results indicate that the strain
values are still low (less than 150 µε) even when the bolt load is increased to 9.69 kN.
However, the experimental strain value is a bit higher than the numerical value and
this is because of the flange spring back effect. It is observed in the experiments that
the type of rubber gasket has some effects on the hoop strain but this is not found in
the FEA results. However, the agreement between the experimental and the FEA
results is good, especially at the design bolt load.
Fig. 7.3: Hub axial strain, µε
0
30
60
90
120
150
180
0 2 4 6 8 10
Hu
b a
xia
l st
rain
, μ
ε
Bolt load, kN
FN3-Exp.FN3-Num.FV3-ExpFV3-Num

Chapter seven Validation
132
7.2.1.3 Flange hoop strain
Fig. 7.5 shows the hoop strain on the upper face of the flange at the mid-points
between two adjacent bolts (Fig. 7.1). Due to the bending of flange with bolt loads
and the reaction of the gasket, the upper face of the flange is subjected to hoop
tension strain whereas the lower face is subjected to hoop compression strain. It can
be seen in Fig. 7.5 that the hoop strain increases with the increase in the bolt load
almost linearly. The experimental results showed that there was a slight difference in
the hoop strain for the Nitrile gasket than that of the Viton gasket. The hoop strain
with Viton rubber gasket was slightly higher than the Nitrile rubber gasket. However,
the FEA results do not vary with the type of gaskets. Generally, a good agreement is
achieved between the experimental and the numerical results.
0
20
40
60
80
100
120
140
160
0 2 4 6 8 10
Ho
op
hu
b s
trai
n,
με
Bolt load, kN
FN3-Exp.FN3-Num.FV3-ExpFV3-Num
Fig. 7.4: Hub hoop strain, µε

Chapter seven Validation
133
7.2.2 Operating conditions
The internal fluid pressure of the pipe is the main load that is applied during the
operating conditions (stage). This stage should always follow the bolt preload stage,
which include applying the bolt load and seating the gasket to fill the irregularities of
the flange faces. The stage also leads to create a contact pressure that should be able
to withstand the leakage propagation of the internal pressurized fluid. The internal
pressure used in this study is up to the leakage pressure including the design internal
pressure (3.4 bar) at different bolt loads. Additional boundary conditions are applied
in the numerical simulation, which take into account the effect of hydrostatic end
force of the pipe and the symmetry of the flange. The detailed boundary conditions
are explained under section 6.2.8.
7.2.2.1 Axial Strain
The axial strain has been measured at various places during the pressurized stage.
Two strain gauges were placed at different places on a radial line that passes through
the bolt centre (left edge) whereas other two strain gauges were placed on a radial
line that passes through the mid-point between the contiguous bolts (right edge) as
0
50
100
150
200
250
300
350
400
0 2 4 6 8 10
Ho
op
fla
ng
e st
rain
, μ
ε
Bolt load, kN
FN3-Exp.
FN3-Num.
FV3-Exp
FV3-Num
Fig. 7.5: Flange hoop strain, µε

Chapter seven Validation
134
shown in the Fig. 7.1. Two of the four strain gauges (mentioned above) were placed
on the top edge of the hub whereas the other two were bonded onto the bottom edge
of the hub, which is just above the Flange-hub intersection that represents one of the
critical points on the bolted GFRP Flange connection as shown in the Fig. 7.1.
Fig. 7.6 shows the axial strain on the top-left corner of the hub as a function of the
internal pressure up to the leakage pressure for Nitrile and Viton rubber gaskets.
Both the experimental and the FEA results showed that the outer face of this region
was exposed to the compression axial strain. The axial compression strain increased
with the increase in the internal pressure. This is due to the internal pressure that was
applied on the internal face of the pipe and the force that was produced by the
internal fluid of the surface contact between the flange and the rubber gasket. It is
observed that the gasket type has insignificant effects on the axial strain at this
region but gasket type has influenced the leakage pressure. It can be seen clearly in
the figure that the leakage pressure of Flange-Nitrile gasket (FN) is 7.9 bar for the
experiment and 8.7 bar for the FEA. Whereas these values are 9.2 bar and 8.2 bar
respectively for the Flange-Viton gasket (FV). The variation in experimental results
between the two types of gaskets is 1.3 bar whereas the difference in the FEA results
is only 0.5 bar. Generally, a good agreement is obtained between the experimental
and the FEA results for both the axial strain and the leakage pressure.
The variation of axial strain on the top-right corner of the hub (at a point between
two adjacent bolts) with the internal pressure up to the leakage pressure at bolt load
9.69 kN is presented in the Fig. 7.7 . Similar to the axial strain in the top-left corner
plotted in the Fig. 7.6, a compression axial strain was produced due to the flange
bending by the internal pressure.

Chapter seven Validation
135
The variation of the axial strain with the pressure is almost linear in both
experimental and numerical cases and the agreement between them is very good. It
should be noted that the results are not affected by the gasket materials. In addition,
the maximum values of the axial strain in both the top corners (Fig. 7.6 & Fig. 7.7)
in experiments and numerical simulations is less than 150 µε , which is very low
compared to the applied internal pressure at the point of leakage. This confirms that
the proposed flange is well designed and the use of ASME code is conservative.
-160
-140
-120
-100
-80
-60
-40
-20
0
0 2 4 6 8 10
Ax
ial
stra
in,
με
Pressure, bar
FN-Exp
FN-Num
FV-Exp
FV-Num
Fig. 7.6: Axial strain, µε (top-left)
-160
-140
-120
-100
-80
-60
-40
-20
0
0 2 4 6 8 10
Axia
l st
rain
, μ
ε
Pressure, bar
FN-Exp
FN-Num
FV-Exp
FV-Num
Fig. 7.7: Axial strain, µε (top-right)

Chapter seven Validation
136
As mentioned earlier, the Flange- hub intersection represents a critical region in the
bolted flange joint and especially for the composite flange. This is due to the strain
concentration in the region by the bolt and pressure loads. Usually, most of the
commercially available hubbed composite flanges fail in the same region [33].
Fig. 7.8 represents the axial strain variation with the internal pressure at the bottom-
left corner and just above the flange-hub intersection (at a height of 45 mm above the
flange face). The left edge is in front of the bolt centre whereas the right edge is the
edge that is allocated at the mid-point between two adjacent bolts (Fig. 7.1). This
region is exposed to the tension axial strain, in contrast of the hub top edge, which is
subjected to axial compression strain. When the internal pressure is increased up to
the leakage pressure, both the experimental and the FEA axial strain increased.
However, the FEA axial strain from 5 bar to 6 bar remains almost constant. There
are two reasons that could lead to this: firstly, the non- linear radial propagation of
the pressurized fluid between the flange and the gasket produces extra forces on the
flange face, which tries to push up the flange and minimizes the flange bending. The
second reason could be the non-linear responses of the gaskets. The axial strain is
not influenced by the gasket type. The agreement between the experiment and the
FEA results was good as the maximum difference between the leakage pressure
between them is less than 1 bar for both Flange-Nitrile (FN) and Flange-Viton (FV)
0
50
100
150
200
250
300
0 2 4 6 8 10
Axia
l st
rain
, μ
ε
Pressure, bar
FN-Exp
FN-Num
FV-Exp
FV-Num
Fig. 7.8: Axial strain, µε (bottom-left)

Chapter seven Validation
137
gaskets. It can be seen clearly in Fig. 7.3 and Fig. 7.8 that the bolt preload has
affected the axial strain more than the internal pressure.
Fig. 7.9 presents the axial strain on the bottom of the hub at the right edge (which is
in the middle of the two bolts) as a function of the internal pressure. The axial strain
is affected by the internal pressure and its values at this area are less than that at the
left edge near the bolt when compared with the results in the Fig. 7.8. This is because
of the bolt load, which bends the flange at the bolt holes more than in any other
regions. This phenomenon can be clearly explained through the calculations of the
flange displacements at the inner and the outer diameters and along the flange
rotation and this will be discussed extensively in the next chapter.
7.2.2.2 Hoop strain
Hoop strain is very important for the design of the bolted GFRP flange joint. At the
hub, the hoop strain is measured and investigated to see the influence of the applied
loads (bolt and pressure loads) on the circumferential expansion or deformation. In
addition, hoop strain is a good indication to analyse the flange bending in the
circumferential direction, which is produced due to the bolt preload and the internal
pressure. Therefore, as with axial strain, the hoop strains were measured at different
places on the flange joint body (hub and flange disc).
0
50
100
150
200
250
300
0 2 4 6 8 10
Axia
l st
rain
, μ
ε
Pressure, bar
FN-Exp
FN-Num
FV-Exp
FV-Num
Fig. 7.9: Axial strain, µε (bottom-right)

Chapter seven Validation
138
Fig. 7.10 shows the relationship between the hoop strain and the internal pressure,
which is increased up to the leakage pressure, at the hub top-left edge of the selected
portion for this study (Fig. 7.1). It is found that the internal pressure has a significant
effect on the hoop strain at this area but the bolt load has very small impact. This can
be seen clearly at the beginning of the plot where the pressure is zero but the bolt
force is 9.69 kN. The hoop strain is increased when the internal pressure is increased
and it is not affected by the gasket behaviours. The agreement between the
experimental and the numerical results was excellent. This confirms that the finite
elements analysis method could be considered as a good tool to simulate the bolted
fibre reinforced polymer flange connection with the advantage of saving the cost for
manufacturing and testing, which are also time consuming.
Fig. 7.11 demonstrates the hoop strain at the hub top right corner, which is the
middle line between two adjacent bolts in the chosen part of the joint. This figure
shows the hoop strain variation with the internal pressure up to the leakage for two
different types of rubber gasket. Comparing with the hoop strain at the left side
shown in the Fig. 7.10, the right side hoop strain is slightly less than those at the left
corner, which is located at the front of the bolt corner. The gasket type has influences
on the hoop strain when measured experimentally but no influence is observed when
Fig. 7.10: Hoop strain, µε (top-left)
-50
0
50
100
150
200
250
0 2 4 6 8 10
Hoop s
trai
n,
με
Pressure, bar
FN-Exp
FN-Num
FV-Exp
FV-Num

Chapter seven Validation
139
measured numerically. The experimental data of Flange-Nitrile rubber gasket (FN)
is slightly higher than that of the Flange-Viton rubber gasket (FV).
Fig. 7.12 denotes hoop strain as a function of the internal pressure for the hub
bottom left corner of the chosen study area, which is just above the flange hub
intersection. The results showed that this area is subject to the tensile hoop strain and
is increased with the increase in the internal pressure up to the leakage point. The
values of the hoop strain at this point are higher than those values at the hub top left
shown in the Fig. 7.10. This is because the area at the bottom edge is subjected to the
effects of the bolts loads in addition to the internal pressure. In other words, the
influence of the bolt load at the flange-hub intersection is more than that at the top
edge of the hub. This can be seen clearly when the hoop strain values at the pressure
of 0 bar are compared in Fig. 7.10, Fig. 7.11, Fig. 7.12 and Fig. 7.13.
-50
0
50
100
150
200
250
0 2 4 6 8 10
Ho
op
str
ain
, μ
ε
Pressure, bar
FN-Exp
FN-Num
FV-Exp
FV-Num
Fig. 7.11: Hoop strain, µε (top-right)

Chapter seven Validation
140
Moreover, the gasket type has insignificant impact on the hub strain and the
agreement between FEA and experimental results is very good.
Fig. 7.13 illustrates the variation in the hoop strain with the internal pressure up to
the leakage point for the regions at the bottom right edge of the hub. As it is
observed, increasing the internal pressure has led to the increase in the hoop strain.
The FEA results are slightly higher than the experimental results up to 5 bar of the
pressure but it decreases after 5 bar and becomes closer to the experimental results.
0
50
100
150
200
250
300
350
0 2 4 6 8 10
Hoop s
trai
n,
με
Pressure, bar
FN-Exp
FN-Num
FV-Exp
FV-Num
Fig. 7.13: Hoop strain, µε (bottom-right)
0
50
100
150
200
250
300
350
0 2 4 6 8 10
Ho
op
hu
b s
trai
n,
με
Pressure, bar
FN-Exp
FN-Num
FV-Exp
FV-Num
Fig. 7.12: Hoop strain, µε (bottom-left)

Chapter seven Validation
141
This might be due to the non-linear radial propagation of the pressurized fluid
between the flange and the gasket. This changes also occurred with the axial strain at
the same points (as can be seen in Fig. 7.8 and Fig. 7.9). In addition, it can be
noticed that the hub strain at the bottom right edge of the hub (mid-point between
two adjacent bolts) is higher than that of at the bottom left edge of the hub, which is
located near the bolt. In contrast, the axial strain on the hub and at the front of the
bolt is higher than that at the middle point. The hub strain is not influenced by the
gasket types or gasket response.
The hoop strain was also measured on the flange disc at the middle point between
two adjacent bolts and along the circumferences of the holes. As shown in the Fig.
7.14, hoop strain at this point is slightly influenced by the internal pressure but it is
affected significantly by the bolt. Similar effects can be seen in the results presented
in Fig. 7.5 and Fig. 7.14 for zero internal pressure. Therefore, this area is already
strained in the bolt preload stage.
In addition, the FEA results show that the upper face of the flange at this point is
exposed to the tensile hoop strain whereas the lower face is subjected to the
compression strain. This is due to the bolt loads, which are distributed
unsymmetrically around the Flange. This phenomenon will be explained and
0
100
200
300
400
500
600
0 2 4 6 8 10
Hoop s
trai
n,
με
Pressure, bar
FN-Exp
FN-Num
FV-Exp
FV-Num
Fig. 7.14: Flange hoop strain, µε

Chapter seven Validation
142
described explicitly in the next chapter under the sections of flange displacement and
rotation.
7.2.2.3 Radial strain
The radial strain has been measured at various places on the upper face of the flange
experimentally and numerically. Most of the results showed that the radial strain
values are small (less than 100 µε) during the bolt-up conditions as well as in the
operating conditions.
The radial strain variation with the internal pressure at the bolt centre (left edge) and
at the outside of the bolt circle is shown in Fig. 7.15. The experimental results
illustrate that the internal pressure has negligible influence on the radial strain. The
FEA results show that initially the radial strain at low or even at zero pressure is
higher than the experimental data but eventually the strain becomes almost identical
at higher pressures (5 bar and beyond). The difference in the radial strain values at
the low pressure is the result of the flange spring back, which is not captured in the
simulation.
Experimentally, the contact pressure between the flange and the gasket at the inner
bolt circle is higher than that of the outer regions. The gasket reaction is also less at
the outer regions thereby the radial strain is low at the beginning. In the numerical
simulation, there is full contact between the flange and the gasket, so the gasket
reaction is created at the same time in all of the contact areas. This has led to
increase the radial strain in the numerical simulation during the bolt preload and at
the low pressure. In addition, the leak propagation in the FEA simulation at the low
pressure is more than that observed in the experiments thereby the pressure forces in
the FEA is more than the experimental values. These forces are applied on the inner
face of the pipe and on the flange-gasket interface. Increasing these forces (i.e.
increasing the pressure) leads to bend the flange along with an increase in the gasket
reaction at the outer area of the circumferences of the holes. This also leads to drop
the radial pressure up to around 5 bar as shown in the Fig. 7.15. The gasket type has
an impact and the Nitrile rubber gasket produces the radial strain more than the

Chapter seven Validation
143
Viton gasket as observed both in the experiment and in the numerical simulation.
Both the experimental and the numerical results are in good agreement.
Fig. 7.16 shows the relationship between the radial strain and the internal pressure up
to the leakage at the middle point between two adjacent bolts and at the outer bolt
circle. It is observed that this point is subjected to small compression strain (less than
40 µε) and it is almost not influenced by the internal pressure. The FEA results was
are slightly different because of the spring back of the GFRP flange. The gasket type
has insignificant impact on the radial strain. Generally, the FEA and the
experimental results achieved good agreement with each other.
0
20
40
60
80
100
120
140
160
0 2 4 6 8 10
Rad
ial
stra
in,
με
Pressure, bar
FN-Exp
FN-Num
FV-Exp
FV-Num
Fig. 7.15: Flange radial strain, µε, (bolt centre)
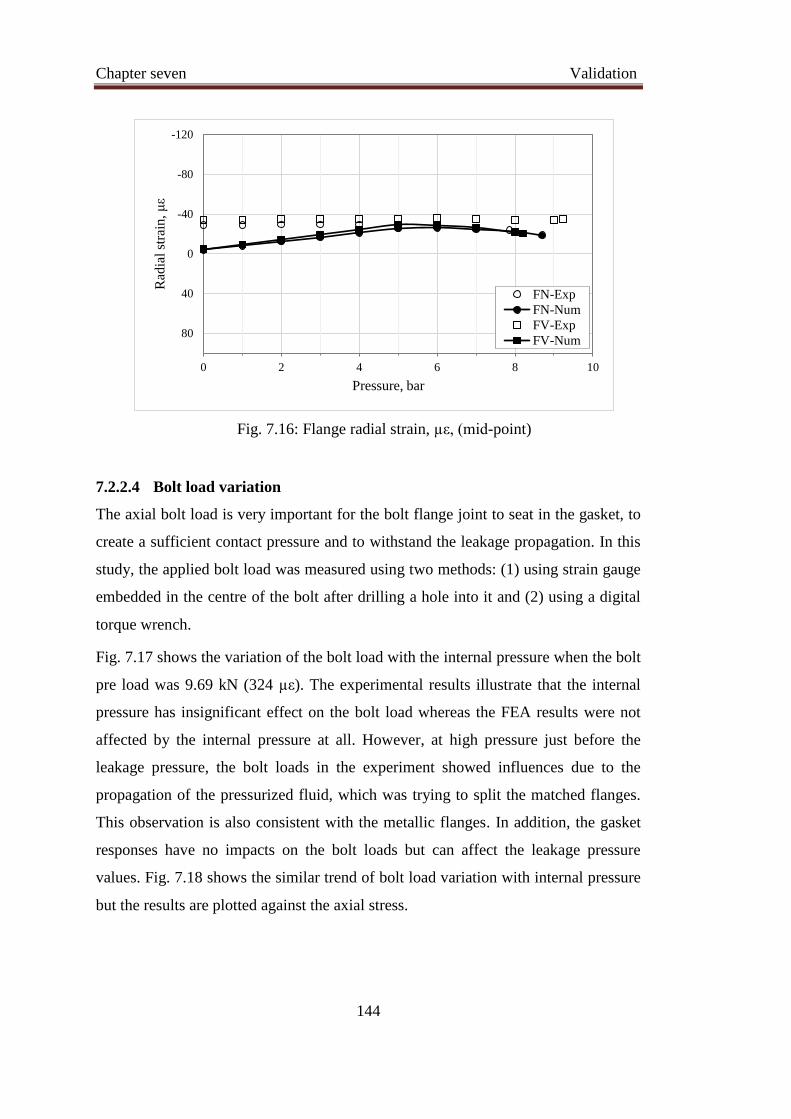
Chapter seven Validation
144
7.2.2.4 Bolt load variation
The axial bolt load is very important for the bolt flange joint to seat in the gasket, to
create a sufficient contact pressure and to withstand the leakage propagation. In this
study, the applied bolt load was measured using two methods: (1) using strain gauge
embedded in the centre of the bolt after drilling a hole into it and (2) using a digital
torque wrench.
Fig. 7.17 shows the variation of the bolt load with the internal pressure when the bolt
pre load was 9.69 kN (324 µε). The experimental results illustrate that the internal
pressure has insignificant effect on the bolt load whereas the FEA results were not
affected by the internal pressure at all. However, at high pressure just before the
leakage pressure, the bolt loads in the experiment showed influences due to the
propagation of the pressurized fluid, which was trying to split the matched flanges.
This observation is also consistent with the metallic flanges. In addition, the gasket
responses have no impacts on the bolt loads but can affect the leakage pressure
values. Fig. 7.18 shows the similar trend of bolt load variation with internal pressure
but the results are plotted against the axial stress.
-120
-80
-40
0
40
80
0 2 4 6 8 10
Rad
ial
stra
in,
με
Pressure, bar
FN-Exp
FN-Num
FV-Exp
FV-Num
Fig. 7.16: Flange radial strain, µε, (mid-point)

Chapter seven Validation
145
300
305
310
315
320
325
330
335
340
0 2 4 6 8 10
Bo
lt a
xia
l st
rain
, μ
ε
Pressure, bar
FN-Exp
FN-Num
FV-Exp
FV-Num
Fig. 7.17: Bolt axial strain, µε
56
57
58
59
60
61
62
63
64
65
66
0 2 4 6 8 10
Bolt
axia
l st
ress
, M
Pa
Pressure, bar
FN-Exp
FN-Num
FV-Exp
FV-Num
Fig. 7.18: Bolt axial stress, MPa
Chapter seven Validation
146
7.2.2.5 Leakage pressure and the contact pressure
Millions of tons of oil and gas are lost around the world due to the leakage that
usually occurs in pipelines and in their connections. This is one of the main causes of
the environmental pollutions nowadays. It is usually called an “oil spill”, which
includes any spill of crude oil or distilled oil (e.g., gasoline, diesel fuels, jet fuels,
kerosene, Stoddard solvent, hydraulic oils and lubricating oils). These can pollute
land surfaces as well as air and water. For example, the BP oil spill incident that
occurred in the Gulf of Mexico in 2010. This oil disaster led to the death millions of
marine creatures. The U.S. government had estimated that the total discharge was
almost 5 million barrels [119]. In this study, the leakage pressure has been measured
experimentally in the laboratory using a pressure vessel manufactured in-house. The
same pressure vessel has also been simulated through FEA using the PPNC criterion
to understand the leakage propagation phenomena. The detailed analysis method has
been discussed in the chapter six.
The distribution of the contact pressures on the top gasket surface is illustrated in Fig.
7.19 at various internal pressure values including the leakage pressure (8.8 bar). The
results show that at the bolt up conditions (i.e. at 0 bar pressure), the minimum
contact pressure is found at an area which is outside of the hole circumferences
whereas the maximum contact pressure is concentrated around the bolt hole at the
closest point to the inner diameter. When the internal pressure is increased, the
contact pressure at the inner diameter of the gasket, which is in direct contact with
the pressurized fluid, decreased. With the increase in the pressure, the maximum
contact pressure moved away from the bolt hole to the closest point on the outer
diameter of the flange where the fluid started to penetrate at the inner diameter. In
addition, in the circumferential direction, the contact pressure at the bolt hole is
higher than at the midpoint between the bolts. This is due to the boundary conditions,
bolt loads, internal pressure, hydrostatic end force and total hydrostatic force, which
produce a bending moment and hence flange rotation.

Chapter seven Validation
147
The distribution of the fluid pressure penetration (FPP) between the flange and the
Nitrile rubber gasket has been illustrated in the Fig. 7.20. The results indicate that
there is no leakage propagation started yet up to 4 bar and that is because of the
contact pressure between the flange and the gasket at the inner diameter, which is in
direct contact with the fluid and is higher than the applied fluid pressure. When the
internal pressure exceeds 4 bar, the leakage starts to penetrate at the inner radius of
the gasket, where the contact pressure is dropped to 0.1 MPa at the inner diameter,
and propagates towards the outer radius. See Fig. 7.19.
Also, due to uneven distribution of the bolt loads in the circumferential direction, the
leakage growth at the midpoint between the adjacent bolts is more than that of at the
bolt centre.
(5 bar)
(0 bar)
(8.8 bar)
(4 bar)
Fig. 7.19: Distribution of contact pressure on gasket

Chapter seven Validation
148
(4 bar) (5 bar)
(6 bar) (7 bar)
(8.8 bar)
(8 bar) (8.7 bar)
Fig. 7.20: Leakage propagation with the internal pressure up to leakage pressure

Chapter seven Validation
149
Fig. 7.21 shows the experimental and the numerical leakage pressure variations with
the bolt preload of the flange and Nitrile rubber gasket. As expected, the leakage
pressure increases with the increase in the axial bolt load. This occurs because of
increasing the bolt load leads to increase the flange-gasket contact pressure, which is
minimizing the leakage propagation. It seems that the lower bolt loads influence on
the leakage pressure more than the higher bolt loads. In addition, the experimental
results show that the leakage pressure at the lower bolt loads are higher than that
observed in the FEA results. This is due to the spring back of the GFRP flange,
which made the flange face uneven because of the shrinkage during the curing.
The contact pressure between the flange and the gasket at the inner area of the holes
circle takes place before the outer area of the holes circle. Therefore, the contact
pressure at the inner area is higher than that at the outer area of the holes circle at the
low range of the bolt loads. This leads to increase in the leakage pressure values at
the lower bolt loads during the experiments but it become closer to the FEA results
at the higher bolt loads. It should be noted that the flange spring back effect is
reduced at the higher bolt loads. However, an excellent agreement between the
experimental and the FEA results was obtained, especially, at the design bolt load,
0
2
4
6
8
10
12
0 2 4 6 8 10
Lea
kag
e pre
ssure
, bar
Bolt Load, kN
FN-Exp
FN-Num
Fig. 7.21: Leakage pressure variation of Flange-Nitrile gasket with the bolt load

Chapter seven Validation
150
The FEA modelling method can be used to simulate the leakage propagation and to
estimate the leakage pressure, which is expensive and also takes longer time to
perform if the experimental method is used.
Fig. 7.22 explains the relationship between the leakage pressure and the bolt load of
the Flange-Viton (FV) rubber gasket. Generally, the behaviour of the relationship is
approximately same as the behaviour of the Flange-Nitrile (FN) rubber gasket. As
with the FN, the experimental data was slightly higher than the FEA results and that
is due to the flange spring back, which is discussed above. However, a good
agreement has been reached between the experimental and the FEA analysis results
and again it can be said that the simulation can be used to see the growth of the
leakage and to estimate the leakage pressure during the design phase of GFRP flange
joint.
0
2
4
6
8
10
12
0 2 4 6 8 10
Lea
kag
e p
ress
ure
, b
ar
Bolt Load, kN
FV-Exp
FV-Num
Fig. 7.22: Leakage pressure variation of Flange-Viton gasket with the bolt load

Chapter seven Validation
151
7.3 Numerical validation
In order to do another validation of the FEA method of the bolted GFRP flange joint,
further 2D and 3D finite element analyses of a metallic bolted flange joint have been
carried out. The procedure and the boundary conditions that have been applied for
metallic bolted flange joint are the same as applied for the bolted GFRP flange joint.
The computer model of the metallic flange joint used for the analyses consists of a
raised face flange made of steel, steel bolts and an aluminium gasket. The simulation
results are compared with the experimental results published by Sawa et al. [1].
7.3.1 Metallic flange joint geometry and material properties
Fig. 7.23 shows the cross section of the geometry used for the finite element analysis.
The dimensions of the raised face flange joint are selected from the physical model
used for laboratory experiments by Sawa et. al. [41] based on standards JIS B
(Japanese International standard) and ANSI B 16.5 (American standard). The joint
includes two pairs of flanges, a gasket and bolts. The materials of the flange, bolt and
gasket are assumed to be homogenous, isotropic and linearly elastic. The flange was
made of steel (S45C, JIS), with E = 206 GPa, ν= 0.3, and the bolts are chromium
molybdenum steel (SCM435, JIS), with E = 206 GPa, ν= 0.3. Aluminium (AI-H,
JIS) was selected as the gasket material with E = 68.7 GPa, ν= 0.3.
Fig. 7.23: Bolted flange joint (All dimensions in mm)

Chapter seven Validation
152
7.3.2 3D CAD model
A three dimensional computer model has been developed for the bolted flange joint
using ANSYS Workbench v18.1. The model includes flange, gasket and bolt.
Because of the symmetry, a primary segment of the geometry is repeated at equally
spaced intervals about the axis of symmetry. A 1/16th portion of the total
circumference of the joint as shown in Fig. 7.24 has been considered for this purpose.
The axisymmetric option has been chosen to reduce the total simulation time and the
computer resources.
7.3.2.1 Elements selection and contact interfaces
Several different elements are used in the FEA study of the flange joint. For the
flange, solid structural elements (SOLID186) are used. At the contact zones,
CONTA174 and TARGE170 elements are used to simulate the contact distributions
between (1) the lower face of the flange and the gasket surface and (2) the top face
of the flange and the bolt head. These elements are compatible with structural
element SOLID186 [115]. Since the behaviour of the flange, the gasket and the bolt
are different in terms of the load-deformation characteristics, and all of them are
deformable, they are treated as a ‘flexible-to-flexible’ category and the contact
surfaces between them are modelled as ‘frictionless’. Because the gasket is softer
than the flange, it is simulated as a contact surface and the flange is modelled as a
target surface [114]. In contrast, the flange is simulated as contact and the bolt as a
target in their contact interfaces.
7.3.2.2 Boundary conditions
As same of GFRP flange joint modelling in chapter 6, due to the rotational symmetry
and also due to the symmetry about the plane that passes through the gasket mid
thickness, the boundary conditions and the loads are applied to an upper single
segment in the analysis. For the model created in the cylindrical coordinate system,
the circumferential displacements in the normal direction on the surface of the cycle
symmetry are assumed as fixed, i.e. Uθ=0. Also, the displacements of elements
located at the bottom surface of the gasket are fixed, i.e. Uz=0 (Fig. 7.24). These
boundary conditions are assigned for both bolt-up and pressure loading stages, which
will be discussed in the next sections.

Chapter seven Validation
153
Bolt preload conditions, in this stage, only the bolt load is applied in this stage to
close the flange-gasket interfaces. See section 6.2.8.1 for more explanations about
the boundary conditions in this stage. The design bolt load value for this joint is 15
kN and due to the symmetry, a half of this value has been applied on the lower face
of the bolt.
Pressure loading conditions, in this stage, the internal pressure with its components
have been applied in additional to the bolt load, which has been already applied in
the bolt up stage. See section 6.2.8.2 for more detail about the loads in this stage.
Modelling leakage development, the fluid pressure penetration (FPP) between the flange
and the gasket is modelled by using PPCN criterion, which has been explained in details in
chapter 6 (Section 6.2.8.3).
Fig. 7.24: (a) 3D model flange joint with mesh (b) Boundary conditions

Chapter seven Validation
154
7.3.3 2D FEA axisymmetric models
The 2D FEA of the joint has been generated using ANSYS with element PLANE183
for the flange and the gasket, and element CONTA172 for the contact region
between them. The mesh of this model is shown in Fig. 7.25. As with the 3D FEA,
the boundary conditions have been applied into two steps: during the first step (bolt
up load stage), the axial displacement at the lower edge of the gasket has been fixed
due to the axial symmetry at the mid-thickness of the gasket. The axial bolt load has
been converted to the equivalent pressure force, which has been applied on the
flange area under the bolt head. In the next step, the fluid pressure has been applied
on the internal surface of the flange and the gasket. In addition, the axial pressure
components of the hydrostatic pressure force have been applied to the top edge of the
flange. The leakage propagation between the flange and the gasket has been
simulated by using PPNC criterion.
Fig. 7.25: (a) 2D FEA model flange joint with mesh (b) Boundary conditions

Chapter seven Validation
155
7.3.4 Simulation results
The results presented here are obtained from the finite element analyses for 3D and 2D
axisymmetric models under bolt up and working conditions. The bolted flange joint is
subjected to 15 kN bolt load and the internal pressure is increased up to the leakage
point. At the same time, these results were compared with the results of a metallic bolted
flange joint that had been investigated experimentally and numerically by Sawa et al [1].
7.3.4.1 Flange hub stress
The axial flange hub stress has been calculated at the outer surface of the hub under a
bolt load of 15 kN with various internal pressure values. The bolt load is high
compare with the bolt load value of the composite flange. This is because of the
differences in the used materials and the design pressure. The simulation results have
been compared with the results presented in reference [1]. The agreement between
the results is excelent as shown in Fig. 7.26.
Fig. 7.26: Flange hub stress variation with the internal pressure up to leakage point
10
20
30
40
50
60
70
80
90
100
0 2 4 6 8 10 12 14 16 18 20
Hub s
tres
s, M
Pa
Internal pressure, MPa
3D FEA
2D FEA
Exp [1]
Num [1]
Num (Without hub) [1]
Num (JIS) [1]
Leakage point

Chapter seven Validation
156
7.3.4.2 Leakage development
Fig. 7.27 represents the leakage propagation in the 3D model during the operating
conditions under a bolt load of 15 kN. It is found that the leakage grows radially as
the internal pressure increases and the leakage occurs at a pressure of 14.05 MPa.
Similarly, Fig. 7.28 shows the leakage development in the 2D axisymmetric model
when the flange joint is pressurized. The results reveal that the leakage has started to
take place when the internal pressure has reached a value of 13.87 MPa. It is clear
from this figure that the agreement between the results for 2D and 3D models is very
good. The relationship between the bolt load and the internal pressure at the leakage
point has been investigated using both 2D FEA and 3D FEA as shown in Fig. 7.29. It
is observed in both the axisymmetric 2D and the 3D analyses that the relationship
between the two variables is linear. As there is an excellent agreement between the
results predicted by both types of models, the 2D axisymmetric model can be used
for further extensive analyses to save computational time and efforts.
Fig. 7.27: Fluid pressure penetration of the 3D FEA (a) Internal pressure 2 MPa
(b) Internal pressure 8 MPa (c) Internal pressure 14.05 MPa (Leakage point)
(a)
(c)
(b)
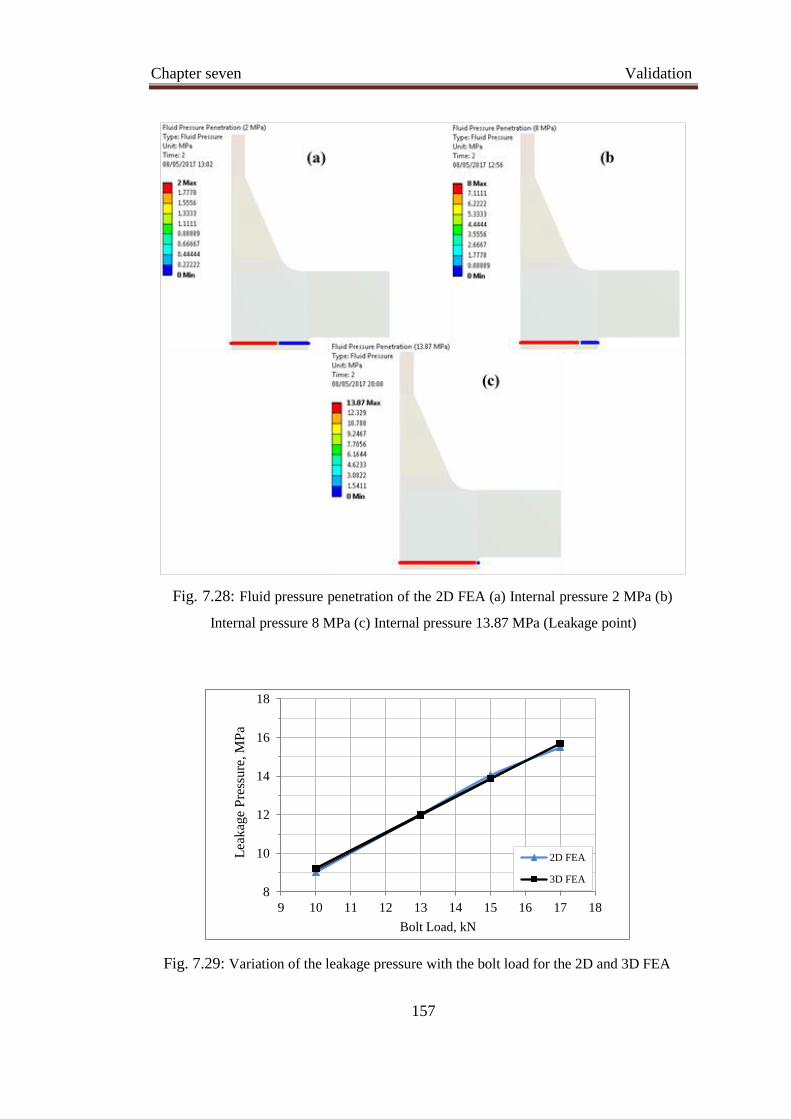
Chapter seven Validation
157
8
10
12
14
16
18
9 10 11 12 13 14 15 16 17 18
Lea
kag
e P
ress
ure
, M
Pa
Bolt Load, kN
2D FEA
3D FEA
Fig. 7.29: Variation of the leakage pressure with the bolt load for the 2D and 3D FEA
Fig. 7.28: Fluid pressure penetration of the 2D FEA (a) Internal pressure 2 MPa (b)
Internal pressure 8 MPa (c) Internal pressure 13.87 MPa (Leakage point)

Chapter seven Validation
158
7.4 Summary
The experimental and the numerical results of the bolted GFRP flange connection
show:
The proposed composite flange showed high quality, better performance and
good strength based on the identified values of strains (axial, hoop and radial).
The strain values are comparatively low even with the applied loads that are
more than the recommended design conditions.
The agreement between the experimental and the numerical results are excellent
and this validates the FEA method used.
The bolt preload has higher effect on the flange strains than that of the internal
pressure load.
The types of rubber gaskets do not influence the flange strains but affect the
leakage pressure.
The distribution of the gasket contact stress (contact pressure) is non-uniform
across the gasket face. Pressure values are higher around the bolt hole and
gradually decreases in the radial direction of the bolt hole.
The leakage propagation at the midpoint between adjacent bolts is larger than
those in the centres of the bolts.
It is proved that the finite element method using PPNC in ANSYS can be
considered as an efficient tool to study the leakage behaviour.
The next chapter investigates the effect of the applied loads and the flange
dimensions, which are the parameters of the study, on the maximum axial, hoop and
radial strains, axial displacement, flange rotation and the leakage pressure.
Chapter eight Results & Discussions
159
CHAPTER EIGHT
RESULTS & DISCUSSIONS
8.1 Introduction
To get a bolted flange joint with high performance, many parameters should be taken
in to account during the design and manufacture. These parameters include sufficient
strength, corrosion resistance, thermal expansion, weight, cost and dimensions, as
well as the gasket material and thickness. Sufficient strength means design the flange
with sufficient safety factor and its value is determined based on many conditions
such as the nature of the application whether it has high risk or it costs too much
were it to fail. Selecting the flange material should consider the nature of the transfer
fluid and the environment of the application to achieve high corrosion resistance,
which has significant impact on the service life of the pipe and flange joint. In
applications that have a high range of temperature, the thermal expansion of the
flange and pipe materials should be investigated carefully. Using materials of pipe
and flange with different thermal expansions (composite pipe-steel or aluminium
flanges) can lead to failure of the pipe-flange bonding due to the mismatch in the
thermal expansions of these materials [15]. This problem can be avoided by using
same material for the pipe and the flange (such as GRP pipe and flange) or different
materials with the same or similar thermal expansion such as GRP pipe-GRP or CRP

Chapter eight Results & Discussions
160
flanges but not GRP pipe with steel or aluminium flange. In addition, weight of the
flange is important in some applications such as in the pipelines of oil extraction
from under the seabed or in the structure of airspaces.
Reducing the cost is important to market the flange. The unit cost of any product
depends on many parameters as stated by Grove [104]. These parameters are: (1) the
product material content; (2) the cost of the tooling and other capital equipment; (3)
production cycle time (in terms of labour costs and overheads); (4) the total number
of parts to be made (the batch size). Therefore, the cost of the material content can be
reduced by minimizing the flange dimensions (flange materials) or by choosing
cheap raw materials, which achieve the requirements of the design. Composite
materials are not cheap compared to metals but they have long life service, high
corrosion resistance and high strength to weight ratio, so overall the use of composite
materials is cheaper and better. Therefore, composite materials have been chosen in
this study to manufacture a bolted flange joint for composite pipelines, which is
conducted in this can improve significantly all the influence of the above parameters.
Another way to minimize the cost of the GFRP bolted flange joint is by reducing the
flange dimensions and gasket thickness.
This chapter studies the influence of changing the flange dimensions, flange
diameter, flange thickness, hub length and hub thickness, on the flange strains
distribution, flange axial displacement, flange rotation and the leakage pressure
between the flange and the gasket under various of the bolt load and internal pressure.
In addition, the effect of the gasket material and thickness will be also investigated in
this chapter. Finally, the objective of this chapter is to find out the possibility of
reducing flange joint dimensions (flange material) and its cost.
8.2 ASME code predictions
The comprehensive analytical approach of the ASME code [24] has been used to
calculate the stress values in the three directions, axial, hoop and radial when the
bolted flange joint is subjected to the design loads, bolt load 7.4 kN and internal
pressure 3.4 bar. These values are also calculated using FEA and they are all shown

Chapter eight Results & Discussions
161
in Table 8.1. The results show that the ASME code is conservative as it predicts
higher stresses when compared with the predictions from the FEA, especially, for the
axial and radial stresses. There are many reasons behind this high values of ASME
code, which made it conservative. For example, the ASME code analyses based on
the loads and the geometries and does not take into account the material properties,
which has significant effect on the flange strength and stiffness, and the leakage
propagation between the flange and the gasket. On the other hand, the FEA takes
into account the materials properties with their orthotropy for the composite
materials and non-linear response for the rubber gasket during the loading and
unloading as well as the leakage propagation. The materials properties are calculated
based on many parameter such as fibre direction and fibre volume fraction of the
glass fibre braid sleeve, which showed good performance during the testing. In
addition, the comprehensive analytical approach of the ASME code has been
modified from the codes of the metal flanges. So that many details, which are related
to the composite material should be included. This problem has been pointed out by
other researchers [8].
Therefore, the ASME code is general and that leads to predict high stresses, which
make the flange dimensions thicker. Although, these stresses values are still low if
they are compared with measured tensile strength 254.8 MPa of the composite
laminate that has been described in chapter 5 (section 5.3).
Finally, this study based on the stiffness analysis no strength but the below stresses
are calculated numerically for the comparison purpose against the ASME code.
ASME Code Numerical (FEA)
Axial stress (MPa) 21.13 11.67
Hoop stress (MPa) 37.91 33.86
Radial stress (MPa) 18.22 13.47
Table 8.1: Stress values comparison for ASME code and FEA

Chapter eight Results & Discussions
162
8.3 Bolted flange joint deformation
Fig. 8.1 shows the total deformation of the bolted flange joint, which includes the
flange, pipe, adhesive bonding, gasket and the bolt as well as the washer. The joint
has been subjected to the design loads, which are 7.4 kN bolt load (BL) and 3.4 bar
internal pressure (P). The results show that the flange disc deforms more than the
other parts. Also, the maximum total deformation occurs around the bolts holes due
to the flange bending under the effect of the bolt force, which is required to keep the
sealing tight, and the internal pressure. Furthermore, it can be seen that there is a
high deformation on the bolt and the washer. In reality, this is not accurate
deformation in the bolt itself but this comes from the down movement of the bolt due
to the high gasket compression and high flange bending around the bolts holes.
8.4 Flange diameter effect
This section investigates the effect of flange dimensions on the maximum axial,
hoop and radial strains, axial displacement, flange rotation and leakage pressure
using the FEA model, which has been validated in the previous chapter. The purpose
Fig. 8.1: Total deformation of the bolted flange joint

Chapter eight Results & Discussions
163
of this analysis is to find the possibility of reducing the dimensions that have small
or insignificant influence on the flange performance. This means reducing the
required materials and manufacturing process time, thereby reducing the material
cost of the flange.
Maximum axial tensile strain vs flange diameter, the axial strain distribution of the
flange connection (flange, pipe and adhesive bonding) is shown in Fig. 8.2. These
results are calculated under the design conditions, which are bolt load 7.4 kN and
internal pressure 3.4 bar. These results show the maximum axial tensile strain at the
outer surface of the flange-hub interface due to the bending of the flange under the
bolt load. In addition, the maximum axial compression strain occurs through the
thickness of the flange and around the bolt holes or under the bolt head. This is
because of the bolt force that compresses the flange.
Fig. 8.3 shows the maximum axial tensile strain variation with the outer flange
diameter for different gasket materials and thicknesses. The maximum axial tensile
strain is measured near the bolt at the outer flange-hub interface as shown in Fig. 8.2.
The right ordinate represents the normalized percentage of the strain values based on
the equivalent strain values of the flange diameter 320 mm and using Nitrile rubber
gasket with 3 mm thickness (FN3). The results show that the maximum axial tensile
strain decreases sharply with increasing the flange diameter up to 360 mm where as
it becomes constant at the 360-400 mm flange.
This occurs due to the high flange bending, especially around the bolt holes, because
of the applied bolt axial load, which is trying to seal the contact. The contact
pressure between the flange and the gasket at the area that is outside the bolts holes
circle (more than 360 mm dia.) is very small or zero. This means that the flange area,
which is at the outer diameter 360 mm, is not contributing significantly to seal the
contact and it is not affecting the maximum axial tensile strain. For the flange
diameter range 320-360 mm, the highest value of strain was recorded at diameter
320 mm with 517 µε and it decreases almost 10% at the diameter 360 mm. These
numbers are still low and the flange outer diameter should be kept at 320 mm . In
addition, the Viton rubber gasket produces axial tensile strain slightly higher than
Nitrile rubber gasket. Furthermore, the results show that the gasket thickness has

Chapter eight Results & Discussions
164
small influence on the maximum axial tensile strain. Therefore, 3 mm gasket
thickness can be used instead of 5 mm to save the materials and cost.
The overall history of the maximum axial tensile strain is shown in Fig. 8.4. This
figure illustrates the variation of the maximum axial tensile strain with the bolt load
(clamping force) and the internal pressure, which represent the bolt up and operating
conditions. The ordinate of the figure represents the strain values whereas the
88
90
92
94
96
98
100
102
104
440
450
460
470
480
490
500
510
520
310 320 330 340 350 360 370 380 390 400 410
% S
trai
n (
FN
3,
dia
. 320 m
m)
Max
ax
ial
tensi
le s
trai
n,
με
Flange diameter, mm
FN3
FV3
FN5
FV5
Fig. 8.3: Maximum axial tensile strain (µε) variation with the flange
diameter for range of gasket types and thickness
Fig. 8.2: Axial strain (mm/mm)

Chapter eight Results & Discussions
165
abscissa is divided into two stages. The first stage represents the variation of the bolt
load when the internal pressure is zero. The second stage shows the variation of the
internal pressure when the bolt load is 7.4 kN. The transition region between the two
stages, which starts from BL 7.4 kN & P 0 bar of the first stage, and ends at pressure
0 bar & BL 7.4 kN in the second stage, has the same condition. So that the curves are
horizontal at this region. This will be repeated in the next figures that have the same
style. The influence of the flange diameter is also shown in this figure.
The results show that the bolt load has a higher effect on the axial strain than the
internal pressure. It is clear that the maximum axial tensile strain increases
significantly with increasing the bolt load whereas it increases less with the
increasing of the pressure. Furthermore, it is observed that the maximum axial tensile
strain is affected by the flange diameter up to 360 mm. The flange with outer
diameter 320 mm produces axial strain higher than the others (360 and 400 mm).
This can be clearly seen through Fig. 8.3.
0
100
200
300
400
500
600
0 1.85 3.7 5.55 7.4 0 2 4 6
Bolt Load, kN
Pressure (0 bar)
Pressure, bar
Bolt Load (7.4 kN)
Max
axia
l te
nsi
le s
trai
n, μ
ε
320 mm
360 mm
400 mm
Fig. 8.4: Maximum axial tensile strain (µε) variation with the bolt load
and internal pressure for range of the flange diameter

Chapter eight Results & Discussions
166
Maximum axial compression strain vs flange diameter, the maximum axial
compression strain is found near the bolt holes and under the top flange surface as
illustrated in the Fig. 8.2. This occurs because of the bolted GFRP flange joint is
subjected the design boundary conditions, which are 7.4 kN bolt load and 3.4 bar
internal pressure. Therefore, the bolt load compresses the flange to create sufficient
contact pressure between the flange and the gasket to seal the joint and stop any
leakage propagation.
Fig. 8.5 explains the relationship between the maximum axial compression strain and
the outer diameter of the flange for various gasket materials and thickness. it seems
that the flange diameter has significant impact on the maximum compression strain,
especially between the diameter range 320-360 mm. When the flange outer diameter
increases, the maximum compression strain increases up to 360 mm of diameter but
after that the variation become small or even it is not affected at the high flange
diameter. In other words, the compression strain increases about 17% when the
flange diameter increases from 320 mm to 360 mm, where as it increases 2% when
the diameter increases from 360 mm to 400 mm. As mentioned earlier, this is due to
the applied loads and the reaction of the gasket, which bend the flange and lift up the
outer edge of the flange. Furthermore, the gasket material shows small influence on
the maximum compression strain but it is not affected by the gasket thickness. The
Viton gasket produces strain that is slightly higher than the Nitrile gasket.

Chapter eight Results & Discussions
167
Maximum hoop strain vs flange diameter, Fig. 8.6 illustrates the hoop strain of the
flange with outer diameter 320 mm and using Nitrile rubber gasket under the design
boundary conditions (bolt load 7.4 kN & internal pressure 3.4 bar). The highest hoop
strain values are observed at the lower face of the flange and around the bolt holes.
As shown in the figure, the maximum value of the strain is found on the line that
passes through the pipe and bolt hole centres. This area of the flange is exposed to
the high hoop strain due to the axial bolt, which causes the circumferential flange
bending. This will be explained clearly through the calculations of the flange axial
displacement and flange rotation, which will be discussed in sections 8.7 and 8.8.
The variation of the maximum hoop strain with the outer flange diameter has been
shown in Fig. 8.7 for range of gasket materials and thicknesses. Generally, the
results show that the outer flange diameter has small influence on the maximum
hoop strain, which is less than 4% for the Flange-Nitrile gasket (FN) and 5.5% for
the Flange-Viton gasket (FV). However, the high variation range occurs when the
flange diameter increased from 320 mm to 360 mm whereas the high flange diameter
does not affect significantly the hoop strain. Therefore, it is better to keep it at the
minimum allowable outer diameter, which means reducing the required materials
97
102
107
111
116
120
125-1350
-1300
-1250
-1200
-1150
-1100
-1050
310 320 330 340 350 360 370 380 390 400 410
% S
trai
n (
FN
3,
dia
. 320 m
m)
Max
ax
ial
flan
ge
stra
in,
με
Flange diameter, mm
FN3
FV3
FN5
FV5
Fig. 8.5: Maximum axial compression strain (µε) variation with the flange
diameter for range of gasket types and thickness

Chapter eight Results & Discussions
168
and cost, to reduce the hoop strain. In addition, the gasket materials effect on the
hoop strain and the Viton gasket causes hoop strain higher than Nitrile gasket. In
contrast, the hoop strain is not affected by the gasket thickness, so that encourages
using a thin gasket instead of the thick, which costs more.
97
99
101
103
105
106
108
1080
1100
1120
1140
1160
1180
1200
310 320 330 340 350 360 370 380 390 400 410
% S
trai
n (
FN
3,
dia
. 320 m
m)
Max
hoop s
trai
n,
με
Flange diameter, mm
FN3
FV3
FN5
FV5
Fig. 8.7: Maximum hoop strain (µε) variation with the flange diameter for
range of gasket types and thickness
Fig. 8.6: Hoop strain (mm/mm)

Chapter eight Results & Discussions
169
Maximum radial strain vs flange diameter, The maximum radial strain occurs
around the bolt hole at the point that is allocated on the holes circle at the lower face
of the flange. As shown in the Fig. 8.8, these regions of the flange are subjected to
the high tensile radial strain when the flange joint is exposed to the bolt force (7.4
kN) and the internal pressure (3.4 bar). These loads are trying to bend the flange at
the bolts circle diameter, thereby, producing high tensile radial strain at the lower
face of the flange around the bolt holes.
Fig. 8.9 describes the maximum radial strain as a function of the flange outer
diameter using the Nitrile and the Viton rubber gaskets with 3 and 5 mm thickness.
The results indicate that increasing the flange outer diameter (320 to 400 mm) leads
to increase the radial strain approximately 30% (1110-1450 µε) and most of the
increment (27%) occurred at the range 320-360 mm whereas almost 3% in the range
360-400 mm . This happens due to the circle geometry of the flange disc, which is
bent under the bolt load at bolts holes. This circle geometry helps the outer edge of
the flange to move up, so that increasing the outer diameter leads to increase this
phenomena, thereby, produce more tensile radial strain at the lower face of the
flange. Regarding the gasket material and thickness influences, the Viton rubber
gasket shows radial strain higher than the Nitrile at the higher flange outer diameter
(360-400 mm) whereas this difference is tiny at the lower outer diameter. In addition,
the results show that the gasket thickness has no impact on the radial strain.
Therefore, small flange outer diameter and small gasket thickness has positive
impact on the radial strain and the flange joint cost.

Chapter eight Results & Discussions
170
Bolt axial strain vs flange diameter, Fig. 8.10 explains the axial strain distribution
on the bolt when the bolt load (7.4 kN) and the pressure (3.4 bar) are applied. It is
clear that the maximum axial bolt strain is observed at the corner at the bolt head and
shank interface, where they meet. This because of the sudden change in the geometry.
95
100
104
109
113
118
122
127
131
136
1050
1100
1150
1200
1250
1300
1350
1400
1450
1500
310 320 330 340 350 360 370 380 390 400 410
% S
trai
n (
FN
3,
dia
. 320 m
m)
Max
rad
ial
stra
in,
με
Flange diameter, mm
FN3
FV3
FN5
FV5
Fig. 8.9: Maximum radial strain (µε) variation with the flange diameter for
range of gasket types and thickness
Fig. 8.8: Radial strain (mm/mm)

Chapter eight Results & Discussions
171
Regarding the flange outer diameter and the bolt axial strain relationship, the axial
strain has been measured numerically at the central axis of the bolt as shown in the
Fig. 8.10. This point has been chosen to be the same point that includes the strain
gauge in the experiment, which was embedded through a drilled hole from the top
bolt head surface. Fig. 8.11 illustrates the bolt axial strain variation with the flange
diameter for various gasket materials and thicknesses. It seems that the bolt axial
strain is not influenced by the flange outer diameter, gasket materials and gasket
thickness. This strain stays constant at 245 µε over the load history.
200
210
220
230
240
250
260
270
280
290
300
310 330 350 370 390 410
Bo
lt a
xia
l st
rain
, μ
ε
Flange diameter, mm
FN3
FV3
FN5
FV3
Fig. 8.11: Bolt axial strain (µε) variation with the flange diameter for
range of gasket types and thickness
Fig. 8.10: Bolt axial strain (µε)
Strain gauge
position

Chapter eight Results & Discussions
172
8.5 Flange thickness effect
This study investigates the impact of the decreasing the flange thick from 15 mm to
10 mm. Therefore, the results will be shown in the Fig. 8.12, Fig. 8.13, Fig. 8.15 and
Fig. 8.16, which have three axis. The x-axis and left y-axis represent the flange
thickness and the real values of the strain, respectively, whereas the right y-axis
shows the percentage normalized of the strain based on the strain value of the flange
thickness 15 mm with 3 mm of Nitrile rubber gasket.
Maximum axial tensile strain vs flange thickness, Fig. 8.12 illustrates the
maximum axial tensile strain variation with the flange thickness for different gasket
materials and thicknesses. The strain has been measured at the outer face of the hub-
flange intersection as shown in the Fig. 8.2. It observed that the decreasing the flange
thickness (15 to 10 mm) leads to increase the maximum tensile strain almost 30%
(500 to 656 µε for the Nitrile gasket and 517 to 672 µε for the Viton gasket). This
occurs because of the decreasing in the bending resistance of the flange, which
becomes more flexible. This produces more tensile strain at the flange-hub
intersection because of applying the bolt axial force.
90
100
110
120
130
140
450
500
550
600
650
700
9 10 11 12 13 14 15 16
% S
trai
n (
FN
3,
F.
thic
k. 15 m
m)
Max
ax
ial
tensi
le s
trai
n,
με
Flange thickness, mm
FN3
FV3
FN5
FV5
Fig. 8.12: Maximum axial tensile strain (µε) variation with the flange
thickness for range of gasket types and thickness

Chapter eight Results & Discussions
173
In addition, the Viton rubber gasket produces maximum tensile strain almost 3%
more than the Nitrile gasket where the gasket thickness has no effect on the tensile
strain.
Maximum axial compression strain vs flange thickness, the influence of the flange
thickness on the maximum axial compression strain has been illustrated in Fig. 8.13
for range of gasket materials and thicknesses. The maximum axial compression
strain has been found and measured numerically around the bolt hole and under the
surface as explained in the Fig. 8.2. The results show that the maximum axial
compression strain has been affected significantly by the flange thickness and it has
increased when the flange thickness decreased. The increment was around 40%
(1079 to 1510 µε) for all the gaskets and regardless their material and thickness,
which has not affected the compression axial strain. Decreasing the thickness of the
flange leads to decrease the flange stiffness. Therefore, more compression axial
strain is produced due to the applied boundary conditions, which are bolt load and
internal pressure.
83
93
102
111
120
130
139
148-1600
-1500
-1400
-1300
-1200
-1100
-1000
-900
9 10 11 12 13 14 15 16
% S
trai
n (
FN
3,
F.
thic
k. 15 m
m)
Max
ax
ial
com
pre
ssio
n s
trai
n,
με
Flange thickness, mm
FN3
FV3
FN5
FV5
Fig. 8.13: Maximum axial compression strain (µε) variation with the
flange thickness for range of gasket types and thickness

Chapter eight Results & Discussions
174
Fig. 8.14 shows the overall variation of the maximum axial compression strain with
the applied loads, which are the bolt load and the internal pressure for range of the
flange thickness. The x-axis of the figures is divided into steps. The first step shows
the gasket seating (bolt up stage) and the second step illustrates the operating stage at
the bolt load 7.4 kN. It is observed that the bolt load has significant impact on the
maximum axial compression strain whereas the internal pressure has very small
influence. When the bolt load increases, the maximum axial compression strain
increases sharply but it stay almost same when the internal pressure increases. In
addition, the effect of the flange thickness can be seen clearly through the results.
The flange thickness leads to increasing the maximum axial compression strain
during both stages, which are bolt up and operating.
Maximum hoop strain vs flange thickness, Fig. 8.15 describes the relationship
between the maximum hoop strain with the flange thickness, gasket material and
gasket thickness. The maximum hoop strain is observed and measured around the
bolt hole and at the lower face of the flange as shown in Fig. 8.6. It seems that the
maximum hoop strain is affected significantly by the flange thickness and the flange
shows high strain at low thickness (10 mm). The maximum hoop strain has increased
-1800
-1400
-1000
-600
-200
0 1.85 3.7 5.55 7.4 0 2 4 6
Bolt Load, kN
Pressure (0 bar)
Pressure, bar
Bolt Load (7.4 kN)
Max
ax
ial
com
pre
ssio
n s
trai
n,
με
15 mm
12.5 mm
10 mm
Fig. 8.14: Maximum axial compression strain (µε) variation with the bolt
load and the internal pressure for range of the flange thickness

Chapter eight Results & Discussions
175
almost 67% when the flange thickness decreased from 15 to 10 mm. This is because
of the bolt load that has high effect on the thin flange rather than thick. In addition,
this influence will be illustrated clearly in the flange axial displacement (section 8.9)
and flange rotation (section 8.10). Furthermore, the maximum hoop strain is not
affected by the gasket thickness and gasket material except at the lower flange
thickness as there is a tiny influence between the Viton and the Nitrile rubber gaskets.
Maximum radial strain vs flange thickness, The influence of the flange thickness,
gasket type and thickness on the maximum radial strain is shown in the Fig. 8.16
when the bolted GFRP flange connection is subjected to the bolt load 7.4 kN and
internal pressure 3.4 bar. The maximum radial strain is observed around the bolt hole
at the lower face of the flange and on the line of the holes circle diameter as
explained in Fig. 8.8. The results show that the decreasing of the flange thickness
leads to increase the maximum radial strain. The maximum radial strain has
increased 59% when the flange thickness decreased from 15 to 10 mm. This occurs
due to the high bending of the thin flange because of the reduction in the flange
stiffness and applying the bolt load. In addition, it seems that the gasket material
(gasket behaviour) and thickness does not affect the maximum radial strain values.
72
90
108
126
144
162
180
800
1000
1200
1400
1600
1800
2000
9 10 11 12 13 14 15 16
% S
trai
n (
FN
3,
F.
thic
k. 15 m
m)
Max
hoop s
trai
n,
με
Flange thickness, mm
FN3
FV3
FN5
FV5
Fig. 8.15: Maximum hoop strain (µε) variation with the flange thickness
for range of gasket types and thickness
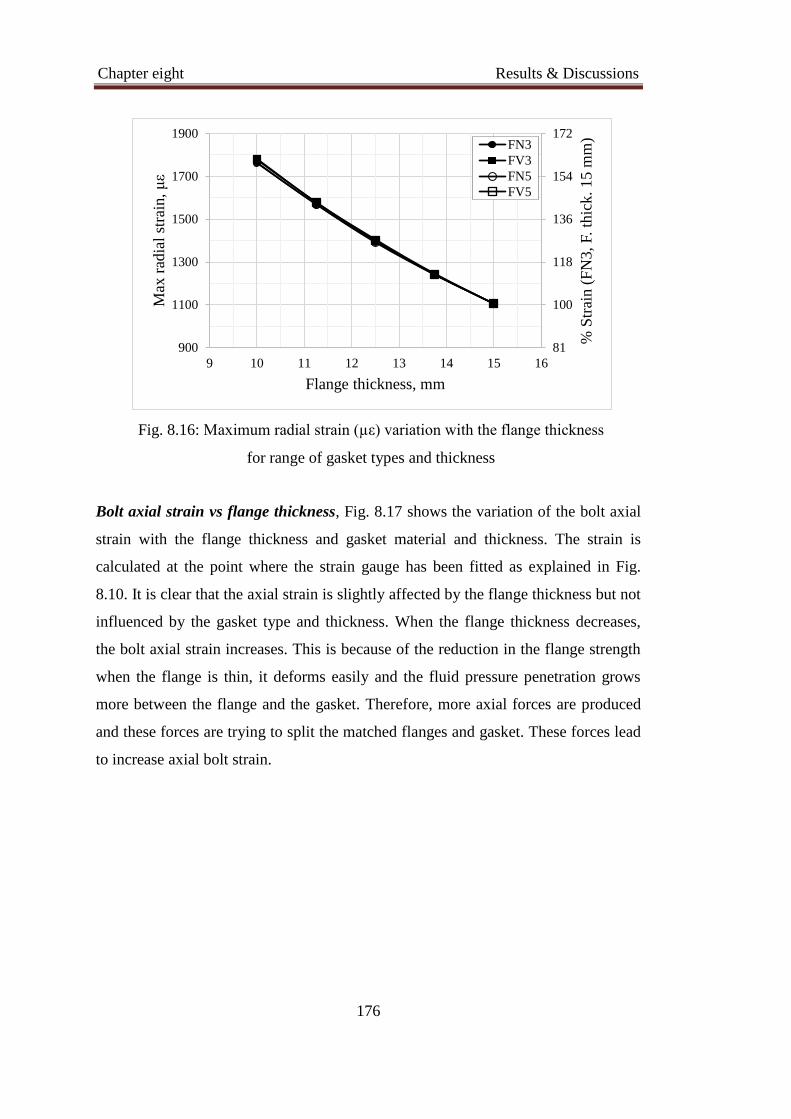
Chapter eight Results & Discussions
176
Bolt axial strain vs flange thickness, Fig. 8.17 shows the variation of the bolt axial
strain with the flange thickness and gasket material and thickness. The strain is
calculated at the point where the strain gauge has been fitted as explained in Fig.
8.10. It is clear that the axial strain is slightly affected by the flange thickness but not
influenced by the gasket type and thickness. When the flange thickness decreases,
the bolt axial strain increases. This is because of the reduction in the flange strength
when the flange is thin, it deforms easily and the fluid pressure penetration grows
more between the flange and the gasket. Therefore, more axial forces are produced
and these forces are trying to split the matched flanges and gasket. These forces lead
to increase axial bolt strain.
81
100
118
136
154
172
900
1100
1300
1500
1700
1900
9 10 11 12 13 14 15 16
% S
trai
n (
FN
3,
F.
thic
k. 15 m
m)
Max
rad
ial
stra
in,
με
Flange thickness, mm
FN3
FV3
FN5
FV5
Fig. 8.16: Maximum radial strain (µε) variation with the flange thickness
for range of gasket types and thickness

Chapter eight Results & Discussions
177
8.6 Hub length effect
This section studies the effect of the hub length on maximum axial, hoop and radial
strains of the flange using different gasket materials and thicknesses. The hub length
is decreased from 80 mm to 40 mm as shown in Fig. 8.18, Fig. 8.19, Fig. 8.20, Fig.
8.21, Fig. 8.22 and Fig. 8.23. In addition, the strains have been shown as real values
on the left ordinate and as normalized percentage in the right ordinate. The
normalized percentage has been calculated based on strain of the hub length 80 mm
and 3 mm Nitrile rubber gasket.
Maximum axial tensile strain vs hub length, Fig. 8.2 showed the axial strain
distribution and the maximum value is indicated at the outer surface and bottom of
the hub. The variation of the maximum axial tensile strain with the hub length,
gasket type and thickness is illustrated in Fig. 8.18.
The results show that decreasing the hub length deceases the maximum axial strain.
The axial strain decreases by 10% when the hub length is reduced from 80 to 60 mm
and sharply (50%) when the length is reduced more from 60 to 40 mm. Therefore, it
is better to reduce the hub length strain and the flange material cost.
230
235
240
245
250
255
260
9 10 11 12 13 14 15 16
Bo
lt a
xia
l st
rain
, μ
ε
Flange thickness, mm
FN3
FV3
FN5
FV3
Fig. 8.17: Bolt axial strain (µε) variation with the flange thickness for
range of gasket types and thickness

Chapter eight Results & Discussions
178
In addition, the gasket material has a small influence on the axial strain and the
Viton gasket produces more strain than the Nitrile gasket. Furthermore, the
maximum axial strain is not impacted by the gasket thicknesses, so that encourage
using the thin gasket which is cheaper than the thick.
Maximum axial compression strain vs hub length, The influence of the hub length
on the maximum axial compression strain is illustrated in Fig. 8.19. The maximum
axial compression strain occurs at the bolt hole and under the bolt head as shown in
the Fig. 8.2. It is observed that the hub length has no effect on the compression strain
when the hub length decreases from 80 to 50 mm. When the hub length decreases
more from 50 to 40 mm, the maximum compression strain increases about 2%,
which is still small. Therefore, the hub length can be decreased to reduce the flange
materials In addition, the gasket thickness has tiny effect on the strain values,
especially, with Viton gasket and at hub length range 60-80 mm. Regarding the
gasket material, the Nitrile gasket produces axial compression strain less than the
Viton and because of the non-linear behaviour of the rubber.
20
40
60
80
100
120
100
200
300
400
500
600
35 40 45 50 55 60 65 70 75 80 85
% S
trai
n (
FN
3,
H.l
ength
. 80 m
m)
Max
ax
ial
tensi
le s
trai
n,
με
Hub length, mm
FN3
FV3
FN5
FV5
Fig. 8.18: Maximum axial tensile strain (µε) variation with the hub
length for range of gasket types and thickness

Chapter eight Results & Discussions
179
Maximum hoop strain vs hub length, Fig. 8.20 shows the variation of the maximum
hoop strain with the hub length and the gasket parameters (material and thickness).
The maximum hoop strain is found at the lower face of the flange and around the
bolt hole as explained in Fig. 8.6. As shown in the results, the hub length has very
small impact on the maximum hoop strain, which is about 1%. When the hub length
reduces from 80 to 40 mm, the hoop strain increases from 1109 µε to 1118 µε. In
addition, the gasket thickness has small influence on the maximum hoop strain but
the gasket material type has no effect.
96
98
100
102
104
106-1140
-1120
-1100
-1080
-1060
-1040
35 40 45 50 55 60 65 70 75 80 85
% S
trai
n (
FN
3,
H.l
ength
. 80 m
m)
Max
ax
ial
flan
ge
stra
in,
με
Hub length, mm
FN3FV3FN5FV5
Fig. 8.19: Maximum axial compression strain (µε) variation with the hub
length for range of gasket types and thickness
97.4
98.3
99.2
100.1
101.0
101.9
102.8
1080
1090
1100
1110
1120
1130
1140
35 40 45 50 55 60 65 70 75 80 85
% S
trai
n (
FN
3,
H.l
ength
. 80 m
m)
Max
hoop s
trai
n,
με
Hub length, mm
FN3
FV3
FN5
FV5
Fig. 8.20: Maximum hoop strain (µε) variation with the hub length for
range of gasket types and thickness

Chapter eight Results & Discussions
180
The overall variation of the maximum hoop strain with the bolt load (clamping stage)
and internal pressure (pressurized stage) has been explained in Fig. 8.21 for different
hub length. The style of this figure is almost same the style of Fig. 8.4. Based on the
obtained results, the maximum hoop strain is affected completely by the bolt load
and very small by the internal pressure. Approximately, 98% of the maximum hoop
strain is produced due to the bolt load whereas 2% produced by the internal pressure
when it increases up to 6 bar. Furthermore, the maximum hoop strain is not affected
by the hub length and that can be seen clearly in Fig. 8.20.
Maximum radial strain vs hub length, The relationship between the maximum
radial strain and the hub length as well as the gasket type and thickness has been
illustrated in Fig. 8.22. As shown in Fig. 8.8, the maximum radial strain is observed
at the lower face of the flange and around the bolt hole. It is that the hub length has a
small effect on the maximum radial strain. It increases approximately 5.5% when the
hub length decreases from 80 mm to 40 mm. In addition, the maximum radial strain
is affected by the hub length at the short hub length more than the long. Furthermore,
the gasket thickness and material have a small influence on the maximum radial
0
200
400
600
800
1000
1200
1400
0 1.85 3.7 5.55 7.4 0 2 4 6
Bolt Load, kN
Pressure (0 bar)
Pressure, bar
Bolt Load (7.4 kN)
Max
hoop s
trai
n,
με
80 mm
60 mm
40 mm
Fig. 8.21: Maximum hoop strain (µε) variation with bolt load and internal
pressure for range of the hub length

Chapter eight Results & Discussions
181
strain. Finally, it can be stated that the hub length can be reduced to reduce the flange
cost and material.
Bolt axial strain vs hub length, Fig. 8.23 shows the bolt axial strain as a function of
the hub length, gasket thickness and material. The strain values have been calculated
at the point where the strain gauge has been embedded as shown in Fig. 8.10. The
findings show that the axial bolt strain function is constant for all gasket thickness
and materials. This means that there no relationship between the axial bolt strain and
the hub length regardless of the gasket behaviour and thickness.
94.1
96.8
99.5
102.3
105.0
107.7
110.4
1040
1070
1100
1130
1160
1190
1220
35 40 45 50 55 60 65 70 75 80 85
% S
trai
n (
FN
3,
H.l
ength
. 80 m
m)
Max
rad
ial
stra
in,
με
Hub length, mm
FN3
FV3
FN5
FV5
Fig. 8.22: Maximum radial strain (µε) variation with the hub length for
range of gasket types and thickness

Chapter eight Results & Discussions
182
8.7 Hub thickness effect
This section investigates the influence of the hub thickness on the strain distribution
in three directions (axial, hoop, and radial) for range of gasket material and thickness.
The hub thickness has been varied from 12 mm, which is the recommended value, to
6 mm. This range has been selected to study the effect of the hub thickness, and the
possibility of reducing the thickness, which means reducing the flange materials. The
figures, which show the axial, hoop and radial strains variation with hub thickness,
have been drawn with three axes. The abscissa represents the hub thickness the left
y- axis shows the real values of the strain. The right y-axis explains the normalized
percentage of the strain with reference hub thickness 12 mm and using 3 mm Nitrile
rubber gasket.
Maximum axial tensile strain vs hub thickness, The variation of the maximum axial
tensile strain with the hub thickness has been shown in Fig. 8.24 for range of gasket
thickness and material. The maximum strain has been measured at the outer surface
of the flange-hub interface as illustrated in Fig. 8.2. The findings indicate that the
200
210
220
230
240
250
260
270
280
290
300
35 40 45 50 55 60 65 70 75 80 85
Bo
lt a
xia
l st
rain
, μ
ε
Hub length, mm
FN3FV3FN5FV3
Fig. 8.23: Bolt axial strain (µε) variation with the hub length for range of
gasket types and thickness

Chapter eight Results & Discussions
183
hub thickness has insignificant effect on the maximum axial strain, which is increase
with less than 6%. The maximum axial strain is almost constant when the hub
thickness decreases from 12 mm to 9 mm but increases approximately 15 µε when
the hub thickness decreases from 9 mm to 6 mm. In addition, the Viton rubber gasket
produce axial strain higher than the Nitrile. Furthermore, the gasket thickness has
very small effect on the axial strain and thick gasket shows less maximum axial
strain. Based on the results, the hub thickness can be reduced to save the flange
materials.
Maximum axial compression strain vs hub thickness, Fig. 8.25 shows the
relationship between the maximum axial compression strain and the hub thickness
for different gaskets and thicknesses. The maximum axial compression strain has
been found and measured on the flange and around the bolt hole as explained in Fig.
8.2. The findings show that the variation of the axial compression strain with the hub
thickness is very small, which is less than the 2% when the hub thickness reduces to
the half (12 to 6 mm). However, the maximum compression strain increases when
the hub thickness decreases. In addition, the gasket material has a small effect on the
compression strain and the Viton gasket shows compression strain that is slightly
92
95
98
101
104
107
110
460
475
490
505
520
535
550
6 7 8 9 10 11 12 13
% S
trai
n (
FN
3,
H.t
hic
k. 12 m
m)
Max
ax
ial
tensi
le s
trai
n,
με
Hub thickness, mm
FN3
FV3
FN5
FV5
Fig. 8.24: Maximum axial tensile strain (µε) variation with the hub
thickness for range of gasket types and thickness

Chapter eight Results & Discussions
184
higher than the Nitrile gasket. Furthermore, the results are not influence by the
gasket thickness.
Maximum hoop strain vs hub thickness, The influence of the hub thickness on the
maximum hoop strain is shown in Fig. 8.26 for different gasket materials and
thicknesses. As shown in the Fig. 8.6, the maximum hoop strain is found at the lower
face and around the bolt hole, it is observed that the hub thickness has very small
effect on the hoop strain when it reduces from 12 to 6 mm. The total increasing of
the maximum hoop strain is less than 3% when the hub thickness is reduced to the
half, which is 6 mm. The behaviour of the variation is linear. In addition, the results
also show that the gasket material and thickness almost do not affect on the
maximum hoop thickness. Based on the above findings, it can also stated that the
hub thickness can be decreased to reduce the flange materials and cost.
96
98
100
102
104
106-1140
-1120
-1100
-1080
-1060
-1040
6 7 8 9 10 11 12 13
% S
trai
n (
FN
3,
H.t
hic
k. 1
2 m
m)
Max
ax
ial
com
pre
ssio
n s
trai
n,
με
Hub thickness, mm
FN3
FV3
FN5
FV5
Fig. 8.25: Maximum axial compression strain (µε) variation with the hub
thickness for range of gasket types and thickness

Chapter eight Results & Discussions
185
Maximum radial strain vs hub thickness, The variation of the maximum radial
strain with the hub thickness has been illustrated in Fig. 8.27 using 3 and 5 mm of
Nitrile and Viton rubber gaskets. The maximum radial strain is found at the lower
face of the flange and around the bolt holes as shown in the Fig. 8.8. The results
show that the hub thickness has insignificant impact on the maximum radial strain.
The maximum radial strain increases from 1112 µε to 1180 µε, which is almost 7%,
when the hub thickness increases from 12 to 6 mm. This is because of the increasing
of the flange bending due to the bolt load. In addition, the Viton gasket produces
radial strain slightly higher than the Nitrile rubber gasket. Furthermore, increasing
the gasket thickness from 3 to 5mm has very small influence on the maximum radial
strain.
Fig. 8.28 shows the history of the maximum radial strain when the flange joint is
subjected to the bolt load and the internal pressure for range of the hub thickness.
The style of this figure is same Fig. 8.4. The results show that the maximum radial
strain is influenced significantly by the bolt force whereas very little by the internal
pressure. The maximum radial strain increases sharply when the bolt load increases
but this increment becomes very small in the operating stage when the pressure
96
97
99
101
103
105
1060
1080
1100
1120
1140
1160
6 7 8 9 10 11 12 13
% S
trai
n (
FN
3,
H.t
hic
k. 12 m
m)
Max
hoop s
trai
n,
με
Hub thickness, mm
FN3
FV3
FN5
FV5
Fig. 8.26: Maximum hoop strain (µε) variation with the hub thickness for
range of gasket types and thickness

Chapter eight Results & Discussions
186
increased up to 6 bar. In addition, decreasing the hub thickness leads to slightly
increase the maximum radial strain.
98
100
101
103
105
107
109
110
1080
1100
1120
1140
1160
1180
1200
1220
6 7 8 9 10 11 12 13
% S
trai
n (
FN
3,
H.t
hic
k. 12 m
m)
Max
rad
ial
stra
in,
με
Hub thickness, mm
FN3
FV3
FN5
FV5
Fig. 8.27: Maximum radial strain (µε) variation with the hub thickness for
range of gasket types and thickness
0
200
400
600
800
1000
1200
1400
0 1.85 3.70 5.55 7.40 0 2 4 6
Bolt Load, kN
Pressure (0 bar)
Pressure, bar
Bolt Load (7.4 kN)
Max
rad
ial
stra
in,
με
12 mm
9 mm
6 mm
Fig. 8.28: Maximum radial strain (µε) variation with the bolt load and
internal pressure for range of the hub thickness

Chapter eight Results & Discussions
187
Bolt axial strain vs hub thickness, Fig. 8.29 shows the relationship between the bolt
axial strain and the hub thickness using different gasket types and thicknesses. The
axial strain of the bolt has been measured at the axial axis of the bolt where the strain
gauge has been embedded. See Fig. 8.10. The findings show that there is no
relationship between the bolt axial strain and the hub thickness regardless the gasket
behaviour and thickness.
8.8 Comparison of design variables effect
Table 8.2 shows summary of design variables and their effect on the maximum axial,
hoop and radial strains using the 3 mm Nitrile rubber gasket as a reference. The
results show that when the flange diameter, hub length, hub thickness and gasket
thickness (Nitrile and Viton) are changed (decreased), the variations of the maximum
strains increase up to less than 10% or even decrease up to 60%. For the flange
thickness, decreasing the flange thickness leads to increase the maximum axial strain
up to 40%, the maximum hoop strain 70%, the maximum radial strain 60% and the
bolt axial strain 10%. However, the maximum axial tensile and compression strains
are 658 and 1512 µε and the maximum hoop and radial strains are 1838 and 1765 µε.
The overall of this comparison is that some or all the flange dimensions can be
changed to reduce the flange material cost.
200
220
240
260
280
300
6 7 8 9 10 11 12 13
Bolt
ax
ial
stra
in, μ
ε
Hub thickness, mm
FN3
FV3
FN5
FV3
Fig. 8.29: Bolt axial strain (µε) variation with the hub thickness for range
of gasket types and thickness

Chapter eight Results & Discussions
188
Max. axial
tensile
strain
Max. axial
compressi
on strain
Max.
hoop
strain
Max.
radial
strain
Bolt axial
strain
Flange diameter
320-400 mm +1 -2 -1 -3 +1
Flange thickness
10-15 mm +4 +4 +7 +6 +1
Hub length
40-80 mm -6 +1 +1 +1 +1
Hub thickness
6-12 mm +1 +1 +1 +1 +1
Nitrile gasket
3-5 mm +1 +1 +1 +1 +1
Viton gasket
3-5 mm +1 +1 +1 +1 +1
Where:
1 : The variation is up to 10% ; 2 : The variation is up to 20%
3 : The variation is up to 30% ; 4 : The variation is up to 40%
5 : The variation is up to 50% ; 6 : The variation is up to 60%
7 : The variation is up to 70% ; 8 : The variation is up to 80%
8.9 Flange axial displacement
Axial displacement is another way to study the deformation and the bending on the
flange joint when it is subjected to the bolt load and internal pressure. In this section,
the axial displacement has been measured with two directions, hoop and radial.
Generally, all the obtained results values are of negative sign, which mean both the
matched flanges have moved towards the gasket to create sufficient sealing.
Table 8.2: Summary of design variables and their effect on the maximum strains

Chapter eight Results & Discussions
189
8.9.1 Axial displacement vs hoop angle
In the hoop direction, the axial displacement has been measured at the inner and
outer diameters. The reason behind that is to show the variation of axial
displacement in the hoop direction under range of the bolt load, internal pressure and
also to show the effect of the unsymmetrical bolt load around the flange.
Fig. 8.30 shows the flange axial displacement variation with the hoop distance (hoop
angle) at the inner and the outer diameters when the flange joint is subjected to the
design conditions (BL 7.4 kN pressure 3.4 bar). The abscissa represents the hoop
angle and it starts from 0 ͦ, which is at the line that passes through the pipe and bolt
centres, and ends at 22.5 ͦ, which is at the mid-point between two adjacent bolts. This
will be same for the next figures.
The results illustrate that the axis displacement is constant (0.0923 mm) with the
hoop angle at the inner diameter. For the outer diameter, the highest axial
displacement occurs at the bolt centre and it decreases towards the mid-point
between the adjacent bolts, this occurs because of the bolt load which is high at the
bolt hole and decreases toward the mid-point. In addition, it is observed that the axial
-0.21
-0.18
-0.15
-0.12
-0.09
-0.06
-0.03
0.00
0.0 2.5 5.0 7.5 10.0 12.5 15.0 17.5 20.0 22.5 25.0
Ax
ial
dis
pla
cem
ent,
mm
Hoop angle, deg
Inner diameter
Outer diameter
Fig. 8.30: Flange axial displacement variation with the hoop angle at the
inner and outer diameters

Chapter eight Results & Discussions
190
displacement at the outer diameter is higher than that in the inner diameter, this is
due to the flange bending, which is produced as a result of the applied loads.
Fig. 8.31 shows the relationship between the axial displacement and the hoop angle
at the outer diameter under range of the bolt load. It seems that the axial
displacement increases with increasing the bolt load. Increasing the bolt load leads to
deform the flange and compress the gasket, thereby, increasing the axial
displacement, especially at the bolts holes.
The influence of the internal pressure on the variation of the axial displacement with
the hoop angle at the outer diameter is shown in Fig. 8.32. The results have been
calculated when the flange joint is subjected to 0, 4 and 7.9 bar internal pressure. It
seems that the internal pressure has small effect on the axial displacement. However,
when the pressure increases, the axial displacement slightly increases. This is due to
the applied pressure forces on the internal face of the joint and on the interface
between the flange and the gasket. These forces are trying to add more moment on
the flange, thereby, increasing the flange bending and axial displacement. Finally, it
can be seen clearly through Fig. 8.31 and Fig. 8.32 that the effect of the bolt load on
the axial displacement is higher than that of the internal pressure.
-0.24
-0.20
-0.16
-0.12
-0.08
-0.04
0.00
0.0 2.5 5.0 7.5 10.0 12.5 15.0 17.5 20.0 22.5 25.0
Ax
ial
dis
pla
cem
ent,
mm
Hoop distance, deg
BL 2 kN
BL 6 kN
BL 10 kN
Fig. 8.31: Flange axial displacement variation with the hoop angle for
range of the bolt load, P 0 bar

Chapter eight Results & Discussions
191
8.9.2 Axial displacement vs radial distance
In the radial direction, the flange axial displacement has been measured at the right
edge (located on the line that passes through the centres of the pipe and the bolt hole)
and at the left edge (located on the line that passes through the centres of the pipe
and the mid-point between two adjacent bolts). Fig. 8.33 shows the variation of the
axial displacement with radial distance at the right and left edges when the flange is
subjected to the design conditions (BL 7.4 kN, pressure 0 bar). The flange axial
displacement at the right edge is higher than the left edge. This is because of the
axial bolt load, which bends the flange at the holes more than any other places. In
addition, the discontinuity that is shown in the curve of the axial displacement at the
right edge is due to the bolt holes, which needed removing the flange material in
these regions.
Fig. 8.34 explains the flange axial displacement relationship with radial distance at
the right edge (bolt centre) for range of the bolt load and the pressure is zero. It
seems that the flange axial displacement increases with increasing of the bolt load,
especially at the holes. This is because of the applied bolt force, which deforms the
Fig. 8.32: Flange axial displacement variation with the hoop angle for
range of the internal pressure, BL7.4 kN
-0.20
-0.16
-0.12
-0.08
-0.04
0.00
0.0 2.5 5.0 7.5 10.0 12.5 15.0 17.5 20.0 22.5 25.0
Axia
l dis
pla
cem
ent,
mm
Hoop angle, deg
0 bar
4 bar
7.9 bar
Bolt
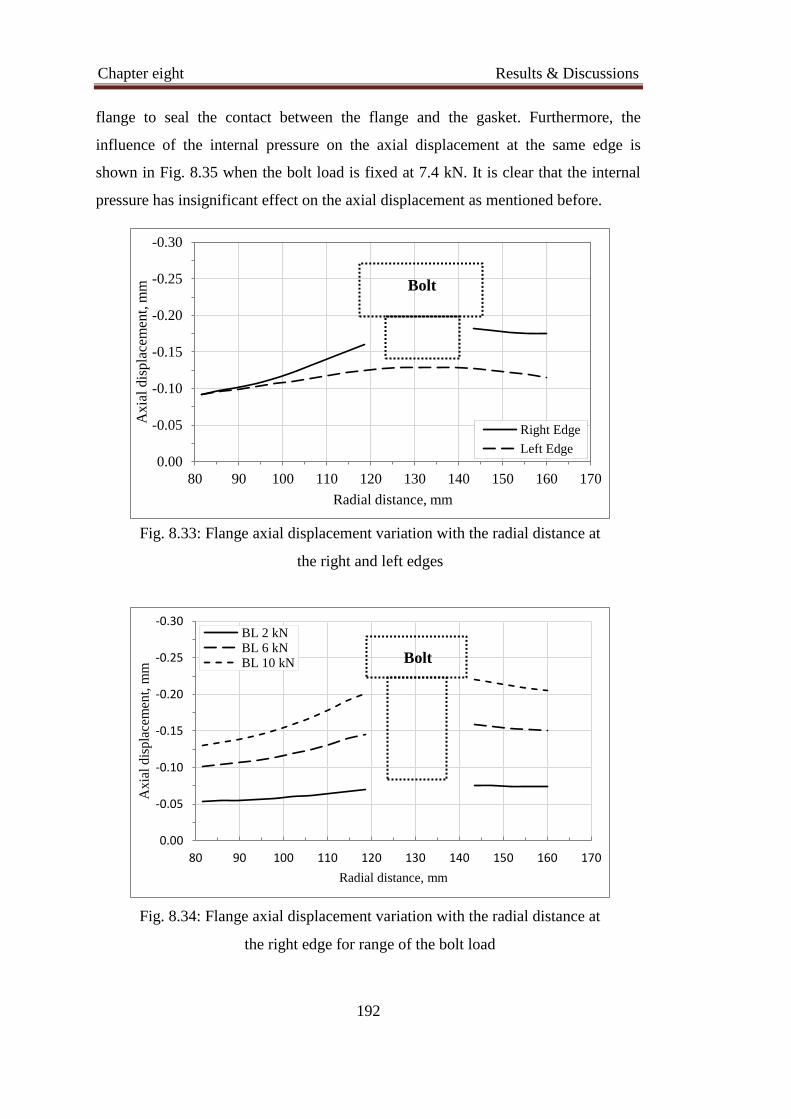
Chapter eight Results & Discussions
192
flange to seal the contact between the flange and the gasket. Furthermore, the
influence of the internal pressure on the axial displacement at the same edge is
shown in Fig. 8.35 when the bolt load is fixed at 7.4 kN. It is clear that the internal
pressure has insignificant effect on the axial displacement as mentioned before.
-0.30
-0.25
-0.20
-0.15
-0.10
-0.05
0.00
80 90 100 110 120 130 140 150 160 170
Ax
ial
dis
pla
cem
ent,
mm
Radial distance, mm
Right Edge
Left Edge
Fig. 8.33: Flange axial displacement variation with the radial distance at
the right and left edges
Bolt
-0.30
-0.25
-0.20
-0.15
-0.10
-0.05
0.00
80 90 100 110 120 130 140 150 160 170
Axia
l dis
pla
cem
ent,
mm
Radial distance, mm
BL 2 kNBL 6 kNBL 10 kN
Fig. 8.34: Flange axial displacement variation with the radial distance at
the right edge for range of the bolt load
Bolt

Chapter eight Results & Discussions
193
-0.30
-0.25
-0.20
-0.15
-0.10
-0.05
0.00
80 90 100 110 120 130 140 150 160 170
Ax
ial
Dis
pla
cem
ent,
mm
Radial Distance, mm
0 bar4 bar7.9 bar
Fig. 8.35: Flange axial displacement variation with the radial distance at
the right edge for range of the internal pressure
Bolt

Chapter eight Results & Discussions
194
8.10 Flange rotation
Flange rotation is another way to get a good indication about the flange bending and
performance. Flange rotation angle is calculated based on the difference in the axial
displacement at the inner and the outer radiuses divided by the radial distance
between of them as shown in Fig. 8.36 and the following equation:
𝛩 = 𝑡𝑎𝑛−1 (𝑆𝑜−𝑠𝑖
𝑅𝑜−𝑟𝑖)
In some cases, the flange displacement is measured between the inner radius and the
lowest point in the flange instead of the outer radius. The reason for choosing this is
that in the big flange diameters, the axial displacement around the holes is higher
than that at the outer diameter so that gives accurate calculation for the flange
rotation.
Fig. 8.37 describes the flange rotation angle with the hoop angle under various of the
bolt loads. The 0 edge of hoop represents the bolt side and the 22.5 edge hoop angle
represents the mid-point between two adjacent bolts. The findings indicate that the
flange is subjected to the rotation at the bolt holes higher than any other region. This
occurs due to the high concentration of the bolt load at the bolts holes. In addition,
Fig. 8.36: Schematic diagram of the flange bending

Chapter eight Results & Discussions
195
the effect of the bolt load on the flange rotation can be seen clearly in the same
figure. When the bolt load increases 2, 6 and 10 kN, the flange rotation increases due
to the produced flange bending.
The influence of the internal pressure on the flange rotation has been shown in Fig.
8.39 when the bolt load is 7.4 kN. It is observed that the flange rotation is increased
by the internal pressure. This happens because of the pressure forces including the
hydrostatic end force and penetrated pressure force between the flange and gasket
are trying to left up the inner flange diameter, which means increasing the flange
rotation.
Fig. 8.38 illustrates the variation of the flange rotation with internal pressure up to
the leakage pressure under different bolt loads. As mentioned earlier, the internal
pressure and the bolt load are the main loads that affect on the flange rotation. When
they increase, the flange rotation increases. Therefore, the GFRP flange should be
designed carefully with high stiffness to withstand the applied loads, especially, at
the flange neck, which represents the common failure point in the available
commercial flanges. Reinforcing the neck region (hub-flange intersection) leads to
reduce the flange bending, thereby, reducing the flange rotation.
Fig. 8.37: Flange rotation variation with the hoop distance for range of the
bolt load
0.00
0.02
0.04
0.06
0.08
0.10
0.12
0.14
0.0 2.5 5.0 7.5 10.0 12.5 15.0 17.5 20.0 22.5 25.0
Fla
nge
rota
tio
n, d
eg
Hoop angle, deg
BL 2 kN
BL 6 kN
BL 10 kN
Bolt

Chapter eight Results & Discussions
196
0.000
0.020
0.040
0.060
0.080
0.100
0.120
0.140
0.160
0 2 4 6 8 10
Fla
nge
rota
tion, deg
Internal pressure, bar
2 kN
4 kN
6 kN
8 kN
10 kN
Leakage
Fig. 8.38: Flange rotation variation with the internal pressure for range of
the bolt load
0.000
0.020
0.040
0.060
0.080
0.100
0.120
0.140
0.0 2.5 5.0 7.5 10.0 12.5 15.0 17.5 20.0 22.5 25.0
Fla
nge
rota
tio
n, d
eg
Hoop angle, deg
3.4 bar
0 bar
7.9 bar
Fig. 8.39: Flange rotation variation with the hoop a for range of the
internal pressure
Bolt

Chapter eight Results & Discussions
197
8.11 Leakage pressure
Leakage pressure (LP) is one of the critical points that should be avoided in the
pipelines or the pressure vessels. Catastrophic problems can be occurred if the
leakage happen in many applications. In this chapter, the leakage pressure has been
calculated numerically by using ANSYS with the PPNC criterion, which has been
explained in details in chapter 6. This section investigates the relationship between
the leakage pressure and the flange dimensions as well as the bolt load.
8.11.1 Leakage pressure vs flange diameter
Fig. 8.40 illustrates the leakage pressure (LP) variation with the flange diameter for
different gasket materials and thicknesses when the bolt load is 7.4 kN. The findings
show that the highest LP occurs at the lowest diameter (320 mm) regardless of the
gasket characteristics. This is because of the high flange bending when the bolt load
is applied and low gasket reaction. This creates high compression pressure on the
gasket, which controls the fluid pressure penetration. When the flange outer diameter
increases to 340 mm, the LP decreases almost one bar. This occurs due to the
increasing in the contact area between flange and the gasket. This increment leads to
increase the gasket reaction and reduce the flange bending, thereby decreasing the
contact pressure, which decreases the LP.
5.5
6
6.5
7
7.5
8
8.5
9
310 320 330 340 350 360 370 380 390 400 410
Lea
kag
e p
ress
ure
, bar
Flange diameter, mm
FN3
FV3
FN5
FV3
Fig. 8.40: Leakage pressure variation with the flange diameter for different
gasket materials and thickness

Chapter eight Results & Discussions
198
When the flange outer diameter increases more up to 400 mm, the LP starts again to
increase but slightly, which means the effect of the diameter within this range on the
leakage pressure has decreased. The reason of this change is that the contact pressure
at the new area (340 – 400 mm) is very low or even approximately zero. See Fig.
8.41 . This means that there is little or no contact between the flange and the gasket
at the area that outside the 340 mm diameter. Therefore, increasing the outer
diameter will move up more the outer edge of the flange due to bolt load, high gasket
reaction and the circular geometry of the flange disc. This increases the gasket
reaction at the bolt circle diameter region and leads to increase the contact pressure,
which increases slightly the LP. In addition, the LP is affected by the gasket material
and the Nitrile gasket increases the LP almost 0.5 bar more than the the Viton gasket
for all the diameters. It seems that the gasket thickness does not influence on the LP
except a small effect at the diameter range 360 – 380 mm.
The influence the bolt load on the LP variation for different flange outer diameter
has been described in Fig. 8.42. The bolt force is 7.4 kN and 3 mm Nitrile rubber
gasket has been used. The results show that there is a non-linear relationship between
the LP and the bolt load. Increasing the bolt load leads to increase the LP. The lowest
LP was recorded at the flange diameter 360 mm whereas the highest was with the
320 mm flange (except at the high bolt loads) and the middle LP was with 400 mm.
The reasons behind those values have been explained earlier.
Fig. 8.41: Contact pressure between the flange and the gasket

Chapter eight Results & Discussions
199
8.11.2 Leakage pressure vs flange thickness
The effect of the flange thickness on the leakage pressure using different gasket
types and thicknesses is shown in Fig. 8.43. The bolt load is 7.4 kN. It is observed
that the relationship between the LP and the flange thickness is linear. Increasing the
flange thickness leads to increase the LP. This occurs due to the increasing in the
flange strength, which reduces the flange deformation. Usually, the leakage occurs at
the mid-point between two adjacent bolts as shown in Fig. 8.44. Therefore,
increasing the flange stiffness leads to distribute the bolts loads uneven on all the
flange disc, thereby, increasing the leakage pressure. In addition, the gasket
thickness does not affect on the LP but the gasket material affect on the LP. The
Nitrile rubber gasket produces LP higher than the Viton gasket regardless the flange
thickness.
Furthermore, the impact of the bolt load on the LP is shown in Fig. 8.45 for various
flange thickness using 3 mm Nitrile gasket. As mentioned earlier, the LP increases
with increasing of the bolt load. However, the effect of the bolt load on the LP
decreases with increasing bolt load. It is high at the low bolt load values but less at
the high values. The LP increases with increasing the flange thickness except at the
0
2
4
6
8
10
0 2 4 6 8 10
Lea
kag
e p
ress
ure
, b
ar
Bolt load, kN
320 mm
360 mm
400 mm
Fig. 8.42: Leakage pressure variation with the bolt load for different
flange diameter

Chapter eight Results & Discussions
200
low bolt load values, which less than 4 kN. At the low bolt load, the leakage pressure
is not affected by the flange thickness, this is because of that, at the low bolt load, the
leakage occurs at the bolts holes instead of the mid- point between two adjacent bolts.
5
5.5
6
6.5
7
7.5
8
8.5
9
9 10 11 12 13 14 15 16
Lea
kag
e p
ress
ure
, b
ar
Flange thickness, mm
FN3
FV3
FN5
FV3
Fig. 8.43: Leakage pressure variation with the flange thickness for range
of the gasket materials and thickness
Fig. 8.44: Leakage pressure point

Chapter eight Results & Discussions
201
8.11.3 Leakage pressure vs hub length
The variation of the leakage pressure (LP) with the hub length has been shown in Fig.
8.46 for range the gasket materials and thickness under 7.4 kN bolt load. It seems
that the LP decreases when the hub length increases. The reason is that when the hub
length decreases the flange bending increases (due to the circular geometry of the
hub), thereby, the compression stress on the gasket at the holes circle increases as
well. This increment in the gasket compression stress is trying to stop the leakage
propagation and increasing the LP. As the previous, the Nitrile gasket produce LP
higher than the Viton gasket and this is because the natural behaviour of the rubber.
The gasket thickness does not effect the LP.
In addition, Fig. 8.47 illustrates the effect of the bolt load on the LP for different hub
length using 3 mm Nitrile rubber gasket. Increasing the bolt load leads to increase
the leakage pressure. The relationship between of them is non-linear. The influence
of the bolt load on the LP is high at the low bolt loads comparing with it at the high
bolt loads. Furthermore, the hub length has small impact on the LP. The LP at the
hub length 40 mm is higher than those at the hub length 60 and 80 mm.
Fig. 8.45: Leakage pressure variation with the bolt load for different
flange thickness
0
2
4
6
8
10
0 2 4 6 8 10
Lea
kag
e p
ress
ure
, b
ar
Bolt load, kN
10 mm
12.5 mm
15 mm

Chapter eight Results & Discussions
202
0
2
4
6
8
10
12
0 2 4 6 8 10
Lea
kag
e pre
ssure
, bar
Bolt load, kN
40 mm
60 mm
80 mm
Fig. 8.47: Leakage pressure variation with bolt load for different hub
length
6
6.5
7
7.5
8
8.5
9
9.5
10
35 40 45 50 55 60 65 70 75 80 85
Lea
kag
e p
ress
ure
, b
ar
Hub length, mm
FN3
FV3
FN5
FV3
Fig. 8.46: Leakage pressure variation with the hub length for range of
gasket materials and thickness

Chapter eight Results & Discussions
203
8.11.4 Leakage pressure vs hub thickness
Fig. 8.48 explains the relationship between the leakage pressure (LP) and the hub
thickness when the bolt load is 7.4 kN using different gasket thicknesses and
materials. It is clear that the hub thickness has a small effect on the LP. The LP has
decreased (less than 0.5 bar) when the hub thickness increased from 6 to 12 mm.
Increasing the hub thickness means increasing the hub stiffness and the stiffness of
the hub-flange interface. This increasing in the stiffness minimizes the flange
bending under the applied loads. Therefore, the LP decreases. Regarding the gasket
behaviour, the Viton rubber gasket gives LP less than Nitrile gasket and the gasket
thickness does not affect the LP.
In addition, Fig. 8.49 describes the impact of the bolt load on the LP using Nitrile
gasket with 3 mm thickness. Generally, the results are same the results of Fig. 8.47
but the hub thickness has different influence. The hub length does not effect on the
LP at the low bolt loads (0-6 kN) (and after that, the bolt load starts to affect). At the
beginning of the bolt preload (low bolt load values), the rubber gasket deforms firstly,
because of it is soft material. The flange bending, which is affected by the hub
thickness, occurs later at the high bolt load after deforming the rubber gasket. So that,
the leakage pressure is affected by the high bolt load rather than the low.
6
6.5
7
7.5
8
8.5
9
9.5
10
6 7 8 9 10 11 12 13
Lea
kag
e p
ress
ure
, bar
Hub thickness, mm
FN3
FV3
FN5
FV3
Fig. 8.48: Leakage pressure variation with the hub thickness for various
gasket materials and thickness

Chapter eight Results & Discussions
204
8.12 Results contribution
The obtained results have contributed significantly in the design and manufacturing
of the composite flange. The manufacturing process and the used materials with the
selected fabric structure have produced a good GFRP flange with high strength. So
that it can be used as a reference for further studies. In these studies, other
manufacturing methods (RTM or hand lay-up) with other material and different
structure can be used to find out the best manufacturing process, materials and fabric
structure, thereby obtaining a good composite flange with a high strength, quick
fabrication process and low in the cost.
In terms of the flange dimensions (Flange outer diameter, flange thickness, hub
thickness and hub length), most of these dimensions have small effect on the
maximum axial, hoop and radial strains. Based on the obtained results, most of the
dimensions can be reduced to save the materials. Therefore, an optimization study
using Taguchi method or Normalized Normal Constraint Method is required to
determine the amount allowable reduction in the dimensions. These reductions are
important to reduce the required materials and their cost. In addition, the results
0
2
4
6
8
10
12
0 2 4 6 8 10
Lea
kag
e pre
ssure
, bar
Bolt load, kN
6 mm9 mm12 mm
Fig. 8.49: Leakage pressure variation with the bolt load for different hub
thickness

Chapter eight Results & Discussions
205
show that the ASME Code was conservative due to the good selections of the
manufacturing process, materials and fabric structure. This conservative also has
been found by other study for a metallic flange [36], which has been discussed in
section 2.4.3.
For the gasket type and thickness, they have small influence on the flange strains
distributions. Therefore, other types of rubber gaskets, which are used for different
purposes such as water industry, such as EPDM or Neoprene can be tested and
compare their results with the current results.
This study has been conducted under range of the bolt load and internal pressure and
at zero external load. Based on obtained results, a further study is required to
investigate the effect of the external loads, which can be force or pressure. This is
important in the pipelines that are subjected to external loads such as extracting the
oil from under the seabed. Similarly, the results of this study have been measured
and calculated at the room temperature. Other investigation is required to find the
effect of the thermal load (internal or external thermal load) on the flange behaviour.
In the high temperature applications, the thermal deformation is a big problem and it
can lead to fail the joint either mechanical failure or leakage. More details can be
found in chapter 2, section 2.4.6, which includes many studies [39-42] about the
influence of the thermal load on the metal flange joint.

Chapter eight Results & Discussions
206
8.13 Summary
This chapter analyses the effect of the flange dimensions on the maximum strains in
the axial, hoop and radial directions using the FEA analysis. These dimensions are
the flange outer diameter, flange thickness, hub length and hub thickness. Various
gasket materials and thickness has been used. Various loads, including the designed
loads, which are the bolt load 7.4 kN and the internal pressure 3.4 bar, have been
applied. In addition, the flange axial displacement, flange rotation and leakage
pressure has been investigated in this chapter for a range of the flange dimensions
and loads.
Based on the obtained results, it can be summarized that the GFRP flange showed
high performance and the values of the strains were low. The influence of the bolt
load on the axial, hoop and radial strains is higher than the internal pressure load.
Most of the flange dimensions (within the selected range) have a small effect on the
maximum strains and that encourages reducing the flange dimensions, which means
reduce the materials and cost. The axial bolt strain is not influenced by the flange
dimensions. The gasket material has a small effect on the maximum strain whereas
the gasket thickness has no affect. This encourages the use of thin gaskets to reduce
the cost. The flange axial displacement and flange rotation are high at the bolts holes
due to the bolt loads. The flange axial displacement and flange rotation are affected
by the bolt load more than the internal pressure. The leakage pressure is affected by
varying the flange dimensions due to the changing in the flange strength and
stiffness. The relationship between the leakage pressure and the bolt load is non-
linear.

Chapter Nine Conclusions & Recommendations
207
CHAPTER NINE
CONCLUSIONS &
RECOMMENDATIONS
9.1 Conclusions
This PhD work has been conducted to investigate the design and the manufacture of
bolted flange joint made of glass fibre reinforced polymer for oil and gas
applications using the experimental and the numerical methods. Many areas can be
concluded in the following sections.
9.1.1 Composite flange standards or design codes
Most of the current standardizations and the relevant design codes of the bolted
GFRP flange joint have been modified from their counterpart of metallic design
methods so that they neglect the composite materials behaviours, which are different
from those of the metallic materials. For example, the analytical approach of ASME
code, which is used in this study, does not take into account of the mechanical
properties of the composite materials, which are affected significantly by the type of
material, fabric structure, fibre content and directions, and the type of the
manufacturing process. Therefore, there is an urgent need for a design code, which
takes into account of all the details of the composite materials.

Chapter Nine Conclusions & Recommendations
208
9.1.2 Manufacturing of the GFRP flange
The GFRP flange has been fabricated based on the ASME code, Section X. The
fabrication process are mainly divided into two steps: (1) mould manufacturing and
(2) flange fabrication, which represent one of the novelties in this project. The mould
has been designed and manufactured using aluminium and glass materials as well as
bolts and O-ring rubber gasket. The manufactured mould has achieved all the
requirements, which are flange strength or stiffness, required flange dimensions,
flange surface quality and the flange removal from the mould after the curing.
In terms of the flange manufacturing, the bolted GFRP flanges have been fabricated
using glass fibre braid, polyester and vacuum infusion process (bag moulding), which is
one of the four methods that are recommended by the ASME code. In addition, a
number of experiments have been conducted to solve the faced issues (dry regions,
voids and cracks) and to improve the manufacturing process. The fabricated GFRP
flange was good product with high quality and performance. Furthermore, a comparative
study has been carried out using two types of drill bits (Erbauer diamond tile drill bit
and Brad & Spur K10 drill) with various rotation speed. The best obtained drilled
flange holes were by using Erbauer diamond tile drill bit at rotation speed 800 rpm.
The flange has been bonded to composite pipe as well as another type of flange. These
and other components (rubber gasket, blind flanges, fasteners and fitting) have been
assembled to produce a pressure vessel.
9.1.3 Bolted GFRP flange testing
After fixing all the requirements for collection the required data, the bolted flange
joint has been tested under various bolt and internal pressure loads using different
types of rubber gaskets (Nitrile and Viton) with 3 and 5 mm thicknesses. The
required data were axial, hoop and radial strains and leakage pressure. The obtained
data were very good and that confirms the high quality of the testing set up.
Another novelty in this work is that a parallel study has been conducted about the
bolt strain gauges. Two types of strain gauges (bonded strain gauges and embedded
strain gauges) have been used in this study to find out the best strain gauge that can
measure the axial bolt load with high accuracy. The results show that both types are
good but the embedded strain gauge is better as its installation is easier and quicker
than the bonded strain gauge.

Chapter Nine Conclusions & Recommendations
209
9.1.4 FEA model of GFRP flange joint
The bolted flange joint system has been simulated in this study using FEA with
ANSYS. The FEA includes all components of the bolted flange joint; such as
composite flange and pipe with their orthotropic mechanical properties, adhesive
bonding and fastener with their isotropic properties and the rubber gaskets (Nitrile
and Viton) with their non-linear behaviour during the loading and the unloading
conditions. In the FEA of this study, the novel work was the simulating of the fluid
pressure penetration. The fluid pressure penetration has been simulated using PPNC
criterion and applied between the flange and the rubber gasket. The flange joint
deformation, axial, hoop and radial strains and stress, axial displacements, flange
rotation and the leakage pressure were measured in this FEA. All the FEA results
were very good and have good agreement with the experimental results. This proves
the high performance of the FEA model, which can be used for further investigations.
9.1.5 Validation of results
The experimental and the numerical results have been compared for both the
boundary conditions (bolt up and operating). The relationships between these results,
which are axial, hoop and radial strains, flange-gasket contact pressure and leakage
pressure, and the bolt and internal pressure loads have been investigated. The results
show that the proposed composite flange has high quality, good performance and good
strength based on the identified values of strains (axial, hoop and radial). The strain
values are comparatively low even with the applied loads that are more than the
recommended design conditions. The agreement between the experimental and the
numerical results are excellent and this validates the FEA method used. The distribution
of the gasket contact stress (contact pressure) is non-uniform across the gasket face. Pressure
values are higher around the bolt hole and gradually decreases in the radial direction of the
bolt hole. It is proved that the finite element method using PPNC in ANSYS can be
considered as an efficient tool to study the leakage behaviour.
In addition, another FEA model has been developed for a metal flange with the same
boundary conditions of the GFRP flange FEA and the fluid pressure penetration criterion
(PPNC). This flange has been investigated experimentally and numerically by [1]. The
results show that there is an excellent agreement with the published results. This can be
considered as another validation of the FEA method used.

Chapter Nine Conclusions & Recommendations
210
9.1.6 Effect of the applied loads
The effect of the bolt and internal pressure loads on the strains distributions, flange
axial displacement and rotation, leakage pressure have been investigated in this study.
The results show that increasing these loads lead to increase the flange strains, flange
axial displacement and rotation. In addition, the leakage pressure increases with
increasing the bolt load. It is observed that the effect of bolt load is higher than the
internal pressure for the strain distributions, flange axial displacement and rotation.
9.1.7 Effect of the flange dimensions
The relationships between the flange dimensions with the maximum axial, hoop and
radial strains and the leakage pressure have been investigated in this project. These
dimensions are flange outer diameter and thickness and hub length and thickness.
The results indicated that the GFRP flange showed high performance and the values
of the maximum strains were low. Most of the flange dimensions (within the
selected range) have a small effect on the maximum strains and that encourages
reducing the flange dimensions, which means reduce the materials cost. The leakage
pressure is mostly affected by the flange thickness but less affected by the flange
outer diameter, the hub length and the thickness. The above-mentioned points
represent novel results and should be considered in the related future works.
9.1.8 Effect of the gasket materials and thickness
Two types of rubber gaskets with 3 and 5 mm thicknesses have been studied. These
gaskets are made of Nitrile and Viton rubber, which are commonly used in the oil
and gas industry. The findings indicated that the gasket materials and thickness have
very small effects on the flange strains, the axial displacement and the rotation. The
leakage pressure is affected more by the gasket materials than the thickness.

Chapter Nine Conclusions & Recommendations
211
9.2 Recommendations for future work
The following areas of future research are recommended:
1. More experimental studies are required to manufacture the composite flange
with different manufacturing processes such as hand lay-up or resin transfer
moulding. In this research, vacuum infusion process is used. So that the results
can be compared with the results of this study. So far, the current fabricated
flange is over-designed. Therefore, other manufacturing processes such as RTM
or hand lay-up, which are probably faster and cheaper, can be used. These
manufacturing processes have less fibre content than the vacuum infusion
process and that will effect on the all the mechanical properties. However, the
over-designed of the current flange can be compensated by changing the
manufacturing process to be cheap and fast.
2. Based on the obtained results, an optimization study is required to study the
reducing of the flange dimensions taking into account the cost parameter.
3. More loads can be applied on the bolted flange joints. These loads are external
force, external pressure. This can extend the use of the flange in other
applications.
4. Study the effect of the fluid flow and fluid thermal load on the performance of
the GFRP flange joint.
5. Using different types of the rubber gaskets such as Neoprene and EPDM, which
are used in the water industries and PTFE that is commonly used in the chemical
applications.
6. Study the effect of the fluid viscosity on the leakage propagations between the
flange and the rubber gasket. This can be done by using ANSYS fluid codes
such as CFX or CFD.
7. Study the effect of corrosion and erosion on the composite flange performance.
In some applications, these problems are important.

Chapter Nine Conclusions & Recommendations
212
8. Study the electric conductivity of the composite flange and add some nano
materials (carbon nanotubes), which help to improve mechanical properties and
the electric conductivity of the composite. This can help to detect the
mechanical damages (cracks) and avoid them before they becomes catastrophic.
It also minimizes the effect of the static electric shock.

Appendices
213
APPENDICES
Appendix (A): Helius composite validation properties of the composite
properties
Fig. A.2: GFRP lamina properties
Fig. A.1: Design of GFRP lamina

Appendices
214
Fig. A.4: 2D and 3D mechanical properties of the GFRP laminate
Fig. A.3: Design of GFRP laminate

Appendices
215
Appendix (B): Calibration of the strain indicators and recorder (P3’s)
Fig. B.1: Calibration data of P3, SN 0161615
Fig. B.2: Calibration data of P3, SN 0169299

Appendices
216
Fig. B.4: Calibration data of P3, SN 0170060
Fig. B.3: Calibration data of P3, SN 0170024

Appendices
217
Appendix (C): Calibration of the digital torque adaptor
Fig. C.1: Calibration data of digital torque adaptor

Appendices
218
Appendix (D): Calibration of the pressure gauge
Fig. D.1: Calibration data of pressure gauge

References
219
REFERENCES
1. Sawa, T., Higurashi, N., and Akagawa, H., A stress analysis of pipe flange
connections. Journal of Pressure Vessel Technology, 1991, 113(4): P. 497-
503.
2. Mallinson, J.H., Corrosion-resistant plastic composites in chemical plant
design. Marcel Dekker, New York, 1988.
3. Lees, J.M., Behaviour of GFRP adhesive pipe joints subjected to pressure
and axial loadings. Composites Part A: Applied Science and Manufacturing,
2006, 37(8): P. 1171-1179.
4. Gemi, L., Tarakçiog˘lu, N., Akdemir, A., Sßahin, Ö. S., Progressive fatigue
failure behavior of glass/epoxy (±75°)2 filament-wound pipes under pure
internal pressure. Materials & Design, 2009, 30(10): P. 4293-4298.
5. Lee, C. S., Hwang, W., Park, H. C., Han, K. S., Failure of carbon/epoxy
composite tubes under combined axial and torsional loading 1. Experimental
results and prediction of biaxial strength by the use of neural networks.
Composites Science and Technology, 1999, 59(12): P. 1779-1788.
6. Harvey, W.A. and Kremer, J.S., Design, process development, and
fabrication of an all IM 7/977-2 12 in. dia. pressurized fuel line required to
operate at -423 F while bolted to an aluminum valve. Evolving technologies
for the competitive edge, 1997, P. 839-853.
7. Sun, L., Bolted flanged connections made of fiber reinforced plastic
materials. Concordia University, 1995.
8. Estrada, H., A Fiber Reinforced Plastic Joint for Filament Wound Pipes:
Analysis and Design. University of Illinois, 1997.

References
220
9. Aljuboury, M., Rizvi M.J., Grove, S. and Cullen, R.., Bolted fibre-reinforced
polymer flange joints for pipelines: A review of current practice and future
challenges. Proceedings of the Institution of Mechanical Engineers, Part L:
Journal of Materials: Design and Applications, 2018.
10. ASME B16.5-2003, Pipe Flanges and Flanged Fittings. The American
Society of Mechanical Engineers, USA, 2003.
11. ASME B16.47-2011, Large Diameter Steel Flanges. The American Society
of Mechanical Engineers, USA, 2011.
12. Brownell, L.E. and Young, E.H., Process equipment design: vessel design.
John Wiley & Sons, 1959.
13. Lamit, L.G., Pipe Fitting and Piping Handbook. Prentice Hall, Inc, 1984.
14. Yang, C., Design and analysis of composite pipe joints under tensile loading.
Journal of Composite Materials, 2000, 34(4): P. 332-349.
15. Tao, G., Liu, Z., Ly, M.Y., Chen, S., Research on manufacture and test of
advanced composite material flange. Open Mechanical Engineering Journal,
2011, 5: P. 87-96.
16. Bickford, J., Gaskets and gasketed joints. CRC Press1997.
17. Barbero, E.J., Introduction to Composite Materials Design. Taylor & Francis
1998, Vol. 1.
18. Gurit, Guide to composites. Gurit. Available at;
www.gurit.com/-/media/Gurit/Datasheets/guide-to-composites.pdf
19. Lubin, G., Handbook of composites. Van Nostrand Reinhold Company, 1982.
20. Adams, R. and Bogner B., Long Term Use of Isopolyesters in Corrosion
Resistance. In Technical Sessions of The Annual Conference-Composites
Institute. Society of the Plastics Industry, Inc, 1993.

References
221
21. Mallick, P.K., Fiber-reinforced composites: materials, manufacturing, and
design. CRC Press, 2007.
22. Peters, S.T., Handbook of composites, 2nd edition. Springer Science &
Business Media, 1998.
23. Bunsell, A.R. and Renard, J., Fundamentals of fibre reinforced composite
materials. CRC Press, 2005.
24. ASME Boiler and Pressure Vessel Code, Section X, Fiber-Reinforced Plastic
Pressure Vessels. The American Society of Mechanical Engineers, USA,
2010.
25. Gay, D., Hoa, S.V., and Tsai, S.W., Composite materials: design and
applications. CRC Press, 2003.
26. Weatherhead, R., FRP technology: fibre reinforced resin systems. Springer
Science & Business Media, 2012.
27. Hull, D. and Clyne, T.W., An introduction to composite materials.
Cambridge University Press, 1996.
28. Potter, K., Resin transfer moulding. Springer Science & Business Media,
2012.
29. Tong, L., Mouritz, A.P., and Bannister M.K., 3D fibre reinforced polymer
composites. 2002: Elsevier.
30. Long, A.C., Design and manufacture of textile composites. Woodhead
Publishing Ltd, 2005.
31. Gong, R.H., Specialist yarn and fabric structures Developments and
applications. Woodhead Publishing Ltd, 2011.
32. Lee, S.M., Handbook of composite reinforcements. John Wiley & Sons, 1992.

References
222
33. Dynaflow research group, GRP Flanges design & assessment. Rotterdam,
2011.
34. Omiya, Y., Sawa, T., and Takagi, Y., Stress analysis and design of bolted
flange connections under internal pressure. ASME Pressure Vessels and
Piping Conference, American Society of Mechanical Engineers, 2014.
35. Naser, K., Bolted flanged connections with full face gaskets. Concordia
University, 1995.
36. Nash, D.H, Spence J., Tooth, A.S., Abid, M. and Power, D.J., A parametric
study of metal-to-metal full face taper-hub flanges. International Journal of
Pressure Vessels and Piping, 2000. 77(13): P. 791-797.
37. Shoji, Y. and Nagata, S., Analysis of gasketed flanges with ordinary elements
using apdl control. Toyo Engineering Corporation, Narashino City, Chiba,
Japan, 2002.
38. Abid, M. and Nash D.H., A parametric study of metal-to-metal contact
flanges with optimised geometry for safe stress and no-leak conditions.
International Journal of Pressure Vessels and Piping, 2004, 81(1): P. 67-74.
39. Abid, M., Determination of safe operating conditions for gasketed flange
joint under combined internal pressure and temperature: A finite element
approach. International Journal of Pressure Vessels and Piping, 2006. 83(6):
p. 433-441.
40. Abid, M. and Ullah, B., Three-dimensional nonlinear finite-element analysis
of gasketed flange joint under combined internal pressure and variable
temperatures. Journal of Engineering Mechanics, 2007, 133(2): P. 222-229.

References
223
41. Nechache, A. and Bouzid A.-H., The determination of load changes in bolted
gasketed joints subjected to elevated temperature. ASME Pressure Vessels
and Piping Conference. American Society of Mechanical Engineers, 2003.
42. Guruchannabasavaiah, N.G., Shanmugam, and Arun, L.R., Effect of
Temperature and associated deformations on the gasket seal compression in
a pressure vessel. International Journal of Scientific & Engineering Research,
2013, 4(8): P. 7.
43. BS EN 1591-1 Flanges and their joints — Design rules for gasketed circular
flange connections —Part 1 Calculations.
44. ASME PCC-1-2013, Guidelines for pressure boundary flanged connections,
The American Society of Mechanical Engineers, USA, 2013.
45. Żyliński, B. and Buczkowski, R., Analysis of bolt joint using the finite
element method. Archive of Mechanical Engineering, 2010, 57(3): P. 275-
292.
46. Zahavi, E., A finite element analysis of flange connections. Journal of
Pressure Vessel Technology, 1993, 115(3): P. 327-330.
47. Do, T.D., Bouzid A.-H., and My, T. , Effect of bolt spacing on the
circumferential distribution of the gasket contact stress in bolted flange joints.
Université Du Québec, 2012.
48. Koves, W.J. Flange Joint Bolt Spacing Requirements. ASME Pressure
Vessels and Piping Conference. American Society of Mechanical Engineers,
2007.
49. Hwang, D.Y. and Stallings J.M., Finite element analysis of bolted flange
connections. Computers & Structures, 1994, 51(5): P. 521-533.

References
224
50. Sanjay, S.J., Sunil Kummer B.V., Kulkarni, B. and Math, V.B., Stress
analysis of a non-gasketted composite flange. International Journal of
Advancement in Engineering Technology, Mangement & Applied Science,
2014.
51. Whitfield, G.S., Reid, R.G. and Paskaramoorthy, R., Creep and
unsymmetrical shrinkage during post-cure of GFRP pipe flanges. 2014.
52. Estrada, H. and Parsons, I.D., Strength and leakage finite element analysis of
a GFRP flange joint. International Journal of Pressure Vessels and Piping,
1999, 76(8): P. 543-550.
53. Kurz, H. and Roos, E., Design of floating type bolted flange connections with
grp flanges. International Journal of Pressure Vessels and Piping, 2012, 89: P.
1-8.
54. Kittel, K., Vajna, S. and Marks, L.E., Optimisation of Grp-Flange Joints.
International Conference on Engineering Design, Paris, 2007.
55. Fangueiro, R., Nunes, P., Soutinho, F. and Araújo M. de,, Development of
fibrous preforms for FRP pipe connections. Composites Science and
Technology, 2009, 69(9): P. 1412-1416.
56. Rod Martin, A technology gap review of composites in the UK oil and gas
industry, Materials engineering research laboratory, UK, 2007.
57. Bickford, J., Handbook of bolts and bolted joints. CRC Press1998.
58. Taylor Forge Inc., Design of flanges for full-face gasket. Engineering
Department Bulletin, 1951.
59. Krishna, M.M., Shunmugam, M.S., and Prasad, N.S., A study on the sealing
performance of bolted flange joints with gaskets using finite element analysis.
International Journal of Pressure Vessels and Piping, 2007, 84(6): p. 349-357.

References
225
60. Schwaigerer, S., Festigkeitsberechnung von Bauelementen des Dampfkessel-
Behälter-und Rohrleitungsbaues. Springer, 1961.
61. Blach, A.E., A. Bazergui, and R. Baldur, Bolted flanged connections with full
face gaskets. Weld. Res. Counc. Bull., 1986, (314): P. 1-13.
62. Antaki, G.A., Piping and pipeline engineering: design, construction,
maintenance, integrity, and repair. CRC Press, 2003.
63. Flitney, R.K., Seals and sealing handbook. Elsevier, 2011.
64. ASME B 16.20A-2000, Metallic gaskets for pipe flanges ring-joint, spiral-
wound, and jacketed. The American Society of Mechanical Engineers, USA,
2000.
65. Zappe, R., Valve Selection Handbook: Engineering Fundamentals for
Selecting Manual Valves, Check Valves, Pressure Relief Valves, and Rupture
Discs. Gulf Professional Publishing, 1999.
66. Fthenakis, V.M., Prevention and control of accidental releases of hazardous
gases. John Wiley & Sons, 1993.
67. Bakaiyan, H., Hosseini and Ameri, E., Analysis of multi-layered filament-
wound composite pipes under combined internal pressure and
thermomechanical loading with thermal variations. Composite Structures,
2009. 88(4): p. 532-541.
68. Tarakçioğlu, N., Gemi, L., and Yapici, A., Fatigue failure behavior of
glass/epoxy ±55° filament wound pipes under internal pressure. Composites
Science and Technology, 2005, 65(3): P. 703-708.
69. Xia, M., Takayanagi, H., and Kemmochi, K., Analysis of multi-layered
filament-wound composite pipes under internal pressure. Composite
Structures, 2001. 53(4): p. 483-491.

References
226
70. Mertiny, P., Ellyin, F., and Hothan, A., An experimental investigation on the
effect of multi-angle filament winding on the strength of tubular composite
structures. Composites Science and Technology, 2004, 64(1): P. 1-9.
71. Meijer, G. and Ellyin, F., A failure envelope for ±60° filament wound glass
fibre reinforced epoxy tubulars. Composites Part A: Applied Science and
Manufacturing, 2008, 39(3): P. 555-564.
72. Onder, A., Sayman, O., Dogan, T. and Tarakcioglu, N., Burst failure load of
composite pressure vessels. Composite Structures, 2009, 89(1): P. 159-166.
73. Arikan, H., Failure analysis of (±55°)3 filament wound composite pipes with
an inclined surface crack under static internal pressure. Composite
Structures, 2010, 92(1): P. 182-187.
74. Wahab, M.A., Joining composites with adhesives. DEStech Publications, Inc,
USA, 2016.
75. Thakare, N.B. and Dhumne, A.B., A review on design and analysis of
adhesive bonded joint by finite element analysis, SSRG International Journal
of Mechanical Engineering (SSRG-IJME), 2015, P. 6.
76. Kim, J.H., Park, B.J. and Han Y.W, Evaluation of fatigue characteristics for
adhesively-bonded composite stepped lap joint. Composite Structures, 2004,
66(1): P. 69-75.
77. Matthews, F.L, Kilty, P.F. and Godwin E.W, A review of the strength of
joints in fibre-reinforced plastics. Part 2. Adhesively bonded joints.
Composites, Butterworth & Co (Publishers) Ltd, 1982, 13(1): P. 29-37.
78. Helms, J.E., Yang, C., and Pang S.-S., Stress-strain analysis of a taper-taper
adhesive-bonded joint under cylindrical bending. Journal of Engineering
Materials and Technology, 1999, 121(3): P. 374-380.

References
227
79. Erdogan, F. and Ratwani, M., Stress Distribution in Bonded Joints. Journal of
Composite Materials, 1971, 5(3): P. 378-393.
80. Hart-Smith, L., Adhesive-bonded scarf and stepped-lap joints. NASA, 1973.
81. Reddy, M.N. and Sinha, P.K., Stresses in adhesive-bonded joints for
composites. Fibre Science and Technology, 1975, 8(1): P. 33-47.
82. EDO Specialty Plastics, A comparison of two joining methods. 2001, P. 14.
83. Nemes, O., Analytical model application for adhesive cylindrical assemblies
made by hybrid materials. Materiale Plastice, 2013, 50(4): P. 314-318.
84. Cheng, J., Wu, X., Li, G. Taheri, F.and Pang, S-S., Development of a smart
composite pipe joint integrated with piezoelectric layers under tensile
loading. International Journal of Solids and Structures, 2006, 43(17): P.
5370-5385.
85. Oh, J.H., Strength prediction of tubular composite adhesive joints under
torsion. Composites Science and Technology, 2007, 67(7): P. 1340-1347.
86. Oh, J.H., Torque capacity of tubular adhesive joints with different composite
adherends. Materials Letters, 2008, 62(8): P. 1234-1237.
87. Kumar, S., Analysis of tubular adhesive joints with a functionally modulus
graded bondline subjected to axial loads. International Journal of Adhesion
and Adhesives, 2009, 29(8): P. 785-795.
88. Spaggiari, A. and Dragoni, E., Regularization of torsional stresses in tubular
lap bonded joints by means of functionally graded adhesives. International
Journal of Adhesion and Adhesives, 2014, 53: P. 23-28.
89. Bahr, B. and Sudhakaran, S., Mapping the cutting force to the hole quality
using neural networks. Artificial Neural Networks in Engineering. 1988,
ASME Press.

References
228
90. Tsao, C., Experimental study of drilling composite materials with step-core
drill. Materials & Design, 2008, 29(9): P. 1740-1744.
91. Fiddes, D.E. and Lazarou, J., Press moulded flanges for GRP pipe systems,
Composites, 1972, 3(6): P. 254-258.
92. Khashaba, U.A., Seif, M.A, and Elhamid M.A., Drilling analysis of chopped
composites. Composites Part A: Applied Science and Manufacturing, 2007,
38(1): P. 61-70.
93. Stone, R. and Krishnamurthy, K., A neural network thrust force controller to
minimize delamination during drilling of graphite-epoxy laminates.
International Journal of Machine Tools and Manufacture, 1996, 36(9): P.
985-1003.
94. Khashaba, U.A., Delamination in drilling GFR-thermoset composites.
Composite Structures, 2004, 63(3): P. 313-327.
95. Persson, E., Eriksson, I., and Zackrisson, L., Effects of hole machining
defects on strength and fatigue life of composite laminates. Composites Part
A: Applied Science and Manufacturing, 1997, 28(2): P. 141-151.
96. Durão, L.M.P., Machining of hybrid composites., University of Porto, 2005.
97. Ho-Cheng, H. and Dharan, C.K.H., Delamination during drilling in
composite laminates. Journal of Engineering for Industry, 1990, 112(3): P.
236-239.
98. Tagliaferri, V., Caprino, G., and Diterlizzi, A., Effect of drilling parameters
on the finish and mechanical properties of GFRP composites. International
Journal of Machine Tools and Manufacture, 1990, 30(1): P. 77-84.
99. Khashaba, U.A., Notched and pin bearing strengths of GFRP composite
laminates. Journal of Composite Materials, 1996, 30(18): P. 2042-2055.
References
229
100. Davim, J.P., Reis, P., and Antonio C.C., Experimental study of drilling glass
fiber reinforced plastics (GFRP) manufactured by hand lay-up. Composites
Science and Technology, 2004, 64(2): P. 289-297.
101. Abrao, A.M., Campos Rubioet, J.C., Faria, P.E. and Davim, J.P., The effect of
cutting tool geometry on thrust force and delamination when drilling glass
fibre reinforced plastic composite. Materials & Design, 2008, 29(2): P. 508-
513.
102. Taylor Forge Inc., Modern flange design. Engineering Department Bulletin,
1964.
103. Curtis, P., CRAG (Composite Research Advisory Group) Test Methods for
the Measurement of the Engineering Properties of Fibre Reinforced Plastics.
1988, DTIC Document.
104. Grove, S., Composite Materials and Structures for Engineering Students.
Kindle Direct Publishing, ISBN: 978-1-98-334480-0, 2018.
105. BS EN ISO 14125:1998 +A1:2011, Fibre-reinforced plastic composites —
Determination of flexural properties, British Standard, European Standard
and International Organization for Standardization, 2011.
106. Vosler, G., Coefficient of static friction (slide angle) of packaging and
packaging materials (including shipping sack papers, corrugated and solid
fiberboard; inclined plane method). TAPPI. 2006; Available at:
http://www.tappi.org/content/sarg/t815.pdf.
107. Strain Gauges Guide, TML Tokyo Sokki Kenkyujo co., Lte. Japan, 2017.
108. ASTM A370-03a, Standard test methods and definitions for mechanical
testing of steel products, American Society for Testing and Materials, USA,
2003.

References
230
109. Guideline Assembly Instructions, Gee Graphite Ltd. Available at:
http://www.geegraphite.com/About/Technical/TabId/251/PID/2586/evl/0/Cat
egoryID/416/CategoryName/Guideline-Assembly-Instructions/Default.aspx.
110. ASTM D575-91: 2012, Standard Test Methods for Rubber Properties in
Compression. American Society for Testing and Materials, USA, 2012.
111. BS ISO 1827: 2011, Rubber, vulcanized or thermoplastic — Determination
of shear modulus and adhesion to rigid plates — Quadruple shear methods,
British Standard and International Organization for Standardization, 2011.
112. ANSYS help, ANSYS, availalble at:
https://www.sharcnet.ca/Software/Ansys/16.2.3/en-
us/help/ans_elem/Hlp_E_SOLID185.html.
113. ANSYS help, ANSYS, Availble at:
https://www.sharcnet.ca/Software/Ansys/15.0.7/en-
us/help/ans_elem/Hlp_E_INTER195.html.
114. ANSYS User’s Manual, Contact Technology Guide. ANSYS Inc, USA, 2009.
115. ANSYS User’s Manual, ANSYS Mechanical APDL Technology
Demonstration Guide. ANSYS Inc, USA, 2013.
116. Harris, T., Implementing Fluid Pressure Penetration. The Focus, 2009, (71).
117. SzabÃ, B. and Babuška, I., Introduction to finite element analysis:
formulation, verification and validation. John Wiley & Sons, 2011, Vol. 35.
118. Aljuboury, M., Rizvi M.J., Grove, S. and Cullen, R.., A numerical
investigation of the sealing performance of a bolted GFRP flange joint with
rubber gasket, Eleventh International Conference on Composite Science and
Technology (ICCST/11), American University of Sharjah, Sharjah, UAE,
2017.

References
231
119. McNutt, M.K., Camilli, R., Crone T.J., Guthrie, G.D., Hsieh, P.A., Ryerson,
T.B., Savas, O. and Shaffer, F., Review of flow rate estimates of the
Deepwater Horizon oil spill. Proceedings of the National Academy of
Sciences, 2012, 109(50): P. 20260-20267.