the detailed characterization of electrochemically ... · pdf filethe detailed...
TRANSCRIPT

1
Electronic Supplementary Information for
The detailed characterization of electrochemically switchable
molecular assemblies on silicon electrodes
Simone Ciampi,a Michael James,
b Moinul H. Choudhury,
a Nadim Darwish,
a J. Justin
Goodinga*
aSchool of Chemistry and the Australian Centre for NanoMedicine, University of New South
Wales, Sydney 2052, Australia
bAustralian Nuclear Science and Technology Organisation (ANSTO), Locked Bag 2001,
Kirrawee DC 2232, Australia
S1. Experimental Section
S1.1 Chemicals
All chemicals, unless specified otherwise, were of analytical grade and used as received.
Chemicals used in surface modification procedures and electrochemical experiments were of
high purity (≥ 99%). Hydrogen peroxide (30 wt % sol. in water, Sigma-Aldrich), hydrofluoric
acid (Riedel-de Haën, 48 wt % sol. in water), and sulfuric acid (J. T. Baker) used in wafers
cleaning and etching procedures were of semiconductor grade. 1,8-Nonadiyne (1, Alfa Aesar,
97%) was redistilled from sodium borohydride (Sigma-Aldrich, 99+%) under reduced
pressure (80 ºC, 10−12 Torr) and stored under a high purity argon atmosphere (H2O < 10
ppb, O2 < 5 ppb) prior to use. Milli-Q™ water (> 18 MΩ cm) was used to prepare solutions
and for chemical reactions. Dichloromethane, chloroform, hexane, light petroleum (b.p.
60−80 ºC), acetone, tetrahydrofuran, 2-propanol, ethanol, methanol and ethyl acetate for
chemical reactions, surface cleaning procedures and purification procedures were redistilled
Electronic Supplementary Material (ESI) for Physical Chemistry Chemical PhysicsThis journal is © The Owner Societies 2013
2
prior to use. The drying of solvents used in chemical reactions was as follows: (a) carbon
tetrachloride was distilled from phosphorus pentoxide; (b) dichloromethane was distilled
from calcium hydride; (c) diethyl ether was distilled from sodium using a benzophenone
indicator; (d) N,N-dimethylformamide was distilled under reduced pressure from calcium
hydride; (e) 1,4-dioxane was distilled from sodium; (f) ethanol was distilled from sodium; (g)
2-propanol was distilled from sodium; (h) pyridine was distilled under reduced pressure from
potassium hydroxide; (i) tetrahydrofuran was distilled from sodium using a benzophenone
indicator; (l) toluene was distilled under reduced pressure from calcium hydride. p-
Toluensulfonyl chloride (Sigma-Aldrich, 98%) was recrystallized from chloroform/hexane.
Sodium azide (Sigma-Aldrich, 98%) was crystallized from water by the addition of ethanol.
,-Dimethylacrylic acid (Sigma-Aldrich, 97%) was recrystallized from light petroleum.
Thin-layer chromatography (TLC) was performed on Merck silica gel aluminum sheets (60
F254). Davisil®LC 60 Å silica gel (40−60m) was used for column chromatography.
S1.2 Silicon wafers
Prime grade double-side polished silicon wafers, 100-oriented (<100> ± 0.9°), p-type (boron-
doped), 500 ± 25 μm thick, 0.007–0.009 Ω cm resistivity, were obtained from Virginia
Semiconductors, Inc. (VA, USA). Prime grade double-side polished silicon wafers, 100-
oriented (<100> ± 0.05°), n-type (phosphorous-doped), 500 ± 25 μm thick, 0.0014–0.0018 Ω
cm resistivity, were obtained from Siltronix, S.A.S. (Archamps, France).
S1.3 Surface analysis
S1.3.1 XPS measurements
X-ray photoelectron spectra were obtained on an ESCALAB 220iXL spectrometer fitted with
a monochromatic Al Kα source (1486.6 eV), a hemispherical analyzer and a 6 channel
detector. Spectra of Br 3d (62–78 eV binding energy), Si 2p (93–109 eV), C 1s (279–295
eV), N 1s (392–408 eV), O 1s (525–541 eV), F 1s (677–694 eV). Fe 2p (700–735 eV), and
Electronic Supplementary Material (ESI) for Physical Chemistry Chemical PhysicsThis journal is © The Owner Societies 2013
3
Cu 2p (925–960 eV) as well as survey scans (0–1300 eV) were recorded in normal emission
(θ = 90°) with the analyzing chamber operating below 10–9
mbar. The atomic compositions
were corrected for atomic sensitivities and measured from high-resolution scans. Atomic
sensitivity factors are often instrument-sensitive and so the atomic sensitivities obtained from
the Avance software interfaced with the spectrometer were 2.840 for Br 3d, 0.817 for Si 2p,
1.000 for C 1s, 1.800 for N 1s, 2.930 for O 1s, 4.430 for F 1s, 16.420 for Fe 2p, 25.390 for
Cu 2p. The resolution of the spectrometer is ca. 0.6 eV as measured from the Ag 3d5/2 signal
(full width at half maximum, fwhm) with 20 eV pass energy. High-resolution scans were run
with 0.1 eV step size, dwell time of 100 ms and the analyzer pass energy set to 20 eV. Survey
scans were carried out over 1300−0 eV range with a 1.0 eV step size, a 100 ms dwell time
and analyzer pass energy of 100 eV. After background subtraction using the Shirley routine,
spectra were fitted with Voigt functions (a convolution of Lorentzian and Gaussian profiles)
as described previously.1, 2
Unless stated otherwise, all energies are binding energies
expressed in eV, obtained by applying to all samples a rigid shift to bring the binding energy
of the C 1s peak to a value of 285.0 eV. When detectable above noise levels, the fractional
monolayer coverage of oxidized silicon was calculated directly from the oxidized-to-bulk Si
2p peak area ratio according to the method described by Webb and co-workers for very thin
oxide overlayers.3 The spectrometer silica detection limit can be approximated to ca. 0.06
monolayers equivalents. The ratios of the integrated areas for the C 1s and N 1s emissions,
each normalized for their elemental sensitivity, scanning time (number of scans
accumulated), and for a square root dependence on the photoelectron kinetic energy, afforded
an estimate of the conversion of the acetylenyl surface (SAM-1) to the lactone-functionalized
surface (SAM-2). Analogous quantitative considerations for the Fe 2p, C 1s and N 1s signals
aided in the understanding of both the adsorbate stoichiometry at the different stages of film
growth, as well as assisting in probing the outcome of the electrochemical cleaving processes.
Electronic Supplementary Material (ESI) for Physical Chemistry Chemical PhysicsThis journal is © The Owner Societies 2013
4
S1.3.2 X-ray reflectometry
X-ray reflectivity (XRR) profiles of the self-assembled surfaces were measured under
ambient conditions on a Panalytical Ltd X’Pert Pro Reflectometer using Cu Kα X-ray
radiation (λ = 1.54056 Å). The X-ray beam was focused using a Göbel mirror and collimated
with 0.2 mm pre-sample slit and a post-sample parallel plate collimator. Reflectivity data
were collected over the angular range 0.05 θ 5.00, with a step size of 0.010 and
counting times of 10 s per step. Prior to measurements, samples were stored under argon and
exposed to air for approximately 10 min in order to be aligned on the reflectometer. From the
experimental data, structural parameters of the self-assembled structures were refined using
the MOTOFIT analysis software with reflectivity data presented as a function of the
momentum transfer vector normal to the surface Q = 4π(sinθ)/λ.4 The Levenberg-Marquardt
method was used to minimize χ2 values in the fitting routines. Single-layer or two-layer
models were used to fit the observed data.
S1.3.3 Spectroscopic ellipsometry
Ellipsometric spectra were recorded using a variable angle spectroscopic ellipsometer (M-
2000X-210, J. A. Woollam Co., Inc., USA) at three different angles of incidence (65°, 70°,
and 75° to the surface normal) over the 250–1000 nm wavelength range (4.96–1.24 eV). The
values of refractive index (n) and imaginary refractive index (k) for bare (i.e., Si–H)
phosphorous- and boron-doped reference substrates were taken before analysis. Acquired
data on the changes in light polarization at the air/monolayer/substrate interfaces were
modeled using the Cauchy approximation in the WVASE 32® software package, and were
used to extract monolayer thickness values. Measurements of at least four different points on
each surface were carried out and were found to be within 1 Å of the reported average. The
sample-to-sample reproducibility was within 2 Å.
Electronic Supplementary Material (ESI) for Physical Chemistry Chemical PhysicsThis journal is © The Owner Societies 2013

5
S1.3.4 Electrochemical characterization
Electrochemical experiments were performed in a PTFE three-electrode cell with the
modified silicon surface as the working electrode, a platinum mesh (ca. 1200 mm2) as the
counter electrode, and Ag|AgCl in 3 M NaCl as the reference electrode. All potentials are
reported versus the reference electrode. A rectilinear cross-section Viton® gasket defined the
geometric area of the working electrode to 24.6 mm2. Samples analyzed by electrochemical
methods and successively used in either XRR or ellipsometry experiments had a size of 40 ×
10 mm or 15 × 10 mm, respectively. The bulk of the back-side of the silicon sample was
exposed with emery paper and rubbed with gallium indium eutectic. A planar copper
electrode pressed to the sample backside served as an ohmic contact. The cell was enclosed in
a grounded Faraday cage during all measurements. Electrochemical experiments at potentials
more cathodic of –400 mV were conducted in degassed electrolytes (by means of bubbling
argon gas for a minimum of 20 min) under continuos flow of argon. Cyclic voltammetry
(CV) measurements were performed using a BAS 100B electrochemical analyzer
(Bioanalytical Systems, Inc., W. Lafayette, IN). Electrochemical impedance measurements
(EIS) were performed with a Solartron 1255B (Farnborough, UK) frequency response
analyzer interfaced to a Solartron 1287 potentiostat/galvanostat module. Impedance data were
collected at 60 frequencies in the frequency range of 0.01 Hz to 0.1 MHz. An ac potential
amplitude of 15 mV root mean square was added to the dc potential (Edc) of the working
electrode. EIS measurements for ferrocenyl films (SAM-5a/b) were performed in aqueous
perchlorate-based electrolytes. Both the in-phase (Z') and out-of-phase impedance (Z'') were
extracted at the same time from the data and analyzed with the ZView 3.1 and ZPlot softwares
(Scribner Associates, Inc.). The formalism developed by Laviron was used to obtain kinetic
information,5 namely the apparent electron-transfer rate constant, k
○et, for the electron-
Electronic Supplementary Material (ESI) for Physical Chemistry Chemical PhysicsThis journal is © The Owner Societies 2013

6
transfer process between tethered redox groups and the conducting substrate. All
electrochemical experiments were performed at room temperature (23 ± 2 °C) in air.
S1.4 Synthetic procedures
The synthetic procedure for the preparation of the redox-sensitive lactone linker 2 in ten steps
from commercially available 2,5-dimethylphenol has been reported elsewhere.6 Linker
molecules 3a and 3b were prepared from their immediate bromo and chloro precursors in a
one-step procedure as reported previously.7 Ethynylferrocene 4 was prepared in a two-step
procedure (Scheme S1) from commercially available acetylferrocene following literature
procedures with minor modifications (vide infra).8 Unless otherwise specified NMR spectra
were recorded on a Bruker Avance 300 spectrometer in deuteriochloroform (CDCl3 from
Aldrich, passed through basic alumina) using the solvent signal as an internal reference. FTIR
spectra were recorded on a Thermo Nicolet Avatar 370 FTIR spectrometer by accumulating a
minimum of 32 scans and selecting a resolution of 2 cm−1
.
The assembly of the redox-tagged and redox-switchable SAM-5 followed the synthetic
procedures depicted in Scheme 2 and is detailed in the following section. The dormant9
lactone linker molecule 2 was attached to acetylenyl Si(100) surfaces (SAM-1) through a
Cu(I)-catalyzed alkyne-azide cycloaddition reaction (CuAAC or “click”).10
Chemical
oxidation of the surface confined lactone moiety (SAM-2) to the corresponding
benzoquinone acid was followed by its activation with carbodiimides and N-
hydroxysuccinimide (SAM-3) to promote reactions of the exposed acid function toward
nucleophiles. 3-Azidopropylamine 3a, and 3-azidopropanol 3b were attached to the activated
construct via conventional amide coupling procedures (SAM-4a and SAM-4b, respectively).
The redox-tagged switchable construct (SAM-5a/-5b) was prepared by CuAAC reactions
between the azide-terminated surface SAM-4a/4b and ethynylferrocene 4. Surface samples at
all stages of modification were either characterized as is or electrochemically cleaved.
Electronic Supplementary Material (ESI) for Physical Chemistry Chemical PhysicsThis journal is © The Owner Societies 2013

7
S1.4.1 Synthesis of ethynylferrocene (4)
Scheme S1. Synthesis of ethynylferrocene 4
a. POCl3, NaOAc, 27%; b. dioxane, Δ,
NaOH, 81%.
(a) (2-Formyl-1-chlorovynyl)-ferrocene (B). A stirred solution of acetylferrocene A (456 mg,
2.01 mmol) in dry N,N-dimethylformamide (3.5 mL) was bubbled with argon for 20 min and
then cooled to 0 °C on an ice bath. The solution was stirred for 5 min under an argon
atmosphere while separately dry N,N-dimethylformamide (750 L) was cooled on ice and
phosphorus oxychloride (500 L) was added to it under argon with mixing. The prepared
complex was transferred dropwise with a cannula to the vigorously stirred solution of the
ferrocene A. The addition was completed in 10 min and stirring was continued at 0 °C under
argon for 2 h. Diethyl ether (7 mL) was added to the ice cold solution and the flask was fitted
with a condenser. Anhydrous sodium acetate (1.5 g, 17.6 mmol) was added in one portion to
the reaction mixture, followed by the addition of water (4 mL). The ice bath was removed
and stirring was continued at room temperature for 1 h. Diethyl ether (10 mL) was then added
to the solution before continuing the reaction for an additional 3 h at room temperature. The
crude mixture was then poured into a separatory funnel and diluted with diethyl ether (30
mL) and water (10 mL). The organic layer was separated and the aqueous phase washed with
diethyl ether (3 × 20 mL). The pooled organic phase was washed with saturated sodium
bicarbonate solution (3 × 20 mL), water (3 × 20 mL), dried over Na2SO4, filtered and dried in
vacuo to afford the crude ferrocene B as purple oil. The crude material was purified by silica
gel column chromatography (ethyl acetate/light petroleum, 1:2) to afford the title compound
B as a purple oil (146 mg, 27%) which was kept in the dark and used within 2 h as starting
Electronic Supplementary Material (ESI) for Physical Chemistry Chemical PhysicsThis journal is © The Owner Societies 2013

8
material in the successive step. 1H NMR (300 MHz, CDCl3) : 10.09 (d, 1H, J = 6.0 Hz),
6.41 (d, 1H, J = 6.0 Hz), 4.86 (s, 2H), 4.56 (s, 2H), 4.21 (s, 5H).
(b) Ethynylferrocene (4). A stirred solution of (2-formyl-1-chlorovinyl)-ferrocene B (105
mg, 0.38 mmol) in dry 1,4-dioxane (10 mL) was heated at 115 °C for 5 min under argon. A
1M sodium hydroxide solution (4 mL, 4 mmol) was added in one portion to the reaction
mixture and stirring was continued at reflux for 25 min. The solution was allowed to cool to
room temperature, poured onto ice (ca. 20 g) and then neutralized to pH ca. 7 by adding 3 M
hydrochloric acid. The crude mixture was transferred into a separatory funnel and added with
water (20 mL) and hexane (50mL). The organic phase was separated and washed with
saturated NaHCO3 solution (2 × 20 mL), water (2 × 20 mL), dried over Na2SO4, filtered and
concentrated in vacuo. The crude residue was purified using column chromatography (light
petroleum) to give the title compound as a dark orange solid (65 mg, 81%). 1H NMR (300
MHz, CDCl3) : 4.46 (t, 2H, J = 1.9 Hz), 4.21 (s, 5H), 4.19 (t, 2H, J = 1.9 Hz), 2.71 (s, 1H);
13C NMR (75.5 MHz, CDCl3) : 73.64, 71.90, 70.19, 68.86; IR (KBr, cm
−1): 3290, 3093,
2919, 2849, 2109, 1730, 1695, 1106, 1035, 1001, 915, 821.
S1.4.2 Surface modification
S1.4.2.1 Acetylene-termianted silicon(100) surface (SAM-1). Hydrosilylation of diyne 1
onto hydrogen-terminated Si(100) followed a previously reported procedure.1, 2, 11
In brief,
silicon wafers were cut into pieces (approx. 30 × 10 mm), and shards were cleaned in a 3:1
solution of concentrated sulfuric acid and 30% hydrogen peroxide for 30 min at 100 °C
(CAUTION: this is a strong oxidant and reacts violently with organic substances). After
cleaning and extensive water rinse, the silicon chips were immersed for 1.5 min in 2.5%
aqueous hydrofluoric acid solution to passivate the silicon surface. This etching condition is
known to create a mainly dihydride surface.12
Samples were subsequently transferred to a
Electronic Supplementary Material (ESI) for Physical Chemistry Chemical PhysicsThis journal is © The Owner Societies 2013

9
degassed (through a minimum of 4 freeze–pump–thaw cycles) sample of diyne 1. The
samples were kept under a stream of argon (H2O < 10 ppb, O2 < 5 ppb) while the reaction
vessel was immersed in an oil bath set to 165 °C for 3 h. The flask was then opened to the
atmosphere, and the functionalized surface samples (SAM-1) were rinsed several times with
dichloromethane and rested for a 12-h period in a sealed vial under dichloromethane at +4
°C, before being either analyzed or further reacted with the redox linker molecule 2.
S1.4.2.2 CuAAC attachment of the redox-switchable linker 2 onto the acetylenyl
surface (SAM-2). To a reaction vial containing the alkyne-functionalized silicon surface
(SAM-1) were added (i) the azide 2 (10 mM, 2-propanol/water, 2:1), (ii) copper(II) sulfate
pentahydrate (0.8 mol% relative to the azide 2) and (iii) sodium ascorbate (80 mol% relative
to the azide 2). Solvents were degassed before use. Reactions were carried out at 35 °C in the
dark under an argon atmosphere,13, 14
and stopped after 3 h by removal of the samples from
the reaction vessel.15
The prepared surface-bound [1,2,3]-triazoles (SAM-2) were rinsed
consecutively with copious amounts of water and ethanol, and then rested at room
temperature for a 1-min period in a 0.5 M hydrochloric acid solution. Samples were then
rinsed with copious amounts water and ethanol before being either analyzed or further
reacted.
S1.4.2.3 Oxidation of linker molecules to benzoquinone acids and their activation with
NHS (SAM-3). Lactone-functionalized surface samples (SAM-2) were rinsed with
tetrahydrofuran (ca. 50 mL) and then transferred to a mixture of tetrahydrofuran (6 mL) and
water (3 mL). N-Bromosuccinimide (160 mg, 90 mmol) was added to the reaction vial and
the solution agitated at room temperature in the dark for 1.5 h. The ring-opened,16
benzoquinone acid intermediate was rinsed with water and tetrahydrofuran before being
transferred to a reaction flask charged with N-(3-dimethylpropyl)-N'-ethylcarbodiimide
hydrochloride (200 mg, 1.04 mmol) and N-hydroxysuccinimide (NHS, 240 mg, 2.09 mmol ).
Electronic Supplementary Material (ESI) for Physical Chemistry Chemical PhysicsThis journal is © The Owner Societies 2013
10
Water (10 mL) was added to the flask and the uncapped vessel shaken in the dark for 3 h at
room temperature. Once removed from the reaction vessel, NHS-activated17
samples (SAM-
3) were washed with copious amounts of water and ethanol before being analyzed or further
reacted.
S1.4.2.4 Nucleophilic substitutions at NHS-activated samples (SAM-4a and SAM-4b)
Activated benzoquinone acid samples (SAM-3) were washed with N,N-dimethylformamide
(ca. 20 mL), blown dry under a stream of argon and placed into a reaction tube containing
either (i) 3-azidopropylamine 3a (0.4 M) in N,N-dimethylformamide (5 mL) and of 4-N,N-
(dimethylamino)pyridine (2.0 mg, 0.02 mmol) to give SAM-4a, or (ii) 3-azidopropanol 3b
(0.4 M) in N,N-dimethylformamide (10 mL) and 4-N,N-(dimethylamino)pyridine (2.0 mg,
0.02 mmol) to give SAM-4b. The reaction was continued at room temperature in the dark for
12 h and stopped by removing the silicon wafer from the reaction mixture. The putative
azide-termianted samples were washed with N,N-dimethylformamide, ethanol and analyzed
or further reacted.
S1.4.2.5 CuAAC attachment of ethynylferrocene 4 onto azide-terminated substrates
(SAM-5). Ethnylferrocene 4 was covalently attached to terminal azido functionalities of
SAM-4a/-4b via CuAAC reactions to yield ferrocene-tagged electrodes (SAM-5a/-5b,
respectively). To a 20 mM solution of the ferrocene 4 in 2-propanol/water (2:1) relative to the
acetylene were added (i) SAM-4a or SAM-4b samples, (ii) 0.4 mol% copper(II) sulfate
pentahydrate and (iii) 40 mol% sodium ascorbate. Solvents were degassed before use and
reactions were carried out at room temperature under an argon atmosphere and stopped after
1 h by removal of the modified sample from the reaction vessel. Modified silicon wafers were
rinsed with copious amounts of water and ethanol and then rested for 1 min in a 0.5 M
hydrochloric acid solution. Samples were then rinsed with copious amounts water and
ethanol before being either analyzed or electrochemically cleaved.
Electronic Supplementary Material (ESI) for Physical Chemistry Chemical PhysicsThis journal is © The Owner Societies 2013

11
S1.4.2.6 Electrochemical reduction of benzoquinone linkers
Cathodic bias to promote the benzoquinone reduction was applied either by means of cyclic
voltammetry (CV) or in a potentiostatic fashion by imposing reductive potentials for defined
time intervals. Kinetic data for the conversion, i.e., switch, of SAM-5 to its lactone precursor
SAM-2 were obtained combining potentiostatic and subsequent CV experiments. Switch
experiments were performed varying: a) polarization times; b) electrolyte composition and c)
substrate doping type. In general, once the circuit was open at the end of each potentiostatic
run the electrolyte chamber was emptied and back-filled with fresh electrolyte solution before
measuring changes in the observed ferrocene surface coverage, Г, by means of cyclic
voltammograms (CVs) in the 0/800 mV (p-type Si) or –100/200 mV (n-type, assisted by
supra-band gap illumination) potential window.
Electronic Supplementary Material (ESI) for Physical Chemistry Chemical PhysicsThis journal is © The Owner Societies 2013
12
S2. Passivation of the Si(100) surface with monolayers of 1,8-nonadiyne
XRR is a powerful tool for the investigation of self-assembled monolayers bound to silicon.
It allows measuring the thickness (d) of such films with atomic resolution as a result of the
fortunate high contrast in scattering length density (SLD)18
of the organic molecules in the
SAM (SLD ~1×10⁻⁵
Å–2
) compared to air (SLD = 0) and the silicon substrate (SLD =
2.01×10⁻⁵
Å–2
). The film thickness, in concert with the refined SLD, can also be used to
establish the molecular foot-prints in the monolayer. The average surface roughness () of
these monolayers can also be precisely determined using this technique. Figure 1 shows the
measured and refined XRR profiles for SAM-1. Our XRR-determined SAM-1 film thickness
of 9.6 Å is close to the 9–12 Å that was previously reported.1, 2, 19
The symmetrical nature of
diyne 1 opens no routes to alternative surface binding modes and XRR results show that
polymerization of the terminal alkyne has not occurred, and that only one terminal C≡C triple
bond of the diyne 1 has reacted with the surface. The electron density (ρel) of the organic
layer was also derived from the XRR data and was found to be ca. 0.39 e−/Å
3, consistent with
previous reports of alkane- and alkyne-based SAMs, and supports the formation of a densely
packed organic layer with very limited defects.7, 20-22
High-resolution Si 2p XPS spectra acquired on the acetylene-terminated SAM-1 are
shown in Fig. 2a. Independent of the doping type, the two refined spin–orbit-split
contributions to the Si 2p doublet for the Si(0)
oxidation state are located at 99.4 and 100.0 ±
0.2 eV.23
Spectroscopic shifts for the Si 2p region introduced by Si(1)
−Si(4)
oxides are well-
documented.24
The silicon oxide content (102–104 eV) was below the spectrometer detection
limit; data supporting the high quality of the monolayer and its ability to prevent appreciable
oxidation of the Si substrate. The high-resolution C 1s signal (Fig. 3a) was fitted with three
component peaks; the major component at 285.0 eV (85%, 1.4 eV fwhm) is assigned to the
methylene carbons of the adsorbate.25
The lower binding energy component at 283.7 eV (6%,
Electronic Supplementary Material (ESI) for Physical Chemistry Chemical PhysicsThis journal is © The Owner Societies 2013

13
1.0 eV fwhm) and the higher binding energy component at 286.4 eV (9%, 1.4 eV fwhm) are
assigned to silicon-bound olefinic carbons (silylated olefin, Si–C=C)25, 26
and to either
oxygen-bound carbon atoms (C–O),1, 27
or sp-hybridized carbon-bound carbon,
respectively.28
On hydrogenated silicon surfaces, the assembly of monolayers of 1-alkynes is
likely to result in sp2 hybridization at the surface. The growth of sp
2 structures is kinetically
more facile than that of sp3 structures (i.e., 1-alkene adsorbates),
29-31 possibly by a factor of
up to 6:1.32
This is important because in the former case the Si–C=C linkage of an alkenyl
monolayer is known to inhibit oxidation of the underlying silicon and enhance the monolayer
stability.2, 33
π-Conjugation near the surface has also been shown to facilitate charge transport
by improving electronic coupling,31
and is therefore desirable for electrochemical sensing,19,
34 bioelectronics,
35 and for electronic applications of molecular adsorbates on
semiconductors.36
XPS data does support the existence of some oxidized carbon in the film, and this is
in line with entropic considerations.37
The C 1s peak decomposition may indicate that a non-
negligible number of C–O bonds exist in monolayers of diyne 1. The structure of the
adventitious C–O bond is still highly debated, although contamination has been reported in
several studies.25, 27, 37, 38
For instance, Kramer and co-workers suggests that a shift from 285
to 286.5 eV is likely to be associated to the core ionization of monohydroxyl carbon atoms (–
Si–CHC(OH)–).38
More recently, Zuilhof and co-workers have suggested that the emission at
286.5 eV may also include emissions from –C≡C– groups.28
Signals from the deconvoluted O
1s signal (Fig. S4a) may clarify the origin of this high binding energy C 1s feature. The large
width and asymmetric shape of the O 1s emission indicates that there is more than one type
of oxygen adsorbed on the surface, and the spectra can be divided into two components with
energies of 532.0 and 533.1 eV. On the basis of electronegativity considerations the O 1s
Electronic Supplementary Material (ESI) for Physical Chemistry Chemical PhysicsThis journal is © The Owner Societies 2013

14
peak at ca. 533 eV can be attributed to the oxygen of the free alcohol, while the peak at ca.
532 eV to the oxygen of water adsorbates.39
The atomic C286.4 1s/O533 1s ratio was 1.2 ± 0.2 (95% confidence limit of the mean
calculated as tn–1 s/n1/2
where tn –1 = 2.2340
), a value which approaches very close to unity if
one takes into account differences in attenuation lengths values through hydrocarbon films
for O 1s and C 1s photoelectrons (1.3:1 ratio between λC,ML and λO,ML41
). This data leads us to
refine further the hypotheses of the origin of the C286.4 1s signal. That is, without entirely
ruling out the possibility of –C≡C– emissions contributing to the 286.5 eV envelope,28
however, our data would more strongly support the model of Kramer and co-workers,38
where the hydrosilylation of 1-alkynes occurs with partial oxidation of the proximal silylated
olefin function.
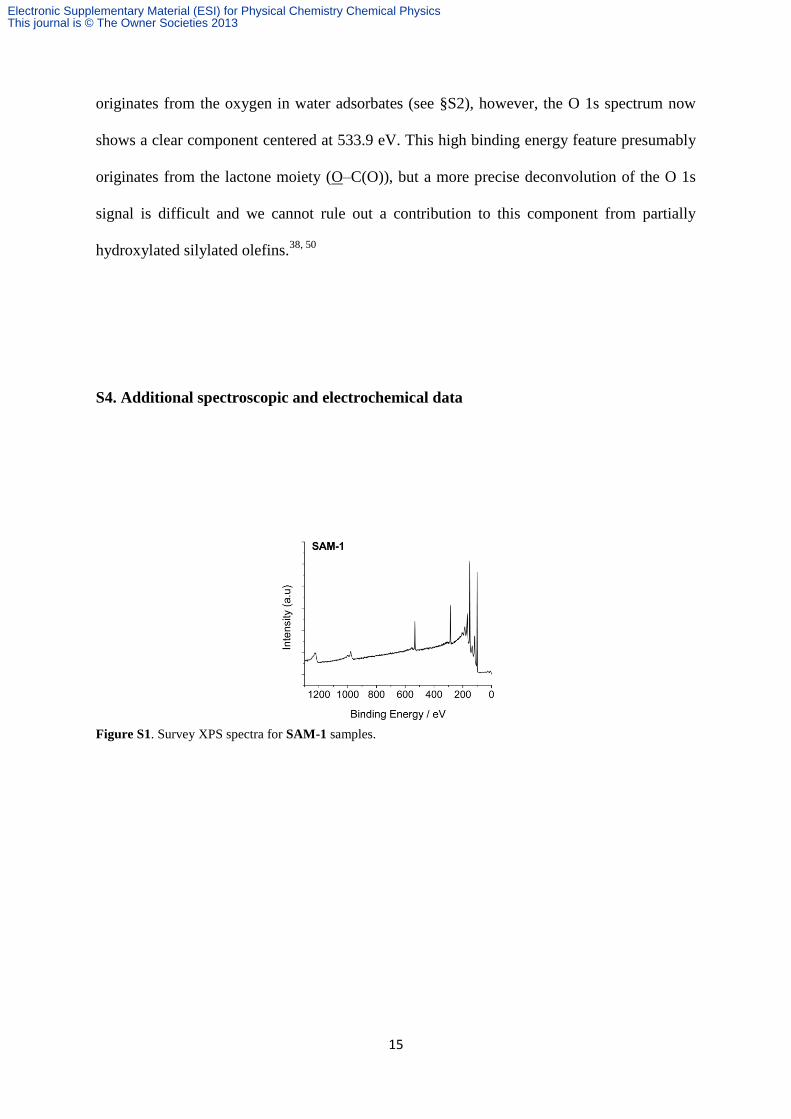
It needs to be noted that the intensity ratio between the low- and high-binding energy O 1s
contributions varied greatly between samples, ranging from ca. 1.8 to ca. 4.3 (Fig. S4a).
These measurements indicate that despite the rinsing of the samples with low dielectric
solvents (i.e., dichloromethane) and despite the low pressure in the XPS analysis chamber,
minor amounts of physisorbed water are not easily removed even from relatively
hydrophobic films.42-44
S3. ‘Click’ Attachment of the Redox-sensitive Linker Molecule 2 (SAM-2)
The XPS C 1s signal for SAM-2 samples was deconvoluted with fitting to four functions: i)
carbon in a carbide configuration (Si–C) at 283.7 eV), ii) a main contribution centred at 285
eV ascribed to aliphatic and aromatic carbon-bonded carbon (C−C)25, 45
; iii) a signal at 286.4
eV corresponding to nitrogen-, oxygen-, and carbonyl-bonded carbon (C−N,1 C−O,
46 and
C(O)C)47
), data which further supports the formation of SAM-2; and iv) a high-binding
energy signal at 289.3 eV assigned to the electron-deficient carbon atom in the lactone
carbonyl group (O−C=O).48, 49
In Fig. S4b, the main contribution of O 1s (ca. 532 eV) still
Electronic Supplementary Material (ESI) for Physical Chemistry Chemical PhysicsThis journal is © The Owner Societies 2013
15
originates from the oxygen in water adsorbates (see §S2), however, the O 1s spectrum now
shows a clear component centered at 533.9 eV. This high binding energy feature presumably
originates from the lactone moiety (O–C(O)), but a more precise deconvolution of the O 1s
signal is difficult and we cannot rule out a contribution to this component from partially
hydroxylated silylated olefins.38, 50
S4. Additional spectroscopic and electrochemical data
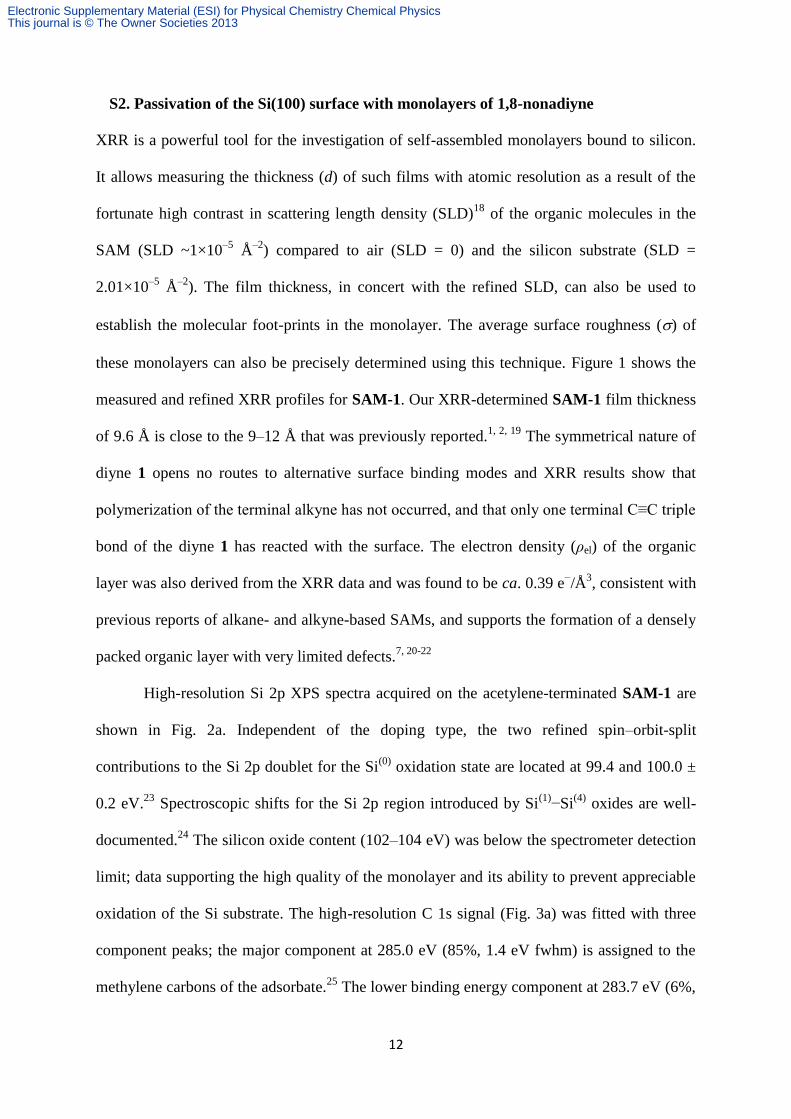
Figure S1. Survey XPS spectra for SAM-1 samples.
Electronic Supplementary Material (ESI) for Physical Chemistry Chemical PhysicsThis journal is © The Owner Societies 2013

16
Figure S2. Experimental Ψ (●) and (○) data and best-fit models (─) for spectroscopic ellipsometry
measurements of the surfaces in Scheme 2 (see main text). The incidence angles were 65, 70 and 75○ (graphs
from top toward bottom). Ellipsometry determines the complex reflectance ratio = rs / rp = tan Ψ exp(i),
where rP and rS are the Fresnel reflection coefficients for light polarized parallel and perpendicular to the plane
of incidence, respectively. The angle Ψ is the ratio of the changes in amplitude for the s and p polarizations after
reflection. The angle relates to the difference in the phase shift after reflection for the two polarizations.
Electronic Supplementary Material (ESI) for Physical Chemistry Chemical PhysicsThis journal is © The Owner Societies 2013
17
Figure S3. Survey XPS spectra for SAM-2 samples.
Figure S4. O 1s narrow scans for SAM-1 (a), and SAM-2 (b) samples.
Electronic Supplementary Material (ESI) for Physical Chemistry Chemical PhysicsThis journal is © The Owner Societies 2013

18
Figure S5. Survey XPS spectra for SAM-5a samples.
Figure S6. Representative cyclic voltammograms ( = 500 mV s−1
) for SAM-5a samples before (black solid
line) and upon (red dashed line) prolonged cyclic voltammetry analysis (100 cycles) in 1.0 M HClO4
electrolytes. The measured ferrocene coverage, , decreased to 1.63 × 10⁻¹⁰
mol cm–2
from 1.72 × 10⁻¹⁰
mol cm–
2 and fwhm was unaltered at 152 mV.
Electronic Supplementary Material (ESI) for Physical Chemistry Chemical PhysicsThis journal is © The Owner Societies 2013
19
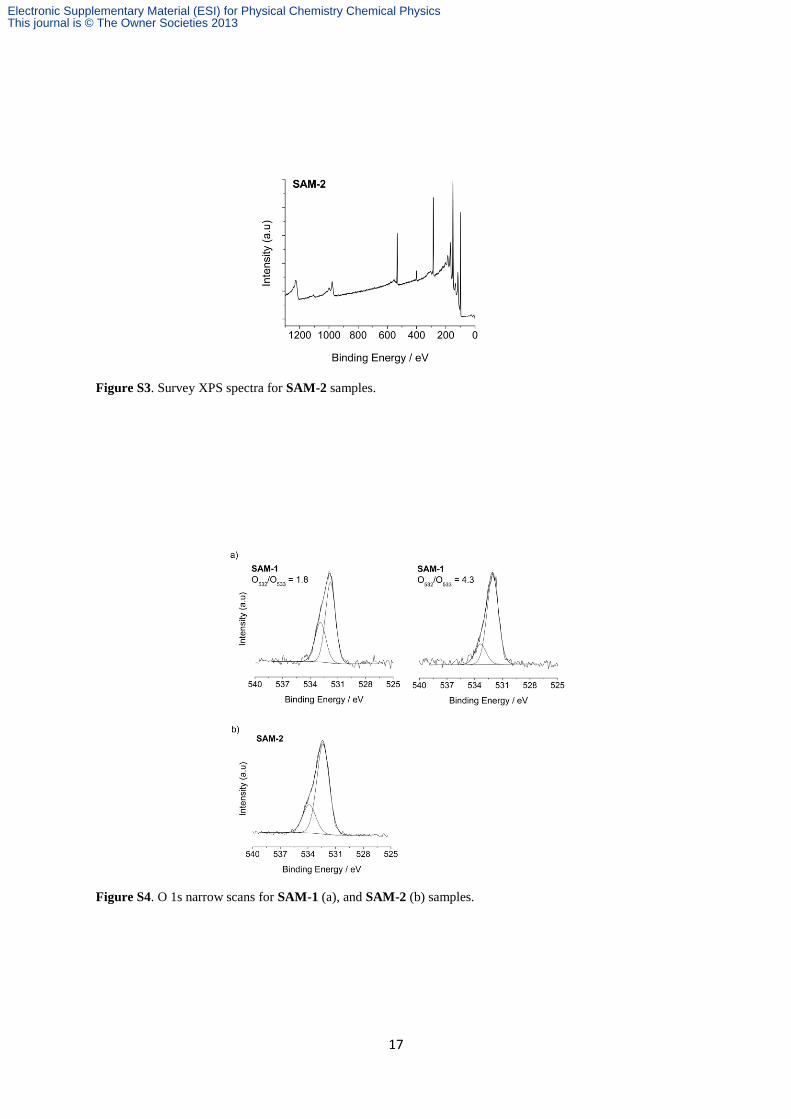
Figure S7. Linear dependence of the anodic peak current on the scan rate () for ethynylferrocene 4-
functionalized Si(100) electrodes (SAM-5a).
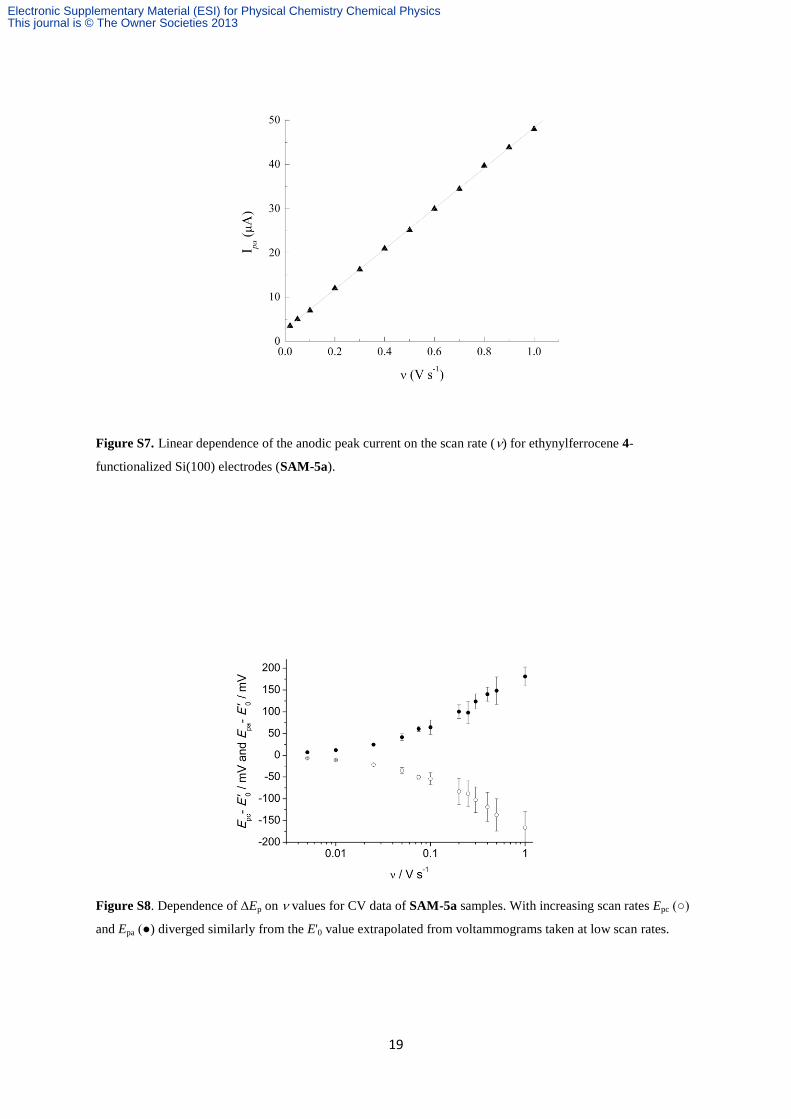
Figure S8. Dependence of Ep on values for CV data of SAM-5a samples. With increasing scan rates Epc (○)
and Epa (●) diverged similarly from the E'0 value extrapolated from voltammograms taken at low scan rates.
Electronic Supplementary Material (ESI) for Physical Chemistry Chemical PhysicsThis journal is © The Owner Societies 2013

20
Figure S9. Cyclic voltammogram in 0.1 M NaClO4 (pH 7) of ethynylferrocene 4-modified electrodes (SAM-5b)
prepared from the ester construct SAM-4b. Scan rate was 0.1 V s‒1
. For voltammograms at low scan rates, large
dispersion values (184 mV fwhm) and Ep greater than 200 mV were observed for SAM-5b. This far from ideal
redox behaviour was interpreted as a poorly defined electrode surface, where lack of rigidity combined with very
low values might have lead to ferrocenyl groups being allowed to interact strongly with the surrounding alkane-
like environment and thus accounting for a reduced ion-pairing capability. It is not yet clear, however, if the
reported low values were solely due to poor yields for the nucleophilic substitution reaction at the carbonyl
(C=O) of the activated construct SAM-3 with the alcohol 3-azidopropanol 3b. Nevertheless, this suggestion would
agree with the notion of increased nucleophilicity of primary amines relative to primary alcohols, and explain
greater yields, leading to ca. 20-fold larger values, observed for the analogous substitution reaction when 3-
azidopropylamine 3a is reacted in place of alcohol 3b with SAM-3.
Electronic Supplementary Material (ESI) for Physical Chemistry Chemical PhysicsThis journal is © The Owner Societies 2013
21
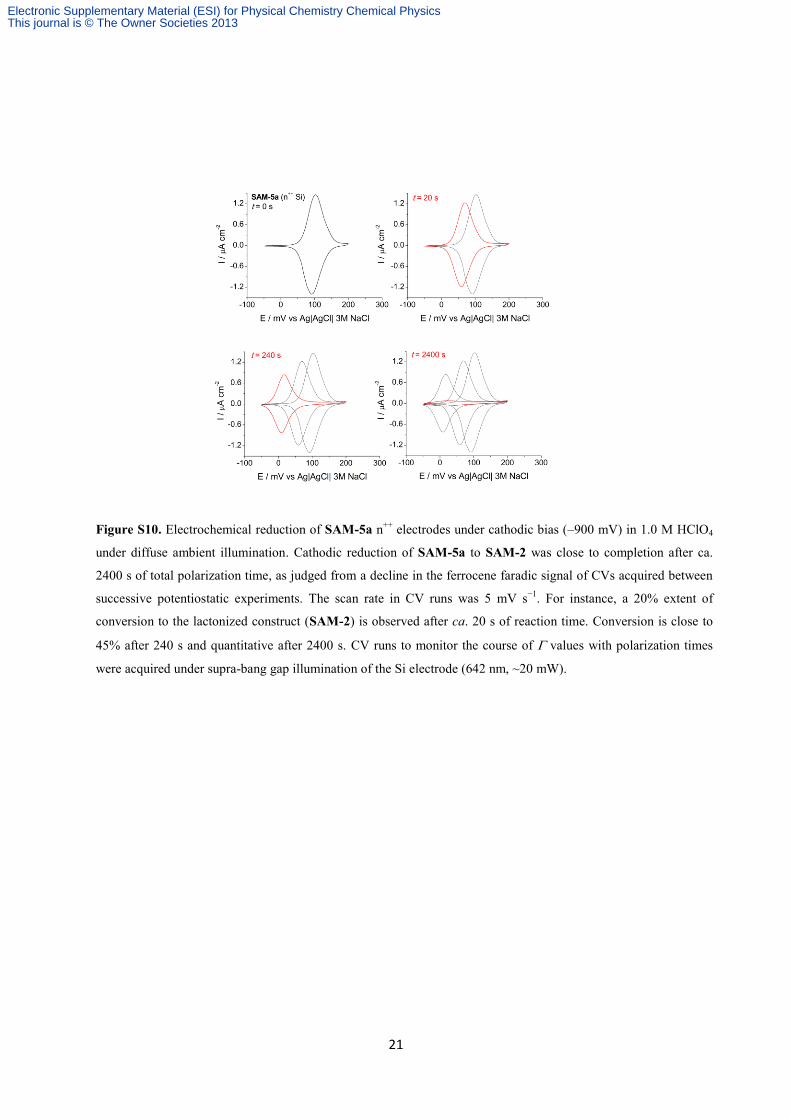
Figure S10. Electrochemical reduction of SAM-5a n++
electrodes under cathodic bias (–900 mV) in 1.0 M HClO4
under diffuse ambient illumination. Cathodic reduction of SAM-5a to SAM-2 was close to completion after ca.
2400 s of total polarization time, as judged from a decline in the ferrocene faradic signal of CVs acquired between
successive potentiostatic experiments. The scan rate in CV runs was 5 mV s−1
. For instance, a 20% extent of
conversion to the lactonized construct (SAM-2) is observed after ca. 20 s of reaction time. Conversion is close to
45% after 240 s and quantitative after 2400 s. CV runs to monitor the course of values with polarization times
were acquired under supra-bang gap illumination of the Si electrode (642 nm, ~20 mW).
Electronic Supplementary Material (ESI) for Physical Chemistry Chemical PhysicsThis journal is © The Owner Societies 2013
22
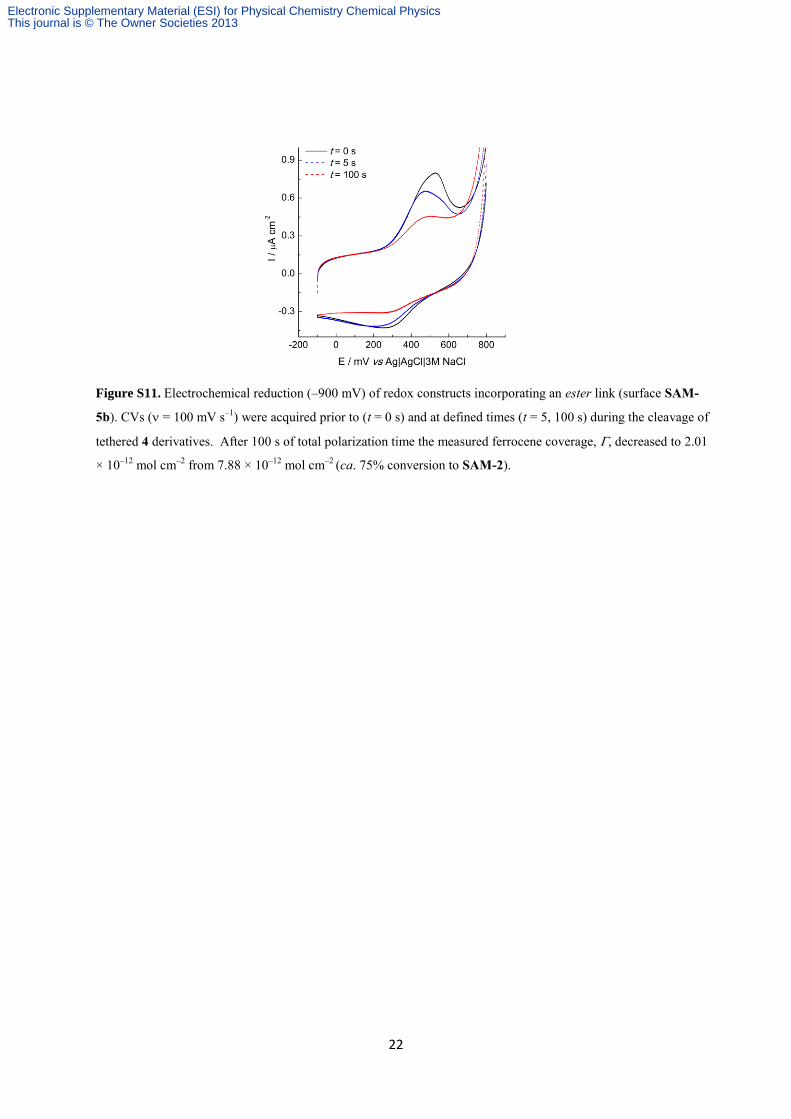
Figure S11. Electrochemical reduction (–900 mV) of redox constructs incorporating an ester link (surface SAM-
5b). CVs ( = 100 mV s–1
) were acquired prior to (t = 0 s) and at defined times (t = 5, 100 s) during the cleavage of
tethered 4 derivatives. After 100 s of total polarization time the measured ferrocene coverage, , decreased to 2.01
× 10–12
mol cm–2
from 7.88 × 10⁻¹²
mol cm–2
(ca. 75% conversion to SAM-2).
Electronic Supplementary Material (ESI) for Physical Chemistry Chemical PhysicsThis journal is © The Owner Societies 2013
23
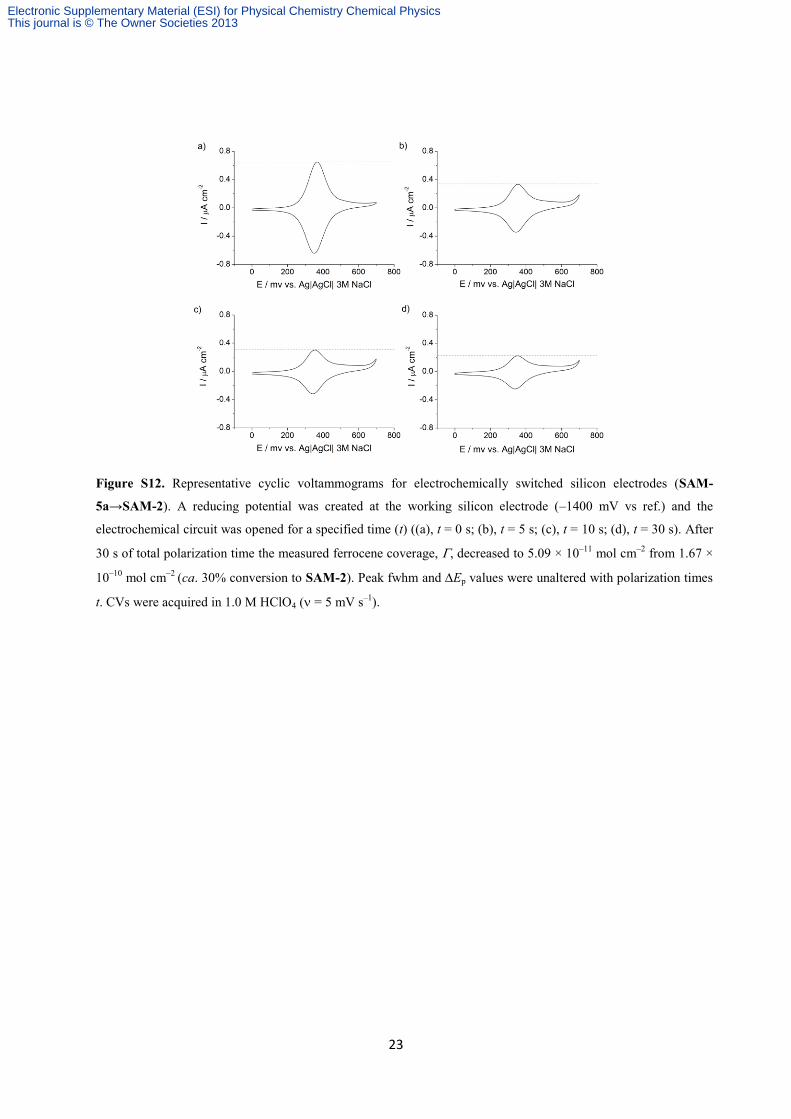
Figure S12. Representative cyclic voltammograms for electrochemically switched silicon electrodes (SAM-
5a→SAM-2). A reducing potential was created at the working silicon electrode (–1400 mV vs ref.) and the
electrochemical circuit was opened for a specified time (t) ((a), t = 0 s; (b), t = 5 s; (c), t = 10 s; (d), t = 30 s). After
30 s of total polarization time the measured ferrocene coverage, , decreased to 5.09 × 10⁻¹¹
mol cm–2
from 1.67 ×
10–10
mol cm–2
(ca. 30% conversion to SAM-2). Peak fwhm and Ep values were unaltered with polarization times
t. CVs were acquired in 1.0 M HClO4 ( = 5 mV s–1
).
Electronic Supplementary Material (ESI) for Physical Chemistry Chemical PhysicsThis journal is © The Owner Societies 2013

24
Note to Figure S13. Quinone derivatives have pH-dependent redox behavior,51
and therefore the electrolyte pH
was expected to have a tangible effect on the electrochemically-driven release of ferrocene 4 derivatives, with a
slower switch expected at higher pH values. As a proof-of-principle such an effect was investigated for SAM-5a
by performing the electrochemical sequence of above in perchlorate-containing solutions buffered at pH 7. As
judged by means of voltammetric analysis (Fig. S13) it was not possible to observe differences between
reactions performed in perchloric acid or in sodium perchlorate (pH 7) electrolytes. Interestingly, a ca. 50 mV
increase in the E'0 value is observed in acidic HClO4 electrolyte compared to pH 7 NaClO4. As the chemical
composition of the film was unaltered, the shifts for E'0 toward more positive values indicate a reduction process
becoming energetically more favorable. It is proposed that the observed positive shifts in the apparent formal
potential values could be attributed to either one or a combination of the following i) in an acidic media the
Figure S13. Electrochemical reduction of SAM-5a electrodes under cathodic bias (–1800 mV vs ref.) in 1.0 M
NaClO4 (pH 7). Cathodic reduction of SAM-5a to SAM-2 was close to completion after ca. 10 s of total
polarization time, as judged from a decline in the ferrocene faradic signal of CVs acquired between successive
potentiostatic experiments. Experiments were performed under diffuse ambient illumination. After 10 s of total
polarization time the measured ferrocene coverage, , decreased to 1.17 × 10⁻¹¹
mol cm–2
(t = 10 s) from 8.59 × 10–
11 mol cm
–2 (t = 0 s). Peak fwhm and peak positions were unchangenged with with polarization time (E
’0 = 306 mV,
Efwhm = 320 mV). CVs were acquired at = 5 mV s–1
.
Electronic Supplementary Material (ESI) for Physical Chemistry Chemical PhysicsThis journal is © The Owner Societies 2013

25
positively charged ferricenium form of the redox couple is progressively destabilized relatively to the uncharged
ferrocene counterpart, and ii) favored conjugation of the ferrocenyl groups in the oxidized form with
neighboring [1,2,3]-triazole rings. The former would call for molecules in the film bearing a net positive charge
at low pH values, thus repelling terminal oxidized ferricenium units.
Figure S14. XPS analysis for switched electrodes (SAM-5a→SAM-2). (a) Survey scan, (b) Fe 2p region, (c) Si 2p
with approx. 0.2 SiOx fractional monolayer equivalents, and (d) C 1s with refined Si–C (283.7 eV), C−C (285 eV),
C−N C−O, and C(O)C (287.4 eV) and O−C=O (289.4 eV) features.
Electronic Supplementary Material (ESI) for Physical Chemistry Chemical PhysicsThis journal is © The Owner Societies 2013

26
Figure S15. Representative cyclic voltammograms (CVs) for the electrochemical switch and subseequent electrode
regeneration. The top panel shows CVs ( = 20 mV s–1
, 1.0 M HClO4) for as prepared SAM-5a electrodes ( =
1.71 × 10⁻¹⁰
mol cm–2-
, first generation) and after ( =1.09 × 10⁻¹¹
mol cm–2
) the electrochemical cleavage
sequence of Scheme 1. Electrodes regenerated by chemical means (Scheme 2) up to two times (3rd
generation
electrodes) displayed redox performances with only marginal deviations from their precursors (bottom panel; first
generation = 1.71 × 10⁻¹⁰
mol cm–2
, second generation = 1.63 × 10⁻¹⁰
mol cm–2third generation = 1.48 × 10
–10 mol cm
–2, k
0et
(from CV methods) and E'0 values were 0.7 s
‒1/361 mV, 0.9 s
‒1/370 mV and 0.4 s
‒1/368 mV for first, second and
third generation electrodes, respectively).
Electronic Supplementary Material (ESI) for Physical Chemistry Chemical PhysicsThis journal is © The Owner Societies 2013

27
Figure S16. Survey (a) and high-resolution C 1s, N 1s and Fe 2p XPS (b–d) scans for regenerated, third generation,
ferrocene-terminated SAM-5a surfaces. Panel (e) shows Si 2p narrow scans for second generation (lower spectra) and
third generation (upper spectra) electrodes with fractional silicon oxide coverage estimated to ca. 0.1 and ca. 0.3
monolayers, respectively.
Electronic Supplementary Material (ESI) for Physical Chemistry Chemical PhysicsThis journal is © The Owner Societies 2013
28
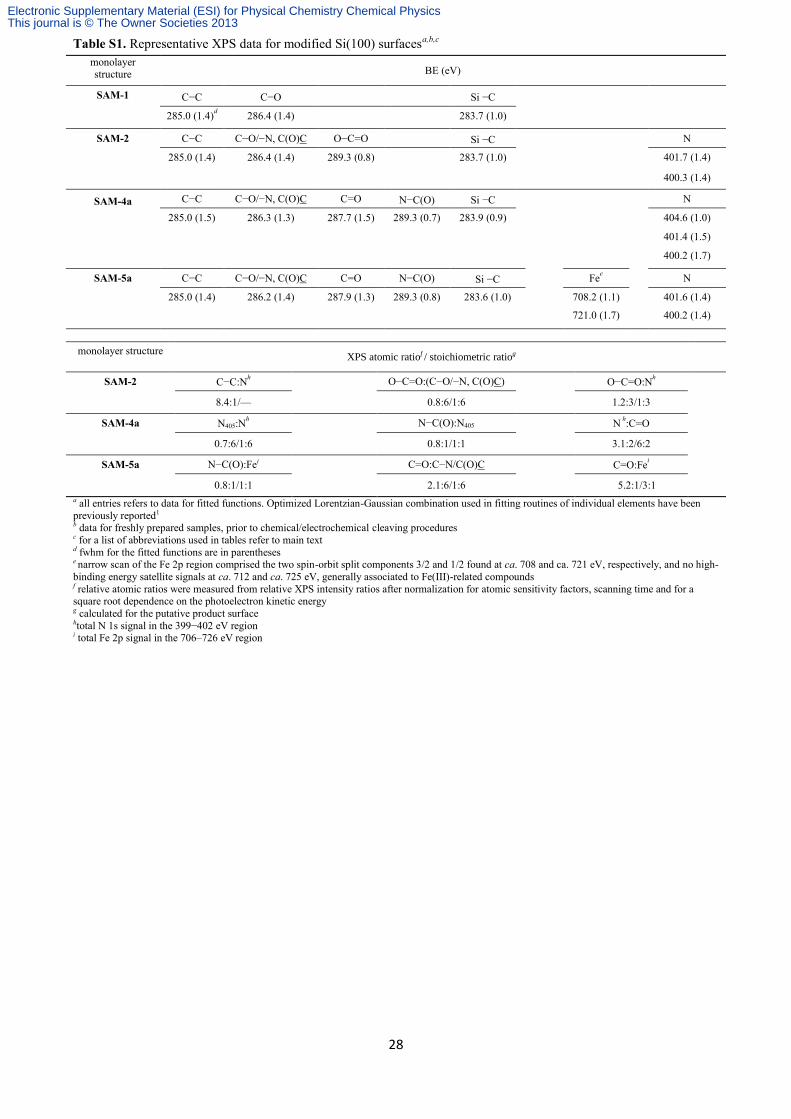
Table S1. Representative XPS data for modified Si(100) surfacesa,b,c
monolayer structure
BE (eV)
SAM-1
C−C C−O Si −C
285.0 (1.4)d 286.4 (1.4) 283.7 (1.0)
SAM-2
C−C C−O/−N, C(O)C O−C=O Si −C N
285.0 (1.4) 286.4 (1.4) 289.3 (0.8) 283.7 (1.0) 401.7 (1.4)
400.3 (1.4)
SAM-4a
C−C C−O/−N, C(O)C C=O N−C(O) Si −C N
285.0 (1.5) 286.3 (1.3) 287.7 (1.5) 289.3 (0.7) 283.9 (0.9) 404.6 (1.0)
401.4 (1.5)
400.2 (1.7)
SAM-5a
C−C C−O/−N, C(O)C C=O N−C(O) Si −C Fee N
285.0 (1.4) 286.2 (1.4) 287.9 (1.3) 289.3 (0.8) 283.6 (1.0) 708.2 (1.1) 401.6 (1.4)
721.0 (1.7) 400.2 (1.4)
monolayer structure XPS atomic ratiof / stoichiometric ratiog
SAM-2
C−C:Nh O−C=O:(C−O/−N, C(O)C)
O−C=O:N
h
8.4:1/— 0.8:6/1:6
1.2:3/1:3
SAM-4a
N405:Nh N−C(O):N405
N
h:C=O
0.7:6/1:6 0.8:1/1:1
3.1:2/6:2
SAM-5a
N−C(O):Fei C=O:C−N/C(O)C
C=O:Fei
0.8:1/1:1 2.1:6/1:6
5.2:1/3:1
a all entries refers to data for fitted functions. Optimized Lorentzian-Gaussian combination used in fitting routines of individual elements have been
previously reported1 b data for freshly prepared samples, prior to chemical/electrochemical cleaving procedures c for a list of abbreviations used in tables refer to main text d fwhm for the fitted functions are in parentheses e narrow scan of the Fe 2p region comprised the two spin-orbit split components 3/2 and 1/2 found at ca. 708 and ca. 721 eV, respectively, and no high-
binding energy satellite signals at ca. 712 and ca. 725 eV, generally associated to Fe(III)-related compounds f relative atomic ratios were measured from relative XPS intensity ratios after normalization for atomic sensitivity factors, scanning time and for a square root dependence on the photoelectron kinetic energy g calculated for the putative product surface htotal N 1s signal in the 399−402 eV region i total Fe 2p signal in the 706–726 eV region
Electronic Supplementary Material (ESI) for Physical Chemistry Chemical PhysicsThis journal is © The Owner Societies 2013

29
References
1. S. Ciampi, T. Böcking, K. A. Kilian, M. James, J. B. Harper and J. J. Gooding, Langmuir, 2007, 23,
9320-9329.
2. S. Ciampi, P. K. Eggers, G. Le Saux, M. James, J. B. Harper and J. J. Gooding, Langmuir, 2009, 25,
2530-2539.
3. L. J. Webb and N. S. Lewis, J. Phys. Chem. B, 2003, 107, 5404-5412.
4. A. Nelson, J. Appl. Crystallogr. , 2006, 39, 273-276.
5. E. Laviron, J. Electroanal. Chem. , 1979, 97, 135-149.
6. S. Ciampi, M. James, G. Le Saux, K. Gaus and J. Justin Gooding, J. Am. Chem. Soc., 2012, 134, 844-
847.
7. M. James, S. Ciampi, T. A. Darwish, T. L. Hanley, S. O. Sylvester and J. J. Gooding, Langmuir, 2011,
27, 10753-10762.
8. M. Rosenblum, N. Brawn, J. Papenmeier and M. Applebaum, J. Organomet. Chem., 1966, 6, 173-180.
9. Chemical oxidation of the confined lactone 2 leads to the exposure of a carboxylic acid functionality
amenable to further derivatization.
10. M. Meldal and C. W. Tornøe, Chem. Rev., 2008, 108, 2952-3015.
11. S. Ciampi, G. Le Saux, J. B. Harper and J. J. Gooding, Electroanalysis, 2008, 20, 1513-1519.
12. Y. J. Chabal, G. S. Higashi, K. Raghavachari and V. A. Burrows, J. Vac. Sci. Technol. A, 1989, 7,
2104-2109.
13. G. Qin, C. Santos, W. Zhang, Y. Li, A. Kumar, U. J. Erasquin, K. Liu, P. Muradov, B. W. Trautner and
C. Cai, J. Am. Chem. Soc., 2010, 132, 16432–16441.
14. A. Kumar, K. Li and C. Cai, Chem. Commun., 2011, 47, 3186-3188.
15. The unreacted lactone 2 used in surface modification procedures was routinely recovered and purified
via column chromatography (ethyl acetate/light petroleum, 1:2).
16. A. Zheng, D. Shan and B. Wang, J. Org. Chem. , 1999, 64, 156-161.
17. V. G. Janolino and H. E. Swaisgood, Biotechnol. Bioeng., 1982, 24, 1069-1080.
18. SLD for X-rays is obtained by multiplying the electron density (e-/Å3) of the material by the factor
2.82 × 10⁻⁵ Å.
19. F. Shamsi, H. Coster and K. A. Jolliffe, Surf. Sci., 2011, 605, 1763-1770.
20. M. R. Linford, P. Fenter, P. M. Eisenberger and C. E. D. Chidsey, J. Am. Chem. Soc., 1995, 117, 3145-
3155.
21. T. Böcking, M. James, H. G. L. Coster, T. C. Chilcott and K. D. Barrow, Langmuir, 2004, 20, 9227-
9235.
22. H. Jin, C. R. Kinser, P. A. Bertin, D. E. Kramer, J. A. Libera, M. C. Hersam, S. T. Nguyen and M. J.
Bedzyk, Langmuir, 2004, 20, 6252-6258.
23. For the case of non-degenerated silicon, the position of the low-binding energy Si 2p contribution (Si
2p3/2) could be used to obtain information on the effect the monolayer formation has on band bending
(S. p. Cordier, B. Fabre, Y. Molard, A.-B. Fadjie-Djomkam, N. Tournerie, A. Ledneva, N. G. Naumov,
A. Moreac, P. Turban, S. Tricot, S. Ababou-Girard and C. Godet, J. Phys. Chem. C, 2010, 114, 18622-
18633) and/or to probe any masking of these effects by surface states (i.e. Fermi level pinning).
24. F. J. Himpsel, F. R. McFeely, A. Taleb-Ibrahimi, J. A. Yarmoff and G. Hollinger, Phys. Rev. B, 1988,
38, 6084-6096.
25. X. Wallart, C. H. de Villeneuve and P. Allongue, J. Am. Chem. Soc. , 2005, 127, 7871-7878.
26. H. Liu and R. J. Hamers, Surf. Sci., 1998, 416, 354-362.
27. L. Scheres, A. Arafat and H. Zuilhof, Langmuir, 2007, 23, 8343-8346.
28. B. Rijksen, S. P. Pujari, L. Scheres, C. J. M. van Rijn, J. E. Baio, T. Weidner and H. Zuilhof,
Langmuir, 2012, 28, 6577-6588.
29. A. Ng, S. Ciampi, M. James, J. B. Harper and J. J. Gooding, Langmuir, 2009, 25, 13934-13941.
30. J.-H. Lee, J.-H. Choi and J.-H. Cho, J. Phys. Chem. C, 2011, 115, 14942-14946.
31. M. A. Walsh, S. R. Walter, K. H. Bevan, F. M. Geiger and M. C. Hersam, J. Am. Chem. Soc., 2010,
132, 3013-3019.
32. B. Rijksen, B. van Lagen and H. Zuilhof, J. Am. Chem. Soc., 2011, 133, 4998-5008.
33. S. R. Puniredd, O. Assad and H. Haick, J. Am. Chem. Soc., 2008, 130, 13727-13734.
34. S. Ciampi, M. James, P. Michaels and J. J. Gooding, Langmuir, 2011, 27, 6940-6949.
35. S. Ciampi and J. J. Gooding, Chem. Eur. J., 2010, 16, 5961-5968.
36. Y. Li, S. Calder, O. Yaffe, D. Cahen, H. Haick, L. Kronik and H. Zuilhof, Langmuir, 2012, 28, 9920-
9929.
37. G. F. Cerofolini, C. Galati, S. Reina and L. Renna, Surf. Interface Anal., 2006, 38, 126-138.
38. M. Kondo, T. E. Mates, D. A. Fischer, F. Wudl and E. J. Kramer, Langmuir, 2010, 26, 17000-17012.
Electronic Supplementary Material (ESI) for Physical Chemistry Chemical PhysicsThis journal is © The Owner Societies 2013
30
39. Y. L. Zhong and S. L. Bernasek, Langmuir, 2011, 27, 1796-1802.
40. J. N. Miller and J. C. Miller, Statistics and Chemometrics for Analytical Chemistry, Prentice Hall,
2000.
41. C. D. Bain and G. M. Whitesides, J. Phys. Chem., 1989, 93, 1670-1673.
42. J. E. Baio, T. Weidner, J. Brison, D. J. Graham, L. J. Gamble and D. G. Castner, J. Electron Spectrosc.
Relat. Phenom., 2009, 172, 2-8.
43. M. James, T. A. Darwish, S. Ciampi, S. O. Sylvester, Z. Zhang, A. Ng, J. J. Gooding and T. L. Hanley,
Soft Matter, 2011, 7, 5309-5318.
44. N. Clément, D. Guérin, S. Pleutin, S. Godey and D. Vuillaume, J. Phys. Chem. C, 2012, 116, 17753-
17763.
45. A. Lehner, G. Steinhoff, M. S. Brandt, M. Eickhoff and M. Stutzmann, J. Appl. Phys., 2003, 94, 2289-
2294.
46. M. Yang, D. Wouters, M. Giesbers, U. S. Schubert and H. Zuilhof, ACS Nano, 2009, 3, 2887-2900.
47. Y. L. Zhong and S. L. Bernasek, J. Am. Chem. Soc., 2011, 133, 8118-8121.
48. T. Strother, W. Cai, X. Zhao, R. J. Hamers and L. M. Smith, J. Am. Chem. Soc., 2000, 122, 1205-1209.
49. D. Briggs and M. P. Seah, Practical Surface Analysis by Auger and X-ray Photoelectron Spectroscopy,
Wiley, Chichester, U.K., 1983.
50. G. P. López, D. G. Castner and B. D. Ratner, Surf. Interface Anal., 1991, 17, 267-272.
51. Y. Sato, M. Fujita, F. Mizutani and K. Uosaki, J. Electroanal. Chem. , 1996, 409, 145-154.
Electronic Supplementary Material (ESI) for Physical Chemistry Chemical PhysicsThis journal is © The Owner Societies 2013