the determinants of satisfaction of tourist attractions' visitors
TRANSCRIPT

0
TTHHEE DDEETTEERRMMIINNAANNTTSS OOFF SSAATTIISSFFAACCTTIIOONN
OOFF TTOOUURRIISSTT AATTTTRRAACCTTIIOONNSS’’ VVIISSIITTOORRSS
MMaarreekk NNoowwaacckkii

1
TTHHEE DDEETTEERRMMIINNAANNTTSS OOFF SSAATTIISSFFAACCTTIIOONN
OOFF TTOOUURRIISSTT AATTTTRRAACCTTIIOONNSS’’ VVIISSIITTOORRSS
Marek Nowacki, PhD
POZNAŃ 2013
2
Reviewers : Prof. dr hab. Andrzej Rapacz
Prof. ing. Mária Rostášová, PhD
Prof. ing. Marian Gúčik, PhD
Translation: Robert Gulewicz
Cover design
and photos: Marek Nowacki
ISBN: 978–83–937379–0–1
Published by
ACTIVE, Zdzisławy 11a, 61-054 Poznań
www.active.poznan.pl; e-mail: [email protected]
© ACTIVE, Poznań 2013

3
To Aga, Miki and Jola

4
CONTENTES
ABSTRACT ..............................................................................................................................7
PREFACE .................................................................................................................................8
CHAPTER 1: TOURIST ATTRACTIONS AND VISITORS’ SATISAFACTION IN THE LIGHT OF
THEORETICAL CONCEPTS AND STUDY RESULTS ...................................................................11
1.1. The notion of tourist attractions ........................................................................... 11
1.2. Review of studies on visitor attractions ................................................................. 12
1.3. Tourist attraction typologies ................................................................................. 14
1.4. Tourist attraction models ...................................................................................... 16
1.5. Visitor satisfaction, its indicators and determinants .............................................. 18
1.5.1 The notion of satisfaction ................................................................................ 18
1.5.2. Indicators of visitor satisfaction ...................................................................... 19
1.5.2.1. Experiences ............................................................................................. 19
1.5.2.2. Behavioural intentions towards attractions ............................................. 22
1.5.3. Determinants of visitor satisfaction ................................................................ 26
1.5.3.1. Attraction features .................................................................................. 26
1.5.3.2. Visitors features ...................................................................................... 31
1.6. Models of satisfaction determinants in tourist attractions .................................... 32
CHAPTER 2: ANALYSIS OF VISITOR SATISFACTION DETERMINANTS ....................................37
2.1. Research problem and questions .......................................................................... 37
2.2. Research hypotheses ............................................................................................ 37
2.3. Methodology ........................................................................................................ 42
2.3.1. Variables operationalization and questionnaire development ........................ 42
2.3.2. Procedure and study sample .......................................................................... 43
2.3.3. Methods of data analysis ................................................................................ 44
2.3.4. Description of the studied attractions ............................................................ 46

5
2.3.4.1. Archaeological Festival in Biskupin .......................................................... 46
2.3.4.2. National Museum of Agriculture and Food Processing Industry in
Szreniawa ............................................................................................................. 48
2.3.4.3. New Zoo in Poznań .................................................................................. 49
2.3.4.4. Ethnographic Park of Wielkopolska in Dziekanowice ............................... 50
2.3.5. Characteristics of the studied sample ............................................................. 51
2.4. Results .................................................................................................................. 55
2.4.1. Knowledge gained from the visit .................................................................... 55
2.4.2. The quality of experiences as an indicator of satisfaction ............................... 58
2.4.3. Behavioural intentions ................................................................................... 60
3.4.3.1. Word of mouth ........................................................................................ 60
3.4.3.2. Revisit intentions ..................................................................................... 62
3.4.3.3. Willingness to pay.................................................................................... 62
2.4.4. Analysis of subject-related determinants of satisfaction ................................. 63
2.4.4.1. Socio-demographic features .................................................................... 63
2.4.4.2. Other visitor features .............................................................................. 68
2.4.4.3. Motivations ............................................................................................. 73
2.4.4.4. Benefits ................................................................................................... 74
2.4.4.5. Knowledge ............................................................................................... 75
2.4.4.6. Willingness to pay.................................................................................... 77
2.4.5. Analysis of object-related determinants of satisfaction .................................. 77
2.4.5.1. Exhibitions, demonstrations and enclosures ............................................ 77
2.4.5.2. Sources of information ............................................................................ 80
2.4.5.3. Service and infrastructure quality ............................................................ 81
2.4.6. Regression analysis of satisfaction determinants ............................................ 82
2.4.7. Structural model of satisfaction determinants ................................................ 88

6
3.4.8. Market segmentation of attraction visitors .................................................... 97
CHAPTER 3: CONCLUSIONS ................................................................................................ 105
3.1. Determinants of visitor satisfaction ......................................................................105
3. 2. Limitations of the study .......................................................................................117
3.3. Further research on visitor attractions .................................................................118
3.4. Final conclusions ..................................................................................................120
SUMMARY ......................................................................................................................... 123
REFERENCES ....................................................................................................................... 127

7
ABSTRACT
The publication concerns visitors’ attractions as the primary aim of tourist trips and the
primary component of the tourism system. The central issue addressed in the book can be
formulated as the following question: what are the features of visitors’ attractions and the
visitors features that determine visitors’ satisfaction. The paper consists of the theory part
and the empirical study. As a result of theoretical investigation, a number of conclusions
concerning the nature and concept of visitors’ attractions were formulated. Questionnaire
surveys were conducted among visitors of four attractions located in the West Poland (N =
1770): the Archaeological Festival in Biskupin, the Museum of Agriculture in Szreniawa, the
Agricultural Museum in Dziekanowice and the Zoological Garden in Poznań. The
questionnaire included scales for measuring motivations, socio-demographic features, type
of trip, the level of satisfaction and the evaluation of exposition, information sources,
services, tourism infrastructure, benefits and knowledge gained during the trip. It was found,
that visitors' satisfaction is determined by two main groups of factors: subject-related
(visitors’ features) and object-related (attraction features). The subject-related factors
determining satisfaction include gender, age, education, size of the place of residence,
distance from the place of residence, acquaintance with the attraction and the frequency of
visiting similar attractions, interest in the subject matter related to the attraction, being part
of a sightseeing group, motivations – especially related to benefits in terms of education,
relaxation and a sense of authenticity. Attraction features that determine visitors’ satisfaction
include exhibitions containing vivid interpretations, shows, intriguing show-pieces,
dioramas, live animals and animal paddocks resembling real-life conditions, authentic and
nostalgia-provoking buildings and interiors. As a result of structural equation modelling, a
number of correlations within the model of satisfaction and visitor intention determinants
were identified. The segmentation of visitors was developed based on the benefits they gain
from visiting attractions. In the analysis, five visitors’ segments were received.
8
PREFACE
Visitor attractions are one of the primary components of the tourism system, as well as the
major power attracting visitors to tourist destinations. Their satisfaction with visiting attrac-
tions will therefore constitute an important factor determining satisfaction with the stay in a
tourist destination. Visitor satisfaction is also an important factor behind the success of an
attraction on the tourism market.
The need for this study resulted from the fact that the literature provides no com-
prehensive study which would analyse determinants of visitor satisfaction and explain the
relationships between the variables of the attraction visiting process. Therefore visitors at-
tractions are the object of the present study, while attraction visitors are its subject.
It is hoped that the results of this study will help attraction managers shape tourist
products, improve the quality of their services and develop marketing strategies for visitor
attractions. The study identified the key factors determining visitor satisfaction, grouping
them into attraction features (object-related factors) and visitor features (subject-related
factors). It also proposed a model of relationships between the variables describing the visit-
ing process: attraction features, visitors’ motivation, benefits, experiences and behavioural
intentions. A visitor segmentation was also proposed which should facilitate the develop-
ment of attraction products targeted at specific segments of the visitor attraction market.
Marek M. Nowacki
Poznań, 2012

9
INTRODUCTION
Despite the intensive development of research on tourism, recreation and leisure, only a
handful of studies have dealt with the issue of activity in objects of cultural and natural heri-
tage, museums and paramuseal institutions, or generally speaking, in visitor attractions.
Visitor attractions as understood in this study are designated, permanent resources,
controlled and managed for their value and for the entertainment, recreation and education
of their visitors. Major attractions play a deciding role in determining the tourist attractive-
ness of whole regions, being the central element of advertising campaigns and key drivers
for the region’s economic growth.
Attractions comprise one of the primary components of the tourism system and the
deciding factor motivating and channelling tourist activity. Satisfaction with the visit in at-
tractions, which are the main destination of trips, has the deciding influence on the evalua-
tion of the total activity undertaken during holiday or weekend trips and during recreational
activity. For this reason, it is extremely important to identify the features of the attraction,
which is the environment in which leisure activities take place, and the determinants of visi-
tor satisfaction.
The problem addressed in the study could be formulated as the following question:
what are the typical features of visitor attractions and what factors determine satisfaction
with tourist and recreational activity undertaken in a visitor attraction.
The primary aim of the study is to identify the factors determining satisfaction with
tourist and recreational activity undertaken in visitor attractions.
The complexity of the research problem required the author to use a variety of research
procedures and employ an interdisciplinary approach. The study makes use of both qualita-
tive and quantitative methods and relies on the expertise of various disciplines, including
physical education studies, psychology, sociology, economics and many more. Such an ap-
proach is necessary and is often employed in analyses of the phenomena accompanying
tourist and recreational activity (Graburn & Jafari, 1991; Winiarski, 2008; Dłużewska, 2009;
Alejziak, 2010).
The detailed aims of the study were as follows:
Aim 1: To identify the features of attraction visitors.

10
Aim 2: To investigate visitors’ motives, benefits, acquired knowledge, satisfaction and behav-
ioural intentions.
Aim 3: To investigate how attractions are perceived by visitors and identify the factors influ-
encing their perception.
Aim 4: To identify factors determining visitor satisfaction.
Aim 5: To verify the model of visitor satisfaction and behavioural intentions.
Aim 6: To develop a typology of attraction visitors.
These aims determined the structure of the study, which was organised into three
chapters. The first chapter presents a review of theoretical concepts concerning visitor at-
tractions, as well as an analysis of the role played by attractions in the tourism system. This
section also contains a theoretical analysis of the attraction features determining visitor sat-
isfaction as well as a comparison of theoretical models explaining visitor activity.
The second chapter presents an empirical verification of the previously formulated
hypotheses concerning determinants of visitor satisfaction. Moreover, an attempt has been
made to verify a model of relationships between the factors found to determine visitor satis-
faction and loyalty towards attractions. This chapter also describes the typology of visitors of
the attractions covered in the study.
The conclusions reflects on the research hypotheses and provides conclusions based
on the results of the study.

11
CHAPTER 1: TOURIST ATTRACTIONS AND VISITORS’ SATISAFACTION IN THE
LIGHT OF THEORETICAL CONCEPTS AND STUDY RESULTS
1.1. The notion of tourist attractions
Attraction is „the power or act of attracting, or a desirable or pleasant quality or thing”
(The New Lexicon, 1991, p. 61). The English-language literature tends to use the notion of
visitor attractions rather than tourist attractions because, as Swarbrooke (1995) observes,
most visitors are not tourists, but residents or day trippers. There are several exceptions
to this, including the Disney World in Florida and the Legoland in Denmark.
The notion of visitor attractions usually appears in studies on attraction
management. The simplest definition of an attraction for visitors, however, was
formulated by the psychologist P. Pearce (1991, p. 46), who described it as „a named site
with a specific human or natural feature which is the focus of visitor and management
attention”. Middleton (1996, p. 261) proposed another precise definition:
“A designated permanent resource which is controlled and managed for the enjoyment,
amusement, entertainment and education of the visiting public”.
Dean MacCannell’s definition, which appeared in his well-known book The Tourist.
A New theory of leisure class, has exerted a major influence on the perception of
attractions by other researchers. He defined the attraction as (MacCannell, 1976, p. 41):
“…an empirical relationship between a tourist, a sight and a marker (a piece of
information about a sight). A simple model of the attraction can be presented in
the following form:
[tourist / sight / marker]
attraction
… markers may take many different forms: guidebooks, informational tablets, slide
shows, travelogues, souvenir matchbooks, etc.”
Markers allow attractions to be distinguished from other artefacts which are
irrelevant from the tourist’s perspective. According to MacCannell, attractions are social
12
constructs emerging in the process of ‘sight sacralisation’. An object, which is a souvenir
of an individual, must become part of the collective consciousness in order to be
universally accepted as a ‘sight’. The transformation of an object into an attraction
involves going through consecutive stages of sacralisation. The process of sacralisation
must be met with ‘ritual attitude’ on the part of tourists. Virtually anything might become
an attraction, including a pavement slab touched by an important person, or even tourists
themselves, because as MacCannell argues, locations with heavy tourism traffic attract
new visitors more efficiently than locations with low attendance.
1.2. Review of studies on visitor attractions
Macro studies on visitor attractions are conducted with a view of developing a typology
of attractions or assessing the attractiveness of a site, tourism region, country or even
international region. Studies on individual attractions are carried out in order to assess
and improve the attraction offer or the attraction product. Areas covered by attraction
studies can be grouped into five sub-areas: (1) valorisation and assessment of
attractiveness, (2) features, perception and behaviours typical for visitors, (2) analysis of
the quality and features of the attraction product, (4) tourism traffic management.
In Poland, studies on tourist attractions have been predominantly the area of
geographical sciences. They have addressed the issue of tourist valorisation of Poland and
the assessment of sightseeing resources as components of the region’s attractiveness for
tourists (Rogalewski, 1974; Kruczek, 1977; Lijewski et al., 1992; Milewski, 2005) or
investors (Gołembski, 2002).
International studies concerning attractiveness assessment include those
employing tourist preferences rather than the analysis and distribution of availability
alone (Piperoglou, 1966, Ferrario, 1976). Another way to collectivize assessment methods
was proposed by J. Deng et al. (2002), who employed the Analytic Hierarchy Process
developed by Saaty (1987). Shoval and Raveh (2003) based categorizing variables on
visitor features: the number of visits, the duration of stay in a city, and one attraction
feature: the proportion of tourism traffic. The categorization of tourists attractions was
done based on the co-plot method of multivariate analysis.
Another area of research is visitor studies, which aim to obtain information on
attraction visitors, including their socio-demographic and psychographic features,

13
opinions, motivations, experiences, activities, attitudes, pre-visit and post-visit
knowledge, and benefits gained from visiting attractions. Studies of this type include
those by M. Linn (1980), D. Light (1995), R. Prentice et al. (1998a) and J. Diamond (1999).
There have also been attempts to construct theoretical models of effective learning in
attractions: the model of mindful visitor (Moscardo, 1999) and the constructivist learning
theory (Hein, 2004). This area also includes studies on activity determinants in visitors of
attractions with a long tradition, originating as early as in the beginning of the 20th
century. These studies at first focused on socio-demographic features of visitors, the
composition of visiting groups, activity features and ways of learning (Loomis, 1987; Hein,
2004), expectations on the part of visitors (Harrison, 1997; Beeho & Prentice, 1997), the
level of satisfaction (Moscardo, 1999; Pearce & Moscardo, 1998), the perception of
authenticity (Moscardo & Pearce, 1986; McIntosh & Prentice, 1999), the sources of
information on attractions used by visitors (Prideaux & Kininmont, 1999), as well as
motivations and other factors shaping visitor behaviours (Jansen-Verbeke & van Redom,
1996) and the role of personal values in determining visitor motivations (Thyne, 2001)
Recently, there is an increasing popularity of predictive studies, which aim to
develop and empirically verify models that describe relations between features and
variables typical of attractions and visitors. Such models have been proposed by D. Baker
& J. Crompton (2000), S. Tomas, D. Scott & J. Crompton (2002), Y. Yoon & M. Uysal (2003),
J. Jensen (2004) and J. Bigné, L. Andreu & J. Gnoth (2005). The models were verified using
multivariate statistical analysis methods, such us multiple regression analysis, factor
analysis or structural equation modelling.
Studies on service quality in tourism have been focusing on tourist office services
(Cliff & Ryan, 1994), hotel services (Ekinci & Riley, 2001) and the quality of regional
tourism products (Danaher & Arweiler, 1996; Augustyn & Samuel, 1998; Gołembski,
1999). A number of researchers perceive quality as the gap between consumer
expectation and perception of services (Parasuraman et al., 1985; Carman, 1990; Cronin
& Taylor, 1992). Based on this understanding, the SERVQUAL service quality framework
was developed (Parasuraman et al., 1988; Zeithaml et al., 1990). M. Nowacki (2002)
employed the SERVQUAL method to evaluate the tourist product quality. I. Frochot & H.
Hughes (2000) developed HISTOQUAL, an assessment scale for historic houses.

14
Another tool for assessing the attraction product is the ASEB/SWOT grid analysis
(Prentice, 1995; Nowacki, 2000), which builds on a combination of the conventional
SWOT analysis model and a recreation opportunity spectrum (ROS) analysis (Manning,
1986). Feedback from attraction visitors is then put into the resulting 16-cell matrix and
qualitatively analysed.
Another group of studies concerns forms of heritage interpretation and their
influence on visitors. These studies aimed to evaluate visitors’ preferences towards
various forms of interpretation (Fraser, 2009; Yamada & Knapp, 2009), assess the
influence of forms of interpretation on visitors (Tarlton & Ward, 2006; Hockett & Hall,
2007), the efficiency of learning while visiting attractions (Knapp & Benton, 2005; Knapp,
2006), and the relationship between interpretation and visitor satisfaction (Ham &
Weiler, 2007).
Yet another class of studies addresses the various aspects of tourism traffic
management. These include works on the model of mindful visitor aiming to identify
factors determining mindful behaviour, learning and visitors’ satisfaction (Moscardo,
1996, 1999), factors determining admission prices to attractions (Fyall & Garrod, 1998;
Nowacki 2010), the role of visitor motivations and expectations in attraction management
(Poria, Reichel & Brandt, 2006) and solutions of complex traffic management in
attractions (Leask, 2010).
A number of studies focus on the influence of visitors on the attraction
environment (ETB, 1991), including the problem of crowding and ways to reduce it
(Shackley, 1999), communication in attractions (Curtis, 1998) and ways of managing
queues of visitors (Barlow, 1999), as well as the analysis of demand-shaping activities as a
means of regulating visitor traffic (Garrod, 2003).
1.3. Tourist attraction typologies
The literature provides a number of perspectives on visitor attraction typology. In an
attempt to sort out the various ways of classification, A. Lew (1987) identifies three broad
perspectives for classifying visitor attractions: the ideographic/descriptive perspective,
organisational/developmental perspective and the cognitive/perceptive perspective.
The ideographic/descriptive perspective is focused on unique features typical for
the site, while ignoring universal or abstract features. It provides a typology comprising of

15
nine attraction categories: panoramas, landmarks, ecological (climate, national parks,
nature reserves), observational (rural/agriculture, gardens), leisure nature (trails, parks,
resorts), participatory (mountain, water and other activities), settlement infrastructure
(utility types, settlement morphology and functions, institutions, people), tourist
infrastructure (forms of access, information, accommodations, meals) and leisure
superstructure (recreation entertainment, culture, history and art). An example of
applying the ideographic perspective is the classification proposed by Swarbrooke (1995),
who distinguished for groups of attractions based on their origin: natural, man-made but
not originally designed primary to attract visitors, man-made and purpose-built to attract
tourists and special events (Table 1.1).
Table 1.1. Visitor attraction typology
Natural Man-made but not originally designed primary to attract visitors
Man-made and purpose-built to attract tourists
Special events
Beaches Caves Rock faces Rivers and lakes Forests Wildlife – flora and fauna
Cathedrals and churches Architecture monuments Archaeological sites and objects Historic parks and gardens Relics of technology Steam railways Reservoirs
Theme parks Amusement parks Open air museums Heritage centres Marinas Exhibition centres Garden centres Factory tours Safari parks Leisure centres Casinos & spas Recreation centres Picnic sites Museums and galleries
Sporting events Art festivals Fairs and markets Traditional customs Religious festivals Historical anniversaries
Source: Swarbrooke, 1995
The organisational/developmental perspective emphasises the geographical and
temporal aspects of attractions, as well as their capacity, while the cognitive perspective
takes into account the visitors’ perceptions and experiences derived from visiting
attractions. Table 1.2 presents typologies of attractions based on the three perspectives.

16
Table 1.2. Comparison of attraction typologies
Typology Source Id
eogr
aph
ic
Natural environment, archaeological objects, architectural and urban monuments, commemorated historic sites, relics of technology, museums/archives/collections, folklore objects or centres and contemporary objects/events, scientific attractions, industrial attractions, means of transport, theme parks, festivals and shows, outdoor recreation sites
Prentice (1993), Middleton (1996), Richards (2003), Lew (1987), Davidson (1996)
Natural beauty and climate, culture and social characteristics, sport, recreation and educational facilities, shopping and commercial facilities, infrastructure, price levels, attitudes toward tourists, accessibility
Ritchie i Zinns (1978)
Natural environment/ designed for a purpose other than attracting visitors/ designed for attracting visitors/ special events/ “live” attractions
Swarbrooke (1995), Leask i Yeoman (2004)
Org
aniz
atio
nal
Spatial dimension (individual/separate, small/big, permanent/temporal, structured/non-structured), scope (local, regional, national, international), location (urban, countryside, seaside)
Lew (1987), Swarbrooke (1995)
Target market (age, gender, stage of life, social class) Swarbrooke (1995)
Primary (destination)/secondary (en route) Mill i Morrisson (1992), Gunn (1988), Swarbrooke (1995)
Co
gnit
ive
Activity (sport and recreation/ education, entertainment, non-leisure motives, relaxation and rehabilitation)
Kušen (2003)
Activity, attraction characteristics, tourist experience (for active/passive visitors, educational/explorative, authentic/inauthentic, easy/difficult)
Lew (1987)
Benefits gained Swarbrooke (1995)
Source: own elaboration
1.4. Tourist attraction models
The tourism literature contains a number of attempts to conceptualise visitor attractions.
Interestingly enough, such studies are developed within many disparate disciplines, from
sociology and psychology, through economy to geography.
One of the first attempts to conceptualise a model of the visitor attraction was
done by D. MacCannel (1976). He defined the attraction as a combination of three
components: the tourist, the sight and the marker, which is a piece of information about
the sight.
C. Gunn (1988) depicted her attraction model as three concentrical circles, with
the inner circle standing for nucleus, the most important component of an attraction and
the main source of attracting tourists (Fig. 1.1). The nucleus, or sight, is what tourists
head for or what they store in memory after returning home. It may include resources of
natural or cultural heritage found at the attraction site. The second essential component
is the inviolate belt or the buffer zone, which secures the nucleus and acts as moderator
of the tourism traffic. The third and final component of the attraction structure is the

17
zone of closure, the area surrounding the attraction. It contains tourist services, such as
food, retail purchases, lodging, transporting services, entertainment and information.
Figure 1.1. Structure of a tourist attraction (Gunn, 1988)
J. Swarbrooke (1995) applied the product model by P. Kotler (1994) to one specific
visitor attraction product, the theme park. The model identifies three levels of a product:
1) The core product is what visitors actually buy. It includes the main benefits gained
from the visit: the atmosphere, experiences, leisure and comfort.
2) The tangible product is the specific offer which visitors receive in the price of the
ticket: roller coaster rides, brand name, quality of service.
3) The augmented product entails ancillary services and benefits for the visitor, both
tangible and intangible: opening time, car parking, catering and retailing.
A comparison of the most popular models of attractions is presented in Table 1.3.
Table 1.3. Models of visitor attractions
Source Description
MacCannell (1976) Attractions are social constructs emerging in the process of ‘sight sacralisation’. A tourist attraction is comprised of three elements: the sight (or location), the marker and the tourists. Markers may include guides, signs and panels.
Gunn (1972, 1979) Attraction contains the nucleus, the inviolate belt and the zone of closure. A tourist attraction is constituted by the understanding of the visitors’ needs, integration with the environment, management strategy, magnetism (ability to attract tourists), ability to provide satisfaction, arrangement.
Leiper (1990), Richards (2002)
A system comprising of a tourist (human element), a nucleus (or central element) and a marker (informative element). Nuclei can be of environmental, anthropogenic or mixed type.
Lee (1976), Canter (1997), Pearce (1991)
Each tourist site (attraction) comprises: a cultural event or a physical setting, the significance and knowledge brought by visitors or gained in the attraction, and forms of activity available in the attraction.
Kotler (1994), Swarbrooke (1995)
The attraction product comprises three levels: the core product (benefits, experiences, leisure), the tangible product (exhibitions, forms of activity, security) and the augmented product (catering services, stores, opening time).
Source: own elaboration
Nucleus
Inviolate belt
Zone of closure

18
1.5. Visitor satisfaction, its indicators and determinants
1.5.1 The notion of satisfaction
The level of satisfaction, and especially the experiences gained by visiting attractions,
constitute the final product of visitor attractions (Middleton, 1996; Smith, 1994).
Satisfaction is both the reason why people visit attractions and the determinant of the
quality of the visit, as well as of the attraction quality, that is, the performance of
attraction providers in terms of providing service to their visitors. This is why, according
to Hall and McArthur (1993), visitor satisfaction should be the central premise of heritage
management.
“Customer satisfaction is a measure of how your organisation’s total product
performs in relation to a set of customer requirements” (Hill & Alexander, 2003, p. 11).
Satisfaction is the result of comparing customer expectations with the actual perception
of product attributes. Satisfaction takes place when the expectations are met or exceeded
(Crompton & Love, 1995). This way of understanding the notion of satisfaction has been
often employed in the practice of customer studies (Oliver, 1981; Parasuraman et al.,
1985; Carman, 1990; Cronin & Taylor, 1992; Zeithaml et al., 1990).
In the tourist literature, however, satisfaction tends to be viewed as the attitude
resulting after a particular experience (Pearce, 2005) and as the emotional state emerging
as a result of experiencing a tourism product (Crompton & Love, 1995). At least three
models of satisfaction have been proposed (Mazurek-Łopacińska, 2003; Wojnarowska,
2005): (1) the emotional model, which perceives satisfaction as a positive psychological
reaction of the customer accompanying the assessment of the results of using a product,
(2) the model based on the theory of justice, where satisfaction is the result of comparing
the benefits of having a product to the expenditure required to acquire it (satisfaction or
the lack of satisfaction is determined by the benefits to expenditure ratio), and (3) the
disconfirmation paradigm, where satisfaction is a function of subjective impressions and
experiences of the customer relative to a specific base of reference (requirements,
desires).
The nature of satisfaction from visiting attractions is fundamentally different from
that resulting from the consumption of other products. Visitors endorse attraction
products primarily for their symbolical and emotional value, which concerns the

19
subjective meanings attributed to an attraction. In this context, the visitors are not a
passive recipients of external stimuli, but co-originators of their own experience, who
actively construct and interpret meanings (Colton, 1987; Wang, 1999; Vitterso et al.,
2000). Visitors experience the attraction as a whole rather than a sum of its individual
attributes. For this reason, some authors argue that the evaluation of satisfaction from
visiting attractions should be based upon an indicator which takes into account the
overall visitor experience rather than individual attraction attributes (Williams et al.,
1992; Vittreso et al., 2000). Therefore research on visitor satisfaction may concern the
quality of experience derived from visiting attractions.
1.5.2. Indicators of visitor satisfaction
The major indicators of visitor satisfaction include experiences from the visit and visitors’
behavioural intentions towards attractions.
1.5.2.1. Experiences
According to the Encyclopedia of Tourism (2000, p. 215), “experience is an inner state of
individual brought about by something which is personally encountered, undergone or
lived through”. Tourist experiences are unique in that they occur as in the course of a
journey, and especially during sightseeing tours.
Tourists tend to seek for experiences that are both pleasant and stimulating. Such
experiences occur during what M. Csikszentmihalyi calls optimal experience or flow
(Csikszentmihalyi, 1996). The flow state is an optimal state of intrinsic motivation,
characterised by: focused attention on present activity, full engagement of one’s
consciousness and using one’s skills to the utmost, sense of time distort ion and a loss of
self-consciousness, but above all a prevalence of autotelic experiences. A number of
authors point out the usefulness of this concept in studies on attraction visitors (Thomson
et al., 1993; Prentice et al., 1998; Beck & Cable, 1998; Ryan, 1997).
The emergence of the emotional states typical of optimal experience depends on
the process of assimilating incoming information into existing “cognitive maps” or
“schemas” (Eckblad, 1981, as cited in Vitterso et al., 2000). These experiences result from
the assimilation of new information into a structure of cognitive maps or schemas. The
observed reality is assimilated into the existing schemas as long as it remains within
tolerable bounds. If one’s perception of the world conforms to existing cognitive

20
schemas, the process of assimilation proceeds without resistance. However, the
assimilation of new information is always accompanied by some degree of resistance,
which increases relative to the expansion of the difference between the perception of the
world and one’s cognitive schema. Therefore the quality of experience depends on the
amount of resistance produced in a given situation (e.g. when visiting an attraction).
When the amount of assimilation resistance is extremely small, the individual
tends to experience the feeling of boredom. As the resistance increases, the boredom
subsides and the experience advances to easy and relaxed (Fig. 1.2). If the resistance
increases still, the experience becomes pleasant and satisfying. With yet larger amounts
of assimilation resistance, a feeling of interest emerges. If the resistance becomes really
strong, the dominant feeling are irritation and frustration (Eckblad, 1981, as cited in
Vitterso et al., 2000). Optimal amount of resistance triggers the optimal experience as
characterised by Csikszentmihalyi (1996).
Figure 1.2. The sequence of emotional experiences and the state of optimal experience
(own work based on Vitterso et al., 2000)
According to the concept of the experience economy proposed by Pine and
Gilmore (1999), the whole spectrum of experiences can be illustrated in a two-
dimensional space. The first dimension describes participation, which can be passive or
active; the second dimension describes connection, which ranges from absorption to
immersion (Fig. 1.3).
challenging boring easy pleasant interesting frustrating
State of optimal experience

21
Figure 1.3. The four realms of an experience (Pine & Gilmore, 1999)
The first dimension reflects the level of visitor activity and its value can range from
entirely passive to extremely active. Passive participation is commonly found in members
of organised guided tours. While they do take part in the visit in the physical sense, their
behaviour may be quite passive (not touching any items, spending time in a restaurant
and not at the exhibition site), and their mental engagement very limited (not asking
questions, not taking part in the discussion). Active participant take part in planning the
sightseeing tour, interpreting the heritage, discussing, acquiring new skills and creating
experiences.
The second dimension describes the relationship that unites the tourist with
locations and events within the attraction. It may range from a state of strong focus, or
absorption, of visitors’ attention, for instance during a multimedia presentation in a
museum or during a historical pageant. At the other end of the scale lies the state of
immersion in a physical or virtual reality (playing an interactive game in a heritage centre,
being in the centre of events during a historical pageant, taking part in a folk dance lesson
or in a session of folk music).
The coupling of these two dimensions defines the four realms of an experience:
entertainment, educational, escapist and esthetic. Entertainment experiences result from
a passive absorption of external stimuli perceived by the senses (e.g. when watching a
Esthetic
Entertainment Educational
Escapist
Immersion
Active Passive
C O N N E
C T I O N
P A R T I C I P A T I O N
Absorption

22
historical pageant or a live interpretation in the attraction). They trigger reactions such as
laughter or joy. In order to gain educational experiences, one needs to become actively
involved in the sightseeing tour or take part in an event, which must strongly engage
visitors intellectually (e.g. active or interactive learning). Escapist experiences are
triggered by an active involvement in an immersive environment. Such environments
include theme parks, casinos, interactive science museums and heritage interpretation
centres. The fourth realm encompasses esthetic experiences, which occur when the
visitor remains passive towards an event or environments rather than becoming
immersed in it. This type of experiences may be found in visitors sightseeing traditional
museums and art galleries or admiring other objects of natural and cultural heritage,
albeit without a deeper understanding. In order to produce the most interesting and
valuable experiences, attraction visitors should be engaged in all the four realms.
1.5.2.2. Behavioural intentions towards attractions
Behavioural intentions are the key concept of the theory of reasoned action by I. Ajzen
and M. Fishbein (1980) and its extension, the theory of planned behaviour by I. Ajzen
(1988). According to these theories, the factors determining behaviours are conscious
intentions (plans), understood as the motivational factor influencing behaviour.
Intentions indicate how much effort people are inclined to put in an intended activity.
According to the theory, three independent determinants of intentions can be
distinguished: attitudes towards the behaviour, which are individual beliefs about the
behaviour, its consequences and evaluation; subjective norms, which are beliefs about
how other people, whose opinion is important to the person, would judge a given action;
perceived behavioural control, which is how easy or difficult the person feels the
behaviour is, based on the perception of the ability, knowledge and skills necessary to
perform the behaviour. It is assumed that the stronger the intentions, the more probable
a given behaviour. However, behaviour are influenced by other factors as well, including
time, personality and the socio-demographic features of the person (Fig. 1.4).

23
Figure 1.4. Theory of planned behaviour (Ajzen, 1988)
The concept of behavioural intentions has been widely applied in studies on
determinants of consumer behaviour and in analyses of tourist activity determinants. The
ability to inspire the need to repeat an activity, revisit an attraction and encourage other
persons to do the same is considered an important factor determining the success in the
market of tourist and recreational services (Bowen & Chen, 2001; Darnell & Johnson,
2001).
Loyalty towards attractions
Loyalty towards a travel agency, destination or visitor attraction is one of the major
indicators of the success of marketing strategy in tourism (Flavian et al., 2001) and
constitutes one of the major axioms in tourism management (Getty & Thomson, 1994).
Loyal customers are much more resistant to competitors, as they believe their current
provider will be able to satisfy their expectations like no other (Hill & Alexander, 2003).
The nature of loyalty towards tourist attractions is unique, however. Many people,
having visited an attraction, will have no need to visit it again. This especially holds true
for facilities featuring permanent exhibitions and not holding any special events, such as
fairs or festivals. Yet some attractions, including large entertainment parks, zoos and
museums holding spectacular temporary exhibitions or festivals, are in a position to
maintain an extremely loyal and committed audience.
The relationship between loyalty and satisfaction is fairly well documented
(Conlon & Murray, 1996; Yavas, 1998). However, it not entirely symmetrical: loyal
customers tend to be satisfied, but satisfaction does not always translate into loyalty
(Wojnarowska, 2005). Moreover, a satisfied customer is not always a loyal one, while
Attitudes Towards the
Behaviour
Subjective
Norms
Perceived
Behavioural
Control
Intentions Behaviour

24
dissatisfaction does not necessarily entail the lack of loyalty (Otto, 2004). Perhaps this
results from the fact that loyalty may also be influenced by other factors than satisfaction.
Loyalty behaviours towards attractions take various forms, the most important of
which include: revisit intentions, word of mouth and willingness to pay higher entrance
fees than others (Zeithaml et al., 1996; Hill & Aleksander, 2003).
Revisit intentions
Repurchase intention is defined as the customer’s decision to engage in future activity
with a service provider (Hune et al., 2007). In the tourism and recreation sectors, this
takes form of a repurchase of a tourism or recreational service or a revisit of a destination
or visitor attraction. Revisit intentions do not necessarily imply loyalty towards an
attraction; they may simply result from mere force of habit or the lack of other
opportunities. However, they constitute a more reliable indicator of future behaviour
than satisfaction or the perception of product quality (Olivier, 1999).
Studies within the tourism sector confirm the relationship between satisfaction
and revisit intentions, showing that satisfied customers are more inclined to loyalty
towards the provider and to repurchase intentions (Bigne et al., 2001; Bowen & Chen,
2001; Kozak & Rimmington, 2000).
Benefits of a loyal base of returning visitors include: an opportunity to lower
marketing expenses, an increase in sales and attendance, and a reduction of operating
costs. Moreover, loyal visitors need less information and themselves serve as a source of
information for others (Bowen & Chen, 2001).
Determinants of revisit intentions differ depending on the type of attraction. In
historical attractions, for instance, the relationship between revisit intentions and quality
perception is less crucial than in other types of attractions (Johns, 1999). This probably
results from the fact that such facilities are usually visited only once, unlike entertainment
parks or even museums. In the first case, revisit intentions are triggered by a desire to
experience fun and thrill, and in the latter case by temporary exhibitions, art events or
exhibition updates. However, as Johns (1999) observes, the overall satisfaction from
visiting a heritage attraction may play an important role in spreading positive word of
mouth and building expectations towards other attractions of this type.

25
Word of mouth
The importance of word-of-mouth processes in spreading opinions, judgements and
comments regarding products is well documented in the marketing literature (Bansal &
Voyer, 2000). Consumers value word of mouth and perceive it to be a reliable, accurate
source of information provided by people who have no personal interest in promoting a
given product. Studies suggest that word-of-mouth recommendation is much more
effective and exerts a stronger influence on establishing positive attitudes towards the
brand than formal advertisements (Herr et al., 1991; Haahti & Yavas, 2005). A number of
authors point out that satisfied tourists, having had positive experiences, are inclined to
recommend a tourism service to other persons, while the lack of satisfaction results in
negative opinions about the service (Aho, 2001; Bigne et al., 2001; Haahti & Yavas, 2005;
Um et al., 2006).
At various stages of trip planning, as well as during the trip, tourists seek various
sources of information. But the most popular source, both before and during the trip, is
word-of-mouth recommendation by family and other persons (Beiger & Laesser, 2004).
Also S. Baloglou and K. McCleary (1999) and J. Chen (2003) proved empirically that word
of mouth is the most influential source of information in the process of tourism image
formation.
Willingness to pay
Factors that strongly affect satisfaction include, apart from service and product quality,
the price the customer must pay (Parasuraman et al., 1994).
Willingness to pay is the highest price an individual is willing to pay to get a given
good (Powe & Willis, 1996). Questions about willingness to pay are part of the contingent
valuation method, used to estimate economic values of goods, especially those non-
commercial, such as environmental or cultural resources. The method helps estimate the
value of resources producing benefits that cannot be valued with reference to a specific
market price as they are not sold on an actual market.
Despite numerous reservations about the discrepancy between respondents’
stated willingness to pay and their actual behavioural intentions, an individual who has
declared willingness to buy a good at a declared price is more likely to undertake the
purchase than an individual who has not done so (Green & Blair, 1995). Studies indicate

26
that the value of WTP depends on income, education, profession and visiting group
composition, as well as on demographic and psychographic features. It also largely
depends on the features of the attraction itself, such as service quality or infrastructure
(Mitchell & Carson, 1989; Powe & Willis, 1996; Kawagoe & Fukunaga, 2001). It has been
observed that returning visitors are less sensitive about the price than first-time visitors
(Petrick, 2004).
1.5.3. Determinants of visitor satisfaction
1.5.3.1. Attraction features
Attraction features determining satisfaction include: the diversity of attraction offer
(various forms of activity for visitors, stores, catering, entertainment, activities for
children), special events (fairs, concerts, performances), high quality of environment
(attractive location, cleanness, aesthetics, concern for natural environment, integration
into the local context), quality of service, amenities (safe car park, clean toilets, amenities
for children, information and the way of presenting it), as well a the price-to-value ratio
(Gunn, 1972; Pearce, 1991; Swarbrooke, 1995). The renown of heritage resources
available in the attraction is of great importance as well.
Heritage resources
Institutional interest in heritage began with the Convention Concerning the Protection of
World Cultural and Natural Heritage, which was adopted by UNESCO in November 1972.
The contemporary notion of heritage includes everything that is passed down from
generation to generation, that is part of the society’s life today and can be preserved for
future generations, everything that can be protected or collected. Heritage encompasses
both tangible objects, places, environmental and cultural areas, and intangible forms of
culture, such as philosophy, tradition, manifestations of art, lifestyles, literature and
folklore.
Heritage resources can be broadly divided into tangible and intangible resources.
Tangible resources include cultural and environmental (natural) heritage. Cultural
heritage encompasses man-made objects, such as monuments of architecture, sculpture
and painting, building complexes, sites of human work, as well as cultural landscapes and
historical sites. Natural heritage includes geological elements, landforms, plant and

27
animal habitats, as well as areas of unique scientific, environmental or aesthetic value
(UNESCO, 1972; Howard, 2003). Intangible heritage encompasses tradition, oral history,
language, shows and performances, customs, celebrations, knowledge about the universe
and nature and related practices, as well as traditional craft skills.
The basis criterion for classifying a heritage object as a tourism asset is whether it
has features that attract the attention of tourists. Such features include: the renown and
concentration of objects, the spectacularity of forms and phenomena, uniqueness, the
distinctiveness of stylistic features, the innovativeness of architectural solutions,
monumentality and large capacity, interesting historical accounts or legends about
objects, good accessibility, the state of tourism development (Przybyszewska-Gudelis et
al., 1979; Lijewski et al., 1992).
Forms of heritage interpretation
Satisfaction from activities undertaken in tourist attractions largely depends on how
effectively information about meanings related to a given resource is communicated and
explained. Principles of conveying this type of information are discussed within the field
of heritage interpretation. In the words of F. Tilden (1977, p. 8), “heritage interpretation
is an educational activity which aims to reveal meanings and relationships through the
use of original objects, by firsthand experience, and by illustrative media, rather than
simply to communicate factual information”.
In order to communicate information to attractions visitors, various media are
employed, which can be broadly divided into personal and non-personal. The latter
include those media that do not rely on any person to deliver information (Sharpe, 1982;
Littlefair 2003):
audio devices – devices playing voice or other sounds (portable players, audio kiosks,
audio systems),
written materials – publications, brochures, guides, maps, newsletters,
self-guided activities – allowing visitors to experience heritage resources directly and
according to their own preferences (e.g. thematic or educational trails),
exhibitions – both internal, e.g. in museums, and external, created in order to arouse
visitor interest in objects located nearby the attraction,

28
visitor centres – institutions combining various methods of interpretation and allowing
visitors to learn about the heritage before entering the interpreted site,
interpretation panels – panels containing text, pictures, illustrations, maps,
interactive kiosks – interactive computer devices running special software and often
featuring a touch screen allowing visitors to browse for information on their own.
Personal forms of interpretation involve a direct contact between visitors and an
interpreter (Sharpe, 1982; Littlefair, 2003):
information services, where an interpreter answers visitors’ questions at a specific
place (e.g. in an interpretation centre, in natural attractions),
guided tours, which involve following a previously planned route with a series of stops,
talks – verbal and multimedia presentations delivered by an interpreter in a previously
set place (e.g. in an interpretation centre or by a bonfire at a camp-site),
living interpretation / historical re-enactment (e.g. traditional pancake baking, warrior
combats, iron smelting in bloomberies, re-enactments of historical events).
The efficiency of the interpretation methods is varied and determined by a
number of factors, such as the size and dynamism of the exposition, aesthetic factors,
novelty, ways of stimulating the senses, interactivity, visibility, proximity, realism, visitors’
engagement, fatigue, specific interests, demographic features and competences
(Patterson & Bitgood 1988). The greatest holding power is reported in exhibitions
combining concrete presentations and free interaction of visitors with the exhibits
(Boisvert & Slez, 1995). Interpretation should also stimulate the interaction between
participants of visitor groups.
Forms of heritage presentation
The core of every visitor attraction are heritage resources or problems (themes)
presented to visitors as exhibitions. Modern interpretive exhibitions are those which
revive the heritage topic by actively involving visitors and relating to their everyday life
(Veverka, 1997).
The structure of exhibition in visitor attractions comprises (Knudson et al., 1999):
dioramas – miniature or life-size three-dimensional objects arranged against a painted
background imitating their cultural or natural environment,

29
scale models or three-dimensional maps,
simulated travel in space or time,
hands-on exhibits which can be touched or manipulated and which improve interest
and facilitate learning,
exhibits in transparent display cases,
interactive exhibitions which enable feedback between the visitor and the exhibition
by controlling location and lighting with buttons (currently most popular as kiosks
featuring touch screens).
Exhibits can be divided into four groups based on their ability to stimulate visitor interest
(Veverka, 1997) (Table 1.4).
Table 1.4. Exhibits classification with regard to visitor interest
Visitor
mode
Exhibit Motion Inert
Active Stimulating visitors by direct contact with live animals, moving models forcing activity and direct involvement.
Stimulating visitors by models or exhibits controlled with buttons or interactive computer panels.
Passive Moving models or animals in the zoo Works of art, photographs, prints, dioramas
Source: Veverka (1997)
In the course of empirical research, a number of relationships between exposition
features and visitor interest have been identified:
Computer devices arouse the greatest interest in visitors as a medium of conveying
information. Visitors spend significantly more time with such devices than with other
types of exhibits (Both, 1996; Economou, 1998).
Computer devices mostly attract the attention of male visitors (Economou, 1998;
Sharpe, 1982).
Purely textual exhibitions arouse the least interest, while those combining text and
visual elements, such as models or photographs, arouse the greatest interest (Prince,
1983).
Texts in panels should not be longer than 50 words. The shorter the text, the more
readily visitors will read it and the more curiosity it will create (Knudson et al., 1995).
Interest is promoted by the appropriate concept: interesting, innovative subjects,
diligent theoretical grounding (literature studies, research and expert works),

30
appropriate selection of artefacts, artworks and texts (in order to explain the
exhibition subject), exhibition design and appearance facilitating information sharing,
appropriate selection of titles and artworks that attract attention and arouse interest
(Kelly, 1990; Knudson et al., 1999; Veverka, 1997).
Quality of tourist services and infrastructure
Service quality is considered to be the key factor determining customer satisfaction with
services. Quality includes all features typical of a product or services and their level which
determine its ability to satisfy express or hidden needs and expectations of consumers
(ISO, as cited in Swarbrooke, 1995).
The problem of relationships between the perception of service quality and
satisfaction has not been unequivocally solved so far. In the early stage of studies on
recreational tourism, satisfaction was considered the key indicator of service quality
(Manning, 1986). Later studies recognized the difference between the notion of quality
understood as the quality of services supplied by the provider, and satisfaction as a
measurement of visitor experience quality (Brown, 1988; Crompton & Love, 1995; Baker
& Crompton, 2000). This attitude implies that the quality of a service or a product refers
to those service features that primarily depend on the service provider, whereas
satisfaction is an indicator of visitors’ emotional states and experiences from an activity
and does not necessarily result from service quality (Baker & Crompton, 2000).
Despite the theoretical distinction between the notions of quality and satisfaction,
theoreticians on tourism and recreation believe that there exist strong relationships
between service quality and satisfaction (Manfredo, 1993; Oliver, 1997; Baker &
Crompton, 2000). However, empirical studies fail to support this hypothesis unequivocally
(Crompton & Love, 1995; Haber & Lerner, 1999). For instance, D. Baker and J. Crompton
(2000) found that service quality has a greater overall impact on intentions towards
attractions than satisfaction does. Conversely, J. Cronin and S. Taylor (1992) found that it
is satisfaction and not service quality that has a stronger influence on repurchase
intentions. In other studies, J. Gotleib, D. Grewal and S. Brown (1994) and M. Bitner
(1990) found the relationship to be two-directional: high service quality drives
satisfaction, and the accompanying positive mood positively influences the perception of
service quality. Material components of attractions which influence service quality

31
include: (1) attraction surroundings, (2) attraction entry zone and reception area, (3)
elements facilitating way-finding within attractions, (4) catering amenities and services,
(5) availability of souvenirs and literature, (6) toilet facilities.
1.5.3.2. Visitors features
There are few studies analysing relationships between visitor satisfaction and their socio-
demographic features. Presented below is the socio-demographic diversification of visi-
tors with regard to the type of visited attractions, which serves as an indicator of prefer-
ences in, to some extent, of satisfaction resulting from visiting specific types of attrac-
tions.
Gender. The majority of attraction visitors are female (52%). Demographic features dif-
ferentiate visitors with regard to the type of attraction. It was found that males prevail in
science museums and females in art galleries (Nuissl & Schulze, 1991; Kirchberg, 1996). It
was also found that females are more inclined to consume cultural products than males
(Hall & Zeppel, 1990; Zeppel & Hall, 1991).
Age. Studies conducted by the ATLAS provide information about the age of attraction
visitors (Richards, 1996, 2001). They indicate that the largest group of visitors is com-
prised of individuals aged up to 30 (more than 35%) and more than 50 (26%). ATLAS stud-
ies have also demonstrated age-group differences with regard to the type of attractions.
Young person prefer fairs and festivals, middle-aged persons prefer museums and galler-
ies, while older persons prefer historical sites. The latter are especially attracted to art
museums. Conversely, museums of natural history predominantly attract young visitors.
Level education and material status. Studies conducted in attractions show that visitors
are dominated by higher educated individuals (Nuissl & Schulze, 1991; Kirchberg 1996).
Pensioners and students comprise a relatively small group. Out of working-age visitors,
70% are managers or highly qualified specialists. Individuals with higher education, better
social status and more income prefer museums and historical sites. People of lower pro-
fessional status are more interested in fairs and relics of technology (MORI/MGC, 1999, as
cited Davies, 2005). Education of visitors to art museums is higher than that of visitors to
regional, science and historical museums (Nuissl & Schulze, 1991; Kirchberg 1996).
Place of residence, type of the trip. According to ATLAS studies, approximately 60% of visi-
tors are tourists. Almost half of respondents return to the same attraction (72% among

32
residents and 34% among tourists). Most returning visitors are found in cultural events:
these are revisited by almost 59% of respondents, while only 47% revisit permanent exhi-
bitions. Almost 50% respondents state that a visitor attraction was an important or very
important reason influencing the decision to visit a given region (the more distant the
attraction from the place of residence, the greater influence it has on visitor decisions)
(Richards, 1996).
1.6. Models of satisfaction determinants in tourist attractions
A number of models have been developed in order to explain what determines the
satisfaction of attraction visitors and what relationships exist between variables operating
within the process of sightseeing.
The first model to be discussed here is the Recreation Opportunity Spectrum.
According to this model, individuals engage in various forms of recreational activity with a
view to achieving certain goals and satisfying certain needs (Manning, 1999). Based on
this, four levels of demand for recreation were identified (Clark & Stanley, 1979): towards
forms of activity undertaken in a certain setting in order to gain certain experiences and
benefits. Experiences are desirable psychological effects, including the satisfaction with
going out, the use and development of skills, family bonding, learning, doing exercises,
cooperation, closeness to nature, safety, improving knowledge, self-presentation, sense
of freedom, fun and understanding (Driver et al., 1991; Roggenbuck et al., 1990), as well
as the escape from physical stressors, learning, sharing similar values, and creativity
(Haggard & Williams, 1991), and even feelings of sorrow, longing, nostalgia, pride or
sympathy (Hull, 1990; Prentice et al., 1998b). The last level of demand for recreation
includes the final benefits which result from satisfactory experiences gained in the course
of a recreational activity.
The next model, known as mindful visitor (Moscardo, 1999; Pearce, 2005), is based
on the idea that mindfulness is a cognitive state of enhanced focus on the present
moment and openness to new ways of acting and learning. Mindlessness, on the other
hand, is not a state of a complete lack of thinking, but rather a state of routine, when
people act unheeding of the present situation and do not learn anything new. The model
integrates two sets of factors determining the satisfaction of attraction visitors:
communication factors (attraction features) and visitor factors (visitor features).

33
Communication factors include signs, guided tours, brochures and expositions, while
visitor factors are concerned with interest in content, fatigue, motivation etc. The two
sets of factors determine whether visitors will have a mindful or mindless experience, but
visitor factors, such as curiosity or fatigue, are also affected by exposition factors. The two
sets of factors directly influence the state of mind and the focus of visitors, determining
the knowledge and satisfaction they will gain by visiting the attraction.
The model explaining visitors’ revisit intentions proposed by J. Jensen (2004) takes
into account motivational factors. Jensen suggests that some of these factors (motivators)
directly influence intentions to revisit an attraction. Other factors (hygiene factors), while
they have no direct influence on revisit intentions, can nevertheless shape it indirectly by
influencing the motivators. This model has been derived from the two-factor theory by
Herzberg (1996), according to which factors motivating employees to work might be
grouped into motivators and hygiene factors. The motivators operate to increase job
satisfaction, whereas the hygiene factors may decrease it. Jensen divided factors shaping
the satisfaction of attraction visitors in a similar manner. The hygiene factors, which
include peripheral elements, such as toilet facilities, eating and souvenir stores, do not
directly influence satisfaction, but their poor quality may have a negative effect on
satisfaction. Motivators, on the other hand, may trigger satisfaction directly. These
include benefits and experiences gained during the visit, which positively contribute to
the core experience. Hygiene factors have a very limited impact on revisit intentions, but
a relatively strong influence on motivational factors, while revisit intentions are strongly
influenced by motivational factors (Fig. 1.5).
Figure 1.5. Model of the relationships between motivational factors and intentions to
revisit attractions (Jensen 2004)
Motivators
Hygiene
Factors
Revisit
Intentions +
+
0

34
Investigative models of the recreation theory used to employ satisfaction as the
marker of service quality for many years (Manning, 1986). Yet D. Baker and J. Crompton
(2000), when investigating relationships between quality, satisfaction and behavioural
intentions, found that while quality does influence satisfaction and satisfaction does
influence intentions, the perception of the performance of the service provider has a
much stronger impact on behavioural intentions than satisfaction does (Fig. 1.6). The
authors assumed a one-way influence of quality on satisfaction, although other
researchers, including J. Gotleib, D. Grewal and S. Brown (1994) proposed model where
this relationship was reciprocal, with positive mood favourable influencing the evaluation
of infrastructure quality.
Figure 1.6. Model of quality, satisfaction and behavioural intentions (Baker & Crompton,
2000, p. 791)
The model proposed by Baker and Crompton (2000) was later extended by S.
Tomas, D. Scott and J. Crompton (2002), who introduced another variable: benefits (Fig.
1.7). They demonstrated that there exist relationships between product quality and
behavioural intentions, benefits and satisfaction (the latter being a recurrence
relationship), between benefits and behavioural intentions, as well as between
satisfaction and behavioural intentions. Multiple regression analysis, however, failed to
verify the direction of the hypothetical influences.
Generic
Features
Specific
Attraction
Features
Information
Sources
Services
Loyalty
Willingness
to Pay
Satisfaction
Service
Quality
Behavioural
Intentions

35
Figure 1.7. Model of quality, satisfaction, benefits and behavioural intentions (Tomas et
al., 2002)
The next model takes into account the motivation for activity, but ignores benefits
and quality perception. Y. Yoon and M. Uysal (2003) postulated two factors that shape
satisfaction and behavioural intentions: pull motivation (exciting, knowledge/education,
relaxation, achievement, family togetherness, escape, safety/fun, away from home and
seeing) and push motivation (modern atmospheres & activities, wide space & activities,
small size & reliable weather, natural scenery, different culture, cleanness & shopping,
night life & local cuisine, interesting town & village, water activities). They proved that the
two factors influence visitor satisfaction, which in turn influences destination loyalty.
Moreover, they found that only push motivation has a direct and positive influence on
behavioural intentions (Fig. 1.8).
Figure 1.8. Model of the effects of motivational factors on satisfaction and loyalty (Yoon &
Uysal, 2003)
A comparison of the most popular models is presented in Table 1.5.
Push
Motivation
Pull
Motivation
Satisfaction Destination
Loyalty
Satisfaction
Product
Quality
Behavioural
Intentions
Benefits

36
Table 1.5. Models of activity within tourists attractions
Theory or model Authors Description
Recreation Opportunity Spectrum
Clark & Stanley (1979), Manning (1999),
Benefits are the final result of consecutive events influencing each another, i.e. free time activities undertaken in a certain setting (within an attraction) in order to gain certain experiences and benefits.
Three schemas of interaction
Falk, Koran, Dierking & Deblow (1985)
There are three schemas (perspectives) of the interaction between visitors and the attraction environments: behavioural (exhibition-related) – attraction features are the key motivator, cognitive (audience-related) – activity is determined by the preparation and knowledge of visitors, and holistic (systemic) – activity is determined by the system of attraction environment factors and visitor characteristics.
Tourist attraction systems
Leiper (1990), Richards (2002)
The attraction system comprises nuclei, markers and tourists. Markers can be contiguous or detached. Tourists are not attracted by the attractions but motivated by the detached makers found in their place of residence. The perception of an attraction is influenced by transit markers and those found at the attraction nucleus.
Mindful visitor Langer (1989), Moscardo (1999), Pearce (2005)
Attraction visitors can either be mindful or mindless. The level of their attention is influenced by attraction features (exhibitions, signs, trails) and visitor features (familiarity with the place, sense of direction, interests, company)
Model of quality, satisfaction and behavioural intentions
Baker & Crompton (2000)
Service quality has a greater impact on behavioural intentions towards attractions than satisfaction does.
Model of quality, satisfaction, benefits and intentions
Tomas et al. (2002)
Intentions towards attractions are influences by the quality of the attraction product, satisfaction and benefits.
Model of the effects of motivational factors on satisfaction and loyalty
Yoon & Uysal (2003)
Satisfaction and push motivation directly influence behavioural intentions.
Two-factor theory model
Herzberg (1966), Jensen (2004)
Two types of attraction factors can be distinguished: hygiene factors (catering, toilets, personnel) and motivational factors (experiences and benefits). Intentions towards an attraction is influences by the latter.
Source: own elaboration

37
CHAPTER 2: ANALYSIS OF VISITOR SATISFACTION DETERMINANTS
2.1. Research problem and questions
This part of the study aims to characterise attraction visitors and analyse their motives,
perceptions, benefits, satisfaction and future behavioural intentions. The study seeks to
prove that the satisfaction from activities undertaken in visitor attractions is determined
by a combination of individual factors, typical for each person, and a complex of
attraction features, such as exhibitions, sources of information and elements of service
and tourist infrastructure.
In particular, the study was designed to investigate the following questions:
1. Who visits tourist attractions?
2. What are the motives, benefits, satisfaction and future intentions of attraction
visitors?
3. How do visitors perceive attractions?
4. What factors determine the satisfaction of attraction visitors?
5. What factors determine future intentions of attraction visitors?
6. What relationships occur between motives, attraction features, visitor factors,
benefits, satisfaction and behavioural intentions?
7. What are the types of attraction visitors?
2.2. Research hypotheses
In the next phase of the study, a series of research hypotheses were proposed based on a
preliminary survey of the literature that provided answers to the most essential of the
previously formulated questions.
Visitor satisfaction is not only shaped by features of the attraction itself. A number
of studies suggest that level of satisfaction is also related to some socio-demographic
features (Sparks, 2000; MORI/MLA, 2004, Spinks et al., 2005).
Hypothesis 1: The level of satisfaction will vary depending on the socio-demographic
features of attraction visitors.

38
The level of satisfaction will be predominantly determined by visitor age. Some of
the studies indicate that older individuals are more satisfied with visiting attractions than
younger ones (Sparks, 2000). This relationship may be also influenced by the type of
attraction: younger individuals will be more satisfied with visiting attractions that deliver
entertainment and recreation, while older ones with attractions providing education or
inspiration. A greater level of satisfaction may also be found among individuals of
parental age (approximately 25 to 44 years old) who visit attractions with their children.
In this case, it is the accompanying children that increase level of visitor satisfaction.
Hypothesis 1a: Older individuals will experience greater satisfaction than younger ones.
As studies show, females visit attractions more often than males (MORI/MLA,
2004). This probably results from greater level of satisfaction found between females and
males. Also in this case, the greater level of satisfaction might result from the presence of
accompanying children, as females visit attractions with children much more often than
males (Sparks, 2000; Spinks et al., 2005). Children’s influence on satisfaction, which is
usually not measured, will be the deciding factor for visitor satisfaction among females.
Hypothesis 1b: Females will experience greater satisfaction level with visiting attractions
than males.
Previous experiences in attractions may also influence the level of satisfaction.
Based on previous experiences, visitors develop certain expectations, which result in
dissatisfaction if not met. These expectations are shaped by previous visits and by the
information about the attraction found in various sources. They are also a consequence of
personal interests. If visitors know what to expect in an attraction, they will derive greater
satisfaction (Beeho & Prentice, 1997; Pearce, 1988; Lawson et al, 1999; Ryan, 1995).
Similarly, knowledge and experiences gained through previous visits in attractions may
positively influence the level of satisfaction. Expectations built upon reliable knowledge
tend to be more accurate, as they are not merely a result of the marketing influence
exerted by attraction managers (Moscardo & Pearce, 1998). This may also determine the
greater level of satisfaction among repeat visitors compared to first-time visitors.
Hypothesis 1c: Individuals who have had previous experiences with visiting attractions will
derive greater satisfaction than other individuals.

39
Hypothesis 1d: Individuals interested in the subject of the attraction will be more satisfied
than other individuals.
Hypothesis 1e: Well-educated individuals will be more satisfied than other individuals.
The level of visitor satisfaction and revisit intentions may also depend on the
mode of travel and the distance travelled to reach the attraction. Some studies suggest
that residents are more satisfied with sightseeing attractions that tourists from far away
(Pearce et al., 1997). This satisfaction, however, does not necessarily involve revisit
intentions. Another study by P. Pearce & G. Moscardo (1998) found that tourists are more
inclined to revisit attractions than local residents. According to the theory of justice,
satisfaction can be viewed as the relationship between the consumer’s expenditure and
benefits (Oliver & Swan, 1989; Heskett et al., 1997). Hence the transport time and cost
may constitute important factors determining visitor satisfaction.
Higher expenditure on reaching the attraction will decrease satisfaction unless it is
counter-balanced by high benefits. Local residents need less time and money to reach the
attraction and therefore are less exposed to dissatisfaction as a consequence of poor
benefits gained from the visit.
Hypothesis 1f: Satisfaction from the visit will decrease with the increase of the distance
travelled to the attraction.
The model of mindful visitor (Moscardo, 1999; Pearce, 2005) postulates that
visitor satisfaction is driven by two factors: communication between the attraction
(sources of information, exhibitions, directional signs, etc.) and visitor (factors such as
interest in the subject, fatigue and motivation). A mindful visit normally involves
information processing, which results in greater knowledge, greater satisfaction and a
better understanding of the attraction content.
Hypothesis 2a: Individuals who have greater knowledge about the subject of the
attraction will display a higher level of satisfaction.
Hypothesis 2b: Individuals who learn more during the visit will display a higher level of
satisfaction.

40
Apart from visitor characteristics, visitor satisfaction will also be influenced by
attraction features. These include heritage resources, ways of exhibiting them,
information sources available in the attraction, elements of tourism infrastructure and
attraction personnel. The direction of this influence is not clear, however. Some studies
suggest it is a one-way influence of attraction features on satisfaction (Baker & Crompton,
2000). Others indicate it works in two directions, with favourable levels of satisfaction
positively influencing the perception of attraction features (Gotleib et al., 1994).
Hypothesis 3: There is a relationship between attraction features and the level of
satisfaction among attraction visitors.
Hypothesis 3a: Favourable perception of the exhibition positively influences the level of
satisfaction.
Hypothesis 3b: Favourable perception of information sources positively influences the
level of satisfaction.
Hypothesis 3c: Favourable perception of services and tourism infrastructure positively
influences the level of satisfaction.
Acquiring new knowledge and experiences is an important motive for any tourist
activities. Knowledge and understanding of the attraction subject are, apart from the
development of new skills, a change in attitudes, inspiration and new behaviours, the
major results of learning (Hooper-Greenhill, 2004). The learning process during the visit to
an attraction may take various forms: reading signs and interpretive panels, listening to a
guide, reading brochures and guides, conversations with attraction personnel. Visitor-
related factors that determine learning include the individual’s style of learning and
having previous experiences with the attraction (acquaintance with the attraction layout
enables a better focus in gaining knowledge) (Falk, 1983; Moscardo, 1999), age
(Moscardo & Pearce, 1986), trip status: one-day or multi-day (Lee, 1998), composition of
the visiting group (Hood, 1989), motivations (Edwards et al., 1990; Light, 1995a) and
experience (Spinks et al., 2005)
Hypothesis 4a: Repeat visitors will gain more knowledge from the visit than first-time
visitors.
Hypothesis 4b: Tourists will gain more knowledge than one-day visitors.
Hypothesis 4c: Older visitors will gain more knowledge than younger ones.

41
Hypothesis 4d: Individuals who have visited similar attractions in the past will gain more
knowledge than other visitors.
Relationships between motivation, the perception of attraction features, benefits,
satisfaction and behavioural intentions of attraction visitors may seem obvious, but have
not yet been unambiguously demonstrated in empirical studies. The study on the effects
of motivational factors on satisfaction by Yoon and Uysal (2003), conducted among
visitors to Cyprus, shows that both push and pull motivational factors directly influence
satisfaction, but only push motivation has a direct impact on behavioural intentions.
Motivations for the visit can also influence the perception of the attraction.
A number of tourism studies, especially those focusing on museums, emphasize
the influence of service quality on satisfaction (De Ruyter et al., 1997; Caldwell, 2002;
Harrison & Shaw, 2004). Many studies indicate a significant influence of visitor
satisfaction on their future behaviours towards the attraction (Simpson, 2000; Tomas et
al., 2002; Bigné et al., 2005). There have also been arguments, however, that satisfaction
from individual aspects of attraction services does not affect the long-term loyalty toward
the attraction, the deciding factor being the overall assessment of the attraction (Harrison
& Shaw, 2004).
Some researchers are of the opinion that it is the assessment of attraction
features and service quality rather than satisfaction that influences future behaviour
towards the attraction (Rust et al., 1996; Baker & Crompton, 2000; Bigné et al., 2001).
Satisfaction can moderate how the perception of attractiveness, service quality and price-
value affects behavioural intentions (Um et al., 2006).
The starting point for the proposed model is the Recreation Opportunity Spectrum
(Manfredo et al., 1983; Driver et al., 1987) discussed earlier. Taking into account the
relationships mentioned above and in Chapter 1, a model of visitor satisfaction
determinants was proposed (Fig. 2.1). The model postulates the following relationships:
Hypothesis 5: Visitors’ intentions towards an attraction will be determined by: (a)
satisfaction, (b) benefits from the visit, (c) motivations and (d) the perception of attraction
features.
Hypothesis 6: The assessment of the benefits from the visit is determined by: (a)
satisfaction, (b) attraction features and (c) visitor motivations.

42
Hypothesis 7: Visitor satisfaction is determined by: (a) attraction features, (b) motivation
and (c) benefits from the visit.
Hypothesis 8: Visitor motivations determine the perception of attraction features.
Hypothesis 9: Benefits from the visit have a stronger impact on behavioural intentions
than satisfaction does.
Figure 2.1. Model of relationships between satisfaction, behavioural intentions, benefits,
motivation and attraction features (source: own elaboration)
2.3. Methodology
2.3.1. Variables operationalization and questionnaire development
The study was preceded by participant observation within the premises of the studied
attractions. Non-structured interviews were conducted with visitors, concerning their
opinions on the attractions, impressions from the visit and satisfaction. The next step
consisted in a preliminary study, carried out with the use of an open-question
questionnaire. The questions concerned visitors’ opinions on the attractions, motivations
for the visit, exhibitions evaluation, benefits from the visit, impressions and satisfaction.
In the next step, a survey questionnaire was developed by identifying the most frequent
statements concerning the above-mentioned variables, and constructing measurement
scales for them. The preliminary survey was conducted in 2003 among 453 individuals
visiting four attractions located in the Wielkopolska Region (the New and Old Zoological
Motivation
Benefits Behavioural
intensions
Satisfaction
Attraction
features

43
Garden in Poznań, the National Museum of Agriculture and Food Processing Industry in
Szreniawa, and the Ethnographic Park of Wielkopolska in Dziekanowice) (Nowacki, 2005).
As a result of a factor analysis using VARIMAX rotation and a scale reliability analysis
(Cronbach's α), statements constituting measurement scales to be used in the main study
were identified.
The questionnaire was developed so that it could be filled in either by an interviewer
or by visitors on their own. The answers were evaluated using a five-point Likert scale.
Additionally, the questionnaire included questions concerning the visitors’ socio-
demographic features (see ANEX).
2.3.2. Procedure and study sample
It was decided that the hypotheses set forth in the present study would be verified based
on the example of four visitor attractions which have both national and international
significance and are located in the Wielkopolska and Kujawy regions. The attractions were
selected on account on their size, high attendance levels and diversified forms of
exhibition and heritage interpretation. During the selection process, attention was also
paid to the diversity of tourism infrastructure (souvenir stores, catering outlets, car parks,
toilet facilities, guided tours), the diversity of the subjects presented in the attraction and
the functional structure enabling visitors to explore the attraction site either on their own
(directional signs, maps and guide books) or as part of a guided tour.
The main study was carried out in the summer season of 2004, between June and
September (except for the Biskupin Festival, which took place on 18–26 September), on
various days of the week, among individuals aged 15 or more. The questionnaire study in
each attraction was conducted by two pre-trained interviewers. Visitors were asked to fill
in the questionnaire in the exit area after they had completed the visit. Sample selection
was done using the ‘first one at hand’ method: having interviewed one person, the
interviewer asked the next person available to fill in the questionnaire. It was assumed
that in order to perform statistical analysis, data from 300 visitors of each attraction
would be sufficient1. The rate of persons refusing to fill in the questionnaire ranged from
1 Hill and Alexander (2003, p. 122) claim that, in practice, if a survey study on customer satisfaction is based
on a sample of 200 or more (regardless of the overall size of the population), it is highly probable to yield an
acceptable level of accuracy, provided the sample is random.

44
15 to 41%, depending on the attraction (Table 2.1). Most refusals resulted from the lack
of time or from the need to follow a guided tour.
In the course of the study, 1770 completed questionnaires were obtained. Out of
these, 582 were filled in by visitors of the Archaeological Festival in Biskupin, 462 by
visitors of the National Museum of Agriculture in Szreniawa, 407 by visitors of the
Zoological Garden in Poznań (also known as the New Zoo) and 319 by visitors of the
Ethnographic Park of Wielkopolska in Dziekanowice.
Table 2.1. Number of questionnaires completed in each attraction and the number of
refusals
Attraction Number of completed
questionnaires Number of refusals Rate of refusals (%)
Archaeological Festival in
Biskupin 582 238 40,89
Museum of Agriculture in
Szreniawa 462 175 37,88
New Zoo in Poznań 407 108 26,53
Ethnographic Park in
Dziekanowice 319 50 15,67
Source: own research
2.3.3. Methods of data analysis
The study employed nominal scales of measurement for nonparametric data and interval
scales for parametric data.
Before starting the analysis, variable distribution normality was tested using a
Kolmogorov-Smirnov test and the significance of the Kolmogorov-Smirnov statistic value
was evaluated using Lilliefors probabilities. Since the distribution of all the analysed inter-
nal and ordinal variables was not normal, non-parametric tests were employed in data
analysis.
Kruskal-Wallis H test is a non-parametric alternative to the one-way ANOVA (anal-
ysis of variance). The test assumes that the analysed variable is continuous and that it was
measured on at least an ordinal (rank order) scale. The test assesses the hypothesis that
compared samples were drawn from the same distribution or from distributions with the
same median.

45
The grouping of visitors of similar features was done using cluster analysis. A k-
means cluster analysis was employed, which yields an assigned number of maximally dis-
tinct clusters. Although k-means clustering employs a non-parametric variance analysis
procedure, the number of cases, which exceeds 1000 in this case, makes it possible to use
it (StatSoft, Inc., 2001).
The distinctive features obtained by the k-means clustering method were ar-
ranged in contingency tables and the differences in frequencies between separate cate-
gories were calculated using Pearson’s χ2 test. Pearson’s χ2 test is one of the popular tests
for significance of the relationship between qualitative (categorical) variables, which al-
lows the measurements of expected frequencies in a two-way table. Since the only as-
sumption underlying the use of χ2 test is that the expected frequencies are not too small,
a requirement was imposed that each frequency should be at least 10 (StatSoft, Inc.,
2001).
Multivariate regression analysis was used in order to investigate the overall
influence of multiple independent variables – attraction features and visitor
characteristics – on the level of visitor satisfaction. By employing a stepwise regression
procedure it was possible to determine a set of independent variables that best describe
the dependent variable (e.g. explain the greatest proportion of the variation in the
dependent variable).
Two types of factor analysis were involved: explorative factor analysis (EFA) and
confirmatory factor analysis (CFA). The former was used to determine the factor structure
of measurement scales and to reduce the number of variables in the structural model.
Principal component analysis, VARIMAX rotation and a minimal eigenvalue of 1.0 were
employed. The acceptable minimum for factor loading was assumed to be 4.0
(Zakrzewska, 1994; Hair et al., 2006).
Confirmatory factor analysis was employed in order to test the adequacy of the
theoretical model against real data. The analysis is a part of the structural modelling
process and determines how hidden variables are identified and explained by observable
variables. It also allows for the estimation of the measurement properties of observable
variables (data reliability). The matching of the model to the data was tested using
absolute indicators: the χ2 test, GFI, AGFI and RMSEA (Sagan, 2003).
46
The reliability of the obtained measurement scales was assessed by Cronbach's α
coefficient, which is used as a measure of internal consistency of a measurement scale,
examining statistical properties of scale items individually and in relation to the overall
scale result (Brzezinski, 1996). It was assumed, in accordance with Hair et al. (2007), that
the value of Cronabach’s α should be at least 0.70, although in some cases it might
decrease to 0.60 or little less.
Structural equation modelling was used so as to determine the causal
relationships between variables (hidden factors) and the amount of unexplained variation
(Sagan, 2003). This method was developed based on path analysis (Joreskog & Sorbom,
1996; Hair et al. 2007). One advantage of the structural modeling is that it combines the
advantages of factor analysis and multivariate regression analysis.
Path analysis was used in order to trace the direction and strength of the influence
of independent variables on satisfaction and behavioural intentions. This method is often
employed in the analysis of cause-effect relationships, as it helps determine to what
extent a given cause determines a given effect. This is measured by path coefficients,
which are calculated as products of the β weights (regression coefficients) of all the
mediating pathways that form a complex pathway (Konys & Wiśniewski, 1984). The
method employs both simple path coefficients, which illustrate direct causality between
two variables, and complex path coefficients, which illustrate indirect causal effects. It
can also determine the overall causal impact by summing direct and indirect effects (Gaul
& Machowski, 1987).
The analysis of survey results showed that respondents tended to avoid giving
some answers. For this reason, it was necessary to decide how missing data should be
handled. Since casewise or pairwise deletion would lead to a major data loss, before
starting a regression/correlation analysis, cluster analysis and multivariate modelling, the
missing data was imputed by mean substitution (replacing all missing data in a variable by
the mean of that variable) (StatSoft, Inc., 2001).
2.3.4. Description of the studied attractions
2.3.4.1. Archaeological Festival in Biskupin
Biskupin lies in the Gniezno Lakeland, 5 kilometres east of the international road E5, 10
kilometres south of Żnin, on the Piast Tourist Route. The first Archaeological Festival took

47
place in the third week of September 1995 and was attended by 38 thousand visitors. The
2004 edition attracted more than 92’828 visitors over nine days.
The Festival is an implementation of the idea of a live open-air museum, applying the
principles of experimental archaeology. The leading theme is different every year. In 2004
(where the study was conducted) the festival took place on 18–26 September under the
theme of “Celts – people of Europe”. It featured live demonstrations of handicraft,
fighting tournaments, music and dance performances. Visitors had an opportunity to
taste regional and historical cuisines and buy souvenirs. During the festival, the museum’s
pavilion featured a permanent exhibition on the history of the Biskupin settlement and a
temporary exhibition titled “Celts – people of Europe”. There were also demonstrations
of Native American games, a re-enactment of a battle between a Roman legion and Celts,
Scottish and Irish dance and music performances and combats of early-Medieval warriors.
Visitors could also attend a dance workshop, a clay modelling competition, an art
competition and a pottery painting competition.
Spacious parking areas for cars and buses were designated in the fields adjacent to
the access road. They can accommodate all the numerous buses and cars of festival
visitors. The museum staff (in the ticket offices, at the exhibition site), performers and
security officers wear clearly visible ID badges. During the festival, souvenirs crafted on
the spot were available for sale in many points around the site. These include products of
leather, stone, bone and coloured metals, handmade using traditional methods. Because
of their material and the way of production, many visitors perceive them as authentic.
Additionally, there are several outlets near the entrance offering mass-produced
souvenirs, mainly bought by children on school trips. The ticket offices and the museum
building sell printed leaflets (although they were poorly exposed) and a small selection of
souvenirs. The museum exhibition is not specially adapted for children, but they can
engage in a number of varied activity forms, such as clay modelling, bow and crossbow
shooting, dance workshops, games and entertainment.
Catering services are available in buffets near the entrance and at the festival site,
in several outlets serving hot food and beverages. Additionally, at various thematic stands
visitors can taste traditionally baked pancakes, bread and traditionally brewed beer. The
main museum building houses modern toilet facilities. There are also additional portable
toilets placed around the festival site.

48
The main sources of information for visitors include conversations with the
performers in thematic stands, who wear historical costumes and answer visitors’
questions. Another source is Biskupin Newspaper, a newspaper published by the weekly
magazine Pałuki from Żnin. Every issue contains a map of the festival, a schedule for each
day and popular science articles on archeology and the festival theme. In 2004, a series of
articles on the Celtic culture were published. Other sources of information include guided
tours, interpretation panels and directional signs placed across the attraction.
2.3.4.2. National Museum of Agriculture and Food Processing Industry in Szreniawa
The museum is located 15 kilometres from Poznań, near the international road E5 from
Poznań to Wrocław, in the Wielkopolska National Park buffer zone. It covers an area of 10
hectares of a former manor park and farm, featuring historical buildings from the mid-
19th century. The museum presents exhibitions on the history of agriculture and food
processing in the Polish regions. The manor grounds also contain a pen with living farm
animals of various species.
Yearly attendance to the museum in 1990–2001 ranged between 13’000 and 24’000
visitors. Since 2002 it has gradually increased thanks to numerous events to reach 64’000
visitors in 2009.
The car park near the museum is spacious and normally free of charge, but a
parking fee is charged during special events. Separate areas for parking cars and buses
were designated. The employees who open the pavilions and watch exhibitions wear
overalls that do not correspond with the subject of the museum. That staff fails to
provide visitors with competent answers to their questions. The selection of thematic
literature at the ticket office is very limited and there are no relevant souvenirs available
whatsoever. The exhibition is not specially adapted to children, but during special events
the museum provides forms of activity addressed to children, including games, plays,
handicraft workshops, etc. There are two catering outlets in the museum grounds: a
styleless buffet in the basement of the administrative building and an interesting beer inn
located in the cellars of a historical bailiff’s house (its interior design is enhanced by an
exhibition on the history of brewing). The inn is often closed. Toilet facilities are located in
the buffet and in the beer inn.

49
Museum exhibitions feature a number interpretation panels with a large amount
of text. The panels not only explain the purpose of the interpreted themes, but also
present production processes, cultural transformations in the countryside and the
environmental and economic aspects of agriculture. Almost all exhibits have information
signs. There are no interactive exhibitions that would encourage visitors to educational or
recreational activity. The museum lacks forms of interpretation addressed to children and
does not seem to engage children through entertainment, except during periodic festivals
and classes.
There is an exhibition layout plan near the entrance and a number of directional
signs around the museum. A guide brochure with information on museum exhibitions is
available in the reception. Visiting groups can take a tour with a guide.
2.3.4.3. New Zoo in Poznań
The New Zoo was opened on 17 September 1974. It occupies 117 hectares of naturally
and scenically rich terrain in the eastern part of the city. Enclosures are arranged so as to
resemble the natural habitat of its animals. One of the most interesting ones is the
Siberian tiger enclosure, built in 2002. There is a special area designated for children
(Children Zoo), which includes a playground, several pens with domestic animals and a
small garden, where children can touch and play with animals.
Yearly attendance to the New Zoo in Poznań constantly increases: from approx.
110’000 visitors in 2000–2001 to 210’000 visitors in 2008.
There are three marked routes in the Zoo: black (5.3 km long), blue (2 km) and red
(2.7 km). Due to the extensive area and considerable distances between enclosures,
visitors can travel around the Zoo grounds by the tourist bus Zwierzynka. The narrow
gauge railway Maltanka operates between the Śródka Roundabout (Rondo Śródka) and
the Zoo, which makes it a popular destination for school trips.
There is a spacious payable car park near the Zoo entrance. Visitors only have
contact with the staff in the ticket offices and at the entrance. The animal staff is invisible
to the public except when feeding or tending to the animals. The store with souvenirs and
publications, located near the entrance, offer a fairly wide choice of products, especially
animal-like toys. The Children Zoo includes a playground and pens with domestic animals
which children can touch. The pens have labels written in an amusing and easily
50
understandable way. There are many information plates around the Zoo addressed to
children, including sliding plates, hinged plates and plates with thought-provoking
questions. A styleless pavilion houses a bar providing a limited food menu. During the
summer season, another bar operates under a stylish wooden canopy, but it is located far
away from the entrance. Toilet facilities near the entrance are spacious and clean, but
those inside the Zoo tend to be neglected or closed. After the study was completed,
another catering outlet was opened in the African Village next to the Elephant House.
2.3.4.4. Ethnographic Park of Wielkopolska in Dziekanowice
The Ethnographic Park of Wielkopolska is an open-air museum located on the Piast
Tourist Route, 35 kilometres from Poznań, by the international road E5 towards Gniezno.
It covers an area of 2 hectares by Lake Lednica, near the Ostrów Lednicki island. It is a
branch of the Museum of First Piasts in Lednica. The museum was open to the visiting
public on 1 June 1982.
Yearly attendance ranges between 40 and 50 thousand visitors, with the highest
attendance during the late Spring/Summer season: in May, June and July.
The museum exhibits a reconstruction of a Wielkopolska village from the mid—
19th century, mainly consisting of cottages, livestock buildings and barns which make up
farms of various sizes centred around an oval shaped open place. Along with a manor and
farm complex, rural craft constructions and an 18th-century church, it closely imitates the
spatial arrangement of a real village from the period. Building interiors are fully fitted and
equipped with the appliances, kitchenware, tools and clothes illustrating the living
conditions and habits of families of various professions.
Various forms of heritage interpretation are employed on the museum grounds,
from directional signs to interpretation panels. The farms are marked with plates
informing about the origin and the time when a particular building was constructed. Since
it is the only form of interpretation available on the farms, the purpose of specific
appliances and objects placed inside remains obscure for those unfamiliar with the rural
culture or visiting the museum without a guide. During the study, one of the few
interpretation panels was placed in front of the Olęder farm with information in three
languages about the details of Olęder colonisation in Wielkopolska. At the time of the
study, there were also two fairly well interpreted exhibitions in the museum: a temporary

51
exhibition in the lumber room and a permanent exhibition at the mill. The first one was
titled “On the catafalque they shall lay him, to the cemetery they shall bear him, in the
ground they shall bury him. Death in old rural communities” and interpreted the problem
of death in a traditional rural community. The other exhibition, titled “Man and nature in
the history of Ostrów Lednicki”, presents natural and cultural transformations of the
Lednica Landscape Park from the earliest times until the present day. The exhibition has a
rather modern design, featuring a number of richly illustrated panels, large-format
photographs and a diorama with stuffed specimens of the animals native to the Park.
Many of the panels contain large portions of text without any illustrations.
There is a souvenir store in the reception building, where visitors can buy
publications on the museum and related subjects. During outdoor events, performers
present various forms of rural craft and handiwork and exhibit their own products, which
include every-day utensils.
Apart from the permanent exhibition, the museum holds various events, the most
popular of which include the “Live Open-Air Museum” in the first Sunday of Summer, the
“Marzanna Drowning Ritual”, the Corpus Christi procession and the “Farewell to the
Summer” in mid-September. The museum also organises classes. Visiting groups can
arrange a guided tour.
There is a spacious parking area for cars and buses near the entrance. The
personnel in the ticket offices and on the exhibition grounds wear folk costumes. The
staff provide visitors with information on the purpose of the rural appliances on the
farms. A wide selection of publications on rural issues is available in the ticket office
building, but the choice of souvenirs is limited. The exhibition is not adapted for children,
except for a see-saw and a sandpit located in the village centre. During events held in the
museum, children can engage in various games and activities. The only bar is placed in a
brick building near the entrance. During events, visitors can taste rural cuisine on special
stands and on the farms. Toilet facilities are only available in the brick building near the
entrance.
2.3.5. Characteristics of the studied sample
Most of the visitors surveyed in the study were females (almost 60%) (Table 2.2). The
male portion of respondents was highest in the Zoo (47%) and lowest in Biskupin (35%).

52
The largest age group was that of persons aged 26–35 (more than one fourth)
while the smallest was that of persons aged 65 or more. Almost 2/3 of respondents were
less than 36 years old. There were significant differences between the attractions in
terms of visitor age. Most teenagers visited the Archaeological Festival in Biskupin, which
resulted from the prevalence of school trips, as the school year had just began. It is worth
noting that visitors of ‘parental’ age prevailed in the Zoo, while those of a more mature
age predominated in Szreniawa and Dziekanowice.
In terms of professional profile, the most numerous group consists of managers
and specialists (37%). This is the largest group among the visitors of Dziekanowice, the
zoo and Szreniawa (53%, 44% and 41%, respectively). In the other facilities, the public is
dominated by schoolchildren and students. The third most considerable group is that of
blue and white-collar workers (15%). As for the remaining professional groups, it might be
interesting to note that the rate of farmers and labourers in the Museum of Agriculture in
Szreniawa is considerably higher compared to the other attractions.
With regard to education, the largest group is those of persons with higher and
incomplete higher education (including students), who constitute almost a half of all the
visitors (49%). The second largest group included visitors with secondary education (23%).
The vocational education group is least represented.
The largest proportion of respondents live in large cities with a population of 500
thousand or more. The only exception to this are visitors of Biskupin, which lies in the
greatest distance from a large city (85 kilometres from Poznań). Most visitors (39%) live
less than one hour’s drive from the visited attraction (up to 50 kilometres away).

53
Table 2.2. Socio-demographic features of the studied sample (in %)
Feature Festival Museum of Agriculture
Zoo Ethnographic
Park All sites
Gender
Female 65.46 53.68 52.71 60.50 58.59
Male 34.54 46.32 47.29 39.50 41.41
Age
15–18 44.40 4.34 3.69 4.70 17.31
19–25 21.00 12.15 21.37 11.60 16.85
26–35 14.80 27.55 42.26 33.85 27.71
36–45 8.43 20.17 14.74 22.89 15.55
46–55 7.06 19.31 11.30 15.36 12.73
56–65 2.24 14.97 4.91 9.40 7.47
65 + 2.24 2.17 2.70 2.51 2.37
Socio-professional group
Managers/specialists 22.44 41.11 44.33 53.44 37.99
Private entrepreneurs 0.91 2.77 1.56 0.33 1.43
Farmers 1.09 4.16 0.26 0.98 1.67
Labourers 6.76 18.94 12.62 12.79 12.37
Blue and white-collar work. 10.95 18.71 21.64 16.39 16.43
Homemakers 0.19 0.69 0.00 0.33 0.29
Retirees and pensioners 0.54 2.31 3.35 3.61 2.21
Schoolchildren and students 57.12 11.08 15.98 12.13 27.48
Unemployed 0.00 0.23 0.26 0.00 0.13
Education
Primary 45.52 6.11 5.93 5.36 18.92
Vocational 4.14 13.32 9.88 8.20 8.58
Secondary/post-secondary 15.86 32.75 31.84 26.50 25.85
College/ University 34.48 47.82 52.35 59.94 46.65
Size of the place of residence
Village 24.60 24.34 9.36 13.52 18.95
Town < 100’000 of citizens 39.22 19.96 33.26 33.33 31.72
101’000– 500’000 22.64 1.53 6.89 9.75 11.08
500’000 and more 13.54 54.17 50.49 43.40 38.25
Distance between the attraction and place of residence
0 0.74 3.32 47.89 0.0 17.15
1–50 km 18.18 79.86 20.00 62.98 39.10
51–100 km 35.25 6.16 7.37 11.42 15.61
100 km and more 45.82 10.66 24.73 25.60 28.14

54
This value strongly differs between the attractions, reaching the highest for the
Museum of Agriculture (80%) and the Ethnographic Park (63%). In the first case, most
visitors come from Poznań, and in the latter one, from Poznań and Gniezno. Residents of
Poznań also predominate among visitors to the Zoo (48%). The greatest power of
attracting visitors from distant places is found in the Biskupin Festival (almost a half of its
visitors travel more than 100 kilometres) and the weakest in the Museum of Agriculture
in Szreniawa (only 11% of visitors do so).
Table 2.3. Characteristics of the visitors (in %)
Characteristic Festival Agriculture
Museum Zoo
Ethnographic Park
Total
Are you on a trip longer than one day?
Yes 17.93 10.87 10.81 17.03 14.56
No 82.07 89.13 89.19 82.97 85.44
Composition of the visiting group
Alone 4.47 3.03 1.73 1.58 4.68
With a friend or a spouse 28.35 44.59 31.44 45.74 39.14
Organised group 54.29 7.14 4.45 11.04 21.93
Family with children 12.89 45.24 62.38 41.64 34.25
Is this your first visit here?
Yes 26.69 54.01 31.70 55.66 39.76
No 73.31 45.99 68.30 44.34 60.24
How many times have you visited a
similar place over the last 12 months?
0 44.35 33.48 29.31 30.35 35.52
1 25.04 20.35 31.03 29.07 25.92
2 14.09 16.19 19.95 23.96 17.76
3 7.65 14.44 8.87 8.95 9.94
4 or more 8.87 15.54 10.84 7.67 10.86
Interest in the subject of the attraction
Very low 2.76 4.12 0.25 1.25 2.28
Low 14.68 11.50 2.50 10.03 10.23
Average 52.16 51.19 46.75 47.34 49.80
High 21.07 21.04 36.75 30.72 26.38
Very high 9.33 12.15 13.75 10.66 11.31
Source: own research

55
More than 85% of respondents were one-day visitors (Table 2.3). Most tourists
visited Biskupin and the Ethnographic Park (approx. 17% in both cases). In the other
attractions, the Zoo and Museum of Agriculture in Szreniawa, the proportion of tourists
was considerably lower (approx. 10%). Visitors of all the attractions tend to come with
friends or family (73%). The most popular family destination was the Zoo, with 62% of its
visitors being families with children. Biskupin, on the other hand, was the most popular
trip destination: more than a half of its visitors were part of an organised trip.
Respondents’ interest in the subject of the attraction was investigated using three
questions. The first one, Is this your first visit here, was answered positively by 40%
respondents. First-time visitors constituted more than a half of the visitors of the
Ethnographic Park and the Museum of Agriculture. The highest rate of repeat visitors was
observed in Biskupin (73%) and the Zoo (68%). More than a third of respondents had
never visited a similar place before and more than a half had not been to a similar place
more than once. The highest level of interest in the attraction subject was observed
among visitors of the Zoo: more than half of them declared a high or very high level of
interest in animals. The lowest level of interest was found among visitors of Biskupin: only
30% declared a high or very high level of interest.
2.4. Results
2.4.1. Knowledge gained from the visit
Most of the visitors of Biskupin and the Museum of Agriculture could not answer even a
one questions to which they had not known the answer beforehand (i.e. before the visit)
(Table 2.4). A similarly poor result was found in those visiting the Zoo (48%). Among the
visitors of the Ethnographic Park, the result was considerably better: only 15% failed to
give any one correct answer.
In order to find out which of the visitor features correlate with the level of
knowledge gained from the visit, a series of Mann-Whitney U tests and Kruskal-Wallis H
tests were performed (Table 2.5). The first feature to be verified was gender. No
significant differences in terms of acquired knowledge were found between males and
females.
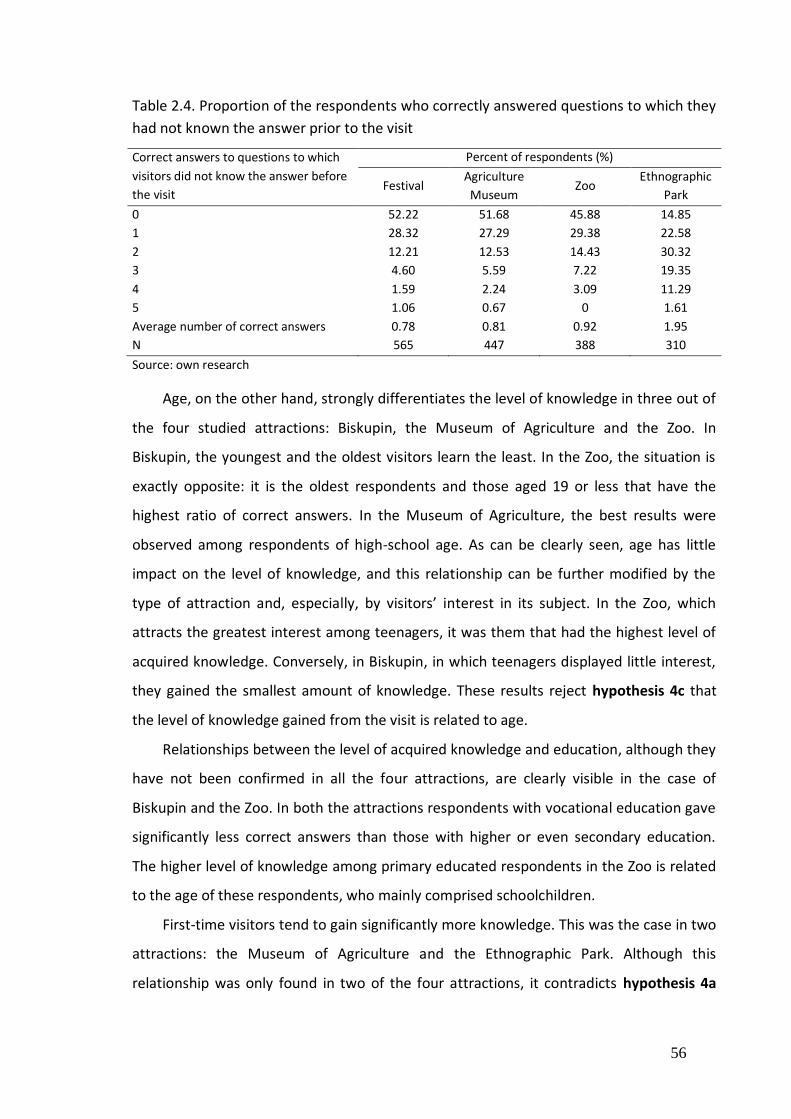
56
Table 2.4. Proportion of the respondents who correctly answered questions to which they
had not known the answer prior to the visit
Correct answers to questions to which
visitors did not know the answer before
the visit
Percent of respondents (%)
Festival Agriculture
Museum Zoo
Ethnographic
Park
0 52.22 51.68 45.88 14.85
1 28.32 27.29 29.38 22.58
2 12.21 12.53 14.43 30.32
3 4.60 5.59 7.22 19.35
4 1.59 2.24 3.09 11.29
5 1.06 0.67 0 1.61
Average number of correct answers 0.78 0.81 0.92 1.95
N 565 447 388 310
Source: own research
Age, on the other hand, strongly differentiates the level of knowledge in three out of
the four studied attractions: Biskupin, the Museum of Agriculture and the Zoo. In
Biskupin, the youngest and the oldest visitors learn the least. In the Zoo, the situation is
exactly opposite: it is the oldest respondents and those aged 19 or less that have the
highest ratio of correct answers. In the Museum of Agriculture, the best results were
observed among respondents of high-school age. As can be clearly seen, age has little
impact on the level of knowledge, and this relationship can be further modified by the
type of attraction and, especially, by visitors’ interest in its subject. In the Zoo, which
attracts the greatest interest among teenagers, it was them that had the highest level of
acquired knowledge. Conversely, in Biskupin, in which teenagers displayed little interest,
they gained the smallest amount of knowledge. These results reject hypothesis 4c that
the level of knowledge gained from the visit is related to age.
Relationships between the level of acquired knowledge and education, although they
have not been confirmed in all the four attractions, are clearly visible in the case of
Biskupin and the Zoo. In both the attractions respondents with vocational education gave
significantly less correct answers than those with higher or even secondary education.
The higher level of knowledge among primary educated respondents in the Zoo is related
to the age of these respondents, who mainly comprised schoolchildren.
First-time visitors tend to gain significantly more knowledge. This was the case in two
attractions: the Museum of Agriculture and the Ethnographic Park. Although this
relationship was only found in two of the four attractions, it contradicts hypothesis 4a

57
that repeat visitors gain more knowledge from the visit than first-time visitors. This
hypothesis must be therefore be rejected.
Table 2.5. Differences between groups in the level of acquired knowledge
Features
Average score on the 5-question quiz
Festival Museum of Agriculture
Zoo Ethnographic
Park
Gender
Female 0.826 0.873 0.956 1.942
Male 0.701 0.748 0.886 1.943
p (U test) 0.38 0.36 0.39 0.94
Age
Up to 19 0.566 0.895 2.214 2.333
19-25 0.883 1.302 0.927 2.189
26-35 1.108 0.765 0.906 1.906
36-45 0.761 0.780 0.862 2.043
46-55 1.075 0.698 0.674 1.783
56-65 1.273 0.676 0.750 1.700
65 and more 0.692 0.900 1.091 1.429
p (H test) 0.005 0.028 0.001 0.48
Education
Primary 0.595 0.815 1.957 2.235
Vocational 0.417 0.596 0.425 1.538
Secondary/post-secondary 1.077 0.965 0.920 1.741
College/ university 0.942 0.778 0.904 2.059
p (H test) 0.0002 0.15 0.0001 0.091
Is this the first visit to the attraction?
Yes 0.901 0.942 1.016 2.116
No 0.748 0.663 0.879 1.708
p (U test) 0.16 0.007 0.20 0.005
Are you on a trip longer than one day?
Yes 0.933 1.125 0.829 1.765
No 0.747 0.779 0.934 1.977
p (U test) 0.16 0.21 0.53 0.13
Similar places visited over the last 12 months
0 0.776 0.894 0.929 2.152
1 0.871 0.807 0.949 1.876
2 0.779 0.873 0.936 1.740
3 or more 0.696 0.674 0.872 1.940
p (H test) 0.63 0.22 0.87 0.27
Source: own research

58
No significant differences in the level of acquired knowledge were found between
tourists (people on trips lasting longer than 1 day) and one-day trippers. This refutes
hypothesis 4b. Having visited a similar place recently and the interest in the subject of the
attraction have no bearing on the level of knowledge, either. No significant differences
between groups in this respect were observed in any of the attractions, which means
hypothesis 4d must be rejected as well.
Table 2.5 (continued). Differences between groups in the level of acquired knowledge
Features
Average score on the 5-question quiz
Festival Museum of Agriculture
Zoo Ethnographic
Park
Interest in the subject of the attraction
Very low 0.813 0.889 0.000 2.000
Low 1.083 0.962 0.400 2.161
Average 0.752 0.860 0.835 1.973
High 0.726 0.717 1.022 1.938
Very high 0.529 0.643 1.094 1.613
p (H test) 0.13 0.24 0.22 0.62
Source: own research
2.4.2. The quality of experiences as an indicator of satisfaction
The structure of answers to questions concerning the quality of experiences from visiting
the attractions is presented in Table 2.6. All the attractions covered in this study turned
out to be moderately interesting or very interesting to visitors. The highest level of
interest was observed in the Zoo (x = 4.75) and the Ethnographic Park (x = 4.74), and the
lowest in Biskupin (x = 4.16). The overall assessment of the attractions was positive: a
strong majority of respondents assessed the visited attraction as interesting or very
interesting.
Visitors found the Ethnographic Park in Dziekanowice to be the most relaxing
attraction (x = 4.49). Its scenic location in open countryside by Lake Lednica and the
presence of authentic rural buildings provide visitors with excellent conditions for rest
and relaxation. The Museum of Agriculture is not far behind in this respect (x = 4.35), as it
occupies a wide area resembling a city park with numerous alleys for strolling. The least
relaxing attraction was the Festival in Biskupin (x = 3.72). This should not surprise, as it is
rather difficult to relax during an event attended by several thousand visitors every day.

59
With the overall attendance of over 90 visitors throughout the entire Festival, as many as
10 thousand visitors on weekdays and 15 thousand on weekends can visit the Festival
grounds at a time. This makes it difficult to see many presentations, combat shows and
dance and music performances.
The most pleasant attraction was the Zoo (x = 4.82). Visitors were very unanimous
in this respect (δ = 0.62). This emphasized the spatial, landscape and organisational
qualities of the zoological garden. The Biskupin Festival was at the other end of the scale
(x = 4.01), with a relatively large divergence in rating (δ = 1.10).
Table 2.6. Quality of visitors’ experiences
Experiences Festival
Museum of Agriculture
Zoo Ethnographic
Park
x δ x δ x δ x δ
Interesting – Boring 4.16 1.08 4.52 0.86 4.75 0.66 4.74 0.61
Relaxing – Tiring 3.72 1.12 4.35 0.89 4.07 1.33 4.49 0.79
Pleasant – Frustrating 4.01 1.10 4.50 0.86 4.82 0.62 4.64 0.74
Source: own research
The measurement scale for the level of satisfaction was comprised of three pairs
of adjectives evaluated using the semantic differential. The arithmetic mean of the three
items constituted a synthetic index of the level of satisfaction. The reliability of the
measurement scale proved high, with Cronbach’s α at 0.78 (Brzeziński,1996, p. 473).
Table 2.7. Distribution of the level of satisfaction variable
Festival Museum of Agriculture
Zoo Ethnographic
Park All sites
Mean 3.97 4.46 4.54 4.62 4.34
Median 4.00 4.66 5.0 4.83 4.67
Standard deviation 0.90 0.71 0.70 0.56 0.80
Skewness -0.67 -1.74 -1.96 -2.71 -1.40
Minimum 1.0 1.0 1.0 1.0 1.0
Maximum 5.0 5.0 5.0 5.0 5.0
H=184.22; p < 0.01 Source: own research
The satisfaction level index was highest among visitors of the Ethnographic Park (x
= 4.62) and lowest in Biskupin (x = 3.97) (Table 2.7). This means that the resultant rate of

60
the three adjective pairs is highest in Ethnographic Park in Dziekanowice, which indicates
that the Ethnographic Park is most interesting, relaxing and pleasant to the average
visitor. At the same time, visitors are very unanimous in their rating, which is evident in
the lowest standard deviation (σ = 0.56). The distribution of the level of satisfaction
variable is skewed to the left, which indicates that most respondents chose above-the-
average values.
2.4.3. Behavioural intentions
3.4.3.1. Word of mouth
The majority of respondents expressed willingness to recommend the visited attraction to
others: 77% in the Zoo and 60% in the Ethnographic Park (Table 2.8). In the other two
attractions, the rate of satisfied visitors was also very high and ranged around 50% (42%
in Biskupin; 52% in the Museum of Agriculture). The mean value of all answers was
highest in the Zoo (x = 4.69) and lowest in the Museum of Agriculture (x = 4.48). This
indicates that respondents perceive the Zoo as most worth recommending. Despite minor
differences, the attractions’ visitors differ significantly, as can be implied from Kruskal-
Wallis H test (H = 108.31, p < 0.001) and Mann-Whitney U test (U = 48390.50, p < 0.001
between the Zoo and Ethnographic Park visitors).
Table 2.8. Answers to the question Will you recommend the … to your friends?
Answers Festival
Museum of Agriculture
Zoo Ethnographic
Park
n
%
n % n % n %
Definitely yes 240 42.9 226 52.43 298 77.00 181 60.13
Probably yes 284 50.7 188 43.61 65 16.79 114 37.87
Neither yes nor no 23 4.1 12 2.78 10 2.58 3 0.99
Probably no 7 1.3 2 0.46 9 2.32 1 0.33
Definitely no 5 0.9 1 0.23 1 0.25 2 0.66
Mean 4.34 4.48 4.69 4.56
Standard deviation 0.70 0.60 0.66 0.61
Kruskal-Wallis H test H = 108.31; p < 0.0001
Source: own research
There were relatively few answers to the second part of the question concerning
the willingness to recommend the attraction, which was the open question If not, why?
This probably resulted from the fact that the vast majority of respondents were satisfied

61
from the visit and expressed willingness to spread word of mouth. The number of the
respondents who were unwilling to recommend the visited attraction ranged from 3 in
the Museum of Agriculture and the Ethnographic Park to 12 in Biskupin. Slightly more
respondents expressed critical remarks on the tourism product of the attractions.
Archaeological Festival. 12 respondents answered probably no or definitely no, of which
only 5 justified their answers. They reported the following factors that discouraged them
from recommending the attraction: boring and uninteresting exhibitions, few craftsmen
and no swords purchase, expensive tickets. The reluctance to answer the open question
partly resulted from the lack of time, since many respondents visited the festival as part
of an organised group and had to follow others.
Ethnographic Park. Only three respondents would not recommend the museum to
friends and 5 respondents pointed out negative elements: lack of live animals (including
livestock), lack of information in English, lack of staff wearing folk costumes, poor
information from the staff and custodians (the staff was taciturn and took no initiative in
making contact with visitors), lack of the opportunity to visit some areas or take indoor
classes.
Museum of Agriculture. Only three visitors of the Museum of Agriculture in Szreniawa
would not recommend it to friends, but six respondents reported negative attributes of
the attraction product: static exhibitions, lack of labels on outdoor exhibits, incomplete
and neglected tractors, uninteresting and passive way of presenting exhibitions, vague
descriptions of exhibits, lack of dates, old exhibits mixed with newer or even reconstructed
ones, some technologies and appliances may be completely obscure to visitors unfamiliar
with the topic (agriculture, ethnography), lack of a fast food bar.
New Zoo. Most reservations about the attraction product were expressed by visitors of
the New Zoo: as many as 10 persons would not recommend the Zoo to their friends, and
12 persons reported complaints about the attraction product. Most of them pointed out
the lack of some animals (especially the elephants, hippopotamus, terrarium and fish) (15
persons) and poorly marked trails (no information on time and distance to specific

62
enclosures and to the exit, unclear signs – one person got lost) (15 persons),
communication problems (long waiting in the queue, no stops, no guide in the queue, to
extensive area, too large distances between enclosures) (4 persons), infrastructure-
related problems (too few benches, toilets, restaurants, catering outlets) (4 persons), and
too high fences making it difficult for small children to watch animals and high prices (1
persons each).
3.4.3.2. Revisit intentions
The second indicator of behavioural intentions towards the attraction was the answer to
the question Would you like to visit … again? Like in the previous question, most
respondents expressed their will to visit the attraction again, but there were much fewer
definitely yes answers. Most persons would definitely like to revisit the Zoo (57%) (Table
2.9). The analysis of mean values from the answers gives similar results: the highest
mean was found in the Zoo (x = 4.67). As in the case of recommendation, there is a
significant statistical difference between the attractions’ visitors (H = 163.8; p < 0.001; U =
70737.0; p < 0.01 between the Zoo and Biskupin).
Table 2.9. Answers to the question Would you like to visit … again?
Answers Festival
Museum of Agriculture
Zoo Ethnographic
Park
n % n % n % n %
Definitely yes 236 42.14 167 38.74 291 75.19 115 38.21
Probably yes 255 45.53 205 47.56 79 20.41 152 50.49
Neither yes nor no 41 7.32 36 8.35 0 0 25 8.30
Probably no 20 3.57 11 2.55 13 3.36 4 1.32
Definitely no 7 1.25 11 2.55 2 0.52 2 0.66
Mean 4.24 4.17 4.67 4.24
Standard deviation 0.83 0.88 0.69 0.72
Kruskal-Wallis H test H =139.29; p < 0.001
Source: own research
3.4.3.3. Willingness to pay
The third indicator of behavioural intentions was the willingness to pay the admission fee.
Respondents were asked to specify the highest price they would be willing to pay for the

63
ticket. The highest price was specified by visitors of Festival in Biskupin (10.7 PLN2), and
the lowest in Szreniawa (7.37 PLN) (Table 2.10). Almost in every attraction, visitors were
willing to pay more than the actual price of the ticket. Admission fees to the attractions
were as follows: 10 PLN for the Biskupin Festival, 5 PLN for the Museum in Szreniawa, 9
PLN for the Zoo in Poznań and 6 PLN for the Ethnographic Park in Dziekanowice.
Table 2.10. Answers to the question What is the highest price you would be willing to pay
for admission to…?
Answers Festival Museum of Agriculture
Zoo Ethnographic
Park
Average willingness to pay 10.70 7.36 9.43 9.07
Actual admission fee 10.0 5.0 9.0 6.0
Difference (WTP – actual fee) 0.70 2.36 0.43 3.07
Median 10.0 7.0 10.0 9.0
Standard deviation 7.37 3.69 3.76 4.43
N 518 411 388 290
Source: own research
The largest difference between the actual admission fee and visitors’ willingness
to pay was found in Dziekanowice: 3.07 PLN, and the lowest in Biskupin: only 0.7 PLN.
Visitors of Biskupin were definitely most differentiated with regard to their willingness to
pay: the standard deviation in this case was as high as 7.36 PLN.
2.4.4. Analysis of subject-related determinants of satisfaction
2.4.4.1. Socio-demographic features
Gender. Differences in the level of satisfaction between genders are very small. In the
studied sample, a slightly higher level of satisfaction was observed for males than females
(Table 2.11). However, the difference was statistically insignificant. The only statistically
significant difference in the level of satisfaction between females and males was found
among visitors of the Ethnographic Park. The difference between average level of
satisfaction among females and males was significant at p < 0.001.
This relationship needs further analysis, as it confirms tendencies observed by other
researchers (Sparks, 2000; Spinks et al., 2005).
2 1 EUR = 4.37 PLN (as of September 2004).

64
Table 2.11. Level of satisfaction and gender
Gender Festival Museum of Agriculture
Zoo Ethnographic
Park Total
Female 3.94 4.46 4.51 4.73 4.33
Male 3.98 4.47 4.61 4.49 4.37
Mann-Whitney U test 34254.0 22509.0 18038.00 7952.5 334522.0
p value (U test) 0.62 0.74 0.68 0.001 0.57
Source: own research
The higher level of satisfaction among females than males may be influenced by
the fact that females tend to visit attractions with children more often (Spinks et al.,
2005). Subsequent tests were performed in order to validate this hypothesis (Table 2.12).
Table 2.12. The level of satisfaction and intervening variables (visitors of the Ethnographic
Park)
Gender Persons visiting the
attraction with children
Persons who rated the intention to show the kids
something new as very important
Persons who rated the intention to spend a nice time with the
family as very important
Females 4.73 (n = 76) 4.73 (n = 46) 4.72 (n = 67)
Males 4.55 (n = 53) 4.65 (n = 65) 4.54 (n = 102)
Mann-Whitney U 1707.5 1321.0 2684.5
p value (U test) 0.14 0.30 0.018
Source: own research
The levels of satisfaction among females and males visiting the ethnographic park
in family groups with children and driven by different motives were compared. The first
two tests yielded no significant inter-group differences. The intervening variable turned
out to be the motive of spending time with children. Those females who rated this motive
as important displayed a significantly higher level of satisfaction compared to other
females.
These relationships partly support hypothesis 1b: females strongly motivated by
the intention to spend time with children, experience higher levels of satisfaction in some
attractions. Out of the four studied attractions, only results for the Ethnographic Park give
evidence for the validity of this hypothesis.
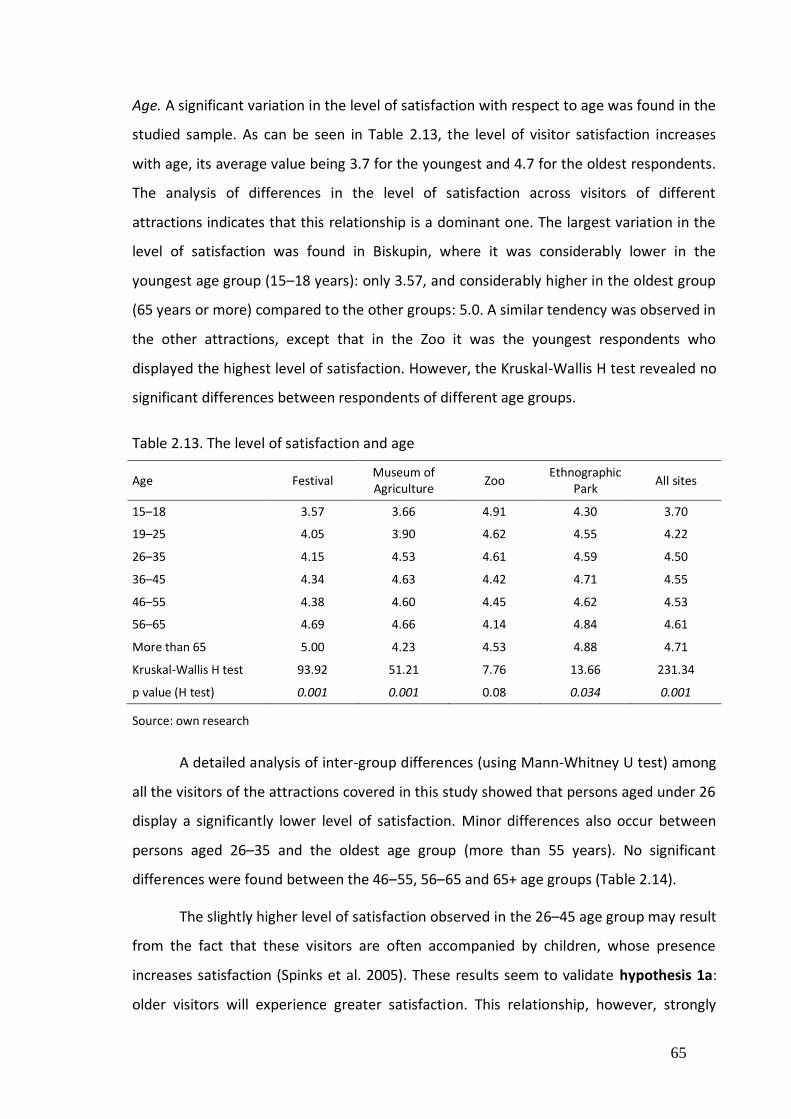
65
Age. A significant variation in the level of satisfaction with respect to age was found in the
studied sample. As can be seen in Table 2.13, the level of visitor satisfaction increases
with age, its average value being 3.7 for the youngest and 4.7 for the oldest respondents.
The analysis of differences in the level of satisfaction across visitors of different
attractions indicates that this relationship is a dominant one. The largest variation in the
level of satisfaction was found in Biskupin, where it was considerably lower in the
youngest age group (15–18 years): only 3.57, and considerably higher in the oldest group
(65 years or more) compared to the other groups: 5.0. A similar tendency was observed in
the other attractions, except that in the Zoo it was the youngest respondents who
displayed the highest level of satisfaction. However, the Kruskal-Wallis H test revealed no
significant differences between respondents of different age groups.
Table 2.13. The level of satisfaction and age
Age Festival Museum of Agriculture
Zoo Ethnographic
Park All sites
15–18 3.57 3.66 4.91 4.30 3.70
19–25 4.05 3.90 4.62 4.55 4.22
26–35 4.15 4.53 4.61 4.59 4.50
36–45 4.34 4.63 4.42 4.71 4.55
46–55 4.38 4.60 4.45 4.62 4.53
56–65 4.69 4.66 4.14 4.84 4.61
More than 65 5.00 4.23 4.53 4.88 4.71
Kruskal-Wallis H test 93.92 51.21 7.76 13.66 231.34
p value (H test) 0.001 0.001 0.08 0.034 0.001
Source: own research
A detailed analysis of inter-group differences (using Mann-Whitney U test) among
all the visitors of the attractions covered in this study showed that persons aged under 26
display a significantly lower level of satisfaction. Minor differences also occur between
persons aged 26–35 and the oldest age group (more than 55 years). No significant
differences were found between the 46–55, 56–65 and 65+ age groups (Table 2.14).
The slightly higher level of satisfaction observed in the 26–45 age group may result
from the fact that these visitors are often accompanied by children, whose presence
increases satisfaction (Spinks et al. 2005). These results seem to validate hypothesis 1a:
older visitors will experience greater satisfaction. This relationship, however, strongly

66
depends on the type of attraction. While older individuals tend to derive greater
satisfaction from visiting attractions such as museums of technology (Szreniawa) or
archaeological festivals, some attractions, including zoological gardens, are more
attractive for younger visitors.
Table 2.14. Detailed analysis of inter-group differences for all the attractions (p values of
Mann-Whitney U test)
Age 19–25 26–35 36–45 46–55 56–65 More than 65
15–18 0.001 0.001 0.001 0.001 0.001 0.001
19–25 0.001 0.001 0.001 0.001 0.001
26–35 0.13 0.46 0.036 0.043
36–45 0.58 0.48 0.21
46–55 0.26 0.14
56–65 0.36
Source: own research
Education. Also the next visitor feature, which is the level of education, has a significant
relationship to the level of satisfaction in three out of the four studied attractions: the
Festival, the Museum of Agriculture and the Zoo. The conducted study indicate that the
level of visitor satisfaction increases with education (Table 2.15).
Table 2.15. The level of satisfaction and education
Education Festival Museum of Agriculture
Zoo Ethnographic
Park All sites
Primary 3.60 3.92 4.54 4.35 3.76
Vocational 4.11 4.62 4.18 4.74 4.43
Secondary/post-secondary 4.25 4.52 4.55 4.62 4.48
College/ University 4.23 4.45 4.62 4.64 4.46
Kruskal-Wallis H test 62.58 13.15 9.15 3.35 182.55
p value (H test) 0.001 0.004 0.03 0.32 0.001
Source: own research
The only exception to this is the Zoo, where primarily educated individuals (mostly
the youngest ones) display an extremely high level of satisfaction. A detailed analysis of
inter-group differences only showed differences between primary educated respondents
and the other education groups. No differences in the level of satisfaction were observed
between respondents with vocational, secondary and college/university education (Table
2.16), which suggests that the variable determining this relationship is age.
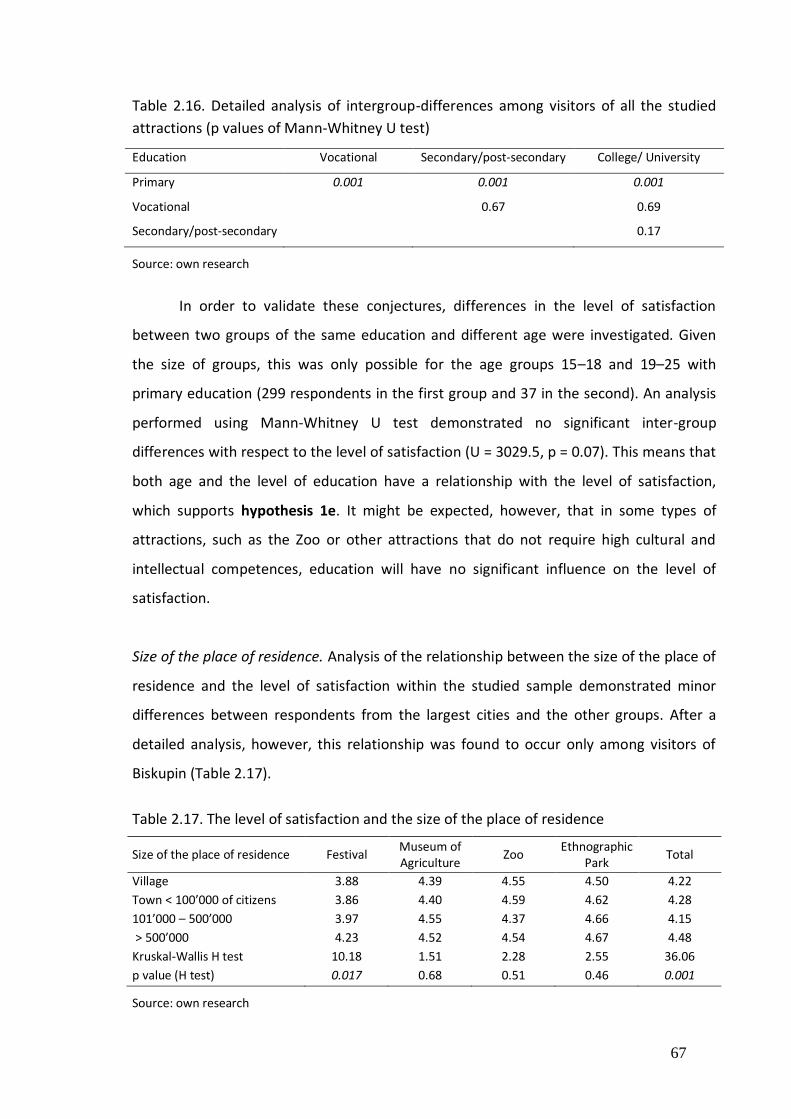
67
Table 2.16. Detailed analysis of intergroup-differences among visitors of all the studied
attractions (p values of Mann-Whitney U test)
Education Vocational Secondary/post-secondary College/ University
Primary 0.001 0.001 0.001
Vocational 0.67 0.69
Secondary/post-secondary 0.17
Source: own research
In order to validate these conjectures, differences in the level of satisfaction
between two groups of the same education and different age were investigated. Given
the size of groups, this was only possible for the age groups 15–18 and 19–25 with
primary education (299 respondents in the first group and 37 in the second). An analysis
performed using Mann-Whitney U test demonstrated no significant inter-group
differences with respect to the level of satisfaction (U = 3029.5, p = 0.07). This means that
both age and the level of education have a relationship with the level of satisfaction,
which supports hypothesis 1e. It might be expected, however, that in some types of
attractions, such as the Zoo or other attractions that do not require high cultural and
intellectual competences, education will have no significant influence on the level of
satisfaction.
Size of the place of residence. Analysis of the relationship between the size of the place of
residence and the level of satisfaction within the studied sample demonstrated minor
differences between respondents from the largest cities and the other groups. After a
detailed analysis, however, this relationship was found to occur only among visitors of
Biskupin (Table 2.17).
Table 2.17. The level of satisfaction and the size of the place of residence
Size of the place of residence Festival Museum of Agriculture
Zoo Ethnographic
Park Total
Village 3.88 4.39 4.55 4.50 4.22
Town < 100’000 of citizens 3.86 4.40 4.59 4.62 4.28
101’000 – 500’000 3.97 4.55 4.37 4.66 4.15
> 500’000 4.23 4.52 4.54 4.67 4.48
Kruskal-Wallis H test 10.18 1.51 2.28 2.55 36.06
p value (H test) 0.017 0.68 0.51 0.46 0.001
Source: own research

68
2.4.4.2. Other visitor features
Distance from the place of residence and length of the trip. As seen in Table 2.18, there is
a difference in the level of satisfaction between residents and non-residents, especially
those arriving from distant places (more than 50 kilometres away). However, this
difference is only significant when analysed for all the attractions together. While similar
relationships were found by P. Pearce et al. (1997), P. Pearce and G. Moscardo (1998) and
W. Spinks et al. (2005), their interpretation proves difficult. One of the reasons behind
them, as pointed out by W. Spinks et al. (2005), might be the fact that residents incur less
expenditure on the journey and hence their risk, involvement and expectations towards
the attraction are lower compared to those visitors who need to cover a greater distance.
This results in a lower risk of dissatisfaction in case the attraction fails to meet their
expectations and, consequently, in a higher average level of satisfaction.
Table 2.18. Analysis of inter-group differences in the level of satisfaction with regard to
the distance from the place of residence to the attraction
Distance Festival Museum of Agriculture
Zoo Ethnographic
Park All sites
0–5 km 3.27 3.85 4.60 5.00 4.41
6–50 km 4.01 4.51 4.47 4.67 4.47
51–100 km 4.00 4.50 4.66 4.56 4.18
More than 100 km 3.89 4.44 4.46 4.55 4.20
Kruskal-Wallis H test 4.86 7.44 2.21 3.06 31.69
p value (H test) 0.18 0.059 0.53 0.38 0.001
Source: own research
In the course of a detailed analysis, significant differences in the level of
satisfaction were identified between residents (0–5 km) and visitors living more than 51
kilometres from the attraction, as well as between visitors living 6–50 kilometres from the
attraction and those living further away (Table 2.19). Generally it might be stated then,
that visitors living within the distance of 50 kilometres experience significantly more
satisfaction than the others, which supports hypothesis 1f: Satisfaction from the visit will
decrease with the increase of the distance travelled to the attraction.

69
Table 2.19. Detailed analysis of inter-group differences in the level of satisfaction with
respect to the distance from the place of residence (p values of Mann-Whitney U test)
Distance between the attraction and the place of residence
6–50 km 51–100 km More than 100 km
0–5 km 0.34 0.002 0.005
6–50 km 0.001 0.001
51–100 km 0.59
Source: own research
In most of the studied attractions, no significant differences were found between
tourists and one-day visitors (Figure 2.20), except for the Biskupin Festival. In this case,
visitors whose trips lasted for more than one day (i.e. tourists) displayed a slightly higher
level of satisfaction compared to other respondents, although the difference was
statistically significant. While this might seem contrary to what has been observed in the
previous paragraph, there are two possible explanations. The first is that since the
difference is not large and was only observed among visitors of one attraction, it might
result from the composition of the studied sample, which was dominated by teenagers,
who tend to have lower levels of satisfaction and who visited the Festival on one-day
school trips. The second possible explanation is the phenomenon of cognitive dissonance,
which may occur among tourists. Despite lower satisfaction, they try to justify their
choice. Even those persons who feel that the visit has not been very satisfying tend to
increase their evaluation in order to reduce the cognitive dissonance between
expectations and perceptions (cf. Vitterso et al., 2000; Festinger, 2007).
Table 2.20. Analysis of inter-group differences in the level of satisfaction with respect to
the length of the trip
Are you on a trip longer than one day?
Festival Museum of Agriculture
Zoo Ethnographic
Park All sites
Yes 4.09 4.29 4.53 4.52 4.31
No 3.92 4.48 4.55 4.65 4.34
Mann-Whitney U test -2.03 1.58 -0.082 1.49 0.04
p-value (U test) 0.024 0.11 0.35 0.13 0.96
Source: own research
Acquaintance with the place and subject of the attraction. The study results indicate that
previous experiences with the attractions generally has no significant impact on visitor

70
satisfaction. In most of the studied attractions, no significant differences in the level of
satisfaction were observed between first-time and repeat visitors, except for the Museum
of Agriculture, where repeat visitors displayed a significantly higher level of satisfaction
than first-time visitors (Table 2.21). The results of the study by Falk (1983), who argued
that repeat visitors learn more than first-time visitors, suggest a conclusion that, in
accordance with the theory of mindful visitor (Moscardo, 1999), they should also be more
satisfied. Moreover, satisfied visitors are more inclined to revisit the attraction in the
future, and when they return, their expectations are more accurate and closer to the
reality. As a result, the gap between expectations and the perception becomes smaller,
and hence they derive greater satisfaction from subsequent visits. This might explain the
results obtained from visitors of the Museum of Agriculture in Szreniawa. The lack of
significant differences in this respect in the other attractions might result from the fact
that the U test is overly conservative (the mean levels of satisfaction among repeat
visitors are higher) and does not necessitate the rejection of hypothesis 1c, but it
suggests the need for further and more detailed research in this field.
Table 2.21. The level of satisfaction and acquaintance with the attraction
Is it your first visit here? Festival Museum of Agriculture
Zoo Ethnographic
Park All sites
Yes 4.14 4.34 4.47 4.49 4.35
No 4.06 4.50 4.67 4.59 4.38
Mann-Whitney U test -1.21 3.14 1.93 1.94 1.50
p value (U test) 0.22 0.001 0.052 0.052 0.12
Source: own research
The relationship between satisfaction and experience mentioned above is partly
supported by the next question, concerning the frequency of visits to similar attractions.
Frequent visitors display a higher level of satisfaction compared to other respondents
(Table 2.22). This hypothesis has been validated among visitors of the Museum of
Agriculture: respondents who had visited similar attractions 3 or more times over the 12
months preceding the study had a significantly higher level of satisfaction than other
persons. However, the results from the other attractions do not contradict the
hypothesis. This calls for further investigation, but for the time being a careful conclusion

71
can be drawn that persons frequently visiting similar attractions may experience a greater
level of satisfaction than other individuals (hypothesis 1c).
Table 2.22. The level of satisfaction and the frequency of visiting similar attractions
How many times have you visited a similar
place over the last 12 months? Festival
Museum
of
Agriculture
Zoo Ethnographic
Park All sites
0 4.08 4.34 4.56 4.48 4.30
1 4.12 4.23 4.57 4.58 4.35
2 4.13 4.46 4.66 4.48 4.43
3 or more 4.03 4.59 4.69 4.64 4.45
Kruskal-Wallis H test 1.27 29.56 5.11 2.97 15.33
p value (H test) 0.73 0.001 0.16 0.39 0.001
Source: own research
Answers to the next question: How would you rate the level of your interest in
archaeology/ the history of agriculture/ animals/ the rural culture? indicate a direct
relationship between satisfaction and interest in the attraction subject. In all cases, the
level of satisfaction is evidently higher among respondents interested in the subject of the
visited attraction. These differences are especially apparent among visitors of the
Museum Agriculture and the Ethnographic Park, and slightly less noticeable among
visitors of the Zoo and the Festival. Moreover, as can be seen in Table 3.23, the
relationship is almost linear.
Table 2.23. The level of satisfaction and the interest in the subject of the attraction
How would you rate the level of your interest in the subject of the attraction?
Festival Museum
of Agriculture
Zoo Ethnographic
Park All sites
Very low 3.85 4.21 (5.00) (3.30) 3.95
Low 3.90 4.18 (4.51) 4.37 4.10
Average 4.10 4.36 4.53 4.49 4.33
High 4.17 4.50 4.70 4.67 4.50
Very high 4.15 4.75 4.68 4.66 4.53
Kruskal-Wallis H test 9.22 34.60 13.29 28.92 91.94
p value (H test) 0.05 0.001 0.009 0.001 0.001
Note: values in parentheses were obtained from groups including less than 10 respondents, which made it
impossible to calculate statistical differences for these groups.
Source: own research

72
These findings support the conclusion drawn from the two previous questions, namely
that the acquaintance with the attraction and its subject significantly increases the level
of visitor satisfaction. This partly validates hypothesis 1d: Individuals interested in the
subject of the attraction will be more satisfied than other individuals.
Composition of the visiting group. Analysis of the answers to the question about the
persons accompanying respondents in the visit showed that that the composition of the
visiting group has a significant influence on visitor satisfaction. The influence, however, is
not the same in all the attractions covered in the study. On the Festival and in the
Museum of Agriculture, the lowest level of satisfaction was found in respondents who
visited the attraction as part of a organised group (Table 2.24). On the one hand, this
must have resulted from the prevalence of school trips, whose participants include young
schoolchildren, who, as has already been demonstrated, experience the lowest
satisfaction. The other factor is the problem of organising a group and assuring an
uninterrupted contact with the guide within crowded attractions. This is especially
challenging during fairs, festivals and other event-type attractions, which are attended by
an extremely large number of visitors over a short period of time. This might be the
reason why no such effect was observed in the Zoo, where the extensive area and long
distances between animal enclosures make it possible for many visiting groups to move
around without interference.
Table 2.24. The level of satisfaction and the composition of the visiting group
Composition of the visiting group Festival Museum of Agriculture
Zoo Ethnographic
Park All sites
Alone 4.25 (4.62) (4.71) (4.60) 4.50
With a friend or a spouse 4.25 4.37 4.71 4.47 4.42
Organised group 3.94 3.81 4.56 4.63 4.01
With family and children 4.26 4.51 4.56 4.59 4.52
Kruskal-Wallis H test 28.26 26.99 3.52 8.05 141.28
p value (H test) 0.001 0.001 0.32 0.045 0.001
Source: own research
On the other hand, the highest level of satisfaction found among visitors of the
open-air museum in Dziekanowice might have resulted from the need for the
interpretation of folk culture heritage by a guide. The almost complete lack of forms of

73
heritage interpretation in the museum may significantly decrease the level of satisfaction
among individual visitors, whereas the participation in a guided tour helps overcome
limitations resulting from insufficient knowledge and preparation.
2.4.4.3. Motivations
The analysis of correlations between the level of satisfaction and motives for visiting
attractions demonstrates strong relationships between the two variables. The strength
and significance of these relationships varies between attractions. The strongest
relationship was found between the educational motive to learn something new and
satisfaction among visitors of the Biskupin Festival (R = 0.27; p < 0.001) and the Museum
of Agriculture (R = 0.24; p < 0.001) (Table 2.25). In other words, persons who wish to
acquire new knowledge are going to visit the Festival in Biskupin or the Museum of
Agriculture in Szreniawa. The deciding factors for this are the many demonstrations and
stands presenting heritage (live heritage interpretation) during the Festival and numerous
interpretation and information panels in the Museum of Agriculture.
Table 2.25. Spearman correlation coefficients between visitors’ motives and the level of
satisfaction
What is the purpose of your visit? Festival Museum of Agriculture
Zoo Ethnographic
Park All sites
I wanted to learn something new 0.27c 0.24c 0.14a 0.21c 0.15c
I wanted to relax in nice surroundings
0.17c 0.18c 0.00 0.16b 0.22c
I wanted to show the kids/ family/ friends something new
0.19c 0.14b 0.00 0.20c 0.20c
I wanted to escape daily stress 0.02 0.19c 0.06 0.18b 0.14c
Because places like this one, should be visited
0.20c 0.24c 0.15b 0.22c 0.15c
I wanted to see a new, interesting place
0.23c 0.01 0.02 0.14a 0.07b
I wanted to have a nice time with the kids/family/friends
0.10a 0.17c -0.03 0.08 0.18c
Note: 5 – very important, 4 – important, 3 – averagely important, 2 – not very important, 1 – not important; a – p < 0.05, b – p < 0.01, c – p < 0.001
Source: own research
A strong correlation was also observed between satisfaction and the bolstering
motive because places like this one, should be visited (Biskupin: R = 0; p < 0.001,
Szreniawa: R = 0.24; p < 0.001, Dziekanowice: R = 0.22; p < 0.001). It suggests that visitors’

74
belief in the obligation to visit certain places may play the decisive role in determining
satisfaction and have a stronger influence than the exhibition attractiveness and the
quality of information sources or services and infrastructure.
Since all the motives covered in the questionnaire have a stronger or weaker
relationship with the level of satisfaction, a conclusion can be drawn that satisfaction is
directly related to the level of motivation. The stronger the motivation to visit the
attraction, the greater satisfaction the visitor experiences. Conversely, the weaker the
motives to visit a particular attraction, the less satisfaction from the visit can be expected.
2.4.4.4. Benefits
The analysis of the relationship between the benefits gained from the visit and the level
of satisfaction indicates that it varies depending on both the type of benefits and the type
of attraction. The benefit of rest and relaxation has the strongest correlation with the
level of satisfaction. Spearman correlation coefficient for all respondents was R = 0.40 at
the level of significance p < 0.001 (Table 2.26). However, the strength of this relationship
varies between the attractions. The strongest correlation between the level of
satisfaction and the benefit of rest and relaxation was found among visitors of the
Museum of Agriculture and the Ethnographic Park (R = 0.42; p < 0.001). The two
attractions cover a relatively extensive area (10 and 21 hectares, respectively) and feature
numerous alleys allowing visitors to watch exhibits while taking a stroll. This form of
sightseeing, as results indicate, provides an opportunity to rest and relax, which is
strongly related to satisfaction. The weakest, but statistically significant level of
correlation between the two variables observed in the Zoo indicates that the satisfaction
of its visitors is also strongly related to benefits from the visit. However, especially in the
case of the Zoo, it is necessary to look for other, more important determinants of
satisfaction.
The second benefit strongly correlated with satisfaction was the feeling of the
atmosphere of the place. As in the previous case, the strongest correlation between these
two variables was observed among visitors of the Ethnographic Park. Its rustic character
provides a contemplative experience and, consequently, strongly increases visitor
satisfaction.

75
Table 2.26. Spearman correlation coefficients between the level of satisfaction and the
benefits from the visit
What benefits have you gain from the visit in the…?
Festival Museum
of Agriculture
Zoo Ethnographic
Park Total
I managed to learn something new 0.27c 0.22c 0.04 0.30c 0.18c
I managed to show the kids/family/friends something new
0.37c
0.20c
-0.01 0.26
0.22c
I managed to relax and take a rest 0.29c
0.42c
0.19c
0.42c
0.40c
I managed to forget about daily duties 0.34c
0.35c
0.12b
0.37c
0.25c
I managed to spend a nice time with the kids/family/friends
0.17c 0.28c 0.01 0.28c 0.27c
I managed to feel the real atmosphere of the place
0.20c 0.27c 0.13c 0.43c 0.29c
Did you feel the authentic character of the… 0.27c 0.15c 0.07 0.27c 0.15c
Note: a – p = 0.05; b – p = 0.01, c – p = 0.001
Source: own research
Other important benefits related to satisfaction include the having a nice time
with the family or friends (R = 0.27; p = 0.001) and the sense of forgetting about daily
duties (R = 0.25; p = 0.001). The latter has a strong and similar relationship to visitor
satisfaction in all the attractions except for the Zoo. This was probably caused by the
composition of groups visiting the Zoo, which mainly include families with children, where
the satisfaction of adults (e.g. the respondents) resulted from children’s satisfaction
rather than from forgetting about daily duties.
Like with motives, all types of benefits from the visit have a significant relationship
with the level of satisfaction. They also vary depending on the type of attraction, but are
much stronger than in the case of motives.
2.4.4.5. Knowledge
The analysis of relationships between visitors’ knowledge and satisfaction showed, that
the level of knowledge has a significant influence on the level of satisfaction. This
correlation is apparent almost in each of the studied attractions. The most significant
differences in the level of satisfaction between groups of respondents who correctly
answered different numbers of questions were found among visitors of the Festival in
Biskupin (H = 40.60; p < 0.001): persons who failed to give any correct answer displayed a
level of satisfaction of 3.83, while the level of satisfaction among those who scored 5
correct answers was as high as 4.37 (Table 2.27).

76
Table 2.27. The level of satisfaction and the number of correct answers
Number of correct answers Level of satisfaction
Festival Museum of Agriculture
Zoo Ethnographic
Park All sites
0 3.83 (3.35) 4.19 4.20 3.86
1 4.03 (4.01) 4.30 4.38 4.13
2 4.19 4.23 4.59 4.61 4.43
3 4.28 4.30 4.66 4.50 4.46
4 4.25 4.47 4.73 4.59 4.53
5 4.37 4.47 4.68 4.54 4.48
Kruskal-Wallis H test 40.60 8.84 23.14 7.15 148.18
p value (H test) 0.001 0.031 0.001 0.2 0.001
Note: Values calculated for groups of less than 10 respondents were shown in parentheses
Source: own research
Similar relationships were observed among visitors of the Museum of Agriculture
in Szreniawa and the Zoo. Only in the case of the Ethnographic Park the test
demonstrated no significant inter-group differences, although the distribution of the level
of satisfaction across groups is similar to that in the other attractions. This gives evidence
in favour of hypothesis 2a about the relationship between the knowledge about the
subject of the attraction and the level of visitor satisfaction.
The analysis of relationships between the knowledge gained from the visit and the
level of satisfaction gives no definitive answer as to the character of these relationships
(Table 2.28). Differences in the level of satisfaction were observed among visitors of the
Zoo (H = 3.5; p = 0.010). Respondents who could not answer a single question or only
gave one or two correct answers were significantly less satisfied than those who could
answer three of the questions (Z = –3.09; p = 0.002; Z = –2.68; p = 0.007; Z = –2.72; p =
0.006). However, the analysis of the same relationships among visitors of the Museum of
Agriculture gave an opposite result: respondents who learned the answer to one question
were more satisfied than those who learned the answers to three questions (Z = 2.03; p =
0.04). In the other two attractions, no significant differences in the level of satisfaction
were found with respect to acquired knowledge, which fails to support hypothesis 2b
about the relationship between satisfaction and knowledge gained from visiting
attractions.

77
Table 2.28. The level of satisfaction and the number of correct answers to questions to
which visitors did not know the answer prior to the visit
Correct answers to questions to which visitors did not know the answer before the visit
Level of satisfaction
Festival Museum of Agriculture
Zoo Ethnographic
Park All sites
0 4.01 4.44 4.55 4.50 4.30
1 4.12 4.45 4.62 4.48 4.38
2 4.25 4.31 4.60 4.56 4.44
3 4.13 4.08 4.81 4.61 4.47
4 (4.75) 4.22 4.71 4.47 4.52
5 (3.90) (4.80) 0 4.55 4.30
Kruskal-Wallis H test 5.82 9.75 13.17 3.15 14.52
p value (H test) 0.12 0.044 0.010 0.68 0.012
Source: own research
2.4.4.6. Willingness to pay
A correlation between the willingness to pay the admission fee and the level of
satisfaction was only found in two out of the four studied attractions: the Festival in
Biskupin and the Museum of Agriculture (Table 2.29). Visitors displaying a significantly
lower level of satisfaction were only willing to pay the admission of 5 PLN or less.
Table 2.29. Willingness to pay and the level of satisfaction
Willingness to pay (in PLN)
Level of satisfaction
Festival Museum of
Agriculture Zoo
Ethnographic
Park All sites
5 or less 3.74 4.30 4.45 4.48 4.18
5–10 4.19 4.50 4.60 4.54 4.45
10–15 4.29 4.29 4.69 4.71 4.48
More than 15 4.28 4.26 4.72 4.71 4.40
Kruskal-Wallis H test 44.66 10.96 1.77 5.33 44.15
p level (H test) 0.001 0.012 0.62 0.15 0.001
Source: own research
2.4.5. Analysis of object-related determinants of satisfaction
2.4.5.1. Exhibitions, demonstrations and enclosures
Archaeological Festival in Biskupin. The regression analysis of the perception of the
exhibitions and presentations available at the Archaeological Festival in relation to the
level of satisfaction demonstrated that four of them significantly affect the level of visitor
satisfaction (Table 2.30). These include: museum exhibitions (β = 0.116, p = 0.0001),

78
Wisz’s farmstead (β = 0.163, p = 0.0001), live animals (β = 0.068, p = 0.03) and dance,
song and instrument performances (β = 0.144, p = 0.00142). The combination of all the
exhibition variables explained 12.2% of the variance of the variable level of satisfaction.
Table 2.30. Regression analysis of visitors’ interest in the demonstrations and exhibitions
at the Biskupin Festival in relation to the level of satisfaction
Demonstrations and exhibitions β p
1. Museum exhibitions 0.116 0.0001
2. Demonstration of combat skills 0.041 NS
3. Wisz’s farmstead 0.163 0.0001
4. Live animals 0.068 0.03
5. Cake baking 0.018 NS
6. Presentations of monument conservation 0.044 NS
7. Presentations of handicraft 0.038 NS
8. Beer brewing -0.038 NS
9. Dance, song and instrument performances 0.144 0.002
10. Bow and crossbow shooting -0.008 NS
R2 * 100 12.25
Note: NS – non-significant value (p > 0.05)
Source: own research
Museum of Agriculture in Szreniawa. The regression analysis of the perception of the
exhibitions in the Museum of Agriculture in relation to the level of satisfaction
demonstrated that only two exhibitions have a significant relationship with satisfaction
(Table 2.31). These include: The history of agriculture (β = 0.155; p = 0.0001) and the
open-air exhibition (β = 0.073; p = 0.022). The proportion of the variation of the variable
level of satisfaction explained by exhibition elements was 21.7%.

79
Table 2.31. Regression analysis of visitors’ interest in the exhibitions of the Museum of
Agriculture in Szreniawa in relation to the level of satisfaction
Exhibitions β p
1. History of agriculture 0.155 0,0001
2. Rural crafts -0.016 NS
3. Rural transport 0.015 NS
4. Construction and apiculture 0.020 NS
5. Processing and agricultural-food industry 0.027 NS
6. Open-air exhibition 0.073 0.02
7. Temporary exhibition in the manor house -0.036 NS
8. Pen with live animals -0.024 NS
9. Observation tower 0.019 NS
10. Inn 0.024 NS
R2 * 100 21.73
Note: NS – non-significant value (p > 0.05)
Source: own research
Zoo. The regression analysis of animal enclosures demonstrated that two of them have a
direct relationship with the level of visitor satisfaction: the Siberian tiger enclosure (β =
0.112; p = 0.003) and the steppe and savanna (β = 0.088; p = 0.009) (Table 2.32). The
overall variation of the variable level of satisfaction explained by the analysed variables
was 17.5%.
Table 2.32. Regression analysis of visitors’ interest in the animal enclosures in the Zoo in
relation to the level of satisfaction
Animal enclosures β p
1. Gamebird aviaries -0.022 NS
2. Otters and rhinoceroses 0.036 NS
3. Insects 0.047 NS
4. Predatory mammals -0.017 NS
5. Siberian tiger 0.208 0.002
6. Nocturnal house 0.027 NS
7. Bisons 0.016 NS
8. Eagle aviary 0.296 0.001
9. Steppe and savanna 0.047 NS
10. Seals -0.081 NS
R2 * 100 17.55
Source: own research

80
Ethnographic Park. The regression analysis of the exhibitions in relation to the level of
satisfaction demonstrated three exhibitions have a significant influence on satisfaction:
farms (β = 0.129; p = 0.0003), the Olęder farm (β = 0.085; p = 0.02) and the manor house
(β = 0.152; p = 0.0001) (Table 2.33). The total amount of variation explained by the
analysed variables was 3.8%.
Table 2.33. Regression analysis of visitors’ interest in the exhibitions of the Ethnographic
Park
Exhibitions β p
1. Farms 0.129 0,0003
2. Exhibition in the lumber room 0.009 NS
3. Church -0.018 NS
4. Nature exhibition in the mill 0.022 NS
5. Windmills -0.026 NS
6. Olęder farm 0.085 0,02
7. Blacksmith’s 0.004 NS
8. Cemetery with the chapel 0.026 NS
9. Manor house 0.152 0,0001
10. Handicraft presentation 0.056 NS
R2 * 100 31.80
Source: own research
The relationships between the perception of various exhibition features and the
level of visitor satisfaction, which were demonstrated in all the four attractions, support
hypothesis 3a that favourable perception of the exhibition positively influences visitor
satisfaction.
2.4.5.2. Sources of information
The regression analysis of the sources of information in relation to the level of satisfaction
demonstrated that almost all types of information sources significantly correlate with the
level of visitor satisfaction. Their influence considerably varies depending on the type of
attraction: it is strongest in educational attractions, such as the Museum of Agriculture,
where as much as three different types of sources significantly influence satisfaction.
These include interpretation signs and panels, conversations with the personnel and the
person showing visitors around.

81
In the Zoo, which is the most extensive of the four attractions in terms of the area,
a relationship was observed between directional signs and the level of satisfaction (Table
2.34). Indeed, directional signage is extremely helpful for visitors, allowing them to find
their way to particular enclosures, catering outlets, toilet facilities, the playground or the
exit. Unfortunately, there is no information about the time required to reach particular
enclosures, which seems essential given the vast area.
In Biskupin, a relationship was found between satisfaction and free guide
brochures (in this case, the Biskupin Newspaper). It is relatively strong (β = 0.133) and
highly significant (p < 0.001). The relationships discussed above support hypothesis 3b
that favourable perception of information sources positively influences the level of
satisfaction.
Table 2.34. Regression analysis of information sources in relation to the level of
satisfaction
Source of information Festival Museum of Agriculture
Zoo Ethnographic
Park All sites
Information plates and panels 0.002 0.121c
0.051 0.166b
0.165c
Conversation with the personnel 0.062a 0.105c 0.065 0.034 0.104c
Guide book/ brochure/ Biskupin Newspaper
0.133c -0.106 -0.089 0.037 0.028
Guide (person) 0.083a 0.173c 0.093 0.013 0.145c
Directional signs -0.047 -0.008 0.086a 0.022 0.022
Plans, maps 0.029 0.028 0.034 0.044 -0.004
R2 * 100 9.47 11.32 6.62 9.60 8.45
Note: a – p < 0,05; b – p < 0,01; c – p < 0,001.
Source: own research
2.4.5.3. Service and infrastructure quality
The regression analysis of service quality and infrastructure components in relation to the
level of satisfaction demonstrated that three out of the six analysed components have a
significant influence on the level of satisfaction: personnel, adaptation to children and the
quality of toilet facilities. However, the quality components only explain less than 7% in
the variation of the satisfaction variable (Table 2.35). Yet the results argue in favour of
hypothesis 3c that the quality of service and tourism infrastructure positively influence
the level of satisfaction.

82
Table 2.35. Multiple regression analysis of satisfaction in relation to service quality and
infrastructure components
Component Festival Museum of Agriculture
Zoo Ethnographic
Park All sites
Car park -0.026 -0.011 0.062 0.047 -0.018
Personnel 0.137b 0.147c 0.068 0.101b 0.136c
Souvenirs -0.016 -0.003 0.019 0.004 -0.069
Adaptation of the exhibition to children’s needs
0.239c 0.114a 0.207c 0.099a 0.130c
Catering services -0.026 -0.034 0.063 0.005 -0.053
Toilet facilities 0.039 0.153b 0.028 0.076 0.052a
R2
* 100 6.67 5.97 4.90 5.64 3.46
Note: a - p < 0.05; b - p < 0.01; c - p < 0.001
Source: own research
2.4.6. Regression analysis of satisfaction determinants
In order to establish the overall influence of subject- and object-related determinants on
the dependent variable satisfaction and determine which of these variables exert the
strongest influence on satisfaction, a multivariate analysis was performed. Because of the
high number of variables, a two-stage stepwise regression was employed. In the first
stage, the subject- and object related variables found to have significant influence on
satisfaction were added to the regression equation separately. In the second stage, only
those subject- and object-related variables were analysed that had been observed to
exert a significant influence on satisfaction in the first stage. The regression analysis was
separately carried out for each of the attractions.
The analysis demonstrated that relationships between the independent variables
and satisfaction are strongly diversified depending on the attraction (Table 2.36). The
highest proportion of the variation in the dependent variable satisfaction explained by
the independent variables was observed in the case of Biskupin (more than 40% - see the
second column of Table 3.36).

83
Table 2.36. Regression analysis of subject-related determinants of satisfaction (values of β
regression coefficients)
Independent variable Festival Museum of Agriculture
Zoo Ethnographic
Park All sites
Tourist / resident 0.016 – – – 0.043
First / repeat visit – 0.077 – – 0.009
Composition of the visiting group 0.001 0.064 – 0.060 0.034
Interest in the subject – 0.126b
0.081 0.131a
0.123c
Motives
To learn something new 0.044 0.060 0.030 0.005 0.022
To rest 0.005 -0.063 – 0.016 0.017
To show something to others -0.133b
-0.012 – 0.034 -0.058a
To escape stress – 0.022 – 0.005 -0.016
Obligation to visit 0.025 0.024 0.017 0.024 0.022
To see a new place 0.111b – – -0.063 0.032
To spend a nice time -0.017 0.007 – – 0.016
Benefits
Learning something new 0.153c 0.015 – 0.094 0.059a
Showing something to others 0.066 0.050 – – 0.065a
Relaxation 0.234c 0.329c 0.148b 0.249c 0.243c
Escaping from duties -0.019 0.019 0.073 0.050 0.010
Spending time with others -0.024 0.021 – 0.018 0.018
Feeling the atmosphere 0.097a 0.030 0.115a 0.135a 0.107c
Feeling the authenticity 0.141c -0.007 – 0.106a 0.053a
Duration of the visit 0.056 -0.114a – 0.112a -0.004
Willingness to pay 0.102b 0.103a – – 0.088c
Gender – – – 0.108a 0.009
Age 0.206c
0.209c
– 0.058 0.135c
Education 0.157b
0.004 0.121a
– 0.156c
Distance from the place of residence – – – – -0.097c
Size of the place of residence 0.049 – – – 0.038
Knowledge 0.009 0.091 0.121 – 0.043
Acquired knowledge – -0.036 -0.011 – 0.021
Frequency of visiting – 0.001 – – 0.029
R2 * 100 40.44 32.54 12.46 37.79 35.41
Note: a – p < 0.05; b – p < 0.01; c – p < 0.001; significant β values (p ≤ 0.05) shown in bold.
Source: own research

84
The variables having the strongest influence on satisfaction include: the benefit of
relaxation (β = 0.234), age (β = 0.206), education (β = 0.157) and the benefits of learning
something new (β = 0.153) and the feeling of authenticity (β = 0.141).
In the Ethnographic Park, the independent variables explained almost the same
high proportion of variance of the level of satisfaction (R2 * 100 = 38% – see the fourth
column of Table 2.36). Like in the case of the Festival in Biskupin, the variable having the
most influence on the variance was the benefit of relaxation (β = 0.249). Other
independent variables significantly correlated with satisfaction include the benefits of
feeling the atmosphere (β = 0.135) and authenticity of the place (β = 0.106), as well as the
interest in the attraction subject (β = 0.131), the duration of the visit (β = 0.112) and
gender (β = 0.108).
The analysis of the results obtained in the remaining two attractions and the
combined results from all the sites indicates that the factors most strongly correlated
with satisfaction are benefits from the visit, especially the feeling of rest and relaxation.
Other major factors influencing satisfaction include some socio-demographic features,
such as age and education, as well as the interest in the subject of the attraction.
The regression analysis of object-related determinants of satisfaction showed that
they explain a much lower rate of the variance in satisfaction than subject-related
variables (Table 2.37). In the case of the Biskupin Festival, the Museum of Agriculture and
the Ethnographic Park, the difference amounts to more than 10%. The situation is
opposite for the Zoo, where the object-related variables explain 15% of the variance,
whereas the subject-related variables explain only 13%.
As for the object-related variables, the strongest correlations with satisfaction
were found in some exhibition components of the attractions. These include the museum
exhibitions (β = 0.146), Wisz’s farmstead (β = 0.166) and dance performances (β = 0.095)
in Biskupin, the exhibition on the history of agriculture (β = 0.256) in Szreniawa, the tiger
enclosure (β = 0.138) and the savanna (β = 0.105) in the Zoo, and the farms (β = 0.180) in
the Ethnographic Park. Some of the information sources also significantly influence
satisfaction, especially the direction signs (β = 0.231) in the Zoo, which seems quite
understandable given its extensive area and the resulting scattering of animal enclosures.
Without proper signs it would be impossible to find one’s way to particular enclosures.

85
Table 2.37. Regression analysis of object-related determinants of visitor satisfaction
(values of β regression coefficients)
Object-related independent variables Festival Museum
of Agriculture Zoo
Ethnographic Park
Objects/ exhibitions/ demonstrations 1. 0.146c
0.256c – 0.180c
2. – – – –
3. 0.166c – – –
4. -0.126c – – –
5. – – 0.138c –
6. – 0.072 – 0.142b
7. – – – –
8. – – – –
9. 0.095a
– 0.105a
0.241c
10. – – – –
Sources of information
Plates and panels – 0.064 – 0.139b
Conversation with the personnel 0.007 0.103a – –
Guide book/ brochure/ Biskupin Newspaper 0.135b – – –
Guide (person) 0.069 0.126b – –
Direction signs – – 0.231c –
Plans, maps – – – –
Services and infrastructure – – – –
Car park – – – –
Personnel 0.092a 0.059 – 0.107a
Souvenirs – – – –
Adaption to children 0.195c – 0.191c 0.080
Catering services – – – –
Toilet facilities – 0.089a – –
R2 * 100 28.95 22.85 14.95 27.91
Note: a – p < 0.05; b – p < 0.01; c – p < 0.001. Festival: 1 – Museum exhibitions, 2 – Demonstrations of
combat skills, 3 – Wisz’s farmstead, 4 – Live animals, 5 – Cake baking, 6 – Presentations of monument
conservation, 7 – Presentations of handicraft, 8 – Beer brewing, 9 – Dance, song and instrument
performances, 10 – Bow and crossbow shooting; Museum of Agriculture: 1 – History of agriculture, 2 –
Rural crafts, 3 – Rural transport, 4 – Construction and apiculture, 5 – Processing and agricultural-food
industry, 6 – Open-air exhibition, 7 – Exhibition in the manor house, 8 – Pen with live animals, 9 –
Observation tower, 10 – Inn; Zoo: 1 – Gamebird aviaries, 2 – Otters and rhinoceroses, 3 – Insects, 4 –
Predatory mammals, 5 – Siberian tiger, 6 – Nocturnal house, 7 – Bisons, 8 – Eagle aviary, 9 – Steppe and
savanna, 10 – Seals; Ethnographic Park: 1 - Farms, 2 – Exhibition in the lumber room, 3 – Church, 4 – Nature
exhibition in the mill, 5 – Windmills, 6 – Olęder farm, 7 – Blacksmith’s, 8 – Cemetery with the chapel, 9 –
Manor house, 10 – Handicraft presentation.
Source: own research

86
Other sources of information significantly affecting satisfaction include the plates
and panels (β = 0.139) in the Ethnographic Park, which serve as the only source of
information on the museum’s exhibits for many visitors, the Biskupin Newspaper (β =
0.135), which perfectly serves the role of a guide brochure, as well as the guide (β =
0.126) and conversations with the personnel (β = 0.103) in the Ethnographic Park.
The services and infrastructure components correlated with satisfaction mainly
include the personnel and the expositions’ adaptation to children. Both in Biskupin and in
the Zoo, the expositions’ adaptation to children’s needs has a significant influence on
satisfaction (β = 0.195 and β = 0.191, respectively), while a significant influence of the
personnel on visitor satisfaction was observed in Biskupin and in the Ethnographic Park (β
= 0.092 and β = 0.107, respectively).
In the next step, the overall influence of all the significant subject- and object-
related factors on the level of visitor satisfaction was investigated. The major subject-
related factors influencing satisfaction include: interest in the subject of the attraction,
willingness to see a new place, visitors’ age and education, duration of the visit and,
above all, benefits from the visit (learning something new, relaxation, feeling the
atmosphere of the place).
The major object-related factors include exhibitions, sources of information
(plates, guide books, guided tours, direction signs) and one infrastructure component:
adaptation to children’s needs.
The overall influence of the factors included in the analysis on the level of visitor
satisfaction strongly varies depending on the attraction. In the case of the Biskupin
Festival, the dependent variables explained almost half of the variance in the variable
level of satisfaction (R2 * 100 = 45.06%) (Table 2.38). In other two attractions, the
Museum of Agriculture and the Ethnographic Park, the percentage of explained variance
was approximately 40% (37.87% and 42.80%, respectively), which showed that the
analysed variables considerably influence the variability of the level of satisfaction. In the
case of the Zoo, however, the amount of explained variance was very low (16.63%), which
indicates the need to search for other factors influencing satisfaction. They might include
the quality of interaction within the visiting group, especially interaction between parents
and children in family groups visiting the Zoo. Other significant factors might be the

87
weather during the visit and the length of the visit route, as well as the availability of the
railway service.
Table 2.38. Regression analysis of subject- and object-related independent variables with
respect to the level of satisfaction (values of β regression coefficients)
Independent variables Festival Museum of Agriculture
Zoo Ethnographic Park
Interest in the subject of the attraction 0.011 0.138c – 0.119c
Motives
To show something to others -0.108b – – –
To see a new place 0.085a
– – –
Exhibitions
1. 0.133c 0.169c – 0.108a
3. 0.056 – – –
4. -0.081a – – –
5. – – 0.155c –
6. – – 0.129b
9. 0.029 – 0.086 0.168c
Sources of information
Plates and panels – – – 0.109a
Personnel – 0.080 – –
Guide book/ brochure/ Biskupin Daily 0.095b – – –
Guide – 0.146c – –
Direction signs – – 0.149b –
Service components – – – –
Personnel 0.040 – – –
Adaptation to children 0.116c – – –
Benefits – – – –
Learning something new 0.137c
– – –
Relaxation 0.195c 0.343c 0.177c 0.286c
Feeling the atmosphere 0.063 – 0.134b 0.081
Feeling the authenticity – – – 0.050
Age 0.166c 0.151c – –
Education 0.176c – 0.142b –
Duration of the visit – -0.140c
– 0.112a
R2 * 100 45.06 37.87 16.63 42.80
Note: a – p < 0.05; b – p < 0.01; c – p < 0.001.
Source: own research

88
The multiple regression analysis validated hypotheses 1a, 1e and 1d about the
influence of age, education and interest in the subject of the attraction on the level of
satisfaction, and supported hypotheses 3a, 3b and 3c that the perception of exhibitions,
sources of information and the quality of services and infrastructure influences the level
of satisfaction. The analysis also revealed benefits to be an important factor influencing
visitor satisfaction, which suggests it is possible to accept hypothesis 7c.
2.4.7. Structural model of satisfaction determinants
The model of satisfaction determinants was verified using a four-stage procedure (Hair et
al. 2007):
1. Defining the variables comprising the model and developing scales to measure them
(exploratory factor analysis).
2. Evaluating the reliability of the resulting measurement scales (Cronbach’s α).
3. Evaluating the measuring reliability of the model (confirmatory factor analysis).
4. Defining the relationships occurring between the model’s variables and evaluating the
model’s fit to data (structural equation modelling).
Model verification was initially carried out for the Archaeological Festival in Biskupin.
The factor model included five latent variables: motivation, attraction features, benefits,
level of satisfaction and behavioural intentions. In order to identify the factor structure of
the scale for measuring variables, exploratory factor analyses were performed for each
measurement scale.
Table 2.39. Exploratory Factor Analysis (EFA) of motivational components
Motives Factor 1
(cognitive)
Factor 2
(socio-recreational)
I wanted to learn something new 0.727
I wanted to show the kids/family/friends something new 0.530
Because places like this one should be visited 0.679
I wanted to see a new, interesting place 0.795
I wanted to relax in nice surroundings 0.785
I wanted to escape daily stress 0.787
I wanted to have a nice time with the kids/family/friends 0.683
Eigenvalue 1.96 1.84
% of explained variance 28.00 26.37
Cronbach's α 0.66 0.66

89
The factor analysis of the seven-item scale for measuring motivation revealed two
factors: cognitive and socio-recreational (Table 2.39). They explained over 50% of
variance in the motivation variable and showed high reliability, with Cronbach’s α at 0.66.
The factor analysis of the scales for measuring attraction features confirmed the
existence of three factors: exhibition, sources of information and services/ infrastructure
(Table 2.40).
Table 2.40. Exploratory Factor Analysis (EFA) of attraction features
Items of the attraction feature perception
scale
Factor 1
(exhibition)
Factor 2
(sources of
information)
Factor 3
(services and
infrastructure)
Museum exhibitions 0.431
Demonstration of combat skills 0.449
Wisz’s farmstead 0.445
Live animals 0.422
Cake baking 0.630
Presentations of monument
conservation 0.447
Presentations of handicraft 0.477
Beer brewing 0.613
Dance, song and instrument
performances 0.519
Bow and crossbow shooting 0.525
Information plates and panels 0.646
Conversation with the personnel 0.463
Biskupin Newspaper 0.634
Guide book/brochure 0.564
Direction signs 0.650
Plans, maps 0.682
Car park 0.472
Personnel 0.576
Souvenirs 0.616
Adaptation to children’s needs 0.416
Catering services 0.680
Toilet facilities 0.584
Eigenvalue 3.016 2.085 2.431
% of explained variance 13.114 9.064 10.569
Cronbach's α 0.69 0.71 0.62

90
The three factors combined explained 32.75% of the total variance of the variable
attraction features. They had relatively high levels of reliability, the sources of information
scale being the most reliable (αc = 0.71); the other two scales, exhibition and service /
infrastructure, showed slightly lower, but still satisfactory reliability (αc = 0.69 and αc =
0.62, respectively).
The next analysis was performed for the measurement scale of the benefits
variable. As a result, three factors were identified: recreational, educational and social
(Table 2.41). The first one, which included the components of relaxation, entertainment
and escape, showed the highest reliability, with Cronbach’s α at 0.68. The second factor,
which comprised self-learning and the experience of authenticity and atmosphere of the
place, was reliable at Cronbach’s α = 0.64. The third factor, called social, which included
the education of other persons and their company, showed the lowest reliability
(Cronbach’s α = 0.53).
Table 2.41. Exploratory Factor Analysis (EFA) of the benefits scale
Items of the benefits scale Recreational
factor
Educational
factor
Social factor
I managed to relax and take a rest 0.801
I managed to forget about daily duties 0.845
Did you feel the authentic character of the… 0.811
I managed to learn something new 0.596
I managed to feel the real atmosphere of the place 0.653
I managed to show the kids/family/friends something new 0.883
I managed to spend a nice time with the kids/family/friends 0.592
Eigenvalue 1.853 1.536 1.484
% of explained variation 26.466 21.946 21.194
Cronbach's α 0.70 0.61 0.53
Source: own research
The variable level of satisfaction was made up of three indicators: boring-
interesting, tiring-relaxing and frustrating-pleasant, which were rated using a five-
position semantic differential scale. The benefits scale exhibited very high reliability, with
Cronbach’s α at 0.82.
The last analysed variable – intentions – included three indicators: revisit
intentions (Would you like to visit the Museum again?), word of mouth (Will you

91
recommend the Museum in Biskupin to your friends?) and willingness to pay (What is the
highest price you would be willing to pay for admission to the Museum?). The scales were
rated using a five-point Likert scale, except for the willingness to pay scale, which was
expressed in Polish złoty (PLN). However, subsequent data normalisation made it possible
to include willingness to pay into the behavioural intentions scale. The resulting
measurement scale exhibited a high reliability coefficient (Cronbach’s α = 0.59).
In the next step of the analysis, it was investigated to what extent the observable
variables correlate with each other (Table 2.42).
Table 2.42. Pearson correlation coefficient matrix for pairwise comparisons of the model’s
variables
Variables 1 2 3 4 5 6 7 8 9 10 11 12 13 14
Motives
1. Educational 1.0
0 0.3
3 0.1
9 0.2
6 0.1
6 0.2
4 0.2
3 0.1
8 0.1
8 0.4
1 0.4
2 0.2
6 0.3
1 0.0
0
2. Socio-recreational 1.00
0.08
0.06
0.17
0.06
0.06
0.00
0.41
0.12
0.33
0.10
0.18
0.08
Attraction features
3. Exhibition 1.00
0.45
0.15
0.14
0.14
0.11
0.13
0.30
0.23
0.26
0.29
0.10
4. Source of information
1.00
0.21
0.22
0.28
0.22
0.10
0.34
0.21
0.24
0.32
0.14
5. Services 1.00
0.17
0.15
0.12
0.20
0.31
0.10
0.24
0.28
0.18
Satisfaction
6. Boring-interesting 1.00
0.57
0.65
0.21
0.39
0.20
0.32
0.34
0.27
7. Tiring-relaxing 1.00
0.62
0.17
0.32
0.20
0.30
0.32
0.11
8. Frustrating-pleasant 1.00
0.20
0.32
0.17
0.27
0.30
0.20
Benefits
9. Recreational 1.00
0.29
0.31
0.24
0.26
0.16
10. Educational 1.00
0.32
0.36
0.39
0.23
11. Social 1.00
0.24
0.31
0.03
Intentions
12. Revisit intentions 1.00
0.49
0.18
13. Word of mouth 1.00
0.23
14. Willingness to pay 1.00
Note: Values in italics were significant at p < 0.05.
Source: own research

92
Significant correlations were found between the majority of variables, with p <
0.05: the strongest correlations occurred between satisfaction components (r = 0.65, 0.62
and 0.57). No significant correlations were observed between the socio-recreational
motives variable and other six variables. This means that the analysed variables do
influence each other, but motivational factors were found to have the weakest
correlation with the other variables.
The next step was to evaluate the fit of the model to the data, using confirmatory
factor analysis. Latent variables were defined in such a way that each of them was loaded
by at least three indicators (except for motives, due to the two-factor structure of the
motivation scale) and each indicator loaded only one variable (Hair et al. 2007). The fit of
the model, evaluated using absolute indicators: χ2 test, GFI, AGFI and RMSEA (Sagan
2003), proved insufficient. The χ2 test resulted in a value of 203.43 (df = 67), which was
statistically significant at p < 0.001. This means that standardised residuals of the
theoretical and empirical matrix differ significantly, which in turn implies that the model
must be rejected. The values of the other indicators were as follows: GFI = 0.940, AGFI =
0.906, MDI = 0.799 and RMSEA = 0.060, which also justifies the rejection of the evaluated
model. Since the motivational factors proved to be least correlated with the other
variables, it was decided that this variable should be removed from the model.
The modified model fitted the data much better (Table 2.43). While the value of
the χ2 test = 98.71, with p < 0.001, may suggest that the new model still does not fit the
analysed data, the value is significantly lower than for the original model. Moreover, a
number of researchers argue that with large samples the χ2 test, which is extremely
sensitive to the size of the sample, can reject even a well-fitted model (Joreskog &
Sorbom, 1996; Hair et al., 2007). In such cases, it is recommended to employ other tests.
The tests which were performed revealed a good fit of the model: the GFI was 0.981
(significantly above the recommended value of 0.95), the AGFI was 0.969 (above the
recommended value of 0.95), the RMSEA was 0.049 (below the recommended 0.05), and
the MDI was 0.943 (very close to the recommended 0.95) (Hair et al., 2007). All factor
loadings of the model had values above the recommended value of 0.3, while the high
values of the t statistics (with p < 0.001) indicate that the obtained loadings are
statistically significant (Hair et al., 2007).

93
In order to verify hypothetical relationships between the model’s variables,
structural equation modelling was performed. All the hypothetical relationships between
the variables of the second model proved statistically significant with p = 0.05 or lower.
Benefits gained from the visit were the strongest factor influencing intentions (β = 0.567,
p = 0.008) (Table 2.44, Fig. 2.2). The nest strongest factors affecting visitors’ intentions
were attraction features (β = 0.171, p = 0.005) and satisfaction (β = 0.140, p = 0.003).
These relationships provide support in favour of hypotheses 5a, 5b and 5d.
Table 2.43. Results of the confirmatory factor analysis for the Festival in Biskupin
Variables Parameter
evaluation3
Standard
error t statistics p Reliability
Variance explained and error variance
Attraction features 0.6374 0.3315
Exhibition 0.545 0.049 11.194 0.000 0.2976 0.469
Sources of information 0.730 0.060 12.089 0.000 0.532 0.615
Services 0.405 0.040 9.829 0.000 0.164 0.323
Satisfaction 0.888 0.7204
Interesting 0.869 0.047 18.458 0.000 0.756 0.387
Relaxing 0.814 0.049 16.773 0.000 0.663 0.486
Pleasant 0.862 0.046 18.536 0.000 0.743 0.386
Benefits 0.431 0.2104
Recreational 0.360 0.042 8.483 0.000 0.130 0.477
Educational 0.480 0.036 13.313 0.000 0.230 0.218
Social 0.487 0.049 9.909 0.000 0.237 0.614
Intentions 0.469 0.2364
Revisit intentions 0.507 0.041 12.325 0.000 0.257 0.399
Willingness to pay 2.546 0.416 6.121 0.000 0.169 0.736
Word of mouth 0.501 0.035 14.403 0.000 0.251 0.230
Note: χ2 = 98.71 (48), p < 0.001, GFI7 = 0.981, AGFI8 = 0.969, RMSEA9 = 0.049, MDI10 = 0.943, AIC11 = 0.360. Source: own research
3 Since the model is based on a covariance matrix, factor loading reflects regression coefficient between
observable variables and factors (coefficients can be greater than zero) (Sagan, 2003). 4 Construct reliability coefficient = [SUM(Pi
2/(1-Pi2))]/[1+SUM(Pi
2/(1- Pi2))], where Pi – i-th parameter
(Gegne & Hancock, 2006). 5 Explained variance = [SUM(Pi
2)]/[SUM(Pi2) + SUM(ei)], where Pi – i-th parameter, ei – corresponding error
equal to 1 minus the reliability coefficient of the indicator (Gegne & Hancock, 2006).
Explained variation = [SUM(Pi2)]/[SUM(Pi
2) + SUM(ei)], where Pi is the i-th parameter and ei is 6 Reliability coefficient of the indicator is the square of its parameter. 7 GFI - Population Gamma Index: in the case of well-fitted equations its value should be greater than 0.95. 8 AGFI – Adjusted Population Gamma Index: its value should be greater than 0.95 (Hair et al., 2007). 9 RMSEA – Steiger-Lind index: its value should be lower than 0.05 (Hair et al., 2007).
10 MDI – McDonald's Index of Noncentrality: its value should be greater than 0.95 (Hair et al., 2007)

94
Satisfaction has a positive effect on the perception of benefits (β = 0.157, p <
0.001). The effect of benefits on behavioural intentions (β = 0.567) turned out to be
stronger than the effect on attraction product quality (β = 0.171) and satisfaction (β =
0.140). The above relations are illustrated by the model in Figure 2.2.
Other relationships support hypothesis 6a: satisfaction exerts a positive influence
on the perception of benefits gained from the visit (β = 0.157, p < 0.001), and hypothesis
5a: satisfaction influences behavioural intentions (β = 0.140, p < 0.003).
Table 2.44. Detailed results of structural equation modeling for the Festival in Biskupin
Variables β parameter Standard error t statistics p
Attraction features – Exhibition 0.545 0.049 11.193 0.000
Attraction features – Sources of information 0.729 0.060 12.089 0.000
Attraction features – Services 0.405 0.040 9.832 0.000
Attraction features → Satisfaction 0.338 0.058 5.803 0.000
Attraction features → Intentions
Direct effect 0.171 0.061 2.806 0.005
Indirect effect 0.192 – – –
Total effect 0.363 – – –
Attraction features → Benefits
Direct effect 0.201 0.035 5.831 0.000
Indirect effect 0.053 – – –
Total effect 0.254 – – –
Satisfaction → Intentions
Direct effect 0.140 0.048 2.934 0.003
Indirect effect 0.089 – – –
Total effect 0.229 – – –
Satisfaction → Benefits 0.157 0.033 4.702 0.000
Satisfaction → Interesting 1.000 – – –
Satisfaction → Relaxing 0.936 0.063 14.767 0.000
Satisfaction → Pleasant 0.991 0.062 16.075 0.000
Benefits → Intentions 0.567 0.215 2.637 0.008
Benefits → Educational 1.000 – – –
Benefits → Recreational 0.932 0.178 7.486 0.000
Benefits → Social 0.951 0.190 7.100 0.000
Intentions → Revisit intentions 1.000 – – –
Intentions → Willingness to pay 0.812 0.117 6.912 0.000
Intentions → Word of mouth 0.988 0.095 10.433 0.000
Source: own research
Attraction features have a positive influence on benefits from the visit (β = 0.201,
p < 0.001) (hypothesis 6b) and on satisfaction (β = 0.338, p < 0.001) (hypothesis 7a).
11 AIC – Akaike Information Criterion: useful for selecting the best-matched model out of several ones – it
should be as small as possible (Hair et al., 2007)

95
Benefits and attraction features exerted a stronger influence on behavioural intentions (β
= 0.567 and β = 0.171, respectively) than satisfaction did (β = 0.140), which validates
hypothesis 9.
Figure 2.2. Model of relationships between attraction features, satisfaction, benefits and
behavioural intentions for the visitors of the Festival in Biskupin (source: own research)
In order to determine the strength and paths of the influence of attraction
features perception on satisfaction and behavioural intentions, complex path coefficients
were calculated. They are the products of the β weights of all the mediating pathways
that form a complex pathway. The comparison of complex pathways (Fig. 2.3)
demonstrated that the perception of attraction features primarily affects behavioural
intentions by indirectly influencing benefits, which in turn influence behavioural
intentions. The coefficient of this pathway was p = 0.192. The next most important causal
relationship was found to occur directly between the perception of attraction features
and behavioural intentions (p = 0.171). The pathway from attraction features to
behavioural intentions through satisfaction and benefits was the third highest in
importance (p = 0.114). Attraction features also exerted a minor influence on behavioural
intentions through visitor satisfaction (p = 0.047). This means that the crucial factor
determining future visitors’ behaviour towards the attraction is the benefits gained from
the visit. Benefits are primarily affected by attraction features and, to a lesser extent, by
satisfaction. A direct and relatively strong influence on behavioural intentions is exerted
by attraction features. Therefore, regardless of the benefits, a poor perception of
Benefits
Attraction
features
Satisfaction
0.16
0.20
0.34
Pleasant
Revisit inten-tions
Inform. sources
Services
Exhibitions
1.00
0.14
0.57
0.99
0.55
0.73
0.41
Intentions 0.17
0.95
1.00
Educational Social
1.00 0.95
Word of mouth
Recreational
0.93
Relaxing Interesting
Willingness to pay
0.93
0.81

96
attraction features (e.g. low service quality) may determine the lack of revisit intentions;
whereas a high perception of attraction features affects both revisit intentions and
benefits, which are the major factor influencing future behaviour. The direct influence of
satisfaction on behavioural intentions is very limited, although it also exerts some
influence on benefits.
Figure 2.3. Model of path relationships between attraction features, satisfaction, benefits
and behavioural intentions (based on the analysis of visitors to the Biskupin Festival,
source: own research)
The results obtained in Biskupin were then verified by comparing them to those
from the other attractions covered in the study. The results (Table 2.45) support the
previously accepted hypotheses, albeit with minor exceptions, which, however, can be
attributed to the specificity of particular attractions. In three attractions (Biskupin, the
Museum of Agriculture and the Ethnographic Park), benefits from the visit are the
strongest predicatives of behavioural intentions. This relationship proves insignificant
only in the case of the Zoo. The same holds true for the influence of satisfaction on
benefits, which was observed in all the attractions except for the Zoo, which can be
explained by its unique character. The Zoo is an attraction primarily visited by residents
and serves as a leisure park for families with children. Revisit intentions are determined
not by benefits so much as by visitors’ mood, satisfaction and quality of experience. Since
this place is perceived as a city park, a place one can visit to take a stroll and enjoy their
free time, benefits gained from such leisure visits are not as important as momentary
Benefits
Attraction
features
Satisfaction
p = 0.192
Intentions
p = 0.171
p = 0.114
p = 0.047

97
impressions, experiences and a sense of contentment. The results obtained in all the
attractions confirmed the influence of attraction features on visitor satisfaction and on
benefits gained from visiting the attraction, as well as the relatively strong influence of
satisfaction on behavioural intentions. However, the most important influence in all cases
(except for the Zoo) is that of benefits on behavioural intentions, which supports
hypothesis 9. Dependency models for the other attractions failed to confirm the direct
influence of attraction features on behavioural intentions, which definitely refutes
hypothesis 5d.
Table 2.45. Goodness of fit indices and standardised regression coefficients
Statistics, influence Festival Agriculture
Museum Zoo
Ethnographic Park
N 442 358 359 253
χ2/df 98.71c/48 97.93c/48 93.73c/48 112.68c/48
GFI 0.966 0.979 0.968 0.960
AGFI 0.955 0.965 0.969 0.936
RMSEA 0.044 0.047 0.049 0.055
MDI 0.954 0.946 0.944 0.892
AIC 0.339 0.442 0.429 0.685
Attraction features → Satisfaction 0.338c 0.113a 0.212c 0.173c
Attraction features → Benefits 0.201c 0.195c 0.150b 0.184c
Attraction features → Intentions 0.171b NS NS NS
Satisfaction → Intentions 0.140b 0.167b 0.516c 0.204a
Satisfaction → Benefits 0.157c 0.360c NS 0.336c
Benefits → Intentions 0.567b
0.551a
NS 0.968c
a – p < 0.05; b – p < 0.01; c – p < 0.001
Source: own research
3.4.8. Market segmentation of attraction visitors
Market segmentation helps classify attraction visitors with regard to particular variables
and features. Its aim is to define relatively homogeneous groups of visitors, and thus
facilitate the identification of appropriate products and marketing strategies targeted at
specific market segments. Segmentation criteria may include socio-demographic,
psychographic, geographic and behavioural features.
The typology of attraction visitors was developed by k-means cluster analysis12,
using benefits gained from visiting attractions as the clustering criterion. The resulting
12 An algorithm to assign K centers to represent the clustering of N points (K<N). The points are iteratively
adjusted (starting with a random sample of the N points) so that each of the N points is assigned to one of the

98
clusters were then characterised using socio-demographic and behavioural variables. The
analysis employed the algorithm of grouping cases, sorting distances and taking
observations at constant intervals. The aim was to group cases (attraction visitors) into a
definite number of clusters that would differ from each other as much as possible with
respect to benefits; in other words, to obtain homogeneous groups comprised of
individuals who expect similar benefits from visiting attractions. After analysing 3, 4, 5, 6,
7, 8 and 9-cluster variants, the 5-cluster variant was selected as optimal.
Table 2.46. Results of cluster analysis with regard to benefits gained from the visit
Benefits Clusters Kruskal-Wallis
rank test 1 2 3 4 5 Mean
1. I managed to learn something new (2.87) 4.43 3.68 4.03 (2.47) 3.76 H = 798.11; p < 0.001
2. I managed to show the kids/family/friends something new
4.47 4.66 (2.19) 4.27 (2.24) 3.98 H = 972.94; p < 0.001
3. I managed to relax and take a rest 4.64 4.82 4.50 (3.89) (3.53) 4.41 H = 684.18; p < 0.001
4. I managed to forget about daily duties 4.54 4.78 4.48 (3.49) (3.55) 4.28
H = 734.65 p < 0.001
5. I managed to spend a nice time with the kids/family/friends
4.81 4.91 (4.31) (4.15) (3.57) 4.51 H = 605.15; p < 0.001
6. I managed to feel the real atmosphere of the place
3.96 4.66 4.44 (3.87) (3.03) 4.16 H = 546.65; p < 0.001
7. I felt the authentic character of … (3.34) 4.25 3.98 3.88 (3.06) 3.84 H = 381.40; p < 0.001
N 328 573 225 401 148 1675
% 19.58 34.21 13.43 23.94 8.84 100.00
Source: own research
The selection criteria for choosing this particular variant were the results of the
analysis of variance (the comparison of mean values for selected variables between
different clusters) and Euclidean distances between them. Another argument for
choosing the 5-cluster variant was its clarity and, consequently, the ease of
interpretation. All the obtained visitor clusters significantly differ in terms of benefits at p
< 0.001 (tab. 2.46).
The first cluster comprised 328 individuals (20% of the studied sample) who had
above-the-average success in showing something interesting to others, taking a rest and
K clusters, and each of the K clusters is the mean of its assigned points (Bishop 1995, as cited in StatSoft,
Inc., 2001).

99
relax, forgetting about daily duties and spending some time with family or friends. They
experienced low to average levels of authenticity and the atmosphere of the place and
their educational benefits were very low. The second cluster was the largest one,
comprising 573 individuals (34.21%). Its members managed to gain most benefits of all
the respondents. Each benefit scored a significantly higher value than in the other groups.
The third cluster comprised 225 individuals (13.43%), who had the strongest experience
of authenticity and the atmosphere of the place and who managed to forget about daily
duties. The fourth cluster (401 individuals, 24%) gained the greatest educational benefits.
Its members managed to learn something new themselves or to show a new place to
others. The fifth cluster comprised 148 individuals (9%), whose benefits from the visit
were poorest. They rated all the benefits extremely low.
The clusters obtained during the analysis, which can be viewed as representing the
types of visitors, were first characterised by selected socio-demographic features (Table
2.47). Inter-cluster differences with respect to these features were then analysed using 2
test and Kruskal-Wallis ANOVA rank test.
Statistically significant differences between the clusters were found with respect
to almost all the features, except for the type of trip (there are no significant inter-cluster
differences between one-day trippers and tourists). While the total studied sample is
dominated by females, they account for almost 70% in the second cluster (which included
those individuals who gained the largest benefits). The proportion of females in the other
clusters were lower than in the total sample.
One of the features which strongly differentiate the types of visitors is age. The
highest proportion of young individuals occurs in the third and fifth type, which comprise
the visitors who experienced the least benefits (the fifth type) or gained the benefit of
escape and relaxation. The second type (visitors who gained the largest benefits) is over-
represented by individuals aged 36-55, while the first and fourth types by individuals aged
26–35. The oldest individuals are over-represented in the third type, comprising visitors
who experienced the sense of escape and atmosphere of the place.
Education differentiates the clusters in a very similar way. Individuals with the
highest level of education dominate in the groups that gained the largest benefits (the

100
first and the second), while those with the lowest level of education are over-represented
in the third and the fifth type, which comprise visitors experiencing the least benefits.
Table 2.47. Visitor features for each cluster
Variable Clusters
Mean 1 2 3 4 5
Gender
Female (54.27) 67.02 56.44 (54.36) (52.03) 58.75
Male 45.73 (32.98) 43.56 45.64 47.97 41.25
2
test 2 = 25.31; df = 4; p < 0.001
Age
15–18 (7.93) (13.31) 36.00 (14.21) 34.46 17.39
19–25 15.55 (13.84) 23.11 16.96 27.03 17.33
26–35 38.41 25.39 (17.33) 31.17 (18.24) 27.62
36–45 17.38 19.26 (6.67) 17.71 (6.76) 15.72
46–55 10.98 17.16 (5.33) 13.22 (6.76) 12.49
56–65 7.62 8.58 6.22 5.74 6.08 7.17
65 + 2.13 2.45 5.33 (1.00) (0.68) 2.27
2 test
2 = 207.91; df = 24; p < 0.001
Education
Primary (9.15) (14.31) 39.11 16.58 34.46 18.98
Vocational 9.15 9.72 (4.00) 7.29 8.78 8.17
Secondary/post-secondary 28.35 28.98 (19.56) 25.38 (17.57) 25.71
College / University 53.35 47.00 (37.33) 50.75 (39.19) 47.15%
2 test
2 = 119.18; df = 12; p < 0.001
Type of trip
One-day 11.96 16.08 12.44 14.50 10.81 13.94
Multi-day 88.04 83.92 87.56 85.50 89.19 86.06
2 test
2 = 4.98; df = 4; p = 0.29
First visit?
Yes (35.37) 44.13 (27.68) 44.61 37.84 39.76
No 64.63 (55.87) 72.32 (55.39) 62.16 60.24
2 test
2 = 25.00; df = 4; p < 0.001
Visiting group composition
Individual (0.61) 1.58 8.44 1.25 8.16 2.81
With a friend or a spouse (32.01) 35.90 44.00 37.59 35.37 36.59
Organised group (10.67) (17.86) 35.11 25.56 40.14 22.57
With family and children 56.71 44.66 (12.44) 35.59 (16.33) 38.02
2
test 2 = 215.80; df = 12; p < 0.001
Source: own research
As has already been mentioned, the typology developed based on benefits does
not differentiate tourists (i.e. visitors on trips longer than one day) from one-day visitors
(2 = 4.98; df = 4; p = 0.29). The visitors types strongly differ with respect to the

101
composition of the visiting group. Individuals who visit attractions as part of an organised
group are over-represented in the fifth cluster (the least benefits). Almost 60% of the first
cluster (a combination of various benefits except for educational ones) were visitors
accompanied by family or children. They are also over-represented in the group of visitors
who gained the greatest benefits. The third cluster (the benefits of escape and the
atmosphere of the place) comprises diverse visitors except those accompanied by family
or children.
The analysis of the visitor clusters with respect to the frequency of visiting similar
attractions revealed that there is above-the-average activity in the third (x = 1.93) and the
second cluster (the greatest benefits) (x = 1.70) and extremely low activity in the fifth
cluster (the least benefits) (x = 1.22) (Table 2.48). The interest in the subject of the
attraction in the second cluster is significantly higher than in the total sample (x = 3.49),
and considerably lower in the fifth one (x = 3.11). The second cluster also displayed the
highest interest in the exhibitions (x = 3.38), while the fifth cluster had the lowest interest
(x = 2.65). There is an above-the-average interest in the sources of information in the
second cluster, while visitors in the fifth cluster, like in the previous case, display the
lowest level of interest in this attraction feature.
Table 2.48. Mean variable values for each cluster
Variable Clusters Kruskal-Wallis
ANOVA rank test 1 2 3 4 5 Mean
Number of visits to similar places 1.55 1.70 1.93 1.55 (1.22) 1.62 H = 12.61; p = 0.013
Interest in the subject of the attraction 3.29 3.49 3.39 3.20 (3.11) 3.33 H = 35.37; p < 0.001
Interest in the exhibition (average) 2.78 3.38 3.00 3.07 (2.65) 3.07 H = 154.95; p < 0.001
Interest in the sources of information:
Plates and panels 3.63 3.97 3.80 3.68 (3.20) 3.74 H = 59.14; p < 0.001
Conversations with the personnel 3.88 3.96 3.90 3.76 (3.46) 3.84 H = 40.31; p < 0.001
Guide book/ brochure / newspaper 3.68 3.82 3.80 (3.47) (3.42) 3.67 H = 53.64; p < 0.001
Guided tours 3.50 3.63 3.46 3.50 (3.29) 3.52 H = 60.28; p < 0.001
Direction signs (3.36) 3.85 3.68 3.55 (3.21) 3.60 H = 55.05; p < 0.001
Plans, maps (3.39) 3.84 3.76 3.52 (3.28) 3.61 H = 60.02; p < 0.001
Knowledge 2.67 3.04 2.59 2.98 (2.01) 2.80 H = 59.35; p < 0.001
Acquired knowledge (0.73) 1.19 1.13 1.16 (0.69) 1.04 H = 54.16; p < 0.001
Satisfaction 4.45 4.61 4.35 4.24 (3.76) 4.38 H = 199.82; p < 0.001
Source: own research

102
Individuals in the second and the fourth clusters were found to have the most
extensive knowledge, while the level of knowledge in the fifth cluster was lowest. The
same holds true for acquired knowledge: the visitors from second and the fourth cluster
managed to learn the most, unlike visitors from the fifth cluster, who learned relatively
little. Finally, the level of satisfaction from the visit was highest in the first and the second
cluster, i.e. among visitors who gained the greatest benefits, and lowest in the fifth
cluster, which comprised individuals who benefited the least.
Inter-cluster differences also occur with respect to the preferred attractions (Table
2.49). Half of the third and the fifth cluster comprised visitors to the Biskupin Festival,
while almost half of the Zoo visitors belonged to the first cluster (46%). Visitors to the
Museum of Agriculture and the Ethnographic Park are over-represented in the second
and the fourth cluster.
Table 2.49. Proportions of visitors to particular attractions for each cluster
Attraction Clusters
1 2 3 4 5 Mean
Biskupin (18.60) 28.27 51.11 36.91 49.32 33.37
Museum of
Agriculture
20.43 30.72 (12.89) 32.42 (18.92) 25.67
Zoo 46.04 (17.80) 27.56 (9.98) 20.27 22.99
Ethnographic Park (14.94) 23.21 (8.44) 20.70 (11.49) 17.97
2 test
2 = 234.67; df = 12; p < 0.001
Source: own research
As a result of the analysis, five disparate visitor clusters (i.e. visitor types) were
obtained.
The first of them, called family visitors, includes individuals forming the first
cluster (20% of the sample). They report relaxation and spending time with family or
friends as their major benefits. This type mainly includes higher educated males aged 26–
35 and visiting attractions in family groups. They display an average interest in the
exhibition and sources of information, which results in a lower amount of acquired
knowledge compared to other visitors. Their satisfaction with the time spent in the
attraction, however, is very high. This type prevails among visitors of the Zoo.
The second type, called mindful visitors, includes respondents from the second
cluster (34% of the sample), who experience strong and diverse benefits from visiting. It is

103
the largest of all the obtained groups and its dominant profile is female in the productive
age (36–55 years old), having secondary or higher education, and visiting attractions with
family and children. These visitors, despite not having visited similar places very often,
display the highest interest in the exhibition and try to obtain information from all the
available sources. They have the highest level of pre-existing and acquired knowledge and
show the highest level of satisfaction. As for the preferred attractions, they tend to
choose the Museum of Agriculture in Szreniawa and the Ethnographic Park in
Dziekanowice. This type corresponds to G. Moscardo’s (1996, 1998) ‘mindful visitor’.
The third type, which might be called romantic visitors, is comprised of individuals
whose main benefits were escape, the sense of atmosphere, authenticity and relaxation.
It accounts for 13% of the sample (the third cluster) and mostly includes primarily
education persons aged up to 25 years, who had already visited the attraction before.
They tend to visit attractions as part of organised groups or with friends and have visited
similar places in the past. They also display average interest in the subject of the
attraction and above-the-average level of acquired knowledge. Most of these persons
visited Biskupin, and a large proportion visited the Zoo.
The fourth type, called sightseers, includes persons typical of the fourth cluster,
whose main benefits were learning something new or showing new places to others. The
other benefits are significantly below the average. These visitors comprise a the second
largest group (24% of the sample). The dominant profile is male, 26–35 years old, visiting
the attraction for the first time. The sightseers display average interest in the exhibition
and sources of information, but their level of pre-existing and acquired knowledge is
higher than in the other groups. The majority of them visited the Museum of Agriculture,
while only a small number decided to visit the Zoo.
The fifth type, which strongly contrasts with the second type, is called mindless
students and comprises the least numerous group (only 8.8% of the sample). It includes
visitors who gained the least benefits (all the benefits scored significantly lower values
than the sample average). The group is dominated by schoolchildren and students aged
15–25, persons visiting attractions as part of an organised group (mainly school trips) and
individuals having not visited similar attractions very often (x = 1.22). Members of this
group display the lowest level of interest in the exhibition and sources of information, as
well as the lowest level of satisfaction. They are the prevailing visitor type at the Festival

104
in Biskupin. Because they are the opposite of mindful visitors, they can be regarded as
mindless (cf. Moscardo, 1996, 1998), while the term students results from the prevalence
of young persons in this group.

105
CHAPTER 3: CONCLUSIONS
The aim of the present study was to identify the determinants of visitor satisfaction. The
research perspective adopted in the present study was shaped by the assumption that
the central element, the subject of an attraction, are people (tourists, trippers or
residents) and the activities they undertake within the attraction, which ultimately result
in experiences, benefits and satisfaction. This perspective allowed for an analysis of visitor
attractions and visitors’ activity by evaluating their perceptions of attractions, actions,
motives, benefits, satisfaction and behavioural intentions. The subject-centred research
perspective employed in this study, which gives the central importance to the person
undertaking a leisure activity, that is, visiting and evaluating an attraction, replaced the
popular method of assessing attractiveness by evaluating object-related features of a
resource/attraction based on specific criteria. This paradigm shift could be illustrated in
the following way:
object → subject
resource → attraction
researcher → visitor
quasi-objective → intersubjective
3.1. Determinants of visitor satisfaction
Aim 1: To identify the features of attraction visitors.
Visitors attending the studied attractions are dominated by females, young individuals
aged 35 or less, specialists and managers, students and schoolchildren, persons with
higher or incomplete higher education and inhabitants of large cities.
The prevalence of females corresponds to the visitor profile typical for Europe
(Richards, 2001) and confirms the data obtained by the Central Statistical Office of Poland
(GUS, 2005) concerning the diversification of leisure preferences with regard to gender.
Age is another factor differentiating visitors’ preferences. The attraction
dominated by the youngest visitors is the Zoo, while those older prefer the festival in
Biskupin. The oldest visitors tend to choose the open-air museum of folk architecture and
the museum of agriculture. Similar to the studies of the Central Statistical Office, it was
found that sightseeing activity is the domain of learning or educated individuals living in

106
cities. This results from the largest amount of free time among city dwellers and the
higher cultural competences of well educated individuals.
Residents and one-day trippers account for 85% of all visitors to the studied
attractions, while the proportion of tourists in relation to other types of visitors ranged
between 10 and 17%. This contradicts the assertion by Stasiak (2007) that residents
comprise only a small proportion of all museum visitors. Since the low proportion of
tourists was observed in all the attractions covered in the study, it must be assumed that
they are primarily cultural, recreational and sightseeing rather than tourist destinations.
Swarbrooke (1995) points out the same fact, observing that only a small number of
attractions, such as Disneyland in Florida or the Danish Legoland, attract more tourists
than residents.
The distance between the attraction and visitors’ place of residence strongly varies
depending on the attraction. The festival in Biskupin attracts the largest number of
visitors from distant places and the largest number of tourists. The Museum of
Agriculture in Szreniawa, on the other hand, is an extremely local attraction. This suggests
that it should be regarded as a place of recreational and cultural activity or a visitor
attraction (cf. Swardbrooke, 1995).
The attractions significantly differ with respect to the proportion of repeat visitors,
who comprised as much as 73% of persons visiting the festival in Biskupin compared to
44% in the open-air museum. This seems to result not only from the specificity of the
subject presented during the festival, but also from the fact that new elements are
introduced every year. Each edition features a slightly different theme inspired by the
culture of various ethnographic regions. The open-air exhibition, on the other hand, does
not undergo any major changes, except for the modest temporary exhibition.
The attractions covered in this study are predominantly visited by informal family
or friend groups, except for the festival in Biskupin, where the majority of visitors are part
of organised trips. As the visitor profile shows, these are mostly school trips.
Differences in the composition of visiting groups suggest that some of the sites
mainly serve as sites for family recreation (e.g. the Zoo), excursion tourism destinations,

107
especially for families and school trips (Biskupin), as well as sites for recreation and
spending time with friends (the open-air museum).
Aim 2: To investigate visitors’ motives, benefits, acquired knowledge, satisfaction and
behavioural intentions.
A detailed analysis of the data reveals strong similarities in the motivational profiles of
persons visiting Biskupin, Szreniawa and Dziekanowice. Despite considerable differences
between these attractions, they attract visitors primarily for social reasons. They are all
museums featuring open-air exhibitions and located in enthralling surroundings. They
mainly serve as places for spending time with family and friends, engaging in social
interaction, building bonds with friends or family. At the same time, they are proper
tourist attractions, since their visitors are strongly driven by the motive of seeing
something new. Visitors of the Zoo, which is also attended in order to gain social benefits,
perceive it not only as a place where one can find something new, but also as a city park:
it is a popular destination to take a walk on holidays or even on weekdays.
Visitors of the studied attractions predominantly display socio-recreational
motivation, contrary to the results of the ATLAS study, conducted in Europe (Richards,
2001). The ATLAS study found that attraction visitors were mainly driven by educational
and novelty motives. The present study also contradicts the results of the Polish part of
the ATLAS study (Marciszewska, 2001): tests of inter-group differences did not confirm
higher educational motivation in students compared to other groups. This type of
motivation was found to be significantly higher in persons aged 56–65.
The comparative analysis also demonstrated clear motivational differences with
respect to the place of residence. Individuals from rural areas tend to visit attractions for
educational reasons, whereas city dwellers are mainly driven by recreational motives.
Another difference was observed between one-day trippers (residents) and tourists. The
latter are significantly more interested in acquiring new knowledge (as in Richards, 1996,
2001). This suggests the need to pay special attention to the educational value of
attractions when promoting the product in the regions where tourists come from, and to
emphasize other values, such as recreational and social, among residents. Similar
differences should be borne in mind when conveying information targeted at individual

108
customers (for whom educational motives are most important) families with children
(relaxation and social motives) and organised trips (the novelty motive).
Specific benefits gained by visitors are the result of their varied expectations and
motivations on the one hand, and the recreational, entertainment and educational offer
of a particular facility on the other hand. The dominant benefits include spending a nice
time with family or friends and relaxation, rest, which the majority of visitors regarded as
most important, while educational benefits were rated as least important. Their
significance is therefore much lower than for instance in the United Kingdom, where one
fourth of visitors regards them as the most important benefits from visiting attractions
(Merriman, 1989; Thomas, 1989; Davies, 1994).
The level of satisfaction among visitors of the studied attractions was generally
high, but differences regarding various aspects of satisfaction were observed. The attrac-
tion which occupies an extensive area, features scattered exhibitions (animal enclosures)
and has the character of a park (the Zoo) was perceived to be pleasant and interesting;
whereas the crowded attraction full of ludic entertainment and feast-like atmosphere
was seen as tiring and least interesting. In this case, the atmosphere of entertainment is
not accompanied by adequate information and interpretation, which can lead to frustra-
tion (Biskupin).
Respondents’ intentions towards attractions were extremely positive. Visitors of
all the attractions were inclined to recommend them to other persons. Revisit intentions
were also very strong, but slightly lower than word-of-mouth intentions. This probably
results from the lack of willingness to revisit heritage-type attractions. Sites of this type
are normally visited only once. The exception to this is the Zoo, whose visitors displayed
the highest level of revisit intentions. Willingness to pay, the third behavioural intention
covered in the study, like the two other intentions suggests a high level of satisfaction.
Visitors of all the attractions declared willingness to pay a higher admission fee than the
actual price of the ticket.
Aim 3: To investigate how attractions are perceived by visitors and identify the factors
influencing their perception.
Visitors are most interested in exhibitions which are interactive, vivid and engaging
(presentations of handicraft, song and dance performances), impressive in size

109
(locomobiles), unusual (observation tower), evoking strong emotional response and
mysterious (the tiger enclosure, nocturnal house) and aesthetically appealing (manor
house).
The least interest is found in traditional, static exhibitions and items (traditional
museum exhibitions featuring items in glass cases, pictures, the insect pavilion) and
objects without any forms of interpretations (windmills).
The most popular sources of information available in the attractions are plates and
interpretation panels. Visitors’ interest in these types of information sources is related to
their form: the most attractive plates are those which feature moving elements, present
questions targeted at visitors and do not contain large amounts of text. However, it is the
knowledge presented by living people that visitors value most highly. Since not every
guest has an opportunity to take a guided tour or talk to the attraction personnel, it is
extremely important to provide them with alternative sources of information, such as
audio devices located near the exhibits and portable audio-guides which can be carried
around. Unfortunately, such devices were not available in any of the studied attractions.
The interest in sources of information is related to a number of visitors’ socio-
demographic features. A higher level of interest is found among residents and one-day
trippers than among tourists, first-time visitors, persons visiting attractions frequently,
persons accompanied by family or friends, persons interested in the subject of the attrac-
tion, females, older and better educated persons. The perception of the quality of the
studied attractions is relatively high, but the personnel’s attitude is evaluated considera-
bly higher than other components of quality. Table 3.1 presents visitors’ remarks concern-
ing particular attraction attributes.

110
Table 3.1. Evaluation of product attributes in the studied attractions
Attributes Comments
Exhibition Boring, uninteresting, lack of some expected exhibits (animal species), no
entrance to some objects of the attraction (open-air museum), static
exhibition, incomplete exhibits (tractors displayed outdoors), lack of attention
to chronology (original exhibits mixed with reconstructed ones), too large
distances between exhibits (enclosures), impediments for children (high
fences)
Information and
interpretation
No information in foreign languages, personnel not providing visitors with
information and not wearing costumes, no or limited interpretation, poorly
marked routes and directions, no information on time distances, no guide in
the queue
Services and
tourism
infrastructure
Limited range of products for purchase (no swords), no fast-food bar,
restaurant, places of respite and toilets, poor transportation within the
attraction, long waiting times for the railway service Source: own elaboration
Aim 4: To identify factors determining visitor satisfaction.
Factors determining the level of satisfaction were divided into two groups: subject-
related factors (visitor characteristics) and object-related factors (attraction
characteristics). The subject-related factors found to affect satisfaction include gender
(females experience greater satisfaction than males), age (older individuals), education
(better educated individuals), size of the place of residence (residents of large cities),
acquaintance with the attraction and the frequency of visiting similar attractions
(positive), interest in the subject of the attraction, visiting as part of a group (negative),
motives and especially the benefits of education, relaxation and the sense of authenticity
(positive). The level of satisfaction is also correlated with the level of knowledge on the
subject of the attraction and the duration of the visit.
Attraction factors determining visitor satisfaction include exhibitions featuring
vivid interpretation, presentations, workshops, intriguing exhibits, dioramas, live animals
and animal enclosures resembling their natural habitats, authentic and nostalgia-
provoking buildings and interiors. The most important sources of information include
plates and interpretation panels, conversations with the personnel and guided tours.
Interesting and well-developed brochures also have a strong influence the level of
satisfaction. Service and infrastructure components that most strongly affect visitor
111
satisfaction include the attraction personnel, adaptation to children’s needs and toilet
facilities.
Figure 3.1 presents a diagram of the visitor satisfaction determinants obtained by
a regression analysis procedure.
Aim 5: To verify the model of visitor satisfaction and behavioural intentions.
In the course of the study, relationships between factors influencing intentions towards
attractions were empirically identified and a model was developed which can help under-
stand the process of visiting attractions.
It was found that the perception of attraction features and the level of visitor sat-
isfaction are significantly correlated in that a favourable evaluation of attraction compo-
nents on the part of visitors positively influences their satisfaction with the visit. Although
Tomas, Scott and Crompton (2002) challenge the idea of a one-way influence of the per-
ception of attraction features on satisfaction (they argue that this relationship can be re-
ciprocal), the path analysis performed as part of this study provides evidence that the
direction of the relationship between the two variables is strictly defined. The hypothesis
about the influence of the perception of the attraction on satisfaction is also reinforced
by the results obtained in all the four attractions covered in the study: the same relation-
ship was observed in each of them.

112
Figure 3.1. Factors determining visitor satisfaction
Source: own elaboration
The study also provides evidence for the influence of satisfaction and benefits
gained from visiting on visitors’ intentions, expressed as revisit intentions, word-of-mouth
recommendation and willingness to pay. The collected data partly confirms the results
obtained by Tomas, Scott and Crompton (2002) and Baker and Crompton (2000). While a
positive influence of perception on visitor satisfaction was observed, this relationships
only proved significant in the case of the Archaeological Festival in Biskupin. The mediat-
ing factor between the perception of the attraction and visitors’ intentions are benefits.
This is the primary pathway of the relationship between the perception of the attraction
Visitor satisfaction
Interest in the subject
of the attraction
Motives:
- to show the attraction to
others
- to see a new place
Benefits:
- learning something new
- relaxation
- feeling the atmosphere
- sence of authenticity
Age
Education
Duration of the visit
Exhibition:
- vivid - intriguing
- educational
- authentic
Information sources:
- plates and panels
- personnel
- guide book/brochure
- guide
- direction signs
Services and infra-structure:
- personnel
- adaptation to chil-
dren’s needs
Subject-related factors Object-related factors

113
and intentions. The factors which most strongly ‘load’ the perception variable are sources
of information and the exhibition. The information sources which visitors rated most
highly include plates, information panels and direction signs. The best rated exhibitions
were those designed in a vivid, interesting way and allowing visitors to interact. These
attraction components provide visitors with the greatest satisfaction and benefits, thus
influencing their intentions to revisit the attraction, recommend it and pay higher admis-
sion fees.
These results also demonstrate that benefits and the perception of the attraction
have a stronger overall influence on behavioural intentions than satisfaction does. This
means that visitors tend to make decisions to revisit or recommend the attraction based
on their perception of benefits and attraction features rather than on their sense of satis-
faction. In other words, revisit intentions are influenced by elements of long-term bene-
fits and memories and not by temporary satisfaction, which is perceived as a psychologi-
cal state affecting attitudes rather than intentions (Olivierl, 1980; Yi, 1991). Moreover, the
factors which play the strongest role in shaping visitors’ perceptions are the available
sources of information and the exhibition. Similar relationships have been reported by
Baker and Crompton (2000), although they found service quality and the exhibition to be
the major factors shaping the perception of the attraction.
The present study found no significant influence of satisfaction on behavioural in-
tentions, and therefore it is not regarded as a good indicator of the quality of services
provided by an attraction. Satisfaction is affected by a number of factors outside the con-
trol of the attraction personnel, such as weather, the mood of an individual or the atmos-
phere in a group of visitors.
The study results allow us to accept the postulated model of relationships be-
tween the perception of attraction features, satisfaction and behavioural intentions. The
motivation variable was removed from the model, as it caused the model not to fit the
data. The main reason for this might have resulted from the lack of correlation between
socio-recreational motives and the other variables of the model: visitors displaying these
motives tend to be less interested in sources of information and the exhibition, which are
the factors most strongly ‘loading’ the attraction features variable. Since these two fac-
tors are the major determinants of satisfaction and benefits, which in turn exert the
strongest influence on behavioural intentions, it seems obvious that socio-recreational

114
motives do not significantly affect the shape of the proposed model, which was the rea-
son for removing the motivation variable from the original model.
The obtained results suggest the need to look for other variables that would link
visitors’ motives (especially socio-recreational ones) to intentions towards the attraction.
An important intervening variable might be the activity undertaken in attractions, such as
games, entertainment or learning new skills. It is also probable that studies on motivation
carried out after the visit are inherently subject to a high degree of error because of the
fact that the benefits experienced by visitors distort the original view of the motives that
led them to visit the attraction in the first place. If a model includes the variables of mo-
tives and benefits, the latter, since they are better defined after the visit, display a
stronger relationships with the other variables of the model, causing the distortion, as it
were, of the actual motives underlying the decision to visit the attraction. In practice, this
suggests the need to investigate visitors’ motivation prior to the visit. Secondly, because it
is benefits rather than motivation that exert the major influence on future intentions, the
market segmentation of visitors should be performed based on benefits rather than visi-
tors’ motives.
The influence of the perception of attraction features on intentions towards the
attraction is predominantly mediated by satisfaction and benefits. The direct influence is
rather limited, to the point of being completely insignificant in most of the studied attrac-
tions. Therefore attention to the quality of attraction services and exhibition will posi-
tively affect visitor satisfaction, as well as their revisit intentions, word-of-mouth recom-
mendation and willingness to pay.
The study has also found that the strongest influence on the perception of attrac-
tions is exerted by sources of information and, to a slightly lesser degree, by the exhibi-
tion. Based on these findings, attraction managers should keep in mind the need to take
care of and update ways of presenting information and the quality of its content, as well
as the need to provide quality exhibitions and forms of heritage interpretation. The study
proves that it is sources of information that play the deciding role in determining inten-
tions towards attractions. The significantly weaker relationship between the evaluation of
services and the perception of attraction features seems to confirm the findings by Hertz-
berg et al. (1959) and Jensen (2004) concerning hygiene factors and motivators.
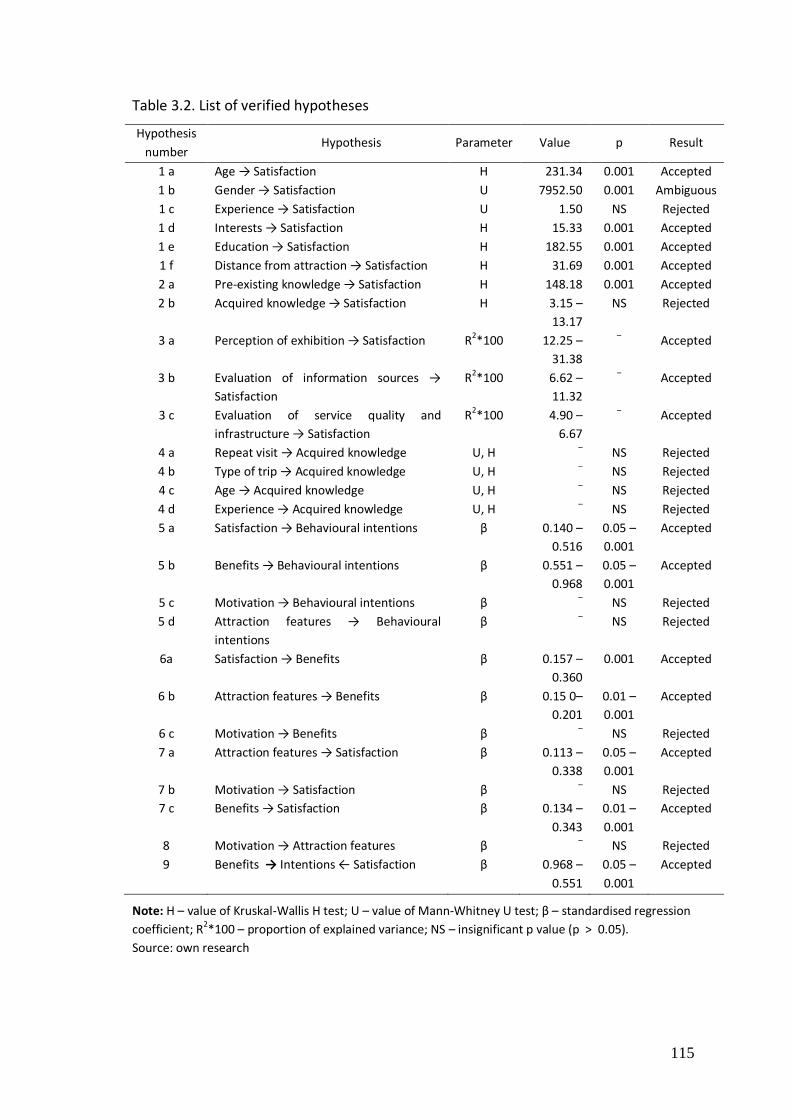
115
Table 3.2. List of verified hypotheses
Hypothesis
number Hypothesis Parameter Value p Result
1 a Age → Satisfaction H 231.34 0.001 Accepted
1 b Gender → Satisfaction U 7952.50 0.001 Ambiguous
1 c Experience → Satisfaction U 1.50 NS Rejected
1 d Interests → Satisfaction H 15.33 0.001 Accepted
1 e Education → Satisfaction H 182.55 0.001 Accepted
1 f Distance from attraction → Satisfaction H 31.69 0.001 Accepted
2 a Pre-existing knowledge → Satisfaction H 148.18 0.001 Accepted
2 b Acquired knowledge → Satisfaction H 3.15 –
13.17
NS Rejected
3 a Perception of exhibition → Satisfaction R2*100 12.25 –
31.38
– Accepted
3 b Evaluation of information sources →
Satisfaction
R2*100 6.62 –
11.32
– Accepted
3 c Evaluation of service quality and
infrastructure → Satisfaction
R2*100 4.90 –
6.67
– Accepted
4 a Repeat visit → Acquired knowledge U, H – NS Rejected
4 b Type of trip → Acquired knowledge U, H – NS Rejected
4 c Age → Acquired knowledge U, H – NS Rejected
4 d Experience → Acquired knowledge U, H – NS Rejected
5 a Satisfaction → Behavioural intentions β 0.140 –
0.516
0.05 –
0.001
Accepted
5 b Benefits → Behavioural intentions β 0.551 –
0.968
0.05 –
0.001
Accepted
5 c Motivation → Behavioural intentions β – NS Rejected
5 d Attraction features → Behavioural
intentions
β – NS Rejected
6a Satisfaction → Benefits β 0.157 –
0.360
0.001 Accepted
6 b Attraction features → Benefits β
0.15 0–
0.201
0.01 –
0.001
Accepted
6 c Motivation → Benefits β –
NS Rejected
7 a Attraction features → Satisfaction β
0.113 –
0.338
0.05 –
0.001
Accepted
7 b Motivation → Satisfaction β –
NS Rejected
7 c Benefits → Satisfaction β 0.134 –
0.343
0.01 –
0.001
Accepted
8 Motivation → Attraction features β –
NS Rejected
9 Benefits → Intentions ← Satisfaction β 0.968 –
0.551
0.05 –
0.001
Accepted
Note: H – value of Kruskal-Wallis H test; U – value of Mann-Whitney U test; β – standardised regression
coefficient; R2*100 – proportion of explained variance; NS – insignificant p value (p > 0.05).
Source: own research

116
Service quality and infrastructure belong to the first group. Attention to these factors is
extremely important so that they do not generate dissatisfaction. Their role in affecting
intentions, however, is rather minor. Intentions are primarily influenced by features of
the exhibition and forms of heritage interpretation (in the form of information sources).
Therefore the success of any attraction depends on whether it provides an acceptable
level of service quality (including car parks, toilets, catering souvenirs etc.) and keeps on
improving the attractiveness of its exhibitions and forms of heritage interpretation. Table
3.2 presents the list of the hypotheses verified in the study.
Aim 6: To develop a typology of attraction visitors.
The typology of visitors was developed based on the benefits they gain from visiting at-
tractions, since as was demonstrated, this allows us to identify distinct visitor types differ-
ing with respect to a significant element influencing satisfaction and future intentions
towards an attraction.
The typology of attraction visitors has demonstrated their strong diversification.
Benefits of individual visitor types are the consequence of different expectations
towards the visited attraction and on the other hand the result of the specific
recreational, educational or entertainment offer provided in attractions.
In the course of analyses, five visitor types have been identified, which range from
individuals who managed to experience a variety of benefits and whose level of
satisfaction is high to those who gained very limited benefits and experienced low
satisfaction.
The first type, called mindful visitors after G. Moscardo’s (1998) concept of the
‘mindful visitor’ includes individuals gaining strong and varied recreational, social and
educational benefits. These persons are highly interested in the exhibition, the subject
of the attraction and sources of information, and display a high level of knowledge and
of satisfaction. Such visitors are valuable guests in any type of visitor attraction, since
thanks to their sightseeing experience and sophistication they do not require the
slightest attention on the part of the attraction personnel, unlike the other visitor types.
Family visitors expect to experience relaxation and spend an interesting time with
their family or friends. They demand places of respite, playgrounds or separate areas for

117
children, as well as the forms of exhibition and interpretation which stimulate social
interaction, entertainment or even games.
Romantic visitors value peace and the atmosphere of authenticity. They prefer
historical attractions providing interesting forms of interpretation which allow them to
acquire new knowledge. They are particularly keen on live interpretation performed in
authentic sceneries of places or historical objects.
The sightseeing visitors type expect their own education and the education of the
accompanying persons. For this reason, they seek educational exhibitions and
attractions enabling visitors to acquire new knowledge through the contact with various
sources of information, designed for audiences of various age and various cultural
competences.
Persons of the fifth type, called mindless students, are the most challenging
customers of visitor attractions. It is also one of the most common visitor type in Polish
museums and paramuseal institutions in Poland, which are the primary destination of
school trips. As F. Tilden (1979) suggests, these visitors, given their age, require a special
approach. In order to raise their interest, it is necessary to employ modern computer
technologies, introduce elements of surprise, stimulate active entertainment, promote
physical activity and develop a short and diversified interpretation programmes that
help focus on the most important themes of the interpretation.
It must be borne in mind that the visitor types obtained in the study are only
statistical generalisations and their description does not fit each individual of a given
type. However, they can be used as a basis for developing and promoting specially
targeted attraction products. Visitor attraction managers, depending on the subject they
seek to interpret, should provide promotional resources which are targeted at specific
visitor types (target groups) and which emphasize the opportunity to gain specific
benefits from the visit.
3. 2. Limitations of the study
The limitations of this study concern the type of attractions used in the research and
sample selection. The study covered four major visitor attractions in the Wielkopolska
and Kujawy regions. The limitation in terms of their location was motivated by logistic
reasons: they had to be located within 100 kilometres from Poznań. This means that the

118
results can be applied to attractions of similar type and size as those covered in the study.
The sample did not include visitors of many other types of institutions, such as galleries,
art and regional museums or botanical gardens. However, the selected sites did meet the
criteria of the definition formulated in the beginning of the study. Another limitation re-
sulted from the need to narrow the study sample to individuals aged 15 or more. This was
determined by the design of the questionnaire survey, and especially the measurements
scales, which could be obscure to younger respondents, whose behaviour often has the
deciding influence on opinions and satisfaction of the whole group. This especially holds
true for families visiting attractions with children.
Moreover, the limited time that visitors could devote to take part in the study
after completing their visit required the number of questions and items on measurement
scales to be narrowed.
3.3. Further research on visitor attractions
The study presented hereby are the starting point for further analyses on the activity of
attraction visitors. Future research should take into account other types of visitor
attractions and extend the range of analysed variables.
The new types of attractions that have been sprouting in Poland recently include
dinosaur parks, miniature parks, “museums” of torture and Experimentaria13. All these
facilities are artificially built and designed to attract visitors and tourists. They present no
or very few original exhibits and monuments. They can be constructed virtually
anywhere. Moreover, they may pose a severe competition to traditional visitor
attractions, which is evident from the level of attendance in Zaurolandia, a dinosaur park
in Rogowo near Biskupin, located on the Piast Route and effectively competing with the
other attractions on the Route. The phenomenon of these facilities calls for the
investigation into the opinions and benefits of their visitors, and especially into the forms
of activity undertaken there.
None of the attractions analysed as part of this study employed audio-visual
devices featuring modern technologies. Such devices, including audio-guides, multimedia
13 The Experimentarium is a type of interactive museum aiming at explaining scientific and technological
issues and phenomena surrounding our world with the use of devices that allow visitors to conduct experi-
ments on their own (http://experymentarium.pl/) (23.11.2010).

119
kiosks, touchscreen terminals and interactive mannequins, are gaining an increasing
popularity in visitor attractions. Whether they really contribute to the level of knowledge
acquired by visitors or whether they only provide fun and entertainment is another
question which requires further research. Moreover, computer devices should provide
not only a source of knowledge on the subject of the attraction, but also a source of
knowledge about visitors for the use of attraction personnel. The questions for which
visitors wish to find answers and the most popular subjects browsed in a multimedia
kiosk could help develop a new interpretive strategy for the attraction, while a quiz
performed at the end of the visit with the use of a multimedia kiosk could be a perfect
way to verify the exhibition’s ability to communicate knowledge to visitors.
Modern technologies, such as monitoring systems, can be employed in other to
analyse the activity of visitors in the attraction, their traffic and individual exhibitions’
ability to attract and maintain visitors’ attention.
An important task is the development and constant monitoring of quality
standards for visitor attractions. This could be used as a means of developing a
categorisation of visitor attraction which would help attraction personnel ensure visitors’
satisfaction on the one hand, but which would also help visitors in choosing the
attractions offering the tourism product of the highest quality.
Other actions which need to be undertaken within the field of visitor attraction
studies include:
1. The improvement of reliable research tools for measuring service quality in visitor
attractions, as well as visitors’ benefits and experiences.
2. Studies on the nature, role and influence of the perception of authenticity on visitors’
experiences and satisfaction.
3. Studies on the influence of various form of presentation and interpretation on
visitors’ experiences, benefits and acquired knowledge.
4. Studies on the perception of other types of visitor attractions, such as national parks,
natural reserves, promotional areas of the State Forests, theme trails, amusement parks,
commercial and entertainment centres etc.
5. The application of new data analysis methods, such as structural equation modelling,
neural networks, quality analyses, etc.

120
6. The evaluation of the performance of various ways of communicating knowledge to
attraction visitors.
3.4. Final conclusions
While traditional visitor attractions are still the most popular tourist destination (Stevens
2003), their survival depends on whether they will be able to meet the growing
expectations of visitors, including the demand for a varied and interesting trade and
catering offer related to the subject of the attraction, as well as for education,
entertainment and interesting events.
Polish attractions must adapt the principles ruling the tourism market by
improving their tourist infrastructure. They have ceased to be temples of art only
comprehensible to connoisseurs and become sites of education entertainment employing
modern management strategies and placing visitors and their needs in the centre of
attention. Visitor attractions, and especially museums, should take steps to implement
solutions that have been found to work well in other leisure sectors. Their sources of
inspiration for this should include amusement parks, which feature interactive devices
and film presentations and successfully create the atmosphere of fantasy and mysticism.
Factors such as the aging of society and social changes precipitate the evolution of the
visitor attraction market towards individual and family tourism and cause a decreasing
participation of organised groups. The new visitor types require changes in the attraction
offer and exhibitions so that each visitor can understand the presented subject on their
own and without the assistance of a guide. Any modern attraction must also exist in the
virtual space, that is, in the Internet, so as to provide prospective visitors with an
opportunity to learn about its offer beforehand, as well as to share common heritage
resources with everyone regardless of their wealth, age, social status or place of
residence.
The following conclusions have been formulated based on the results of the study:
1. Visitor attractions are one of the primary components of the tourism and
recreation system and the strongest one on the supply side: they are what attracts the
tourists to tourist destinations. The literature employs two notions of attractions: the
tourist attraction and the visitor attraction. The broader notion of the tourist attraction
121
can connote anything that attracts tourists: sites, events, amusement parks, shopping
centres and cruise ships, as well as the level of prices and the attitude of local residents.
The stricter notion of the visitor attraction refers to designated permanent resources or
institutions which generate income and provide visitors with education, recreation,
entertainment and other types of benefits. The effect of the operation of any attraction is
a product/service combination which is characterised by a relatively complex structure.
Its nucleus comprises natural or cultural heritage resources, which, in the process of
forming the attraction, are enriched with various forms of exhibition and services and
finally become the final product, which is visitors’ activity, experiences and benefits.
2. Visitor satisfaction is determined by two major groups of factors: subject-related
factors (visitor features) and object-related factors (attraction features). These factors are
often correlated: for instance, satisfaction tends to increase with age, but this
relationship also depends on the type of attraction. The unique structure of interests
found among the youngest visitors aged 18 years or less requires visiting programmes to
be specifically targeted at them rather than follow adult programmes in a modified form.
The same applies for groups of visitors which include children. Since children’s
satisfaction tends to determine the satisfaction of their parents or guardians, every visitor
attraction should aim to develop a specific offer targeted at children.
3. Visitors who have had previous experiences with attractions, interested in the
subject of the attraction, those better education and having a more extensive knowledge
about the attraction’s subject display a higher level of satisfaction compared to other
visitors. In some attractions, however, especially in those that do not require high cultural
competences, this relationship was not observed. This indicates the need to adapt and
interpret the subject and exhibited collections with a view to allowing everyone, including
individuals of lower cultural competences, to experience satisfaction from the visit.
4. The previous demand becomes even more important given the relationships
found between visitor satisfaction and attraction features, namely the exhibition and its
ability to promote interest, sources of information available to visitors and the quality of
services and tourist infrastructure in the attraction. The exhibitions which raise much
interest not only feature multimedial and technologically advanced computer devices,
which are becoming increasingly popular among households, but also live animals, live
interpretations, presentations and re-enactments, carefully selected and impressive

122
exhibits. They must be accompanied by interesting and diversified forms of
interpretation, such as panels, plates, guide brochures and personnel facilitating the
process of understanding the subject of the exhibition, as well as the infrastructure,
which on the one hand increases visitors’ comfort and safety, but also provides an
important source of income for the attraction.
5. The visit to an attraction is a process which starts with the emergence of
motivation and the planning of the trip, and ends with the evaluation of the experiences,
benefits and memories gained from the visit, as well as behavioural intentions towards
the attraction. While individuals motivated by educational purposes acquire more
knowledge than other visitors, motivation does not significantly influence the level of
satisfaction and behavioural intentions. The factors which most strongly affect intentions
are benefits followed by attraction features and visitor satisfaction.
6. Benefits gained from visiting attractions are the factor on which both visitor
attraction researchers and managers should primarily focus on. They comprise the central
and most important aspect of the visiting process. It benefits rather than satisfaction or
attraction features that have the strongest effect on visitors’ behavioural intentions
towards the attraction. At the same time, the perception of benefits is strongly influenced
by visitor satisfaction and the attraction features. Therefore benefits are the major
moderator of both visitors’ future behaviours (which translate into the success of the
attraction) and the indicator of the perception of attraction features and visitor
satisfaction.
7. The market segmentation performed in this study facilitates the development of
attraction products and marketing strategies targeted at specific segments of the market.
The product development and marketing strategies should be adjusted so as to guarantee
the provision of a full spectrum of benefits provided by visitor attractions, the most
important of which include various forms of activity undertaken in the attraction,
experiences, education, relaxation and recreation, as well as social interactions. By
developing special product packages targeted at specific market segments, attraction
personnel will be able to meet the needs of visitors to a higher degree and provide them
with the highest level of satisfaction possible, thus ensuring the attraction’s success on
the tourism market.

123
SUMMARY
This publication concerns visitors’ attractions as the primary aim of tourist trips and the
primary component of the tourism system. Visitors’ attractions, as understood here, are
designated permanent resource controlled and managed because of their value, for the
enjoyment, amusement, entertainment, recreation and education of the visiting public.
The central issue addressed in the book can be formulated as the two following
questions: (1) what are the features of visitors’ attractions that determine visitors'
satisfaction and (2) what are the visitor features that determine visitors’ satisfaction.
The paper consists of the theory part and the empirical study. As a result of
theoretical investigation, a number of conclusions concerning the nature and concept of
visitors’ attractions were formulated:
1. Visitors’ attractions comprise one of the primary components of the leisure and
tourism system: they attract tourists to the tourist destination.
2. The literature acknowledges two definitions of attractions: tourist attractions and
visitors’ attractions. A tourist attraction can be anything that attracts visitors, including
sites, events, amusement parks, shopping centres, and cruise ships, as well as the level of
prices and the attitude of local residents. The stricter notion of visitors’ attractions refers
to designated permanent resources or institutions, generating income and providing
visitors with education, leisure, entertainment or other types of experiences.
3. Studies on visitors’ attractions can be divided into: evaluation and assessment of
attractiveness, visitor studies, analysis of product quality, and attraction management
studies.
4. There are three general perspectives for classifying attractions: ideographic/
descriptive, organisational/developmental and cognitive/perceptual.
5. The major models describing the process of sightseeing attraction include: the
“mindful visitor” model (Mscardo, 1996; Pearce, 2005), recreation opportunity spectrum

124
(Clark & Stanley, 1979), tourist attraction system (Leiper ,1990; Richards, 2002), the model
of quality, satisfaction and behavioural intentions (Baker & Crompton, 2000; Tomas et al.,
2002; Yoon & Uysal, 2003).
6. The main factors influencing satisfaction include: attraction features (heritage
resources, forms of heritage interpretation and presentation , quality of services and
tourist infrastructure and attraction authenticity) and visitor features (socio-demographic
features, motivations, experiences from the visit, benefits and education).
7. The major indicators of the satisfaction are behavioural intentions: revisit intentions,
word-of-mouth and willingness to pay.
The empirical study analysed determinants of visitors' satisfaction. Questionnaire
surveys were conducted among visitors of four attractions in the Western Poland: the
Archaeological Festival in Biskupin, the Museum of Agriculture in Szreniawa, the Open Air
Museum in Dziekanowice and the Zoological Garden in Poznań. The questionnaire
included scales for measuring motivations, socio-demographic features, type of trip, the
level of satisfaction and the evaluation of exposition, information sources, services,
tourism infrastructure, benefits and knowledge gained during the trip. The survey was
conducted with N = 1770 individuals. The study led to the following conclusions:
1. Visitors' preferences towards specific attractions are split by age group. The youngest
individuals prevail among visitors to the zoological garden, those slightly older prefer the
archaeological festival, while the oldest group chooses the open air museum and the
museum of agriculture.
2. Visitors prefer attractions which are vivid, interactive and engaging (handicraft shows,
song and dance performances), impressive in size (tractor engines), unusual (observation
tower), mysterious and emotionally provoking (tiger paddock, nocturnal house) or
aesthetically appealing (manor house). The lowest interest is found in traditional, static
exhibitions and facilities (traditional museum exhibitions with display cases, pictures,
insect house) and facilities devoid of any interpretation forms.
3. Visitors' satisfaction is determined by two main groups of factors: subject-related
(visitors’ features) and object-related (attraction features).

125
4. The subject-related factors determining satisfaction include gender (females are
satisfied to a greater extent than males), age (older individuals), education (better
educated individuals), size of the place of residence (residents of bigger towns), distance
from the place of residence (those who live closer), acquaintance with the attraction and
the frequency of visiting similar attractions (positive), interest in the subject matter
related to the attraction, being part of a sightseeing group (negative), motivations –
especially related to benefits in terms of education, relaxation and a sense of authenticity
(positive).
5. Attraction features that determine visitors’ satisfaction include exhibitions containing
vivid interpretations, shows, intriguing show-pieces, dioramas, live animals and animal
paddocks resembling real-life conditions, authentic and nostalgia-provoking buildings and
interiors. The most important information sources include signs and interpretation panels,
conversations with the staff and the guiding tours. Interesting and well-developed leaflets
have also a strong influence. Service and infrastructure components that influence
visitors’ satisfaction the most include the staff, adaptation for handicapped persons and
toilets.
6. As a result of structural equation modelling, a number of correlations within the
model of satisfaction and visitor intention determinants were identified: (1) the
perception of the quality of services and infrastructure, exhibition, and information
sources has a significant impact on visitors’ satisfaction, (2) satisfaction and benefits
gained from the visit positively influence future behavioural intentions, (3) behavioural
intentions are influenced by the perception of attraction features, but this influence is
mediated by benefits, (4) the influence of satisfaction on behavioural intentions is not
direct, but mediated by the influence on benefits, (5) benefits and the perception of the
attraction exert a stronger overall influence on behavioural intentions than satisfaction
does, which results from the nature of satisfaction, which is determined by a number of
factors that are beyond the control of attraction personnel, such as weather, the group
accompanying the visitor, as well as the visitor's mood at a moment.
7. The segmentation of visitors was developed based on the benefits they gain from
visiting attractions. In the analysis, five visitors’ segments were received. The first
segment, which was called mindful visitors, includes individuals interested in the
exhibition, the related subject matter and sources of information, displaying a high level

126
of knowledge and a high level of satisfaction at the same time. The family visitors are
leisure-oriented and want to spend interesting time with family or friends. They seek
places of respite, playgrounds or a separate space for children, as well as exhibition and
interpretation forms which enhance social interactions and fun or even game activity. The
romantic visitors include customers who value peace and authentic experiences, and who
prefer historic attractions offering interesting forms of interpretation and a chance to
learn something new. The sightseeing visitors include individuals seeking educational
experiences for themselves and their companions. Therefore they expect educational
exhibitions and attractions providing them with a chance to expand knowledge, offering
various information sources and designed for visitors of different age groups and different
cultural competences. The mindless students include the most problematic customers of
visitors’ attractions. They prevail among visitors of in Poland, which are the most common
destinations for school trips.

127
REFERENCES
AHO, S.K. 2001. Towards a General Theory of Touristic Experiences: Modeling Experience
Process in Tourism. In Tourism Review, vol. 56, 2001, no. 3/4. ISSN 1660-5373, pp. 33–37.
AJZEN, I. 1988. Attitudes, Personality and Behavior. Milton Keynes: Open University Press.
150 p. ISBN 0335217036.
AJZEN, I., FISHBEIN, M. 1980. Understanding Attitudes and Predicting Social Behavior. En-
glewood Cliffs: Prentice-Hall. 278 p. ISBN 0139364358.
ALEJZIAK, W. 2010. Determinanty i zróżnicowanie społeczne aktywności turystycznej. Studia i
monografie vol. 56, Kraków: AWF w Krakowie. 503 p. ISBN 978-83-89121-24-0.
AUGUSTYN, M., SAMUEL, K. 1998. Service quality and tourism. In Journal of Travel Research,
vol. 37, 1998, no. 1. ISSN 0047-2875, pp. 71–76.
BAKER, D., CROMPTON, J. 2000. Quality, Satisfaction and Behavioral Intentions. In Annals of
Tourism Research, vol. 27, 2000, no. 3. ISSN 0160-7383, pp. 785–804.
BALOGLOU, S., MCCLEARY, K. 1999. A model of destination image formation. In Annals of
Tourism Research, vol. 26, 1999, no. 4. ISSN 0160-7383, pp. 868–897.
BANSAL, H. S., VOYER, P. A. 2000. Word-of-Mouth Processes Within a Services Purchase De-
cision Context. In Journal of Service Research, vol. 2, 2000, no. 3. ISSN 1094-6705, p. 166–
177.
BARLOW, G. 1999. Managing supply and demand. In Leask, A., Yeoman, I. (eds.) Heritage
Visitor Attractions: An Operations Management Perspective. Cassell: Cengage Learning
EMEA, ISBN 0304702927, pp. 157–175.
BECK, L., CABLE, T. 1998. Interpretation for 21th Century. Fifteen Guiding Principles for inter-
preting Nature and Culture. Champaign: Sagamore Publishing. 204 p. ISBN 1571671331.
BEEHO, A. J., PRENTICE, R. C. 1997. Conceptualizing the Experiences of Heritage Tourists: A
Case Study of New Lanark World Heritage Village. In Tourism Management, vol. 18, 1997,
no. 2. ISSN: 0261-5177, pp. 75–87.
BEIGER, T., LAESSER, C. 2004. Information sources for travel decisions: towards a source pro-
cess model. Journal of Travel Research, vol. 42, 2004, no. 3. ISSN 0047-2875, pp. 357–371.
BIGNÉ, J.E., ANDREU, L., GNOTH, J. 2005. The theme park experience: An analysis of pleas-
ure, arousal and satisfaction. In Tourism Management, vol. 26, 2005, no. 6. ISSN: 0261-5177,
pp. 833–844.

128
BITNER, M. 1990. Evaluating Service Encounters: The Effects of Physical Surroundings and
Employee Responses. In Journal of Marketing, vol. 51, 1990, no. 3. ISSN: 0022-2429, pp. 69–
82.
BOISVERT, D., SLEZ, D. 1995. The relationships between exhibit characteristics and learning
associated behaviors in a science museum. In Science Education, vol. 79, 1995, no. 5. ISSN:
1098-237, pp. 503–518.
BOTH, B. 1996. Understanding the Information Needs of Visitors to Museums. In Museum
Management and Curatorship, vol. 17, 1996, no. 2. ISSN 0964-7775, pp. 139–157.
BOWEN, J. T., CHEN, S. 2001. The Relationship Between Customer Loyalty and Customer Sat-
isfaction. In International Journal of Contemporary Hospitality Management, vol. 13, 2001,
no. 5. ISSN 0959-6119, pp. 213–217.
BROWN, P. J. 1988. Quality in Recreation Experience. In WATSON, A. H. (ed.) Outdoor Recre-
ation Benchmark. Proceedings of the National Recreation Forum, General Technical Report
SE-52. Tampa: US Forest Service.
BRZEZIŃSKI, J. 1996. Metodologia badań psychologicznych. Warszawa: Wydawnictwo Na-
ukowe PWN. 678 p. ISBN 83-01-12117-3.
CANTER, D. 1977. The psychology of place. London: The Architectural Press. 198 p. ISBN 978-
031265322.
CARMAN, J. M. 1990. Consumer perceptions of service quality: an assessment of the
SERVQUAL dimensions. In Journal of Retailing, vol. 66, 1990, no. 1. ISSN 0022-4359, pp. 33–
55.
CAYNE, B. S. (ed.) 1991. The New Lexicon Webster’s Encyclopedic Dictionary of The English
Language. Deluxe Edition. New York: Lexicon Publications, Inc. 1150 p. ISBN 0-7172-4576-4.
CHEN, J. 2003. Market segmentation by visitors’ sentiments. In Annals of Tourism Research,
vol. 30, 2003, no. 1. ISSN 0160-7383, pp. 178–193.
CLARK, R., STANLEY, G. 1979. The Recreation Opportunity Spectrum: A Framework for Plan-
ning, Management, and Research. U.S. Department of Agriculture Forest Service. Pacific
Northwest Forest and Range Experiment Station. General Technical Report, PNW-98 Decem-
ber 1979. 36 p.
CLAVÉ, S. A. 2007. The global theme park industry. Wallingford: CABI. 480 p. ISBN 978-
1845932084.

129
CLIFF, A., RYAN, C. 1994. Do travel agencies measure up to customer expectation? An empir-
ical investigation of travel agencies’ service quality as measured by SERVQUAL. In Proceed-
ings of Conference on Tourism Down Under. Massey University, 6–9 December, pp. 553–577.
COLTON, C. W. 1987. Leisure, Recreation, Tourism. A Symbolic Interactionism View. In An-
nals of Tourism Research, vol. 14, 1987, no. 3. ISSN 0160-7383, pp. 345–360.
CONLON, D. E., MURRAY, N. 1996. Customer Perceptions of Corporate Responses to Product
Complaints: The Role of Explanations. In Academy of Management Journal, vol. 39, 1996, no.
4. ISSN 0001-4273, pp. 1040–1056.
CROMPTON, J., LOVE, J. L. 1995. The Predictive Validity of Alternative Approaches to Evaluat-
ing Quality of a Festival. In Journal of Travel Research, vol. 34, 1995, no. 1. ISSN 0047-2875,
pp. 11–24 .
CRONIN, J. TAYLOR, S. 1992. Measuring service quality: a re-examination and extension. In
Journal of Marketing, vol. 56, 1992, no. 3. ISSN 0022-2429, pp. 55–68.
CSIKSZENTMIHALYI, M. 1996. Przepływ. Psychologia optymalnego doświadczenia. Warszawa:
Studio Emka. 414 p. ISBN 83-85-881-52-2.
CURTIS, S. 1998. Visitor management in small historic cities. In Travel and Tourism Analyst,
vol. 3, 1998. ISSN: 0047-2875, pp. 75–89.
DANAHER, P., ARWEILER, N. 1996. Customer satisfaction in the tourist industry: A case study
of visitors to New Zealand. In Journal of Travel Research, vol. 35, 1996, no. 1. ISSN 0047-
2875, pp. 89–94.
DARNELL, A. C., JOHNSON, P. S. 2001. Repeat Visits to Attractions: Preliminary Economic
Analysis. In Tourism Management, vol. 2, 2001, no. 2. ISSN: 0261-5177, pp. 119–126.
DAVIDSON, R. 1996. Turystyka. Warszawa: Polska Agencja Promocji Turystyki. 204 p. ISBN
83-86800-57-7.
DAVIES, S. 2005. Still Popular: Museums and their Visitors 1994–2004. In Cultural Trends, vol.
14, 2005, no. 1. ISSN 0954-8963, pp. 67–105.
DENG, J., KING, B., BAUER, T. 2002. Evaluating natural attractions for tourism. In Annals of
Tourism Research, vol. 29, 2002, no. 2. ISSN 0160-7383, pp. 422–438.
DŁUŻEWSKA, A. 2009. Społeczno-kulturowe dysfunkcje turystyczne w krajach islamu. War-
szawa: Wydawnictwo Uniwersytetu Warszawskiego. 294 p. ISBN 978-83-235-0455-9.
DRIVER, B., BROWN, P., PETERSON G. (eds) 1991. Benefits of Leisure. State College: Venture
Publishing. 483 p. ISBN 0910251487.

130
ECKBLAD, G. 1981. Scheme Theory. A Conceptual Framework for Cognitive-Motivational Pro-
cesses. London: Academic Press. 131 p. ISBN 9780122295508.
ECONOMOU, M. 1998. The Evaluation of Museum Multimedia Applications: Lessons from
Research. In Museum Management and Curatorship, vol. 17, 1998, no. 2. ISSN: 0964-7775,
pp. 173–187.
EKINCI, Y., RILEY, M. 2001. Validating Quality Dimensions. In Annals of Tourism Research, vol.
28, 2001, no. 1. ISSN: 0160-7383, pp. 201–223.
ETB. 1991. Heritage Sites Working Group: Report to the Tourism and Environmental Task
Force. London: English Tourism Board / Employment Department Group. 48 p.
FALK, J., KORAN, J., DIERKING, L., DREBLOW, L. 1985. Predicting visitor behavior. In Curator:
The Museum Journal, vol. 28, no. 4. 1985. ISSN 2151-6952, pp. 249–257.
FERRARIO, F. 1976. The Tourist Landscape: A Method of Evaluating Tourist Potential and its
Application to South Africa. PhD dissertation. Berkeley: Department of Geography, University
of California.
FLAVIAN, C., MARTINEZ, E., POLO, Y. 2001. Loyalty to grocery stores in the Spanish market of
the 1990s. In Journal of Retailing and Consumer Services, vol. 8, 2001, no. 2. ISSN: 0969-
6989, pp. 85–93.
FRASER, J. (2009): What Information Do Zoo and Aquarium Visitors Want on Animal Identifi-
cation Labels? In Journal of Interpretation Research, vol. 14, 2009, no. 2. ISSN 1092-5872, pp.
7–19.
FROCHOT, I., HUGHES, H. 2000. HISTOQUAL: the development of a historic houses assess-
ment scale. In Tourism Management, vol. 21, 2000, no. 2. ISSN 0261-5177, pp. 157–167.
GARROD, B. 2003. Managing visitor impacts. In FYALL, A., GARROD, B., LEASK, A. (eds.) Man-
aging Visitor Attractions. Oxford: Butterworth-Heinemann. ISBN 0750653817, pp. 124–139.
GETTY, J. M., THOMPSON, K. N. 1994. The relationship between quality, satisfaction and rec-
ommending behaviour in lodging decisions. In Journal of Hospitality and Leisure Marketing,
vol. 2, 1994, no. 3. ISNN 1936-8623, pp. 3–22.
GOŁEMBSKI, G. (ed.). 2002. Metody stymulowania rozwoju turystyki w ujęciu przestrzennym.
Poznań: Wydawnictwo Akademii Ekonomicznej w Poznaniu. 97 p. ISBN 83-88760-58-0.
GOŁEMBSKI, G. 1999. Integrated Quality Management – Kształtowanie jakości produktu tu-
rystycznego w regionie. In Ruch prawniczy, ekonomiczny i socjologiczny, vol. 3,4, 1999. ISSN
0035-9629, pp. 221–231.

131
GOTLEIB, J. B., GREWAL, D., BROWN, S. W. 1994. Consumer Satisfaction and Perceived Quali-
ty: Complementary or Divergent Constructs? In Journal of Applied Psychology, vol. 79, 1994,
no. 6. ISSN 0021-9010, pp. 875–885.
GRABURN, N., JAFARI, J. 1991. Tourism social research. In Annals of Tourism Research, vol.
18, 1991, no. 1. ISSN: 0160-7383, pp. 1–11.
GREEN, D., BLAIR, P. 1995. Framing and the Price Elasticity of Private and Public Goods. In
Journal of Consumer Psychology, vol. 4, 1995, no. 1. ISSN 1057-7408, pp. 1–32.
GUNN, C. 1972. Vacationscape. Designing Tourist Regions. Austin: University of Texas Press.
208 p. ISBN 0442226799.
GUNN, C. 1979. Tourism Planning. New York: Crane Russak. ISBN 9780844817439.
HAAHTI, A., YAVAS, U. 2005. The Effect of Customer Satisfaction with Leisure Services on
Behavioral Intentions: A Study of Visitors to Santa Park in Lapland. In Services Marketing
Quarterly, vol. 26, 2005, no. 3. ISSN 1533-2969, pp. 1–12.
HABER, S., LERNER, M. 1999. Correlates of tourism satisfaction. In Annals of Tourism Re-
search, vol. 24, 1999, no. 1. ISSN 0160-7383, pp. 197–201.
HAGGARD, L. M., WILLIAMS, D. R. 1991. Self-identity benefits of leisure activities. In DRIVER,
B., L., BROWN, P., PETERSON, G. (eds.) Benefits of leisure. State College: Venture Publishing.
ISBN 0910251487, pp. 103–119.
HAIR, J. F., BLACK, W. C., BABIN, B., ANDERSON, R. L., TATHAM, R. L. 2007. Multivariate Data
Analysis. New Jersey: Prentice Hall. 928 p. ISBN 0130329290.
HALL, C. M., MCARTHUR, S. 1993. Heritage management: An introductory framework. In
HALL, C. M., MCARTHUR, S. (eds.) Heritage Management in New Zealand and Australia, Visi-
tor Management, Interpretation and Marketing. Oxford: University Press, Auckland. ISBN
0195582748, pp. 1–17.
HALL, M., ZEPPEL, H. 1990. Cultural and heritage tourism: The new Grand Tour? In Historic
Environment, vol. 7, 1990, no. 3. ISSN 0726-6715, pp. 86–98.
HAM, S., WEILER, B. 2007. Isolating the Role of On-site Interpretation in a Satisfying Experi-
ence. In Journal of Interpretation Research, vol. 12, 2007, no. 2. ISSN 1092-5872, pp. 5–24.
HARRISON, J. 1997. Museums and touristic expectations. In Annals of Tourism Research, vol.
24, 1997, no. 1. ISSN: 0160-7383, pp. 23–40.
HEIN, G. E. 2004. Learning in the Museum. Museum Meanings. London: Routledge. 203 p.
ISBN 0-415-09775-2.

132
HERR, P. M., KARDES, F. R., KIM, J. 1991. Effects of Word-of-Mouth and Product Attribute
Information on Persuasion: An Accessibility and Diagnosticity Perspective. In Journal of Con-
sumer Research, vol. 17, 1991, (March). ISSN 0093-5301, pp. 454–462.
HILL, N., ALEXANDER, J. 2003. Pomiar satysfakcji i lojalności klientów. Kraków: Oficyna Eko-
nomiczna Grupa Wolters Kluwer. 355 p. ISBN 83-88597-90-6.
HOCKETT, K., HALL, K. 2007. The Effect of Moral and Fear Appeals on Park Visitors’ Beliefs
about Feeding Wildlife. In Journal of Interpretation Research, vol. 12, 2007, no. 1. ISSN 1092-
5872, pp. 5–28.
HOWARD, P. 2003. Heritage: Management, Interpretation, Identity. London: Continuum. 278
p. ISBN 0-8264-5898-X.
HULL, R. B. 1990. Mood as a Product of Leisure: Causes and Consequences. In Journal of Lei-
sure Research, vol. 22, 1990. ISSN 2159-6417, pp. 99–111.
HUME, M., SULLIVAN, G., WINZAR, H. 2007. Exploring repurchase intention in a performing
arts context: who comes? and why do they come back? In International Journal of Nonprofit
and Voluntary Sector Marketing, vol. 12, 2007, no. 2. ISSN 1479-103X, pp. 135–148.
JAFARI, J. (ed.). Encyclopedia of Tourism. 2000. London and New York: Routledge. 720 p.
ISBN 0415154057.
JANSEN-VERBEKE, M., VAN REDOM, J. 1996. Scanning museum visitors urban tourism mar-
keting. In Annals of Tourism Research, vol. 23, 1996, no. 2. ISSN: 0160-7383, pp. 364–375.
JENSEN, J. M. 2004. The Application of Herzberg’s Two-factor Theory to the Realm of Tourist
Attractions. In SMITH, K. A., SCHOTT, C. (eds.) Proceedings of the New Zealand Tourism and
Hospitality Research Conference. 2004, Wellington 8–10 December, pp. 180–190.
JOHNS, N. 1999. Quality. In LEASK, A., YEOMAN, I. (eds.) Heritage visitor attractions: an op-
erations management perspective. Cassell: Cengage Learning EMEA, ISBN 978-0826460615,
pp. 127–143.
KAWAGOE, K., FUKUNAGA, N. 2001. Identifying the Value of Public Services by the Contin-
gent Valuation Method (CVM), In NRI Papers, Nomura Research Institute, 39, December 1.
KELLY, J. 1990. Concept and content share the honors in these winning exhibits. In Museum
News, vol. 69, 1990, no. 6. ISSN 0027–4089, pp. 71–73.
KIRCHBERG, V. 1996. Museum Visitors and Non-Visitors in Germany: A Representative Sur-
vey. In Poetics—Journal of Empirical Research on Literature, Media and Arts, vol. 24, 1996,
no. 2–4. ISSN 0304–422X, pp. 2–4.

133
KNAPP, D. 2006. The Development of Semantic Memories Through Interpretation. In Journal
of Interpretation Research, vol. 11, 2006, no. 2. ISSN 1092–5872, pp. 21–38.
KNAPP, D., BENTON, G. 2005. Long-Term Recollections of an Environmental Interpretive Pro-
gram. In Journal of Interpretation Research, vol. 10, 2005, no. 1. ISSN 1092–5872, pp. 51–54.
KNUDSON, D., CABLE, T., BECK, L. 1999. Interpretation Cultural and Natural Resources. State
College: Venture. 509 p. ISBN 0910251703.
KONYS, L., WIŚNIEWSKI, P. 1984. Analiza ścieżkowa w układach przyczynowo-skutkowych. In
Algorytmy Biometryczne i Statystyczne. Roczniki Akademii Rolniczej w Poznaniu, vol. CLIII,
1984, no. 11. ISSN 0137–1738, pp. 37–54.
KOTLER, P. (1994): Marketing. Analiza, planowanie, wdrażanie i kontrola. Warszawa:
Gebethner & ska. 743 p. ISBN 83-85205-42-X.
KOZAK, M., RIMMINGTON, M. 2000. Tourist Satisfaction with Mallorca, Spain, as an Off-
Season Holiday Destination. In Journal of Travel Research, vol. 38, 2000, no. 3. ISSN 0047-
2875, pp. 260–269.
KRUCZEK, Z. 1977. Ocena walorów turystycznych Karpat, jako podstawa programowania
imprez turystycznych w górach. Rozprawa doktorska. Kraków: AWF w Krakowie.
KUŠEN, E. 2003. Functional classification of tourism attractions. In Tourism, vol. 51, 2003, no.
4. ISSN 1332-7461, pp. 427–442.
LANGER, E. 1989. Mindfulness. Cambridge: A Merloyd Lawrence Book. Perseus Books. 256 p.
ISBN 0201523418.
LEASK, A. 2010. Progress in visitor attraction research: Towards more effective management.
In Tourism Management, vol. 31, 2010, no. 2. ISSN 0261-5177, pp. 155–166.
LEASK, A., YEOMAN, I. (eds) 2004. Heritage Visitor Attractions: An Operations Management
Perspective. London: Thomson. 320 p. ISBN 0826460615.
LEE, T. 1976. Psychology and the Environment. London: Methuen. ISBN 0416819206.
LEIPER, N. 1990. Tourist Attraction Systems. In Annals of Tourism Research, vol. 17, 1990, no.
3. ISSN 0160-7383, pp. 367–384.
LEW, A. 1987. A Framework of Tourist Attraction Research. In Annals of Tourism Research,
vol. 14, 1987, no. 4. ISSN 0160-7383, pp. 553–575.
LIGHT, D. 1995. Visitors’ use of interpretive media at heritage sites. In Leisure Studies, vol. 14
1995, no. 2. ISSN 0261-4367, pp.132–149.

134
LIJEWSKI, T., MIKUŁOWSKI, B., WYRZYKOWSKI, J. 1992. Geografia turystyki Polski. Warszawa:
Państwowe Wydawnictwo Ekonomiczne. 303 p. ISBN 83-208-0857-X.
LINN, M. 1980. Free Chice Experiences: How Do they Help Children Learn? In Science Educa-
tion, vol. 64, 1980, no. 2. ISSN 1098-237X, pp. 237–248.
LITTLEFAIR, C. 2003. The Effectiveness of Interpretation in Reducing the Impacts of Visitors in
National Parks, Doctoral dissertation. Griffith University. 228 p.
LOOMIS, R. J. 1987. Museum visitor evaluation: new tool for management. Nashville: Ameri-
can Association for State and Local History.
MACCANNELL, D. 1976. The Tourist: A New Theory of the Leisure Class. New York: Schocken
Books. 277 p. ISBN 0520218922.
MANFREDO, M. J. (ed.) 1993. Influencing Human Behavior: Theory and Applications in Recre-
ation, Tourism, and Natural Resources Management. Champaign: Sagamore Press. 370 p.
ISBN 0-915611-35-x.
MANNING, R. 1999. Studies in Outdoor Recreation, Search and Research for Satisfaction.
Oregon: State University Press. 374 p. ISBN 0870714635.
MAZUREK-ŁOPACIŃSKA, K. 2003. Zachowania nabywców i ich konsekwencje marketingowe.
Państwowe Wydawnictwo Ekonomiczne: Warszawa. 370 p. ISBN 8320814308.
MCINTOSH, A. PRENTICE, R. 1999. Affirming Authenticity: Consuming Cultural Heritage. In
Annals of Tourism Research, vol. 26, 1999, no. 3. ISSN 0160-7383, pp. 589–612.
MIDDLETON, V. T. C. 1994. Marketing in travel and tourism. Oxford: Butterworth-
Heinemann. 487 p. ISBN 0750644710.
MILEWSKI, D. 2005. Regionalne uwarunkowania rozwoju turystyki na przykładzie wojewódz-
twa Zachodniopomorskiego. In Rozprawy i studia. Szczecin: Wydawnictwo Uniwersytetu
Szczecińskiego. 210 p. ISBN 978-83-7241-392-5.
MILL, R. C., MORRISON, A. M. 2009. The Tourism System. Dubuque: Kendall Hunt Publishing.
452 p. ISBN 978-0757562013.
MITCHELL, R. C, CARSON, R. R. 1989. Using Surveys to Value Public Goods: the Contingent
Valuation Method. Washington: Resources for the Future. 462 p.
MORI/MGC. 1999. Visitors to museums and galleries in the UK. London: MORI/Museums &
Galleries Commission.
MOSCARDO, G. 1996. Mindful Visitors. Heritage and Tourism. In Annals of Tourism Research,
vol. 23, 1996, no. 2. ISSN 0160-7383376–397, pp. 376-97.

135
MOSCARDO, G. 1999. Making Visitors Mindful. Principles for Creating Quality Sustainable
Visitor Experiences through Effective Communication. Champaign: Sagamore Publishing. 139
p. ISBN 1-57167-259-1
MOSCARDO, G. M., PEARCE, P. L. 1986. Historic theme parks: An Australian experience in
authenticity. In Annals of Tourism Research, vol. 13, 1986, no. 3. ISSN 0160-7383376–397,
pp. 467–479.
NOWACKI, M. 2000. Analiza potencjału atrakcji krajoznawczej na przykładzie Muzeum Naro-
dowego Rolnictwa w Szreniawie. In SZWICHTENBERG, A., DZIEGIEĆ, E. (eds) Przemysł tury-
styczny. Koszalin: Politechnika Koszalińska, Uniwersytet Łódzki, pp. 147–164.
NOWACKI, M. 2002. Ocena jakości produktu atrakcji turystycznej z wykorzystaniem metody
SERVQUAL. In Turyzm, vol. 12, 2002, no. 1. ISSN 0867-5856, pp. 55–73.
NOWACKI, M. 2005. Motywy, korzyści i zadowolenie osób zwiedzających atrakcje krajoznaw-
cze. In Folia Turistica, vol. 16, 2005. ISSN 0867-3888, pp. 89–104.
NOWACKI, M. 2009. Quality of visitor attractions, satisfaction, benefits and behavioural in-
tentions of visitors: verification of a model. In International Journal of Tourism Research, vol.
11, 2009, no. 3. ISSN: 1522-1970, pp. 297–309.
NOWACKI, M. 2010. Skłonność do zapłaty a cena wstępu do atrakcji turystycznej. In Zeszyty
naukowe nr 568, Ekonomiczne problemy turystyki nr 13, Szczecin: Uniwersytet Szczeciński.
ISSN 1640-6818, pp. 101–114.
NUISSL, E., SCHULZE, C. 1991. Besucherinteressen und Besucherverhalten im Museum. In
FAULENBACH, B., JELICH, F. -J. (eds) Besucherinteressen und Besucherverhalten in histori-
schen Museen und Ausstellungen. Dokumentation einer Tagung. Recklinghausen. pp. 24–37.
OLIVER, R. L. 1999. Whence Consumer Loyalty? In Journal of Marketing, vol. 63, 1999, no. 4.
ISSN 0022-2429, pp. 33–44.
OTTO, J. 2004. Marketing relacji. Koncepcja i stosowanie. Warszawa: Wydawnictwo C. H.
Beck. 348 p. ISBN 83-7387-442-9.
PARASURAMAN, A., ZEITHAML, V., BERRY, L. 1985. A Conceptual Model of Service Quality
and Its Implications for Future Research. In Journal of Marketing, vol. 49, 1985, no. 4. ISSN
0022-2429, pp 41–50.
PARASURAMAN, A., ZEITHAML, V., BERRY, L. 1988. SERVQUAL: A Multiple Item Scale for
Measuring Consumer Perceptions of Service Quality. In Journal of Retailing, vol. 64, 1988,
no. 1. ISSN 0022-4359, pp. 12–40.

136
PATTERSON, D., BITGOOD. S. 1988. Some evolving Principles of Visitor Behaviour. In
BITGOOD, S., ROPER, JR., J., T., BENEFIELD, A. (eds.) Visitor Studies. Theory, Research and
Practice. Jacksonville: Centre for Social Design, pp. 41–50.
PEARCE, P. L. 1991. Analyzing tourist attractions. In Journal of Tourism Studies, vol. 2, 1991,
no. 1. ISSN 1035-4662, pp. 46–55.
PEARCE, P. L. 2005. Tourist behaviour: Themes and conceptual schemes. Clevedon: Channel
View. 256 p. ISBN 184541022X.
PEARCE, P. L., MOSCARDO, G. 1998. The role of interpretation in influencing visitor satisfac-
tion: A rainforest case study. In Faulkner, W., Tidwell, C., Weaver, D. (eds.) Progress in Tour-
ism and Hospitality Research. Proceedings of the Eighth Australian Tourism and Hospitality
Research Conference. Canberra: Bureau of Tourism Research.
PETRICK, J. F. 2004. Are loyal visitors desired visitors? In Tourism Management, vol. 25,
2004, no. 4. ISSN 0261-5177, pp. 463–470.
PINE, B. J., GILMORE, J. H. 1999. The experience economy: Work is theatre and every business
a stage. Boston: Harvard Business School Press. 272 p. ISBN 0875848192.
PIPEROGLOU, J. 1966. Identification and Definition of Regions in Greek Tourist Planning. In
Papers. Regional Science Association, vol. 18, pp. 169–176.
PRENTICE, R. C. 1993. Tourism and Heritage Attractions. London: Routledge. 253 p. ISBN
041508525X.
PRENTICE, R. C. 1995. Evaluating the Experiences and Benefits Gained by Tourists Visiting A
Socio-Industrial Heritage Museum: An Application of ASEB Grid Analysis to Blists Hill Open –
Air Museum, The Ironbridge Gorge Museum, United Kingdom. In Museum Management and
Curatorship, vol. 14, 1995, no. 4. ISSN 0964-7775, pp. 229–251.
PRENTICE, R. C., GUERIN, S., MCGUGAN, S. 1998a. Visitor learning at a heritage attraction: a
case study of Discovery as a media product. In Tourism Management, vol. 19, 1998, no. 1.
ISSN 0261-5177, p. 5–23.
PRENTICE, R. C., WITT, S. F., HAMER, C. 1998b. Tourism as Experience. The Case of Heritage
Parks. In Annals of Tourism Research, vol. 25, 1998, no. 1. ISSN 0160-7383, pp. 1–24.
PRIDEAUX, B., KININMONT, L. 1999. Tourism and Heritage are not strangers: A study of op-
portunities for rural heritage museums to maximize tourism visitation. In Journal of Travel
Research, vol. 37, 1999, no. 1. ISSN 0047-2875, pp. 299–303.

137
PRINCE, D. R. 1983. Behavioral consistency and visitor attraction. In International Journal of
Museum Management and Curatorship, vol. 2, 1983, no. 3. ISSN 0260-4779, pp. 235–247.
PRZYBYSZEWSKA-GUDELIS, R., GRABISZEWSKI, M., IWICKI, S. 1979. Problematyka waloryzacji
i zagospodarowania turystycznego miejscowości krajoznawczych w Polsce. Warszawa: Insty-
tut Turystyki. 160 p.
RICHARDS, B. 2003. Marketing atrakcji turystycznych. Jak zwiększyć frekwencję i dochody.
Warszawa: Pearson Longmann, Polska Organizacja Turystyczna. 136 p. ISBN 837336269X.
RICHARDS, G. 1996. Production and Consumption of European Cultural Tourism. In Annals of
Tourism Research, vol. 23, 1996, no. 2. ISSN 0160-7383, pp. 261–283.
RICHARDS, G. 2001. Cultural Attractions and European Tourism. Wallingford: CABI Publish-
ing. 259 p. ISBN 0851994407.
RICHARDS, G. 2002. Tourism Attraction Systems. Exploring Cultural Behavior. In Annals of
Tourism Research, vol. 29, 2002, no. 4. ISSN 0160-7383, pp. 1048–1064.
RITCHIE, J. R. B., ZINNS, M. 1978. Culture as a Determinant of the Attractiveness of a Tourism
Region. In Annals of Tourism Research, vol. 7, 1978, no. 2. ISSN 0160-7383, pp. 252–267.
ROGALEWSKI, O. 1974. Zagospodarowanie turystyczne. Warszawa: Wydawnictwa Szkolne i
Pedagogiczne. 158 p. ISBN 83-02-00110-4.
RYAN, C. 1997. The Chase of a Dream, the End of a Play. In RYAN, C. (ed.) The Tourist Experi-
ence: A New Introduction. London: Cassell. ISBN 0826457649, pp. 1–24.
SAATY, R. W. 1987. The Analytic Hierarchy Process: What it is and How it is Used. In Mathe-
matical Modeling, vol. 9, 1987, no. 35. ISSN 0307-904X, pp. 161–176.
SHACKLEY, M. 1999. Visitor Management. In Leask, A., Yeoman, I. (eds.) Heritage Visitor At-
tractions: An Operations Management Perspective. Cassell: Cengage Learning EMEA, ISBN
978-0826460615, pp. 69–82.
SHARPE, G. 1982. Selecting the interpretive media. In SHARPE, G. (ed.) Interpreting the envi-
ronment. New York: John Wiley & Sons. ISBN 978-0471090076, p. 100–122.
SHOVAL, N., RAVEH, A. 2003. Categorization of tourist attractions and the modeling of tour-
ist cities: based on the co-plot method of multivariate analysis. In Tourism Management, vol.
25, 2003, no. 5. ISSN 0261-5177, pp. 741–750.
SMITH, S. L. J. 1994. The Tourism Product. In Annals of Tourism Research, vol. 21, 1994, no.
3. ISSN 0160-7383, pp. 582–595.

138
STATSOFT, INC. 2001. STATISTICA (data analysis software system), version 6.
www.statsoft.com.
SWARBROOKE, J. 1995. The Development and Management of Visitor Attractions. Oxford:
Butterworth-Heinemann Ltd. 382 p. ISBN 0 7506 1979 1.
TARLTON, J., WARD, C. 2006. The Effect of Thematic Interpretation on a Child’s Knowledge of
an Interpretive Program. In Journal of Interpretation Research, vol. 11, 2006, no. 1. ISSN
1092-5872, pp. 7–34.
THOMSON, D., BENEFIELD, A., BITGOOD, S., SHETTEL, H., WILLIAMS, R. 1993. Visitor Studies:
Theory, Research and Practice. Jacksonville: Visitor Studies Association.
THYNE, M. 2001. The Importance of Values Research for Non-Profit Organizations: The Val-
ues’ Based Motivations of Museum Visitors. In International Journal of Nonprofit and Vol-
untary Sector Marketing, vol. 6. ISSN 1479-103X, pp. 116–130.
TILDEN, F. 1977. Interpreting Our Heritage. Chapel Hill: University of North Carolina Press.
119 p. ISBN 0-8078-4016-5.
TOMAS, S. R., SCOTT, D., CROMPTON, J. L. 2002. An investigation of the relationships be-
tween quality of service performance, benefits sought, satisfaction and future intention to
visit among visitors to a zoo. In Managing Leisure, vol. 7, 2002, no. 4. ISSN 1360-6719, pp.
239–250.
UNESCO, 1972. Konwencja w sprawie ochrony światowego dziedzictwa kulturalnego i natu-
ralnego, przyjęta w Paryżu dnia 16 listopada 1972 r. przez Konferencję Generalną Organizacji
Narodów Zjednoczonych dla Wychowania, Nauki i Kultury na jej siedemnastej sesji, In Dzien-
nik Ustaw z dnia 30 września 1976 r.
VEVERKA, J. 1998. Interpretive Master Planning: The Essential Planning Guide for Interpretive
Centers, Parks, Self-Guided Trails, Historic Sites, Zoos, Exhibits & Programs. Tustin: Acorn
Naturalists. 162 p. ISBN 978-1881150015.
VITTERSO, J., VORKINN, M., VISTAD, O., VAGLAND, J. 2000. Tourist Experiences and Attrac-
tions. In Annals of Tourism Research, vol. 27, 2000, no. 2. ISSN 0160-7383, pp. 432–450.
WAHLERS, R., ETZEL, M. 1985. Vacation preferences as a manifestation of optimal stimula-
tion and lifestyle experience. In Journal of Leisure Research, vol. 17, 1985, no. 4. ISSN 0022-
2216, pp. 283–295.
WANG, N. 1999. Rethinking Authenticity in Tourism Experience. In Annals of Tourism Re-
search, vol. 26, 1999, no. 2. ISSN 0160-7383, pp. 349–370.

139
WILLIAMS, D. R., PATTERSON, M. E., ROGGENBUCK, J. W., WATSON, A. E. 1992. Beyond the
Commodity Metaphor: Examining Emotional and Symbolic Attachment to Place. In Leisure
Sciences, vol. 14, 1992, no. 1. ISSN: 0149-0400, pp. 16–29.
WINIARSKI, R. (ed.) 2008. Turystyka w naukach humanistycznych. Warszawa: Wydawnictwo
Naukowe PWN. 178 p. ISBN 978-83-01-15608-4.
WOJNAROWSKA, H. 2005. Wyznaczniki lojalności klientów indywidualnych. In Zeszyty Na-
ukowe Akademii Ekonomicznej w Krakowie, no. 677, 2005. ISSN 1898-6447, pp. 85-101.
YAMADA, N. KNAPP, D. 2009. Adult Participants’ Preferences for Interpretation at a Japanese
Nature Park. In Journal of Interpretation Research, vol. 14, 2009, no. 2. ISSN 1092-5872, pp.
25–37.
YAVAS, U. 1998. Service Quality Sentiments as Correlates of Behavioral Intentions and Satis-
faction: A Study of Turkish Consumers. In Journal of Customer Service in Marketing and
Management, vol. 4, 1998, no. 1. ISSN 1069-2533, pp. 31–45.
YOON, Y., UYSAL, M. 2003. An examination of the effects of motivation and satisfaction on
destination loyalty: a structural model. In Tourism Management, vol. 26, 2003, no. 1. ISSN
0261-5177, pp. 45–56.
ZAKRZEWSKA, M. 1994. Analiza czynnikowa w budowaniu i sprawdzaniu modeli empirycz-
nych. Poznań: Wydawnictwo Naukowe UAM. 99 p. ISBN 8323204772.
ZEITHAML, V. A., PARASURAMAN, A., BERRY, L. L. 1990. Delivering Quality Service. New York:
The Free Press. 226 p. ISBN 0029357012.
ZEPPEL, H., HALL, M. 1991. Selling art and history: Cultural heritage and tourism. In Journal
of Tourism Studies, vol. 2, 1991, no. 1. ISSN 1035-4662, pp. 29–45.

140
Marek Maciej Nowacki is a professor of tourism in Faculty
of Tourism and Recreation at Eugeniusz Piasecki University of Phys-
ical Education in Poznan, Poland. He is interested in heritage inter-
pretation, cultural tourism and the management of heritage attrac-
tions. His PhD dissertation concerned the factors that determine
the character and the level of leisure activity.
The publication concerns visitors’ attractions as the primary aim of tourist trips and the
primary component of the tourism system. The central issue addressed in the book can be
formulated as the following question: what are the features of visitors’ attractions and the
visitors features that determine visitors’ satisfaction. The paper consists of the theory part
and the empirical study. As a result of theoretical investigation, a number of conclusions
concerning the nature and concept of visitors’ attractions were formulated. Questionnaire
surveys were conducted among visitors of four attractions located in the West Poland (N =
1770): the Archaeological Festival in Biskupin, the Museum of Agriculture in Szreniawa, the
Agricultural Museum in Dziekanowice and the Zoological Garden in Poznań. It was found,
that visitors' satisfaction is determined by two main groups of factors: subject-related
(visitors’ features) and object-related (attraction features). The subject-related factors
determining satisfaction include gender, age, education, size of the place of residence,
distance from the place of residence, acquaintance with the attraction and the frequency of
visiting similar attractions, interest in the subject matter related to the attraction, being part
of a sightseeing group, motivations – especially related to benefits in terms of education,
relaxation and a sense of authenticity. Attraction features that determine visitors’ satisfaction
include exhibitions containing vivid interpretations, shows, intriguing show-pieces, dioramas,
live animals and animal paddocks resembling real-life conditions, authentic and nostalgia-
provoking buildings and interiors. As a result of structural equation modelling, a number of
correlations within the model of satisfaction and visitor intention determinants were
identified. The segmentation of visitors was developed based on the benefits they gain from
visiting attractions. In the analysis, five visitors’ segments were received.