the determinants of technological … determinants of technological change ~ heart attack treatment...
TRANSCRIPT

NBER WO~G PAPER SERIES
THE DETERMINANTS OF TECHNOLOGICALCHANGE ~ HEART ATTACK TREATMENT
David M. CutlerMark McClellan
Working Paper 5751
NATIONAL BUREAU OF ECONOMIC RESEARCH1050 Massachusetts Avenue
Cambridge, MA 02138September 1996
We are gratefil to Jeff Geppert, Helen Levy, and Elaine Rabin for exceptional research assistance,to Janet Currie, Zvi Griliches, Jon Gruber, Larry Katz, Jim Poterba, and David Weil for comments,and to the National Institute on Aging and Commonwealth Foundation for financial support. This
paper is part of NBERs research programs in Aging, Health Care, Productivity and PublicEconomics. Any opinions expressed are those of the authors and not those of the National Bureauof Economic Research.
O 1996 by David M, Cutler and Mark McClellan. All rights reserved. Short sections of text, notto exceed two paragraphs, may be quoted without explicit permission provided that full credit,including @ notice, is given to the source.

NBER Working Paper 5751September 1996
THE DETERM~ANTS OF TECHNOLOGICALCHANGE ~ HEART ATTACK TREATMENT
ABSTRACT
This paper examines the sources of expenditure growth in heart attack treatment. We first
show that essentially all of cost growth is a result of the diffision of particular intensive
technologies; the prices paid for a given level of technology have been constant or falling over time.
We then examine the reasons for this technology diffision. We distinguish six factors that may
influence technology diffision: organizational factors within hospitals; the insurance environment
in which technology is reimbursed; public policy regulating new technology; malpractice concerns;
competitive or cooperative interactions among providers; and demographic composition. We
conclude that insurance variables, technology regulation, and provider interactions have the largest
quantitative effect on technological difision. These factors affect both technology acquisition and
the frequency of technology use.
David M. CutlerDepartment of EconomicsHarvard UniversityCambridge, MA 02138and [email protected] .edu
Mark McClellanDepartment of EconomicsStanford UniversityStanford, CA 94305-6072and NBERmarkmc@nber. harvard. edu

Persistent growth in health expenditures over the past several decades has moved the cost of
health care to the top of the policy agenda. In the United States and most of Europe, spending on
health care has become a political as well as economic issue, and proposals to limit spending are
commonplace.
Despite this widespread concern, very little is known about the fundamentals of health
expenditures. At an accounting level, Aaron (1991) and Newhouse (1992) both show that “static”
supply and demand factors such as increased moral hazard or administrative expense can explain
less than half of the growth of medical spending; each attributes the residual to technological
change. Fuchs (1996) shows that this view has become a consensus among health economists. But
despite this consensus, direct evidence on the role of technological change in cost growth is lacking,
and there is little analysis of the reasons for this rapid technological change.
In this paper, we analyze the importance of technological change in explaining medical care
cost increases and determine the factors explaining technological diffusion. Previous work has
typically considered the importance of technological change by looking at cost growth in aggregate.
Since medical conditions and technologies vary so much from disease to disease, however, the
aggregate approach cannot yield firm estimates of the importance of technological change for
medical care costs. We thus focus on technology for a particular medical condition: acute
myocardial infarction (AMI, or heart attack). Heart disease, of which heart attacks are a serious
complication, is the single leading cause of death in the United States and accounts for around one-
seventh of all medical expenditures. In addition, technology used in the treatment of heart disease
has changed tremendously in the past decade. Thus, analyzing technology involved in treating heart
attacks sheds light on the determinants of technological change in a case where it really matters,
We begin by decomposing expenditure growth for heart attack care into the share of patients

receiving intensive procedures and the price of these procedures. We show that essential Iy all of the
growth in costs results from the diffusion of intensive technologies -- the development of entirely
new technologies and the diffusion of existing technologies to new patients, The price of a given
treatment has been constant or falling over time. Thus, measuring spending directly at the micro
level suggests that technological change accounts for an even larger share of cost increases than the
aggregate residual analysis suggests.
We then examine why costly technologies for heart attack care have diffused so rapidly. We
distinguish six theories of the determinants of technology diffusion: organizational factors within
hospitals; the insurance environment governing the technologies’ use; public policy regulating
technologies; malpractice concerns on the part of providers; competitive or cooperative interactions
among providers; and demographic change. We find that the insurance environment, technology
regulation, and provider interactions are most important in explaining technology diffusion.
Together, these factors explain a significant part of technology diffusion and suggest that some
policies can have long-run effects on the rate of technological change in medicine.
The paper is organized as follows. Sections I and II describe treatment of heart attacks and
examine the sources of cost increases in heart attack treatments, Section III then discusses the factors
that may influence the diffusion of technology. Sections IV through VI examine the determinants of
technological change. The last section concludes.
I. The Cost of Heart Attack Treatment
We focus on technological change in heart attack treatment. Heart disease, of which heart
attacks are a leading example, accounts for one-seventh of medical spending and is the leading cause
of death in the United States. In addition, people with a heart attack will necessarily be admitted to a
2

hospital, so that hospital records can be used to trace incidence and treatments.
To measure the cost of heart attack treatment, we developed a sample of Medicare hospital
claims for essentially all elderly patients hospital ized with AMI between 1984 and 1991.1 Our focus
on the elderly is largely for data reasons: long-term, longitudinal data on the non-elderly U.S.
population are not available. Most AMIs occur in the elderly, however, and the same technologies
used in treating AMI in the elderly are used in treating nonelderly patients, so our restriction to the
elderly should not be a major concern.
Heart attack treatment may involve followup care in and out of hospitals for a period of
several months. We include all admissions within a 90 day period after the initial attack in a heart
attack episode, and use this episode as the basis for our subsequent analysis. There are roughly
230,000 new heart attacks episodes in the elderly per year.
Table 1 shows summary statistics on Medicare reimbursement for heart attack episodes
between 1984 and 1991. As the first row shows, average reimbursement per heart attack patient (in
1991 dollars) rose from $11,175 in 1984 to $14,772 in 1991, for a 4 percent annual increase.2 In
total, inpatient expenditures for a heart attack among those 65 and over rose from $2.6 billion in
1984 to $3.4 billion in 1991, Clearly, spending for heart attack treatment is a major issue for the
medical sector.
To understand the source of this cost increase, it is necessary first to describe the treatment
of heart attacks in more detail. One set of technologies for treating heart attacks involves “medical
‘The process for developing the claims data are described elsewhere (McClellan andNewhouse, 1994; McClellan, 1995b).
2This increase roughly equals the growth in aggregate medical expenditures (4.7 percent inreal per capita terms) over the same period.
3

management”: in the acute period, drug therapies, monitoring technologies, and intensive-care
interventions if needed for heart failure or irregular heart rhythms; later, drug therapy and counseling
to promote a healthy lifestyle and reduce the risk of future heart attacks. This type of care involves
many important technologies -- for example, thrombolytic (clot-busting) drugs were developed in
the 1970s and used on a wide-scale basis in the 1980s -- but it does not involve invasive procedures
to restore blood flow to the heart.
These invasive cardiac treatments begin with cardiac catheterization -- a radiologic study of
blood flow to the heart muscle. Catheterization was developed in the late 1960s and became more
widely used in the treatment of patients with heart disease over the next decade, If the
catheterization detects “significant” blockage, a range of revascularization procedures may be
performed with the goal of eliminating the blockage. Two major types of revascularization
procedures have become widely used: bypass surge~, a major open-heart operation that involves
bypassing blocked blood vessels, and angioplasty, a percutaneous (less invasive) procedure that
seeks to restore blood flow via inflating a balloon amid the blockage. Bypass surgery was also
developed in the late 1960s. Angioplasty is a more recent technology. It was first applied clinically
in the late 1970s but did not become a Medicare-covered service until November 1982. Since
angioplasty was the most recent technology, examining the diffusion of this technology provides the
best evidence on how a medical technology progresses from being rarely to widely applied. We thus
focus on this technology in particular in our empirical work.
All of these procedures have undergone considerable refinement over time, as cardiologists
and cardiac surgeons have identified “process” improvements and developed experience with
patients who benefit from them.
All of these procedures also involve substantial fixed and variable costs. Performing
4

catheterization requires specialized equipment (radiologic scanners, monitoring devices, and
dedicated catheterization devices) as well as specialized cardiac nurses and technicians. Angioplasty
requires a catheterization lab plus additional investments in specialized staff and devices. Bypass
surgery is the most costly technology, requiring equipment such as heart-lung bypass machines and
nurses with training for cardiac operations and cardiac intensive care.
This set of treatment paths provides a natural mechanism for decomposing spending growth.
The middle rows of the Table show what has happened to prices paid for intensive procedures, and
the share of patients receiving these procedures over time.3 Real spending for patients with a
catheterization only or angioplasty fell,4 while spending for patients who were managed medically or
received bypass surgery rose slightly. The penultimate row of the Table shows that a Paasche “price
index” for heart attacks treatments actually fell by 0.2 percent annually,5
In contrast to essentially flat prices, there has been a dramatic increase in the use of intensive
cardiac procedures over time. Figure 1 and the Iefi columns of Table 1 show the share of heart
attack patients receiving intensive treatments. Between 1984 and 1991, the rate of cardiac
catheterization quadrupled, from 11 percent to 41 percent. The share receiving bypass surgery
nearly tripled (from 5 percent to 13 percent) and the share receiving angioplasty rose 10-fold (from 1
3Some patients receive both angioplasty and bypass surgery, for example because theangioplasty failed and bypass surge~ was necessary. We group these patients in the bypass surgerygroup.
4The reimbursement rate for angioplasty was reduced substantially in 1986 as officialsrealized it was much less expensive than the DRG it was assigned to and thus reassigned it to alower-weighted DRG. Reimbursement for catheterization changed as more catheterizations weredone in the initial hospital stay rather than in multiple stays. See Cutler and McClellan (1996) formore discussion.
5Cutler, McClellan, Newhouse, and Remler ( 1996) discuss the formulation of a price indexfor heart attack care in more detail.
5

percent to 12 percent). Thus, in only an 8-year period, the treatment of heart attacks changed
fundamentally. The diffusion of these technologies almost entirely explains expenditure growth. As
the last row of the Table shows, the change in procedure use holding prices constant accounts for a 3
percent annual increase in real spending.A
Thus, explicit measurement of changes in technology use demonstrates that technology
diffusion explains an even larger share of expenditure growth than was suggested by previous studies
based on residual analysis. In the remainder of the paper, we examine the determinants of
technology diffusion. We begin with a simple characterization of technology change.
II. Characterizing Technological Diffusion
Figure 1 demonstrates a fundamental point about technology diffusion: technological
diffusion involves both the application of new technologies and the expanded use of existing
technologies. Two of the technologies with rapid procedure growth (catheterization and bypass
surgery) were well developed by 1984, while one technology (angioplasty) was essentially new.
This type of situation is consistent with Rosenberg’s (1994) analysis of the importance of technology
diffusion in many industries. It highlights that economic explanations for diffusion must focus on
both the intensive margin of procedure use as well as the extensive margin of technology acquisition.
Increases in procedure use can occur for one of three reasons: new hospitals acquire
technologies; hospitals with the technology expand their use of it; or hospitals without the
technology transfer more patients to hospitals with the technology, where they receive it. We sort
patients on the basis of their hospital of initial admission, since heart attack patients tend to be taken
‘The remaining source of cost growth is the covariance between price and quantity changes.
6

to a nearby hospital first, and the initial hospital choice has a substantial impact on the patient’s
entire course of treatment.’ The probability that a patient receives a particular procedure can be
decomposed into
Pr Use] = Pr[Own] “(Use Own) + (1 -Pr[Own]) “(use 1~~ t OWn) (1)
where Pr[Own] is the probabi Iity that the hospital to which the patient was initially admitted had
acquired the procedure, (Use 10wn) is the probability that a patient whose initial admission was at a
hospital that owned the procedure receives the procedure within 90 days and (UselNot Own) is the
probability that a patient initially admitted to a hospital without the procedure is transferred or
readmitted to another hospital within 90 days and undergoes the procedure.
Table 2 shows evidence on the importance of these three terms to total intensity growth.
The first rows of Table 2 report the share of hospitals with each technology in 1984 and 1991. We
count a hospital as having adopted the procedure the first year it reported performing it 3 or more
times.* The availability of these technologies increased substantially over the period, roughly
doubling in each case.
Patients initially admitted to hospitals with intensive technologies are substantially more
likely to receive these technologies than patients admitted to hospitals without these intensive
technologies. Figure 2 shows this in the case of angioplasty. In 1991, patients initially admitted to
‘See McClellan (1993) and McClellan and Newhouse (1996) for a more detailed discussionof the impact of technology availability and adoption on hospital practices.
‘Conditioning on 3 uses is done to avoid data errors from improper coding on claims forms.To count procedures, we look at the discharge records for both AMI patients and patients withischemic heart disease (IHD, a milder form of heart disease). Including this latter group allows us tobe more precise in technology ownership for hospitals with few AMI patients. There are about350,000 new IHD cases annually.
7

hospitals with angioplasty (the average of the top two lines) received the procedure nearly twice as
frequently as patients admitted to hospitals without the capacity to perform angioplasty. This
differential implies that the spread of technological ownership is an important component of
technology diffusion. Indeed, as the second block of Table 2 shows, the increase in the number of
hospitals with each procedure -- holding utilization rates constant at their 1991 levels -- accounts for
between 10 and 20 percent of total increase in procedure use.9
Figure 2 also shows substantial increases in procedure use in hospitals both with and without
the technology throughout the 1984-1991 period. The rate of angioplasty use rose from 3 percent to
21 percent in hospitals with the technology each year, and from 0.5 percent to 9 percent in hospitals
without the technology in any year. As the last two rows of Table 2 show, each of these factors
accounts for 30 to 60 percent of total procedure use. Thus, it is important to examine both the
ownership of technologies and their u Itimate utilization.
To develop some sense for technology ownership patterns, Table 3 shows statistics for the
5,253 hospitals with at least one admission for AMI in 1991. Roughly half of hospitals have fewer
than 100 beds. But these hospitals receive only about 10 percent of the AMI patients, and fewer than
1 percent of them have invested in angioplasty or bypass surgery. As the size of the hospital
increases, the number of patients and intensity of technology increase as well. Eight percent of
hospitals with 100-199 beds had angioplasty capability, and nearly 90 percent of hospitals with 600
or more beds had the technology. Since AMI admissions and technology ownership are so scarce at
small hospitals, we focus our empirical analysis exclusively on hospitals with 100 or more beds.
‘ This estimate is likely to be a lower bound on the importance of acquisition to technologydiffusion since the ability of hospitals without the procedure to transfer patients to where they canreceive the procedure depends on the share of other hospitals with the procedure.
8

There is also a dramatic regional pattern to technology diffusion. Figure 3 shows the
geographic spread of angioplasty in 1984, when it was used in the treatment of only one percent of
elderly AMI patients. Each marker in the Figure is a zip code with a hospital that had acquired the
procedure. Even very early on, the diffusion of angioplasty was geographically widespread. This is
important because it suggests that we can use the regional variation in the structure of the health
system to learn about the sources of technology diffusion,
Even with the widespread spatial diffusion, there are clear regional differences in technology
acquisition, Angioplasty diffused very rapidly in the West, and much less rapidly in the Mid-
Atlantic and Southeast. This regional pattern is not unique to angioplasty. Numerous studies have
documented substantial regional differences in medical treatments which are very stable over time
(Phelps, 1992). To control for these underlying regional and city size differences, we include 9
region dummy variables and 7 dummy variables for city size in all of our econometric models.
III. Explanations for Technological Change
A great deal of theoretical research has speculated on the causes of technological diffusion in
medicine. 10We group the hypotheses into 6 categories.
Organizational Factors. A first set of issues is the organization of the hospital. Some hospitals,
because of their size or commitment to innovative care, will be more likely to acquire technologies
than other hospitals. As shown above, there are dramatic variations in patient distribution and
ownership rates by size of hospital. We thus limit ourselves to hospitals having 100 or more beds,
‘“See Griliches (1988) for a review of the economics of technical change more generally.
9

and control for the number of beds within this set, as shown in Table 3. We also include dummy
variables for government hospitals, for-profit hospitals, and teaching hospitals. Several studies have
suggested that not-for-profit hospitals and teaching hospitals may use technology more intensively
than for-profit hospitals, perhaps because not-for-profit hospitals value patient welfare more than
for-profit hospitals or because these hospitals feel it is their social obligation to provide high quality
care to everyone (Weisbrod, 1988; Hoerger, 1991). Government hospitals may also provide
different types of care than private hospitals, because their patient mix is different or revenues are
scarcer. The first block of Table 4 shows that these hospitals account for about 15 percent of the
sample in each case.
Insurance generosity. Many analysts have hypothesized that the insurance environment can
influence technological change. There are a number of potential links between insurance and
technological change. One channel is the “profitability” effect -- as insurance becomes less
generous, new technologies become less profitable and thus diffuse less widely. Less generous
insurance or increased monitoring of physicians may also change practice patterns in a way that
encourages less use of new technologies (Feldstein, 1971; Pauly, 1986; Weisbrod, 1991).
Countering this, however, is the “income” effect -- if technology is profitable at the margin, cuts in
inframarginal reimbursement may induce more utilization so that total profits remain roughly the
same. For example, Medicare pays near average cost for intensive surgical procedures even though
marginal cost is likely to be substantially lower than average cost. As a result, intensive cardiac
procedures are generally considered to be profitable for the marginal treatment. Thus, if
reimbursement is cut for non-Medicare patients or the needs of the uninsured rise, hospitals may
increase their utilization of intensive cardiac procedures to offset some of the income loss. There is
10

some evidence for this model when physician reimbursement rates are reduced (Christenson, 1992).
We use several measures of the generosity of insurance in our empirical work. The first two
variables reflect the nature of overall insurance coverage: the share of the population that is
uninsured, and the share of the population that is in Health Maintenance Organizations (HMOS). 1]
The uninsurance rate is formed from the March 1989 and 1990 CPS surveys; we match MSAS where
possible, and the rest of the state in other cases. HMO enrollment is from Interstudy. The data are at
the state level; no published data give HMO enrollment at a more disaggregated level. Since HMO
enrollment increases over time, we treat this enrollment as time-varying in our econometric model.
As Table 4 shows, the average hospital was in an area where 14 percent of people were uninsured
and 13 percent were in HMOS in 1991.
We also include an indicator for whether the state regulated hospital payments by all or most
payers. These regulations typically placed limits on per-diem or per-case reimbursement to
hospitals. Some previous research has found these regulations to be moderately effective in limiting
cost growth, but the conclusions are controversial (Dranove and Cone, 1985). Seven states had such
regulation for at least some of the period: Connecticut, Maryland, Massachusetts, New Jersey, New
York, Rhode Island, and Washington. Two of the states (Massachusetts and Washington) ended rate
regulation after 1988; we treat these states as having the regulation during the period it was in force.
These regulations as well may increase or decrease technology diffusion.
We also tried to estimate the effects of hospital payment generosity within the Medicare
system on technology adoption decisions. This requires a measure of the generosity of
reimbursement that varies independently across hospitals. Under the Prospective Payment System
]1 HMOS are the most restrictive form of managed care; they often have their own clinics orhospitals that members are required to visit to receive care.
11

(PPS), hospital payments for Medicare depend on the “weight” of the diagnosis-related group for an
admission, and the weights do not vary across hospitals. However, adjustments to the basic DRG
payment do vary as a function of hospital characteristics such as urbanicity and teaching status. The
problem with using these variations as a measurement of payment generosity is that the hospital
characteristics that lead to the payment variations may have a direct association with likelihood of
technology adoption. 12This source of variation thus does not seem appropriate for our analysis.
An alternative measure of PPS generosity is the “bite” of the system -- the extent to which
hospital payments changed with PPS adoption. The change in overall Medicare payment associated
with PPS depends on the use of intensive technologies such as the ones described above, however
(McClellan, 1996). We experimented with a broad range of techniques to construct an exogenous
measure of reimbursement generosity, Our resulting estimates were sensitive to the correction
method, however, so we do not have great confidence in these results, We thus do not report results
using a “bite” variable. We suspect that it will be necessary to examine more technologies with
different reimbursement profiles in order to identify effects of Medicare reimbursement on
technology acquisition.
Technolo~ regulation. States and the Federal government have used a variety of regulatory
methods to limit use of technology. These methods range from regulations requiring advance
approval of technology acquisition (“Certification of Need” requirements) to detailed reviews,
prospectively or retrospectively, of the use of technology in particular cases (such as peer review
organization activities in the Medicare program). To capture this, we include a dummy variable for
‘*These “direct” hospital effects are largely included in our models. However, if the directeffects are nonlinear, then this method will not consistently estimate the reimbursement effect.
12

states with a Certificate of Need program that applied to medical equipment purchases. Data on
Certificate of Need programs are from the Intergovernmental Health Policy Project. Twenty-five
states had a program for the entire period, and four states had a program for some of the period.
There are likely to be substantial disparities in the enforcement of these regulations across
states. For example, New York’s CON program is widely viewed as the most stringent. Because we
do not have information on the intensity with which these program are applied, we use a simple
indicator variable for the presence or absence of a program. Since more intensive Certificate of
Need programs are likely associated with the state rate regulation noted above, we suspect that our
rate setting variable picks up a more general “regulatory climate” rather than an effect specific to
rate setting programs. We return to this issue below.
Malpractice pressure. Concerns about “defensive medicine” -- the use of medical treatments not
worth their cost as a result of providers’ fear of malpractice claims -- are cited as a potential cause of
excessive medical expenditures (Office of Technology Assessment, 1994). Studies have suggested
that “direct” reforms in malpractice liability -- caps or bans on damage awards, eliminating
mandatory pre-judgment interest, or collateral source rule reform -- may lead to reductions in claims
rates, malpractice insurance premiums, and medical spending, without adverse effects on patient
outcomes (Danzon, 1986; Kessler and McClellan, 1996). We thus include a dummy variable for
whether states had adopted a direct reform. This variable changes over time. In 1984, 43 percent of
hospitals were in states with such a reform, while nearly 80 percent of hospitals were in a state with
such a reform in 1991. In our models, we allow the malpractice reform variable to vary over time.
Provider Interactions. Interactions between providers may affect the diffusion of technology for
13

several reasons. First, physicians may lobby hospital managers for technologies they are likely to
use or may “induce demand” for procedures they perform. Past work has shown, for example, that
special ists use intensive procedures related to their specialty more commonly than do general
physicians (Greenfield et al., 1992). To proxy for this, we include the share of physicians in the area
in 1985 (near the beginning of the sample) who were cardiologists or thoracic surgeons. 13The
average hospital is in an area where about 3 percent of physicians were cardiologists or thoracic
surgeons.
Interactions among hospitals may also affect technology diffusion, although the direction of
the effect is not clear. Some interactions between hospitals are likely to be competitive. If the fixed
costs of technology acquisition are low and use of the technology is potentially high, for example,
hospitals might engage in a “medical arms race” to acquire new technologies (Robinson and Lufi,
1985). As the costs of acquisition rise or the volume of suitable patients falls, in contrast, the
preemptive nature of other hospitals having acquired the technology may become more important.
A strict model of competition may not be the most appropriate for medical care, however.
Medical professionalism encourages ongoing interactions between physicians and hospitals in the
same area regarding new developments in practices. For example, teaching centers sponsor formal
training in the use of new techniques that clinical investigators on their staff have developed, and
smaller hospitals generally have established cooperative relationships with larger facilities to provide
intensive treatments which the smaller hospital does not have the capability to perform. Specialists
in a given geographic area also interact informally in the discussion of referred cases, at research
13As discussed below, we include a variable for the distance to a major teaching center, sothat this variable is not just picking up whether the hospital is in an area with a substantial teachingethic.
14

symposia, and in the observation of colleagues’ techniques. These interactions may influence the
diffusion of technology, although the direction of the effect is unclear. Being closer to teaching
hospitals, for example, may convince non-teaching hospitals that they can transfer patients rather
than acquire new technologies themselves, but they may also learn more rapidly that these
technologies are very valuable.
To capture these interactions among hospitals, we include two variables: the share of other
hospitals in the area that have already adopted the technology (weighted by the number of beds),’4
and the distance to the nearest major teaching center. 15The “arms race” and learning theories
suggests that a hospital will be more likely to acquire the technology when competitor hospitals have
already done so and when it is nearer to a major teaching center. The preemption theory and
cooperative treatment theory suggest that these factors will be negatively related to acquisition. The
average hospital was in an area where 37 percent of hospital beds had the technology in 1991, and
was nearly 200 miles from a major teaching center.
Demographic factors. The characteristics of the population served by a hospital may influence the
services it chooses to provide. Income is strongly associated with receipt of medical care as is age.
We thus include in our models the logarithm of median family income and the share of the
14Since the share of other hospitals with the technology changes over time, we treat thisvariable as time-varying in our hazard models. If there were no other hospitals with at least 100 bedsin the area, we set this variable to zero.
15We included the 14 cities with the largest number of interns and residents as major teachingcenters: Ann Arbor, Baltimore, Boston, Chicago, Cleveland, Dallas~ort Worth, Detroit, LosAngeles, New York, Philadelphia, Pittsburgh, St. Louis, San Francisco/Oakland, and Washington,D.C. To measure distance to a major teaching center, we treat each hospital as if it were at thegeographic center of its zip code and measure the distance to the nearest hospital in a major teachingcenter.
15

population over age 65.
IV. Reduced Form Estimates of Angioplasty Diffusion
To analyze the relationship between these various factors and technology diffusion, we begin
with reduced form estimates of the determinants of technological change. Since angioplasty is the
newest intensive procedure, we focus on explaining the diffusion of that technology. Our
regressions are of the form:
(2)
[
Share of Patients= xiJp + E,,,
Receiving Angioplasty, ,,
where i denotes hospitals and tdenotes years. As before, we sort patients on the basis of hospital of
initial admission. These regressions are reduced form in the sense that they do not separate the
response into an acquisition decision and a decision about use conditional on acquisition.
Before presenting estimates of equation (2), several issues are worth noting. The first
concerns the distinction between cross-section and time-series variation. While we have multi-year
data on acquisition and use of technologies, we do not think the time dimension is the most
interesting one. Rather, we are primarily interested in cross-sectional questions: do certain factors
increase the probability that a hospital acquires the technology or the speed with which the
technology is acquired? How do these factors affect the share of patients for whom the technology is
used? In certain cases, we allow the independent variables to change over time (for example, as new
legislation passes), but we are leery of using these data in a fixed-effects framework.
The second issue is the potential endogeneity of several of our variables. For example,
cardiologists may choose to locate in an area because they know the population there values high-
16

tech medical treatment of heart attacks. Even the number and type of hospitals may be endogenous
to technology acquisition. We have two responses to this concern. First, many of these endogeneity
issues -- particularly those involving the public policy variables -- are likely to work against our
finding any significant effects. For example, if states pass malpractice reform legislation because
they believe past technology adoption was too rapid, our estimates would be biased toward a positive
association between malpractice reform and technology acquisition. Findings that policy variables
limit the diffusion of technology are therefore likely to be lower-bound estimates. Second, it maybe
more appropriate to think of these market variables as part of a system of responses. We are
examining the effect of existing market characteristics, such as physician supply, on hospital
technology adoption decisions. One could then couple this analysis with a model of how physician
supply responds to technology diffusion. Our results begin to characterize this system.
A third concern is about unmeasured area effects that might influence all hospitals in a
region similarly. If demand for angioplasty is high in an area, hospitals wi II be more likely to
acquire the technology. This will be measured as an increase in the “competition” that a hospital
faces, inducing a noncausal relationship between our measure of competition and technology
acquisition. In linear models, one solution to this problem is to instrument for the ownership
decision of other hospitals using the characteristics of those hospitals (Besley and Case, 1995).]6 In
nonlinear models, such as our hazard model below, no equivalent instrumental-variables solution
exists. We instead implement an analogous two-stage least-squares technique. In the first stage, we
regress the competition variable each year on the other x’s for that hospital and the average x’s for
‘bThe linear model may be expressed as y = x~+aWy+~, where y is an indicator for whetherthe hospital has the technology and W is a weighting matrix that assigns each hospital the averageacquisition rate of the other hospitals in the area. This equation can be re-written as y = (l-aW)-L.[x~+~], and a and ~ can be estimated using a Taylor series expansion.
17

the area as a whole. We then form the predicted values from this equation and use the predicted
competition measure in our regressions. The identi&ing assumption is that the average x’s in the
area as a whole should not affect a given hospital’s decision to acquire the technology once we
account for that hospital’s characteristics. In practice, the variation in the average x’s in the area
comes largely from variation in the bed size, teaching status, and ownership status of the other
hospitals; these characteristics seem plausibly exogenous to a given hospital.
Table 5 presents our reduced form models of the share of patient receiving angioplasty in
1984 and 1991. We exclude hospitals in the District of Columbia (very high incidence of patient
crossover from adjacent states, complicating our measurement of the factors influencing adoption)
and in Hawaii and Alaska (extreme values for some of our technological-proximity measures). This
leaves a final sample of 3,033 hospitals, of which roughly 2,900 have admissions in any given year. ”
The regressions are weighted by the share of patients admitted to each hospital. We include all of the
explanatory variables discussed above, as well as seven dummy variables describing the hospital’s
MSA size category. In the first two columns, we also control for region dummy variables, to capture
long-standing differences in technology utilization by region.
The region variables and city size variables (not reported) are significantly related to
procedure use. Use was highest in the West and Rocky Mountain areas, and lowest in the Southeast.
The MSA size effects suggest an inverse U-shape pattern of technology use. Use rates are highest in
mid-size cities and then decline in the very largest and very smallest MSAS.
The first block of Table 5 shows coefficient estimates for the effects of hospital
“This sample of hospitals is the set for which summary statistics were reported in Table 4.We also estimated models excluding hospitals that closed or merged over the period and hospitalswith few patients in some years. The results were very similar to those reported.
18

characteristics on angioplasty use. They accord well with expectations. Patients initially admitted to
larger hospitals are more likely to receive the technology than are patients admitted to smaller
hospitals. The difference in receipt among very large and very small hospitals increases from 1
percent in 1984 to 7 percent in 1991, which are large compared to the average procedure utilization
rate (1 percent in 1984 and 12 percent in 1991). Patients initially admitted to government hospitals
are somewhat less likely to receive angioplasty, but there is no significant difference in patients
admitted to for-profit and teaching hospitals,
The second block shows the effect of the insurance variables on diffusion. The insurance
variables are significantly related to the diffusion of technology. Two of the variables support the
“profitability” hypothesis, Patients admitted to hospitals in states with rate regulation have lower
use rates, and this difference is substantial -- over 3 percentage points in 1991. Increased managed
care enrollment is also associated with less use of angioplasty in both years. A one standard
deviation increase in HMO enrollment reduces angioplasty use by about .6 percentage points.
There is also some evidence for the “income effect” hypothesis, however. In areas with
more uninsured, there is increased use of angioplasty in the elderly, by 1.5 percentage points per one
standard deviation increase in uninsured. To the extent that income effects are operative, we would
expect them on the uninsured more than for those with insurance.
The third block shows the effect of technology regulation on procedure use. Certificate of
Need regulations reduce angioplasty use by about 1.6 percent in 1991. This effect is smaller than
that of the Rate Regulation variable, particularly in 1991. As noted above, this might be due to the
absence of reliable data on the stringency of review programs, leading our rate regulation variable to
encompass a more general “regulatory climate”.
The fourth block of the Table shows that malpractice reform is not related to use of

angioplasty. The coefficient is small and statistically insignificant in both years.
The provider interaction variables, shown in the fifih block of the Table, are also related to
diffusion, In areas with a greater share of cardiovascular physicians, more patients receive
angioplasty, particularly in 1991. The coefficient implies that if the share of cardiovascular
physicians were 1 standard deviation lower in 1991, utilization of angioplasty would have fallen by
0,5 percentage points. This is consistent with a model that specialists tend to use new technologies
more aggressively. The hospital-interaction variables present a mixed story. Hospitals are more
likely to use a procedure if other hospitals nearby have acquired it, but there is no effect of distance
to a major teaching center on utilization. These results are partly but not fully consistent with the
“arms race” or learning models. It is clear that neighboring hospitals’ patterns of technology use are
an important influence on technology use at a given hospital.
The coefficients on the demographic variables are mixed. Higher county income is
associated with greater use of angioplasty, while a larger population share of the elderly is associated
with less use. These variables thus do not tell a consistent story.
The regressions in the first two columns control for region effects. State factors may also be
correlated with the diffusion of technology. For example, physician density varies across states and
may be related to the physician specialty mix. If such unmeasured state variation is not captured
with the regional dummy variables, it might bias the coefficients on the physician mix. To address
this concern, we estimated the model including state dummy variables instead of region dummy
variables. In this specification, we cannot include any of our state-level variables, including HMO
enrollment, and indicators for rate regulation, Certificate of Need regulation, and malpractice
reforrrs. However, we can investigate how the other coefficients are affected by including state
effects.
20

These results are reported in the third and fourth columns of the Table. Most of the
coefficients are almost identical in the specifications with region- and state-effects, The most
noticeable difference is the coefficient on distance to a major teaching hospital, but even for this
variable the difference is not substantial. Thus, in the rest of the paper we report resu Its from models
with region effects only.
Overall, our reduced form results suggest that the most important variables explaining the
diffusion of technology are the generosity of insurance, technology regulation, and provider
interactions.
V. Structural Estimates of Technology Diffusion
The reduced form estimates documented that factors like insurance generosity, public sector
regulations, and provider interactions affect the use of technology. Those estimates did not
differentiate between changes in acquisition probabilities and changes in use conditional on
acquisition, however. For policy purposes, it is important to separate these two sources of changes
in utilization. If there are fixed costs to acquiring technologies or learning curves in employing new
technologies, for example, factors that reduce the number of hospitals acquiring a technology but
increase use in each hospital with the technology will improve overall welfare. Indeed,
concentrating the use of resources into larger groups has been one goal of technology regulation. The
division between acquisition and use is also important in the incentives for technology development.
Innovators of some technologies (such as radiological scanning equipment) receive revenue only
when the technology is purchased, independent of how frequently it is utilized. 16Thus, changes in
1*This is not true for all technologies. For example, the developers of angioplasty cathetersreceive revenue from each sale, rather than the number of hospitals adopting the technology.
21

the number of hospitals acquiring the equipment, rather than total utilization, will affect the
incentives to develop it. Finally, the general concern about “access” to health care for the uninsured
is largely a question about whether the hospitals treating uninsured patients have the capability (and
the financial resources) to provide high quality medical care to uninsured patients. If technological
availabi Iity is concentrated in hospitals more 1ikely to treat the insured, then access to intensive
technologies for the uninsured will suffer, no matter how frequent such use is for the insured. To
analyze these issues, we need to separate the effects on procedure use into changes in the acquisition
probability and changes in use conditional on acquisition. We do this in this section.
EA. The Technolo~ Acquisition Decision
We begin with the decision of hospitals to acquire angioplasty capability. Since we have
longitudinal data on hospital technology adoption for an 8 year period, a natural model of ownership
is a hazard model (Rose and Joskow, 1990). Denoting the cumulative probability that a hospital has
angioplasty at time t as Fi(fl and the density function at time tas~(~, the hazard is the probability
that a hospital acquires the technology at time tconditional on not having acquired the technology
up to that point: 2,(O =J(t)/[l-Fi(~]. We specify a proportional hazard model for technology
adoption: li(~ = exp(xi(flfl) cJO(t,),where xi(~ is the (potentially) time varying proportional hazard
and 20(t,, is the baseline hazard. Denote v(O = ln(~~.l2.(s,, ds), the logarithm of the integrated
baseline hazard from t-l to t.Then, if the xi(t) variables are constant within a period, the cumulative
acquisition probability is given by:
F,(t) = 1 -exp[ )
-~ exp(xi(s)~+y(s)) .~=1
(3)
22

We estimate the baseline hazard (YJ semi-parametrically, as in Meyer (1990) and Cutler (1995).
The probability that a hospital acquires the technology during period t,”is Fi(t,)-Fi(t,’-l),
The probability that a hospital has not acquired the technology as of the end of the sample (~ is 1-
F,(T). Denoting c, as an indicator for the hospital being censored, the likelihood function for the data
is:
L = fi [Fi(t,”)-Fi(ti*-1 )]’‘“ [1 -F,(~]c’.j=~
(4)
We maximize the logarithm of the likelihood using standard techniques.
The first column of Table 6 presents results of hazard models for the diffusion of
angioplasty, The estimated effects of hospital-specific factors are qualitatively similar to those in the
reduced form models. Larger hospitals and teaching hospitals have much higher adoption hazard
rates, and government hospitals have lower hazard rates. All of these results are statistically
significant.
The remaining blocks show the coefficients on the policy and market variables. Two sets of
variables are most important in explaining technology acquisition: insurance generosity, and the
provider interactions, As the second block shows, the insurance variables have substantial effects on
technology adoption: areas with high HMO enrollment or with rate regulation are less likely to
adopt angioplasty. There is no effect of the percent uninsured on technology ownership.
To evaluate the magnitude of these coefficients, Table 7 shows simulations of technology
utilization under different assumptions. The first column shows the overall change in technology
utilization in 1991 implied by the reduced form models in Table 5. For example, holding HMO
enrollment constant at its 1991 level would have increased the rate of angioplasty utilization in 1991
23

from 13.6 percent to 14.1 percent. The second column shows the change in the share of hospitals
predicted to have the technology, given by the hazard models, Relative to the 31.4 percent of
hospitals with angioplasty in 1991, if HMO enrollment had been constant at its 1984 level, an
additional 2.2 percent of hospitals would have invested in angioplasty. And if rate regulation had
been imposed in all states, 7.8 percent fewer hospitals would have invested in angioplasty.
Since patients who are initially admitted to hospitals with angioplasty are more likely to
receive the procedure than patients initially admitted to hospitals without the technology, this
increase in procedure availability will increase overall utilization rates. The magnitude of this effect
is shown in the third column of the Table; given the average rate of utilization in hospitals with and
without the procedure, if HMO enrollment had remained at its 1984 level, an additional 0,2 percent
of patients would have received the procedure. And if rate regulation were imposed in all states, 0.7
percent fewer patients would receive the procedure. Relative to the change in total utilization given
in the first column, the changes resulting from HMO enrollment and rate regulation are 25 percent
(0.7 percent/2.8 percent of the change for rate regulation) to 40 percent (0.2 percent/O.5 percent of
the change for HMO enrollment) of the total effect on utilization.
The second important variables are the provider interactions. A higher proportion of
cardiovascular physicians in an area is associated with significantly earlier adoption, consistent with
the models of lobbying or induced demand. A one standard deviation reduction in the share of
cardiovascular physicians in an area would reduce the share of hospitals with the technology by 3.5
percentage points and would reduce procedure rates by 0.3 percentage points, about 60 percent of
the total change in utilization resulting from this variable. The hospital variables are again mixed.
Increased shares of other hospitals with the technology also increase diffusion, but so does moving a
hospitalfarther from a major teaching center. Thus, it appears that no simple story can explain the
24

coefficients on hospital variables.
The other variables are insignificantly related to adoption or have negative effects on
adoption (as with the share of the elderly). The overall conclusion is that in understanding
technology acquisition, the most important measures are insurance and provider effects. These
variables significantly influence the acquisition decision, which is about half of the overall effect,
Z B. Use Conditional on Ownership
The second part of diffusion is the extent to which technology is utilized once it has been
acquired. Since the same factors may affect hospitals with the technology differently from hospitals
without the technology, we specify the conditional use equation separately for patients admitted to
each type of hospital:
[
Share of Patients
Receiving Procedure[
xi~p” + E:,
——
i,t xi, p + E;,
1~own
if not own
(5)
As is well known, estimating equation (5) separately for hospitals that Ilave and have not
acquired the technology may lead to biased estimates if the hospitals whose ownership decision is
affected by the x variables differ in their underlying propensity to use the technology. If we had an
instrument that influenced hospitals’ adoption decision but did not affect how frequently they used
the technology, we could condition on the exogenous dimension of technology acquisition and
estimate equation (5) for those hospitals. We suspect, however, that there are no instruments for
acquisition that would not also affect technology utilization. Thus, there are no natural instruments
for this equation.
In the absence of an instrument, we estimate equation (5) with a sample selection correction
25

(Heckman, 1979).[’ It is important to recognize that our estimates of ~ depend on our choice of
parameterization for the maximum-likelihood model and are identified only because of non-
linearities in the equations for acquisition and conditional use. In contrast, there is no selection-bias
problem for the decision to acquire technology, since the sample of potential acquirers (the universe
of hospitals) is fixed. For this reason, we have more confidence in our models for technology
acquisition than in our models for use conditional on ownership.
The remaining columns of Table 6 present estimates of the effect of our policy and market
factors on the decision to use angioplasty in hospitals with angioplasty (column 2) and hospitals
without angioplasty (column 3). We pool all 8 years of data in estimating equation (5) and include
year dummy variables, so that our total sample is nearly 20,000 hospital -years.20 The last row of the
Table shows the coefficient on our sample selection variable. We find evidence of selection for
adopters but not for non-adopters; hospitals that use the procedure more are more likely to acquire
the technology than the hospitals that would use it less frequently.
The insurance variables are strongly related to technology use, generally with larger effects
for adopters than nonadopters. In several cases, these variables reinforce the estimates in the
19Our correction is slightly non-standard since our first-stage equation is non-linear. Notethat the hazard model can be rewritten as:
ItZ(f,) = log ( / ~Jsx)b)ds ) = u,
o
where Uihas Type I extreme value distribution, with cumulative distribution function F(.). Wedefine U’i= @-l[F(ui)]>so that u* is a normally distributed error corresponding to u. Our selectioncorrection is based u“ rather than u. In particular, if the hospital acquired the technology in year ti, weknOW that z(ti- 1)< ui<z(ti), or that @-l[F(z(ti-l))] <u”i<@-l[F(z(ti))]. The expectation of the error termis the conditional mean of U“i.
20Wecorrect the standard errors for inter-hospital correlation,
26

acquisition equations. Increased HMO enrollment not only lowers adoption; it also reduces
utilization of the technology. The same is true for the imposition of rate setting. As Table 7 shows,
these effects are a bit larger than the effect resulting from changes in acquisition rates, but of the
same order of magnitude.
The uninsurance rate is positively related to technology utilization, particularly in hospitals
that have acquired the technology. This is what would be predicted from the “income effect”
hypothesis. Thus, there is some evidence for the income effect hypothesis, as well as strong
evidence for the profitability hypothesis.
The next block shows that Certificate of Need regulation has a negative effect on use, for
both adopters and non-adopters. The magnitude of this effect is roughly comparable to that for rate
regulation.
The provider interactions typically have much smaller effects on use conditional on
acquisition than they do on the probabi Iity of acquisition, and the statistical power of these estimates
is generally much smaller. Increased shares of cardiovascular physicians are associated with
offsetting effects on transfers to receive the procedure at nonadopting hospitals and use of the
procedure in adopting hospitals. And the measures of competition and distance from a teaching
hospital are essentially unrelated or negatively related to use of the procedure.
Finally, increased income is associated with a greater likelihood that people admitted to
hospitals without angioplasty capability will ultimately receive it, by roughly 0.5 percentage points
for a one standard deviation increase in income.
significantly affect conditional procedure rates.
The share of the elderly population does not
Overall, the most important variables explaining technology use once it has been acquired
are the insurance generosity and regulations on technological availability.
27

VI. Ownership, Financial Incentives, and Technology Diffusion
Our models so far have not allowed for differential responses across hospital types to the
determinants of technological change. Examining differences across hospital types is important,
however. Different hospitals have very different clienteles. Public hospitals are disproportionately
likely to serve the indigent, for example, while for-profit hospitals have wealthier, better-paying
patients. As policy or market factors change, public hospitals may be affected very differently from
for-profit hospitals, with important effects on access to medical care. In this section, we examine
how financial factors differentially affect non-profit, for-profit, and government hospitals. The
public concern about care for the uninsured largely concerns access issues: are the uninsured being
treated at hospitals with the same technological capability as the insured? If the hospitals have
different capabilities, how different are they? The focus on access to resources suggests that we
worry particularly about the availability of technology in different hospitals rather than the use
conditional on availability.
The natural way to examine these access issues is to estimate our hazard models for
technology acquisition separately for for-profit, not-for-profit, and government hospitals. There are
not enough for-profit hospitals (364 hospitals) and government hospitals (386 hospitals), however, to
estimate such models precisely. Consequently, we instead interact the dummy variables for for-
profit and government hospitals with our measures of insurance generosity and examine instead the
more limited question of how insurance variables differentially affect these different hospitals.
Implicitly, this imposes constancy of the other coefficients across types of hospitals.
Table 8 shows models for the acquisition of angioplasty where the financial variables are
interacted with ownership status of the hospital. All of the other variables are the same in this Table
as in Table 6; for convenience, we repoi-t only the direct effects of government and for-profit status
28

on diffusion, and the interaction terms. Because there are so few for-profit hospitals in states with
rate setting (17 in total), we omit this interaction.
The estimates suggest two important differences in how insurance generosity affects
different hospitals. First, private, not-for-profit hospitals and government hospitals are more
sensitive to the presence of HMOS than are for-profit hospitals. Indeed, the estimates suggest that
HMOS have no effect on for-profit hospitals, and have a roughly equal effect on public hospitals and
private, not-for-profit hospitals. This is consistent with the theory that increased HMO enrollment
will shift the distribution of resources towards for-profit hospitals and away from non-profit and
government hospitals.
Perhaps more importantly, the uninsurance rate has a significant negative impact on
technology acquisition in for-profit and particularly government hospitals, while it does not affect
acquisition by private, not-for-profit hospitals. A government hospital in an area with an uninsured
population share that is one standard-deviation larger than average has hazard rates for technology
adoption about 40 percent lower than in private, not-for-profit hospitals, This result is concerning,
because of the increasing tendency for the uninsured to receive care in public rather than private
hospitals over time. Should this trend persist, it suggests that the availability of care for the
uninsured may fall over time relative to care for the insured.
VII. Conclusion
In this paper, we examine the diffusion of technology for treatment of heart attacks.
Between 1984 and 1991, the cost of a heart attack rose 4 percent annually in real terms. We first
show that the dramatic expansion of intensive cardiac surgeries accounts for essentially all of the
growth in treatment costs, In contrast, the real price of heart attack treatments has been nearly
29

constant.
We then examine at a micro level the sources of this technology diffusion. We find that
insurance generosity, technology regulation, and provider interactions have the most important
effects on the diffusion of technology. These variables affect the diffusion of technology through
both changes in the share of hospitals that acquire the technology and changes in the share of
patients who receive it once it has been acquired.
Our results are valuable in that they examine a specific disease where it is possible to learn
about the technologies involved in great detail without resorting to a technology “residual”. Where
our results are most tentative, however, is that they are evidence for only one type of technology. It
would be useful to examine other technologies where the institutional and reimbursement
environment varies more to determine how different policy and market factors affect diffusion more
broadly. We leave this as a topic for future research.
30

References
Aaron, H., 1991, Serious and Unstable Condition: Financing America’s Health Care, Washington,D.C.: The Brookings Institution.
Besley, T., and A. Case, 1995, “Incumbent Behavior: Vote Seeking, Tax Setting and YardstickCompetition”, Anzerican Economic Review, March, 25-45.
Christenson, S., 1992, “Volume Responses to Exogenous Changes in Medicare’s Payment Policies”,Health Services Research.
Cutler, D.M., 1995, “The Incidence of Adverse Medical Outcomes Under Prospective Payment”,Econometrics, February, 29-50.
Cutler, D,M., and M. McClellan, 1996, “What Is Technological Change?” in Wise, D., cd., Topics in
the Economics of Aging (Chicago: Univ. of Chicago Press), forthcoming.
Cutler, D.M., M. McClellan, J.P. Newhouse, and D. Remler, “Are Medical Prices Declining?”,m imeo, Harvard University, 1996.
Danzon, P.M., 1986, “The Frequency and Severity of Medical Malpractice Claims: New Evidence,”Law and Contemporary Problems 49:57-84.
Dranove, D., and K. Cone, “Do State Rate-Setting Regulations Really Lower Hospital Expense?”,Journal of Health Economics, 159-165.
Feldstein, M., 1971, “Hospital Cost Inflation: A Study of Nonprofit Price Dynamics”, American
Economic Review, 853-872.
Fuchs, V. 1996, “Economics, Values, and Health Care Reform”, American Economics Review,
March, 1-24.
Giljens, A., and N. Rosenberg, 1994, “The Dynamics of Technological Change in Medicine”, Health
Afiairs, Summer, 29-45.
Greenfield, S. et al., 1992, “Variations in Resource Utilization Among Medical Specialties andSystems of Care: Results from the Medical Outcomes Study”, Journal of the American
Medical Association, 267:1624-1631.
Griliches, Z., 1988, Technolo~, Education, and Productivi~, London: Basil Blackwell.
Heckman, J.J., 1979, “Sample Selection Bias as a Specification Error”, Econometrics, 153-161.
Hoerger, T.J., 1991, “Profit Variability in For-profit and Not-for-profit Hospitals”, Journal of Health
Economics, 259-289.
Kessler, D., and M. McClellan, M., 1996, “Do Doctors Practice Defensive Medicine?” Quarterly

Journal of Economics, May, 353-390.
McClellan, M,, 1993, “The Economics of Medical Treatment Intensity,” Ph.D. Dissertation, MIT.
McClellan, M., 1996, “The Dynamics of Medical Treatment Intensity,” in Wise, D., cd., Topics in
the Economics ofAging (Chicago: Univ. of Chicago Press), forthcoming.
McClellan, M., 1995b, “The Marginal Returns to Technological Change,” Proceedings of the
National Academy of Sciences, forthcoming.
McClellan, M., and Newhouse, J,, 1994, “The Marginal Benefits of Medical Technology”, StanfordUniversity mimeo.
McClellan, M., and Newhouse, J., 1996, “The Costs and Benefits of Intensive Medical Treatments,”Journal of Econometrics, forthcoming.
Meyer, B., 1990, “Unemployment Insurance and Unemployment Spells”, Econometrics, July, 757-782.
Newhouse, J.P., 1992, “Medical Care Costs: How Much Welfare Loss?”, Journal of Economic
Perspectives, Summer, 3-21.
Pauly, M., 1986, “Taxation, Health Insurance, and Market Failure in Medical Care”, Journal ofEconomic Literature.
Phelps, C,, 1992, Health Economics, New York: Basic Books,
Robinson J. and H. Luft, 1985, “The Impact of Hospital Market Structure on Patient Volume,Average Length of Stay, and the Cost of Care”, Journal of Health Economics, 333-356.
Rose, N.L. and P.L. Joskow, 1990, “The Diffusion of New Technologies: Evidence from theElectric Utility Industry”, Rand Journal of Economics, 354-374.
Rosenberg, N., 1994, Exploring the Black Box: Technolo~, Economics, and History, New York:Columbia University Press.
U.S. Congress, Office of Technology Assessment, 1994, Defensive Medicine and Medical
Malpractice, 0TA-H-602, Washington, DC: U.S. Government Printing Office.
Weisbrod, B., 1988, The Non-Profit Economy, Cambridge, MA: Harvard University Press.
Weisbrod, B., 1991, “The Health Care Quadrilemma: An Essay on Technological Change,Insurance, Quality of Care, and Cost Containment”, Journal of Economic Literature, June,523-552.

50
40
30
20
10
0
Figure 1: Share of Heart Attack Patients
Receiving Intensive Surgical Procedures
—
/
1984 1985 1986 1987 1988 1989 1990 1991
Year
■ Catheterization ~ Bypass Surgery A Angioplasty I

25
20
15
10
5
0
Figure 2: Use of Angioplasty By
Hospital of Initial Admission
1984 1985 1986 1987 1988
Year
/
‘/_-–—~
1989 1990
>
I
1991
■ Acquired by 1984 0 Acquire Between 1984 and 1991
~ Not Acquired by 1991


Table I: Technological Change and Reimbursement in Cardiac Procedure Use, 1984-91
Intensive Procedure Use Average Hospital Reimbursement
Annual AnnualAMI Treatment 1984 1991 Change” 1984 1991 Change
Average Reimbursement $11,175 $14,772 4.0%
Type of TreatmentMedical Management 88.7% 59.4% -4.2% $9,829 $10,783 1.3%
Catheterization Only** 5.5 15.5 1.4 15,380 13,716 -1.6
Angioplasty 0.9 12.0 1.6 25,841 17,040 -5.9
Bypass Surgery 4.9 13.0 1.2 28,135 32,117 1.9
Price Index $14,981 $14,772 -0.2Y0
Quantity Index $12,047 $14,772 2.9%
Note: Reimbursement for 1984 is in 1991dollars, adjusted using the GDP deflator. Price and quantityindices use 1991 weights.*Growth is average percentage point change each year.**Patients who received catheterization but no revascularization procedure. Patients who received bypmssurge ry or angioplmty will also have had a catheterization,

Table 2: Sources of Increme in Intensive Procedure Use for Heart Attack Patients, 1984-1991
Procedure
Cardiac BypassSource Catheterization Surgery Angioplasty
Share oJHospitals with Technolo~1984 20.9% 10.6% 8.2%
1991 40.6 16.8 18.2
Share ofIncrease In Procedure Use Resulting From:Acquisition of Technology 15.4% 7.8% 18.9%
Increased Use Among Hospitals With Procedure 64.3 34.1 42.6
Increased Use Among Hospitals Without Procedure 27.0 59.4 47.9
Note: Last block does not add to 100 percent because of covariance between changes in use rates andshare of patients.

Table 3: Distribution of AMI Patients and Technologies by Hospital Size, 1991
Share of Hospitals With Technology
AverageNumber of Number of Cardiac Bypass
Bed Size Hospitals Patients Catheterization Surgery Angioplasty
Total 5,253 174 40.6% 16.8V0 18.2%
<100 2,371 45 7.4 0.3 0.5
100-199 1,090 134 43.6 4.7 7.5
200-299 685 245 69.5 21.8 23.8
300-399 450 348 86.0 41.1 44.7
400-599 430 450 93.0 67.7 69.1
600+ 227 626 96.0 88.5 89.0
Note: The samDle is hosuitals with at least one admission for AMI in 1991.

Table 4: Predictions About the Factors Influencing Technology Diffusion
Level of StandardVariable Predicted Effect Aggregation Mean Deviation
Hospital ControlsFor-Profit
Government
Teaching
InsurancePercent Uninsured
HMO Enrollment
Rate Regulation
Technolo~ RegulationCertificate of Need
Malpractice ReformDirect Reform
Provider InteractionsPercent Cardiovascular
Physicians
Share of Other HospitalsIn area with Technology
Distance to MajorTeaching Center
DemographicsLog(Median Income)
Share Over 65
+
- if profitability or practice pattern effects+ if use to offset other losses
- if profitability or practice pattern effects+ if use to offset other losses
- if profitability or practice pattern effects+ if use to offset other losses
+
+ if “arms race” or learning effects- if preemption or substitute transfers
- if “arms race” or learning effects+ if preemption or substitute transfers
+
+
Hospital
Hospital
Hospital
MSAfRestof State
State
State
15.4%
15.7%
15.5%
13.6%
13.3%
16.7%
36.4%
36.4%
36.2%
6.OVO
8.5%
37.3%
State 63.2% 48.2%
State 79.8% 40.2%
MSAI 2.7% 1.3%County
Hospital 38.2% 30.0%
Hospital 191 22’7
MSAICounty
MSAICounty
9.9
11.3V0
.16
3.1 VO
Note: Summary statistics are for hospitals with at least 100 beds, Means for Rate Regulation and Certificate ofNeed Regulation are for 1984. Means for HMO Enrollment, Malpractice Reform, and Share of Other Hospitalswith Angioplasty are for 1991. The sample excludes hospitals in Alaska, Hawaii, and the District of Columbia.There are 3,033 observations.

Table 5: Reduced Form Models for the Share of Patients Receiving Angioplasty
Region Controls State Controls
Variable 1984 1991 1984 1991
Hospital Controls200-299 Beds
300-399 Beds
400-599 Beds
>600 Beds
For-Profit
Government
Teaching
InsurancePercent Uninsured
Percent in HMOS
Rate regulation
Technology RegulationCertificate of Need
MalpracticeDirect Reform
.003”(.001)
.004”’(.001)
.006”(,001)
.013””(.002)
-.002(.002)
-.003”(.001)
-.001(.001)
.016(.012)
-.068””(.018)
-.003”(.002)
-.004’”(.001)
-.001(.001)
.016”(.005)
,030””(.005)
.044”’(,005)
.068”’(.006)
.004(.006)
-.009”(.005)
.002(.004)
.244”’(.041)
-.068”(.042)
-.033’”(.006)
-.016”’(.005)
.006(.005)
.002”(.001)
.004’”(.001)
.007””(.001)
.014”’(.002)
-.002(.002)
-.003”(.001)
-.001(.001)
.012(.014)
---
---
---
---
.017””(.005)
.029”’(.005)
.043””(.005)
.068”(.006)
.002(.006)
-.O1O**(.005)
.004(.004)
.232**(.047)
---
---
---
---
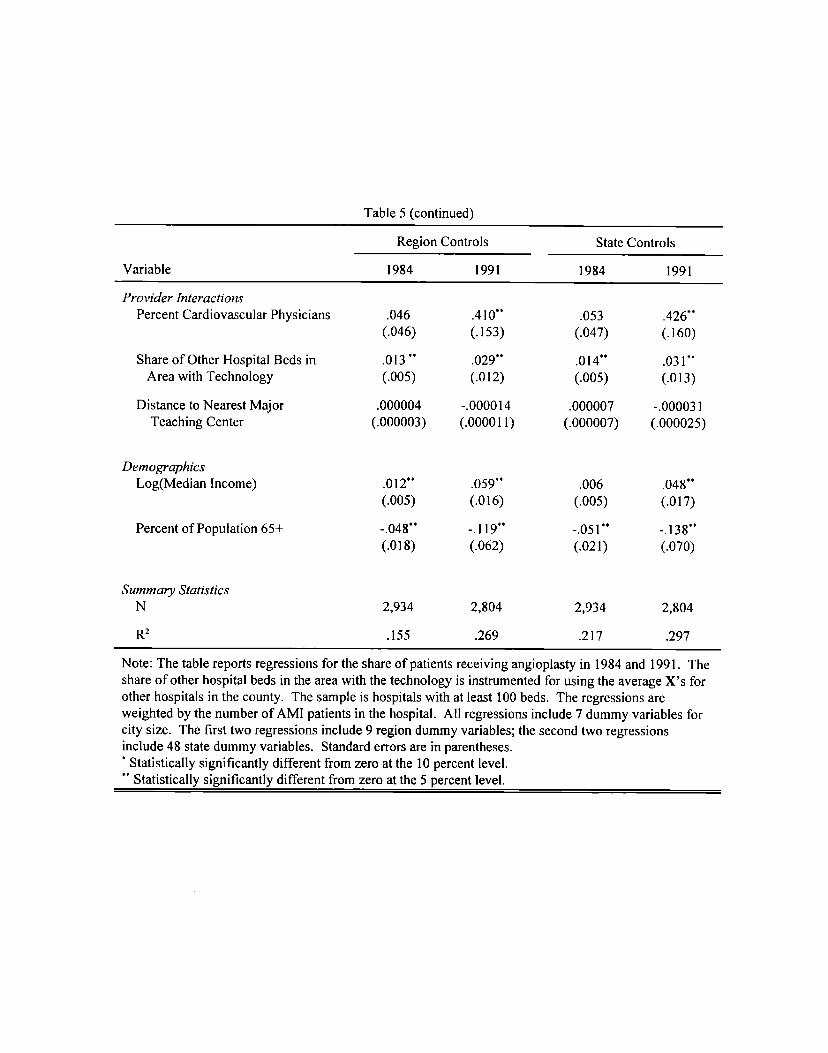
Table 5 (continued)
Region Controls State Controls
Variable 1984 1991 1984 1991
Provider InteractionsPercent Cardiovmcular Physicians
Share of Other Hospital Beds inArea with Technology
Distance to Nearest MajorTeaching Center
DemographicsLog(Median Income)
Percent of Population 65+
Summary StatisticsN
R2
.046(.046)
.013 **(.005)
.000004(.000003)
.012””(.005)
-.048’”(.018)
2,934
.155
.41o** .053(.153) (.047)
.029”” .014’”(.012) (.005)
-.000014 .000007(.00001 1) (.000007)
.059”” .006(.016) (.005)
-.119”” -.051”(.062) (.021)
2,804 2,934
.269 .217
.426**(.160)
.031”(.013)
-.000031(.000025)
.048”’(.017)
-.138”*(.070)
2,804
.297
Note: The table reports regressions for the share of patients receiving angioplasty in 1984 and 1991. Theshare of other hospital beds in the area with the technology is instrumented for using the average X’s forother hospitals in the county. The sample is hospitals with at Iemt 100 beds. The regressions areweighted by the number of AMI patients in the hospital. All regressions include 7 dummy variables forcity size. The first two regressions include 9 region dummy variables; the second two regressionsinclude 48 state dummy variables. Standard errors are in parentheses.‘ Statistically significantly different from zero at the 10 percent level.“*Statistically significantly different from zero at the 5 percent level.

Table 6: Effects of Policy and Market Variables on Ownership and Use of Angioplmty
Use of Procedure (OLS)
Ownership With WithoutIndependent Variable (Hazard) Technology Technology
Hospital Controls200-299 Beds
300-399 Beds
400-599 Beds
>fjooBeds
For-Profit
Government
Teaching
InsurancePercent Uninsured
Percent in HMOS
Rate regulation
Technolo~ RegulationCertificate of Need
MalpracticeDirect Reform
1.353””(.138)
2.210””(.138)
2.989””(.138)
3.889*’(.156)
.103(.118)
-.773**(.106)
.557”’(.085)
-.614(,889)
-3.832””(1.086)
-.603”’(,158)
-.141(.100)
-.087(.088)
-.024’(.015)
-.031”(.017)
-.044””(.020)
-.048”’(.024)
-.006(.008)
.018”(.008)
-.016’”(.007)
.237*”(.075)
-.115(.073)
-.014’(.008)
-.017”’(.007)
.01o*(.006)
.002(.003)
.003(.004)
.004(.006)
.003(.008)
.000(.002)
.000(.002)
.000(.002)
.046”’(.016)
-.069”’(.017)
-.011””(.002)
-.008’”(.002)
.000(.001)

Table 6 (continued)
Use of Procedure (OLS)
Ownership With WithoutIndependent Variable (Hazard) Technology Technology
Provider InteractionsPercent Cardiovascular
Physicians
Share of Other Hospital Beds inArea with Technology
Distance to Nearest MajorTeaching Center
DemographicsLog(Median Income)
Percent of Population 65+
Selection Correction
17.866””(4.082)
.632’”(.293)
.00074””(.00024)
-.456(.370)
-6.627*”(1.643)
-..
-.512’(.301)
.040(.025)
-.000015(.0000I7)
.029(.026)
-,049(. 108)
.014”’(.007)
.143”’(.054)
-.005(.005)
-.00001 I**(.000004)
.037””(.005)
.037(.030)
-.002(.004)
Summa~ StatisticsN 3,033 5,971 17,164
log(Likelihood) / R’ -2,581.09 .360 .412
Note: The table shows two-stage least squares estimates of hazard models for thediffusion of heart attack technologies. The share of other hospital beds in the area withthe technology is instrumented for using the average X’s for other hospitals in thecounty. The sample is hospitals with over 100 beds, All models have dummyvariables for 9 regions and 7 city sizes. The models for the use of technology haveyear dummy variables as well. Regressions for use of procedure are weighted by thenumber of AMI patients in the hospital. Standard errors in use equations are correctedfor inter-hospital correlation.*Statistically significantly different from zero at the 10 percent level.●“ Statistically significantly different from zero at the 5 percent level.


Table 8: Financial Incentives and Ownership in the Diffusion of Angioplasty
Ownership
Additional Effect For:
PrivateVariable Not-for-profit For-Profit Government
Hospital ControlsFor-Profit .428
(.321)
Government
InsurancePercent Uninsured
Percent in HMOS
Rate regulation
.700(.991)
-3.535”’(1.104)
-.668**(.167)
.315(.312)
-3.241** -6.354*’(1.673) (1.778)
2.470”’ -1.648(1 .284) (1.240)
Summa~ StatisticsN 3,033
loE(Likelihood) -2,569.95
--- .243(.347)
Note: The table shows two-stage least squares estimates of hazard models for the diffusion ofangioplasty. The specification is similar to Table 7, with the exception of the indicatedinteraction terms for for-profit and government hospitals. There are not enough for-profithospitals in states with rate setting to estimate that coefficient reliably. Standard errors are inparenetheses.“ Statistically significantly different from zero at the 10 percent level.*“Statistically significantly different from zero at the 5 percent level.