the determination of pesticidal and non-pesticidal
TRANSCRIPT

The Determination of Pesticidal and Non-Pesticidal Organotin Compounds in Water Matrices by in situ Ethylation and Gas Chromatography with Pulsed Flame Photometric Detection Otis Evans, Peter Kauffman1, Anne P. Vonderheide, Larry J. Wymer and Jeffrey N. Morgan Chemical Exposure Research Branch Microbiological and Chemical Exposure Assessment Research Division National Exposure Research Laboratory 1National Council on Aging U. S. Environmental Protection Agency 26 West Martin Luther King Drive Cincinnati, Ohio 45268 USA
*Author to whom correspondence should be addressed:
Jeffrey N. Morgan
U.S. Environmental Protection Agency, MS-564
26 W. Martin Luther King Drive
Cincinnati, OH 45268
513-569- 7738 (office)
513-569-7757 (FAX)
Submitted as a full paper to Microchemical Journal, January 2009

Abstract
The concurrent determination of pesticidal and non-pesticidal organotin compounds in
several water matrices, using a simultaneous in situ ethylation and liquid-liquid extraction
followed by splitless injection mode capillary gas chromatography with pulsed flame
photometric detection, is described. The speciation analysis of nine organotin compounds
includes low molecular weight - low boiling (non-pesticidal) and high molecular weight -
high boiling analytes (pesticidal) of significant environmental interest. The minimum
time for sodium tetraethylborate alkylation, using mechanical agitation, is determined to
be fifteen minutes in order to ensure the complete derivatization of the complete list of
analytes. The utilization of a “hot needle” and a rapid injection rate is shown to be an
efficacious means to eliminate “mass” or “needle” discrimination when determining the
mixture of organotin compounds. Method detection limits are calculated to be in the low
ng L-1 range. The final method is applied to various water samples; storm water from the
Cincinnati area demonstrated low native levels of three of the organotin compounds.
Keywords: pesticidal organotins, non-pesticidal organotins, in situ ethylation, liquid-
liquid extraction, GC-PFPD, comproportionation

Introduction
Organotin compounds may be sub-divided into two distinct classes of compounds -
pesticidal and non-pesticidal. These two groups of compounds exhibit dissimilar
chemical and physical properties. Non-pesticidal organotins are generally smaller alkyl
entities that are both polar and non-labile. Pesticidal organotins, on the other hand, are
typically larger alkyl and aryl compounds that are non-polar, hydrophobic and labile.
Toxicity characteristics of the two classes also differ; the non-pesticidal organotinsare
immuno- and neurotoxins whereas the pesticidal compounds have documented
deleterious effects on marine animals.[1; 2; 3] In spite of these differences, most papers
to date primarily investigate the pesticidal organotins[3; 4; 5], possibly with the inclusion
of dibutyltin.[6] Conversely, many papers that study the non-pesticidal organotinsinclude
the pesticidal tributyltin[7; 8]; nevertheless, very few consider the methylated non-
pesticidal organotins.
The differences in properties contribute to the versatility of organotin compounds, and as
a consequence, their utility and applicability in a diverse range of applications. For
instance, pesticidal organotins have been used as insecticides, fungicides (e.g., fungicidal
wood preservatives), herbicides, acaricides, disinfectants (e.g., textiles), anti-foulant
coatings/biocides (e.g., applied to ship and boat hulls, docks, fishnets, and buoys to
discourage the growth of marine organisms), and preservatives for many different types
of materials. As a result, they have been widely used in certain industries, such as paper
and pulp mills, cooling towers (electric power generation), breweries, textile mills,
leather processing plants and other facilities.

In the plastics industry, health and safety requirements have mandated a removal of toxic
heavy metals (e.g., lead [neurotoxin], cadmium [renal toxin]) and the non-pesticidal
organotins have been substituted in their place. Polyvinyl chloride (PVC) has found
major applications in today’s society and the non-pesticidal organotins are employed as
important heat stabilizer additives in PVC (e.g., pipes, tubing, food packaging) to protect
it from heat, light, oxidation and mechanical stress. Other industrial uses of non-
pesticidal organotins are as catalysts in producing polyurethane foams and silicone
elastomers, esters used as plasticizers, lubricants, and heat transfer fluids, glass coatings,
and anthelminthics for poultry.
In spite of the intended benefits, the non-specificity, extreme toxicity, persistence and
bioaccumulation tendency of the pesticidal organotins, and the increasingly significantly
diverse and pervasive applications of the non-pesticidal organotins, have raised concerns
regarding occurrence. The toxicity assessment of organotins is dependent, in part, on
whether they may enter the environment in concentrations that could potentially lead to
human exposure with concomitant adverse health effects. Further, toxicity characteristics
(both human and ecological) require an analytical methodology capable of providing
quantitative analysis for both classes of organotins in aqueous samples at very low limits
of detection in water (ng L-1).[4; 5; 6; 7; 8]
Alkylation of organotin salts for subsequent gas chromatographic (GC) analysis can be
accomplished by several reactions. The Grignard reaction[9; 10; 11] and alkylation with

a sodium alkylborate reagent[3; 4; 5; 6; 7; 8] have been often employed. One particular
advantage of the latter is that the derivatizing reagent is stable in water, unlike Grignard
reagents, and, hence the reaction can be conducted in aqueous matrices. In the
instrumental realm, GC is the primary technique used to separate organotin analytes and
several detection schemes have been coupled with this separation method in pursuit of
sensitive and selective detection. Many are based on element-specific detection, such as
a flame photometric detection[3; 5], pulsed flame photometric detection[4] and
inductively coupled plasma-mass spectrometry[7; 8]; however, electron ionization mass
spectrometry[6] has also been shown to be useful.
Our objective in this work was the development of a sensitive and selective method for
the simultaneous analysis of both pesticidal and non-pesticidal organotin compounds. An
in situ derivatization with tetraethylborate coupled with liquid-liquid extraction that had
previously delivered low detection limits for the non-pesticidal organotinswas used as the
basis for sample preparation.[3; 4; 5; 6; 7; 8] Key parameters were investigated for the
best possible recovery of the analytes of interest. Analysis was accomplished with
capillary gas chromatography and various injection techniques were investigated for
optimal sensitivity. Pulsed flame photometric detection was employed as it has been
shown to be more sensitive than the conventional flame photometric detector.[12] The
newly developed method was applied in the analysis organotin compounds in drinking
and surface waters.
Experimental

Reagents and chemicals
Methanol, acetone, hexane, sodium sulfate, acetic acid, sodium acetate, hydrochloric acid
and nitric acid were purchased from Fisher Scientific (Fairlawn, NJ, USA).
Sodium tetraethylborate (STEB) (97%) was obtained from Aldrich Chemical Company
(Milwaukee, WI, USA) in one gram bottles. A 1% solution was prepared by dissolving
the entire contents of each bottle in cold deionized-distilled water and diluting to a final
volume of 100 ml. The actual amount of chemical reagent was determined by differences
in weight between full and empty bottles, generally 1± 0.05 g. Subsequently, the
derivatization solution was quickly transferred, in 25 ml portions, to Teflon™ bottles,
frozen and stored at -74 °C (Forma Scientific BioFreezer (Marietta, OH, USA)). The
solutions were retrieved as needed, thawed under ambient conditions, and immediately
used in the alkylation reactions. The buffer (pH 5.0, acetate) and the derivatizing agent
(sodium tetraethylborate, STEB) were extracted, with hexane, to remove potentially
interfering organic tin (Sn) species.[13]
All mono-, di-, and trisubstituted organotin compounds were obtained in the chloride
form. Monomethyltin trichloride (MMT, 97%), dimethyltin dichloride (DMT, 97%),
mono-n-butyltin trichloride (MBT, 95%, liq.), di-n-butyltin dichloride (DBT, 95+%), tri-
n-butyltin chloride (TBT, 97+%, liq.), tri-n-propyltin chloride (NTPrT, 95%, liq.),
diphenyltin dichloride (DPhT, 95%), and triphenyltin chloride (TPhT, 95+%) were
obtained from Alfa Aesar (Ward Hill, MA, USA). Tricylohexyltin (TCyHT, 97%),
tetrabutyltin (TEBT, 93%, liq.) and tetrapentyltin (TEPT, 97%, liq.) were purchased from

Aldrich Chemical Company. (Mono)phenyltin trichloride (MPhT, 98%, liq.) was
obtained from Gelest, Inc., (Morrisville, PA, USA) and Aldrich Chemical Company
(Milwaukee, WI, USA). The organotin concentrations reported in this paper are
expressed as mass of Sn per volume unit. The organotin stock solutions were prepared in
the following solvents: the methyltin, propyltin, and butyltin compounds were dissolved
in methanol containing 2% hydrochloric acid (HCl). The phenyltin compounds and
tricyclohexyltin were dissolved in acetone containing 2% HCl and the fully alkylated
tetrabutyltin and tetrapentyltin compounds were dissolved in hexane. The entire list of
analytes is given in Table 1.
Surrogate and Internal Standards.
The surrogate utilized in this work was tri-n-propyltin chloride (NTPrT). Tetrabutyltin
(TEBT) and tetrapentyltin (TEPT) were used as internal standards. Given the range of
sample types we analyzed, reported here and elsewhere, and the various measurement
phenomena that may be encountered while using splitless injection, it is advisable to
employ multiple internal standards.
Sample preparation
A 1 L water sample was placed in a 1 L separatory funnel. The separatory funnel
contained a Teflon™ stopcock and the glass stopper was replaced with a polyethylene
stopper. A volume of 10 mL of a buffer solution, 1.0 mL of sodium tetraethylborate (1%
w/v) and 4 mL of hexane were added in succession. The volume of hexane, used for
extraction, was intended to be kept to a minimum, but adequate for extracting the selected

aqueous sample volume. The surrogate, NTPrT, was added and the sample was shaken
manually, vented and then agitated mechanically. Initial experiments were shaken for 20
minutes; however, 15 minutes was found to be optimal as discussed in the Results and
Discussion section. A Glas-Col Model S60012 Bench Top Shaker (Terre Haute, IN,
USA), equipped with variable speed motor (0 to 250 revolutions minute-1), a shaker
head, a BT6000 mounting platform, and a Model 099A BT 1000S holder for 1 L
separatory funnels, was used. The aqueous phase was discarded and the hexane layer
was dried with anhydrous Na2SO4 contained in a 6 ml glass reaction tube with a Teflon™
frit. The height of the Na2SO4 bed in the 6 ml glass reaction tube (column) was ~ 18-20
mm. The hexane extracted was adjusted to a 5 mL final volume and the internal
standards, TEBT and TEPT, were added.
Instrumentation
Gas chromatography was performed with a Varian CP-3800 gas chromatograph (Walnut
Creek, CA, USA), equipped with a Varian CP-8400 AutoSampler and a Varian Pulsed
Flame Photometric Detector (PFPD) System [with a BG-12 Sulfur filter and an R647
Photomultiplier Tube (6, 7)], a three mm i.d. quartz combustor and a Varian 1079
split/splitless temperature programmable injector. Chromatographic separation was
performed on a DB-17 fused silica capillary column (30 m x 0.25 mm i.d.) coated with
50%-(phenyl)methylpolysiloxane (0.25 μm film thickness) (J&W Scientific, Folsom, CA,
USA) with helium as the carrier gas at a flow rate of 2.0 mL min-1. The injector and
detector port temperatures were 220 °C and 350 °C, respectively. The column
temperature was held constant at 40 °C for 3 min, subsequently the temperature was

increased at a rate of 8 °C min-1 to 280 °C and held at 280 °C for one min. Complete
instrumental conditions are detailed in Table 2.
Results and Discussion
Reaction time studies (in situ derivatization)
The non-pesticidal and pesticidal organotins are ionic in nature and must be derivatized
in order to make them amenable to GC analysis. It is important to know the minimum
amount of time for complete conversion of the organotins to the fully alkylated
compounds. Most researchers report reaction times ranging from 2-30 minutes[5], even
up to 16 hours[14], depending, in part, on the sample matrix. Our determinations
involved evaluating reaction times from 5 to 20 minutes, in five minute increments, using
mechanical agitation. Figure 1 portrays the normalized responses for non-pesticidal and
pesticidal organotins, respectively, from 5 to 20 minutes and actual normalized values are
given in Table 3. A multiple comparison procedure, Benjamini-Hochberg, was used to
interpret these results and the table in Figure 1 displays this data. Only changes from 5 or
10 minutes to 20 minutes are significant, and then only for the pesticidal compounds.
Because there was no significant change between the times of 15 and 20 minutes, optimal
reaction time was chosen to be 15 minutes.
Choice of surrogate and internal standards
Tri-n-propyltin chloride was chosen as the surrogate. It proved to be an efficacious agent
for mimicking the response of organotins in a wide range of sample types, including high
total organic content (TOC) water (> 10 mg/L) and stormwater (discussed later). We

chose to employ the use of multiple internal standards, TEBT and TEPT, for the
determination of both the non-pesticidal and pesticidal organotins. The absolute
analytical response for TEBT essentially paralleled that obtained for TEPT. However,
experiments with injection technique demonstrated more similarity in behavior between
TEPT and the pesticidal compounds and so it was employed with the pesticidal
compounds while TEBT was used with the non-pesticidal analytes. Figure 2
demonstrates the elution order and retention times for the organotin compounds under the
chosen chromatographic conditions. All analytes were completely resolved.
Injection technique
Splitless injection mode is an ideal technique for low level environmental analyses with
applicability to a range of analytes; however, it is known to have inherent limitations
associated with sample vaporization in hot injection ports. If one injection port
temperature is used to vaporize all of the analytes in a sample that encompass a wide
range of molecular weights and boiling points, the higher boiling and higher molecular
weight tend to give reduced peak area and peak height responses. This results in non-
linear signals and lower response slopes when compared to the lower boiling and lower
molecular weight analytes. This phenomenon is known as “needle” or “mass”
discrimination[15] and has often been attributed to losses inside the syringe needle that
results in the unequal delivery of sample components of different volatilities. This is
characterized by high boiling (less volatile) and high molecular weight components either
exiting the syringe needle at lower concentrations and at a slower rate than the solvent
and more volatile (low boiling and low molecular weight) components or the less volatile

components being left behind coating the inner surface of the needle. As a consequence
of the incomplete transfer of needle content, chromatographers observe peak areas or
peak heights for high boiling sample constituents which are too small, i.e., a loss of
sensitivity, when compared to the lower boiling sample components.
This work investigated alternate injection techniques based on the boiling points of the
ethylated organotins.[16] Because each of the compounds was included as the same
concentration of Sn, an element-based detection should produce similar areas for all.
However, this discrimination is apparent in Figure 3A, which displays the gas
chromatogram for the organotins with a “cold” needle injection. The sample was drawn
into the barrel, with an air gap, so that an empty needle was inserted into the injection
port. The sample injection was performed immediately at a rate of 5 μL sec-1 with a
subsequent 6.5 sec post injection delay, i.e., the syringe needle remained in the injection
port for the specified time, prior to its removal. The results reveal that several of the
analytes, specifically peaks 10, 12 and 13 ( tetrapentyltin [TEPT], tricyclohexyltin
[TCyHT] and triphenyltin [TPhT]), undergo significant “discrimination”, apparently due
to the “cold” needle injection, when compared to the more volatile organotins and the
surrogate, tri-n-propyltin (NTPrT, peak 5). Peak 11 (diphenyltin [DPhT]), although
yielding a higher response compared to the aforementioned pesticidal analytes,
demonstrates a diminished response under these injection conditions relative to the other
non-pesticidal organotins.
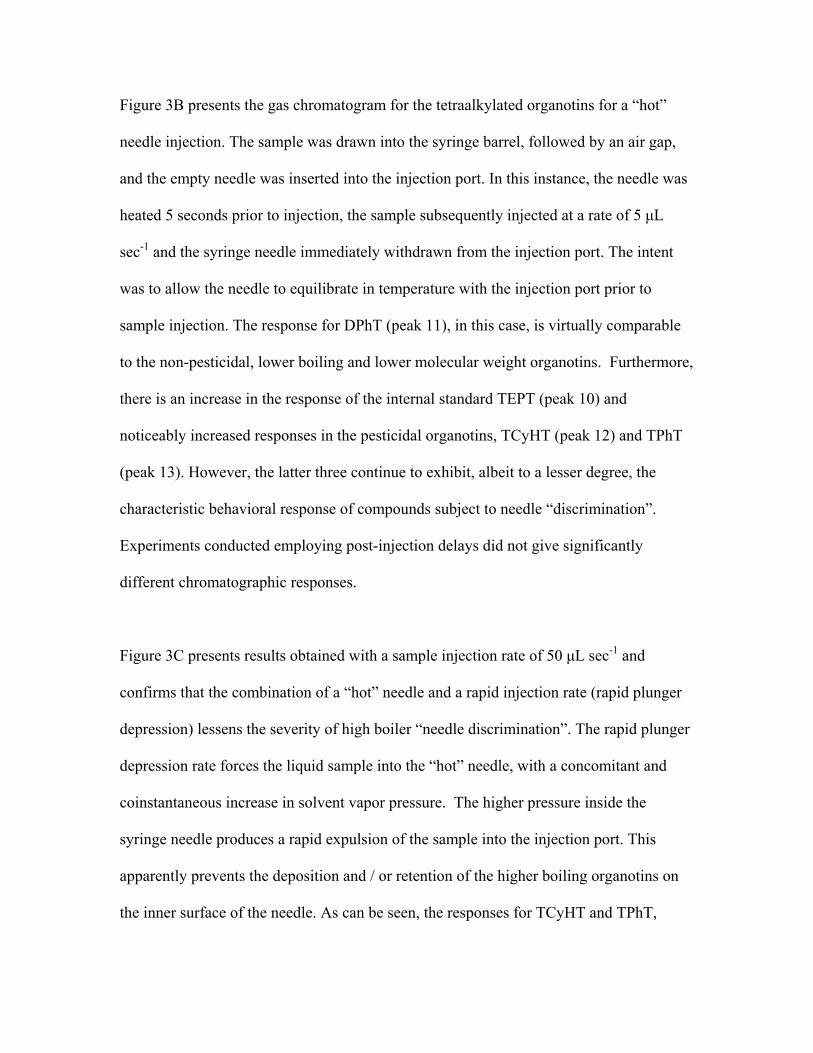
Figure 3B presents the gas chromatogram for the tetraalkylated organotins for a “hot”
needle injection. The sample was drawn into the syringe barrel, followed by an air gap,
and the empty needle was inserted into the injection port. In this instance, the needle was
heated 5 seconds prior to injection, the sample subsequently injected at a rate of 5 μL
sec-1 and the syringe needle immediately withdrawn from the injection port. The intent
was to allow the needle to equilibrate in temperature with the injection port prior to
sample injection. The response for DPhT (peak 11), in this case, is virtually comparable
to the non-pesticidal, lower boiling and lower molecular weight organotins. Furthermore,
there is an increase in the response of the internal standard TEPT (peak 10) and
noticeably increased responses in the pesticidal organotins, TCyHT (peak 12) and TPhT
(peak 13). However, the latter three continue to exhibit, albeit to a lesser degree, the
characteristic behavioral response of compounds subject to needle “discrimination”.
Experiments conducted employing post-injection delays did not give significantly
different chromatographic responses.
Figure 3C presents results obtained with a sample injection rate of 50 μL sec-1 and
confirms that the combination of a “hot” needle and a rapid injection rate (rapid plunger
depression) lessens the severity of high boiler “needle discrimination”. The rapid plunger
depression rate forces the liquid sample into the “hot” needle, with a concomitant and
coinstantaneous increase in solvent vapor pressure. The higher pressure inside the
syringe needle produces a rapid expulsion of the sample into the injection port. This
apparently prevents the deposition and / or retention of the higher boiling organotins on
the inner surface of the needle. As can be seen, the responses for TCyHT and TPhT,

peaks 12 and 13 respectively, are further enhanced and are nearly comparable to the
responses for the non-pesticidal organotins. Additionally, the responses for the internal
standards TEBT (peak 9) and TEPT (peak 10), in this instance, are nearly comparable (cf.
to Figure 3A). Increasing injection rates up to 100 μL sec-1 did not result in further
enhancement of the analytical signal response. Using a post-injection delay, irrespective
of its duration, did not contribute to an increase in the analytical signals.
During the course of performing “cold” needle injections, it was observed that while one
internal standard, TEPT, gave smaller responses that may be attributable to “needle
discrimination”, the other internal standard, TEBT, was relatively unaffected. TEBT has
a calculated boiling point of 285 °C at 760 mmHg pressure[16], higher than the fully
alkylated non-pesticidal organotins but significantly lower than DPhT, TCyHT and
TPhT.[16] And, it has a molecular weight that lies between DPhT and TPhT. Under the
“cold” needle experimental conditions, the responses of the internal standards are
somewhat divergent and inconsistent, with the response for TEBT appearing to increase
relative to TEPT. The explanation we proffer for this apparent behavior is that it further
shows the “needle” discrimination effect on the higher boiling internal standard.
However, under “hot” needle injection experimental conditions with rapid sample
injection (cf. Figure 3C), the response of TEPT increased and was comparable to the
signal for TEBT.
Comproportionation of monophenyltin trichloride

During the injection experiments, it was noted that diphenyltin (DPhT) dichloride, a high
boiling and high molecular weight compound, did not exhibit the response of the other
compounds undergoing “mass” discrimination. At the same time, monophenyltin
(MPhT) trichloride appeared to give a somewhat smaller response than expected.
Comproportionation, also known as symproportionation, is sometimes defined as the
reverse of disproportionation. Disproportionation may be a redox reaction where a
reactant acts both as an oxidant and a reducing agent, i.e., an element in an intermediate
oxidation state is transferred to a higher and a lower oxidation state, depending on the
reaction conditions. Lytle, et. al.[17], in a recent ecological study, reported on the
reversible comproportionation reaction in which tributyltin (TBT) and monobutyltin
(MBT) are produced from two molecules of dibutyltin. Nguyen Van found both MPhT
and DPhT to be unstable when stored in methanol and to undergo a similar
redistribution.[18]
In our work, we found MPhT standards contained a significant amount of DPhT while
the DPhT solutions were found to be stable and free of MPhT and any other organotin
compounds (Figure 4A). The manufacturer’s literature stated the analytical standard was
98% MPhT at receipt. Figure 4B represents the analysis of MPhT calibration standards
prepared via dilution ~ 6 months after receipt. Figure 4C shows the results of analysis of
MPhT calibration standards, prepared from the aforementioned primary stock standard
(Figure 4B), ~ 7 months later. In the latter figure, it is conclusively demonstrated that the
major component, in standard solutions of MPhT at the time of measurement, is DPhT.
The calculated concentrations of DPhT at the expected concentration levels of MPhT (in

the extracts: 0.2, 0.5, 1.0, 2.0, and 5.0 μg L-1 as Sn) are as follows: 0.17, 0.22, 0.33, 0.66,
and 1.57 μg L-1 as Sn. We believe the results indicate that MPhT, in both the neat
solution (reagent grade material) and primary standard solutions, irreversibly
comproportionates to DPhT.
Figures 5B and 5C shows calibration curves for MPhT prepared from the reagent grade
chemical obtained from another manufacturer. The material safety data sheet (MSDS)
from the manufacturer stated the material is >95% MPhT and <5% other organotins.
Figure 5A is the calibration curve for DPhT, and attests to the stability of the organotin
solution, prepared from the primary stock standard after approximately 20.5 months. This
somewhat longer time frame clearly shows that DPhT did not comproportionate to TPhT,
nor disproportionate to MPhT. Figure 5B shows the immediate preparation (upon
receipt), dilution and analysis of MPhT standard solutions from the second manufacturer.
Figure 5C presents the analysis of freshly prepared standards, from the primary stock
standard (Figure 5B), about 4 months later. The calculated concentrations of DPhT in the
extracts are: 0.11, 0.16, 0.22, 0.34 and 0.80 μg L-1 as Sn. These results appear to
corroborate that MPhT, in both the neat material and standards (Figures 5B and C), tends
to irreversibly comproportionate to DPhT under homogeneous solution conditions. We
wondered if MPhT could also simultaneously disproportionate to form Sn (IV). There
was no definitive evidence to show that Sn (IV) was produced by the disproportionation
of MPhT. The determinative evidence would have been a larger response for tetraethyltin
(TEET) following the alkylation/derivatization reaction with STEB. We also analyzed
standard solutions of triphenyltin (TPhT) trichloride to determine if the compound had a

tendency to disproportionate to DPhT. The analyses did not show the presence of DPhT
in the concentration range of the calibration curve.
Method detection limits
The GC parameters relating to the injector volume, injection temperature, oven
temperature, detector temperature, incl. photomultiplier voltage, gate delay, gate width,
trigger level, oxygen pressure parameters, etc., where applicable, were optimized
individually to maximize the signal-to-noise ratio. Figure 2 presents a typical
chromatogram of the ethylated products of the organotin analytes obtained under final
instrumental conditions.
Method detection limit (MDL) determinations were made using the U. S. EPA single
concentration procedure[19]. This method produces a concentration result which is
unlikely (p=0.05) to be obtained when the analyte is absent. Eight deionized water
samples were fortified with 0.2 ng L-1 and the calculated values were used in the MDL
determination. The concentration of the series of standards used in these determinations
lie within the suspected range of the MDL (EPA single concentration procedure) and
occur in the lower 20% range of the calibration curve. Table 4 lists the U.S. EPA MDL
values.
Analysis of aqueous matrixes for organotins
High carbon content can be problematic when utilizing this detector[20] and Table 5
presents the results of analyses for a tapwater sample with low total organic carbon

(TOC) content (<2.5 mg L-1) and tapwater with a high TOC content (>10 mg L-1). The
samples were fortified with the respective organotin compounds at 5 ng L-1. The tapwater
samples were analyzed without the prior addition of a dechlorinator. As reported by
others[21], an emulsion was formed during the course of the extraction of the high TOC
content sample and may, in part, account for the somewhat lower recoveries of the mono-
and di-alkyltin analytes. There are a number of analytical measures that may be applied
to address emulsion formation; however, none were employed other than vigorous
shaking of the emulsion. Finally, a storm water sample collected from the Cincinnati
metropolitan area was analyzed and demonstrated native concentrations for three of the
non-pesticidal organotins of interest: monomethyltin, 1.85 ng L-1, dimethyltin, 13.2 ng L-
1 and monobutyltin, 1.70 μg L-1. Fortification of this same matrix with 10 ng L-1 of the
organotin compounds produced recoveries ranging from 79.5 to 124%. The
chromatographic results for this analysis are displayed in Figure 6.
Conclusion
The minimum time for the STEB ethylation reaction is 15 minutes when using
mechanical agitation. The specified chromatographic, detection and liquid-liquid
extraction conditions allow the complete separation and quantitative analysis of nine
organotin analytes. Furthermore, adequate sensitivity, for analytical measurements at the
low parts-per-trillion level, is obtained for all analytes while minimizing baseline noise
and analysis time. The utilization of a “hot needle” and a rapid injection rate has been
shown to be an efficacious and simple means to eliminate “mass” or “needle”
discrimination when determining a mixture containing low boiling and low molecular

weight (non-pesticidal) and high boiling and high molecular weight (pesticidal) organotin
compounds. It is important to check neat or reagent grade MPhT, and primary standard
and other solution dilutions, for possible comproportionation to DPhT, in order to
determine if the material is suitable for the preparation of accurate calibration standards
for quantitative environmental analyses. The U.S.EPA MDLs demonstrated values in the
low ng L-1 range. Adequate recoveries were obtained for analysis of low TOC and high
TOC content water without additional sample treatment measures.
DISCLAIMER
The United States Environmental Protection Agency through its Office of Research and
Development funded and managed the research described here. It has been subjected to
the Agency’s administrative review and approved for publication. The mention of
commercial products does not constitute endorsement or recommendation for use by the
United States Environmental Protection Agency.
ACKNOWLEDGEMENT
The authors thank Professor Aviv Amirav (University of Tel Aviv, Israel), Chris Bertelo
and Ray Yoder (Atofina Chemical), Steve Winslow (Shaw Environmental and
Infrastructure, Inc.) and Tom Behymer, Jean Munch, Margie Bassett, and Jody
Shoemaker (for hardwater samples) of the U.S. EPA for helpful discussions and advice
during the course of this work. The authors also wish to thank Katherine Loizos and
Teresa Ruby for graphics support.

Figure 1 – Comparison of time of reaction (STEB) on the responses of the organotin
analytes.
Non-pesticidal
0
0.2
0.4
0.6
0.8
1
1.2
1.4
5 10 15 20
Reaction time (min)
Are
a a
na
lyte
/Are
a I.
S.
MMT
DMT
NTPrT
MBT
DBT
Pesticidal
00.10.20.30.40.50.60.70.80.9
1
5 10 15 20
Reaction time (min)
Are
a a
na
lyte
/Are
a I.
S.
TBT
MPhT
DPhT
TPhT
TCyHT
Differences (Bold Indicates False Discovery Ratea < 0.05 via Benjamini-Hochberg Comparison) MMT DMT NTPrT MBT DBT TBT MPhT DPhT TPhT TCyHT
10 vs 5 m 0.13 0.32 0.23 0.20 0.20 0.01 0.01 0.01 0.00 0.02 15 vs 5 m 0.16 0.37 0.26 0.24 0.24 0.03 0.02 0.02 0.02 0.07 20 vs 5 m 0.11 0.20 0.15 0.17 0.14 0.10 0.07 0.08 0.08 0.13 15 vs 10 m 0.03 0.05 0.03 0.04 0.03 0.02 0.02 0.01 0.02 0.05 20 vs 10 m -0.02 -0.12 -0.08 -0.03 -0.06 0.10 0.06 0.07 0.08 0.11 20 vs 15 m -0.05 -0.18 -0.11 -0.07 -0.09 0.07 0.04 0.06 0.06 0.06
aFalse discovery rate is defined as expected proportion of false positive findings among all the rejected hypotheses (i.e., the proportion of significant findings that may be false).[22]

Figure 2 – GC-PFPD chromatogram of ethylated organotin analytes.

Figure 3 – Injection speed and injection delay (“cold needle” vs. “hot needle”) (A) 5 μl sec-1, 6.5 sec post injection delay - “cold needle”, (B) 5 μl sec-1, 5 sec pre-injection delay - “hot needle”, and (C) 50 μl sec-1, 5 sec pre-injection delay - “hot needle”.

Figure 4 – A) Calibration curve for DPhT(primary stock standard prepared ~16.5 months earlier). B) Calibration curve for MPhT(~ 6 months after receipt) from manufacturer #1. C) Calibration curve for MPhT (~7 months after Figure 4B).

Figure 5 – A) Calibration curve for DPhT (primary stock standard prepared ~20.5 months earlier). B) Calibration curve for MPhT (immediate analysis upon receipt) from manufacturer #2. C) Calibration curve for MPhT (~4 months after Figure 5B).

Figure 6 – Chromatogram for storm water. Dimethyltin, monomethyltin and monobutyltin were detected in the sample. The analytical data for the original sample and the fortified sample are presented in Table 5. Peak 14 is an unidentified sulfur compound. A) Storm water sample. B) Fortified storm water sample.

Table 1— List of Organotin Compounds Peak #
Compound Ethylated Compound
Formula Weight1
Retention time (min)
W ½ (sec)2
Non-pesticidal 2 Methyltin trichloride
(MMT) Triethyl methyltin
240.08 (220.9)
6.21 ± 0.12 10.91 ± 1.31
1 Dimethyltin dichloride (DMT)
Diethyl dimethyltin
219.67 (206.88)
4.32 ± 0.25 12.08 ± 2.48
4 Butyltin trichloride (MBT)
Triethyl butyltin
282.17 (262.99)
11.34 ± 0.01 9.51 ± 0.71
6 Dibutyltin dichloride (DBT)
Diethyl dibutyltin
303.83 (291.04)
14.07 ± 0.06 14.70 ± 2.50
Pesticidal 7 Tributyltin chloride
(TBT) Ethyl tributyltin
325.49 (319.1)
16.27 ± 0.02 11.57 ± 1.78
8 Phenyltin trichloride (MPhT)
Triethyl phenyltin
302.16 (282.98)
17.45 ± 0.01 9.53 ± 0.63
11 Diphenyltin dichloride (DPhT)
Diethyl diphenyltin
343.81 (331.02)
24.66 ± 0.01 8.66 ± 0.34
13 Triphenyltin chloride (TPhT)
Ethyltri phenyltin
385.46 (379.07)
30.55 ± 0.01 8.74 ± 1.03
12 Tricyclohexyltin chloride (TCyHT)
Ethyltricyclo hexyltin
403.61 (397.22)
28.10 ± 0.00 7.84 ± 0.26
Other standards 5 Tri-n-propyltin
chloride3 (NTPrT) Ethyltri-n-propyltin
283.41 (277.02)
12.49 ± 0.04 14.27 ± 2.29
9 Tetrabutyltin4 (TEBT)
Tetrabutyltin 347.15 18.16 ± 0.01 10.54 ± 1.00
10 Tetrapentyltin4 (TEPT)
Tetrapentyltin 403.26 22.32 ± 0.01 10.37 ± 0.81
3 Tetraethyltin5 (TEET)
Tetraethyltin 234.94 7.56 ± 0.06 --
1Formula weight of ethylated compound in parentheses. 2W ½,(sec), peak width at half height (n=10, n=9 for TPhT). 3Surrogate 4Internal Standards 5Impurity.

Table 2 — GC-PFPD Chromatographic Conditions Injection mode Splitless (glass liner 3.4 mm i.d.) Injection volume 3 μL1
Injector temperature 220°C (Isothermal) Column DB-17: 30 m x 0.25 mm i.d. x 0.25 μm film thickness Flow rate (Helium) 2.0 mL min-1
Oven temperature 40°C for 3 min; 8°C min-1; 280°C for 1 min Detector temperature 350°C Detector trigger level 200 mV Detector high voltage 550 V Gate Delay 4.5 msec Gate Width 5.0 msec Detector gases Hydrogen and Air Gas flows Air 1: 17.0 mL min-1
Air 2: 10.0 mL min-1 Hydrogen: 13.0 mL min-1
Total run time 34.0 min 1An injection volume of 3 μL allowed the optimum analytical signal with minimum baseline noise via adjustment of the gate delay and gate width.

Table 3 – Reaction Time Data (n=4) MMT DMT NTPrT MBT DBT TBT MPhT DPhT TPhT TCyHT 5 min 0.3494 0.8244 0.5800 0.5479 0.5570 0.7773 0.3366 0.6624 0.5441 0.6678
std. dev.
0.1141 0.2755 0.1963 0.1866 0.1790 0.0421 0.0152 0.0377 0.0338 0.0362
RSD % 32.66 33.42 33.84 34.06 32.14 5.42 4.51 5.69 6.25 5.42
10 min 0.4822 1.1405 0.8101 0.7459 0.7616 0.7830 0.3422 0.6706 0.5403 0.6853
std. dev.
0.0318 0.0667 0.0518 0.0643 0.0551 0.0581 0.0288 0.0364 0.0330 0.0418
RSD % 6.59 5.85 6.39 8.62 7.23 7.42 8.42 5.43 6.11 6.10
15min 0.5142 1.1948 0.8359 0.7904 0.7934 0.8048 0.3614 0.6852 0.5641 0.7356
std. dev.
0.0227 0.0222 0.0117 0.004570 0.009672 0.0128 0.0100 8.7737e-3 8.9212e-3 0.0185
RSD % 4.41 1.86 1.40 0.58 1.22 1.59 2.77 1.28 1.58 2.51
20 min 0.4642 1.0196 0.7278 0.7183 0.6998 0.8794 0.4047 0.7440 0.6223 0.7975
std. dev.
0.1026 0.2515 0.1583 0.1509 0.1493 0.0309 0.0151 0.0145 0.0353 0.0251
RSD % 22.10 24.67 21.75 21.01 21.33 3.51 3.73 1.95 5.67 3.15 *Data represented graphically in Figure 1.

Table 4 – Method Detection Limits Analyte Mean
observed (ng L-1)
Standard Deviation (ng L-1)
Relative Standard Deviation (%)
Mean Accuracy (% true Conc.)
MDL1
(ng L-1)
MMT 0.23 0.010 4.3 115 0.03 DMT 0.20 0.004 2.2 100. 0.01 MBT 0.19 0.003 1.7 95.0 0.01 DBT 0.27 0.007 2.5 135 0.02 TBT 0.21 0.003 1.6 105 0.01 MPhT 0.12 0.005 4.5 60.0 0.02 DPhT 0.17 0.009 5.1 85.0 0.03 TPhT 0.30 0.012 4.0 150 0.04 TCyHT 0.23 0.003 1.2 115 0.01 1MDL = t * standard deviation, where t = Student’s t-value, 2.998 for 7 degrees of freedom.

Table 5 – Recoveries of Organotins from Water Samples Organotin Analytes, μg L-1 in sample extract
DMT MMT MBT NTPrT DBT TBT MPhT DPhT TCyHT TPhT
Mean observed, μg L-1 1.11 .097 1.07 1.11 1.06 1.12 1.03 1.03 .097 1.01
Standard deviation .024 001 .017 .009 .021 .012 .034 .059 .070 .001
RSD (%) 2.17 .013 1.69 .084 1.98 1.04 3.34 5.75 7.23 .013
Cincinnati tap water, <2.5 mg L-1 total organic carbon content % Recovery 111 96.7 101 112 106 112 103 103 97.1 101
Mean observed, μg L-1 1.09 .074 .075 .093 .073 .091 .071 .074 .081 .088
Standard deviation .039 .016 .017 .008 .037 .047 .018 .013 .021 .016
RSD (%) 3.62 2.16 2.23 .082 5.14 5.13 2.59 1.80 2.59 1.83
Water with high TOC, >10. mg L-1 total organic carbon content % Recovery 109 74.5 74.9 93.0 72.7 90.8 70.8 74.3 81.4 88.3
*Fortified organotins, 5 ng L-1 in 1 L sample; 1 μg L-1 in the hexane extract.

References [1]D. Ueno, S. Inoue, S. Takahashi, K. Ikeda, H. Tanaka, A.N. Subramanian, G.
Fillmann, P.K.S. Lam, J. Zheng, and M. Muchtar, Global pollution monitoring of butyltin compounds using skipjack tuna as a bioindicator. Environmental Pollution 127 (2004) 1-12.
[2]J. Nishikawa, S. Mamiya, T. Kanayama, T. Nishikawa, F. Shiraishi, and T. Horiguchi, Involvement of the Retinoid X Receptor in the Development of Imposex Caused by Organotins in Gastropods. Environmental Science & Technology 38 (2004) 6271-6276.
[3]C.-H. Tang, and W.-H. Wang, Optimization of an analytical method for determining organotin compounds in fish tissue by base-hydrolysis pretreatment and simultanous ethylation-extraction procedures. Analytica Chimica Acta 581 (2007) 370-376.
[4]C. Bancon-Montigny, G. Lespes, and M. Potin-Gautier, Improved routine speciation of organotin compounds in environmental samples by pulsed flame photometric detection. Journal of Chromatography A 896 (2000) 149-158.
[5]A.P. Birjandi, A. Bidari, F. Rezaei, M.R.M. Hosseini, and Y. Assadi, Speciation of butyl and phenyltin compounds using dispersive liquid-liquid microextraction and gas chromatography-flame photometric detection. Journal of Chromatography A 1193 (2008) 19-25.
[6]C. Devos, M. Vliegen, B. Willaert, F. David, L. Moens, and P. Sandra, Automated headspace-solid-phase micro extraction-retention time locked-isotope dilution gas chromatography-mass spectrometry for the analysis of organotin compounds in water and sediment samples. Journal of Chromatography A 1079 (2005) 408-414.
[7]F. Bianchi, M. Careri, M. Maffini, A. Mangia, and C. Mucchino, Optimization of the solid phase microextraction procedure for the ultra-trace determination of organotin compounds by gas chromatography-inductively coupled plasma-mass spectrometry. Journal of Analytical Atomic Spectrometry 21 (2006) 970-973.
[8]P. Pinel-Raffaitin, P. Rodriguez-Gonzalez, M. Ponthieu, D. Amourouz, I.L. Hecho, L. Mazeas, O.F.X. Donard, and M. Potin-Gautier, Determination of alkylated tin compounds in landfill leachates using isotopically enriched tin species with GC-ICP-MS detection. Journal of Analytical Atomic Spectrometry 22 (2007) 258-266.
[9]S. Díez, L. Ortiz, and J.M. Bayona, Off-Line Solid-Phase Extraction Procedure for the Determination of Phenyl and Butyltin Compounds from Aqueous Matrices followed by GC-FPD Determination. Chromatographia 52 (2000) 657-663.
[10]S. Tsunoi, T. Matoba, H. Shioji, L.T.H. Giang, H. Harino, and M. Tanaka, Analysis of organotin compounds by grignard derivatization and gas chromatography–ion trap tandem mass spectrometry. Journal of Chromatography A 962 (2002) 197-206.
[11]J.L.M. Vidal, A.B. Vega, F.J. Arrebola, M.J. Gonzalez-Rodriguez, M.C.M. Sanchez, and A.G. Frenich, Trace determination of organotin compounds in water, sediment and mussel samples by low-pressure gas chromatography coupled to tandem mass spectrometry. Rapid Communications in Mass Spectrometry 17 (2003) 2099-2106.

[12]A.F.L. Godoi, R. Favoreto, and M. Santiago-Silva, GC Analysis of Organotin Compounds Using Pulsed Flame Photometric Detection and Conventional Flame Photometric Detection. Chromatographia 58 (2003) 97-101.
[13]H. Tao, R.B. Rajendran, C.R. Quetel, T. Nakazato, M. Tominaga, and A. Miyazaki, Tin Speciation in the Femtogram Range in Open Ocean Seawater by Gas Chromatography/Inductively Coupled Plasma Mass Spectrometry Using a Shield Torch at Normal Plasma Conditions. Analytical Chemistry 71 (1999) 4208-4215.
[14]I. Mersiowsky, R. Brandsch, and J. Ejlertsson, Screening for Organotin Compounds in European Landfill Leachates. Journal of Environmental Quality 30 (2001) 1604-1611.
[15]K. Grob, and M. Biedermann, The Two Options for Sample Evaporation in Hot GC Injectors: Thermospray and Band Formation. Optimization of Conditions and Injector Design. Analytical Chemistry 74 (2002) 10-16.
[16]M.L. Gac, G. Lespes, and M. Potin-Gautier, Rapid determination of organotin compounds by headspace solid-phase microextraction. Journal of Chromatography A 999 (2003) 123-134.
[17]T.F. Lytle, C.S. Manning, W.W. Walker, J.S. Lytle, and D.S. Page, Life-cycle toxicity of dibutyltin to the sheepshead minnow (Cyprinodon variegatus) and implications of the ubiquitous tributyltin impurity in test material. Applied Organometallic Chemistry 17 (2003) 653-661.
[18]D.N. Van, R. Lindberg, and W. Frech, Redistribution reactions of butyl- and phenyltin species during storage in methanol. Journal of Analytical Atomic Spectrometry 20 (2005) 266-272.
[19]J.A. Glaser, D.L. Foerst, G. D.McKee, S.A. Quave, and W.L. Budde, Trace analyses for wastewaters. Environmental Science & Technology 15 (1981) 1426-1435.
[20]T. Zuliani, G. Lespes, R. Milacic, J. Scancar, and M. Potin-Gautier, Comprehensive study of the parameters influencing the detection of organotin compounds by a pulsed flame photometric detector in sewage sludge. Journal of Chromatography A 1188 (2008) 281-285.
[21]M. Bravo, G. Lespes, I.D. Gregori, H. Pinochet, and M.P. Gautier, Determination of organotin compounds by headspace solid-phase microextraction-gas chromatography-pulsed flame-photometric detection (HS-SPME-GC-PFPD). Analytical and Bioanalytical Chemistry 383 (2005) 1082-1089.
[22]Y. Benjamini, and Y. Hochberg, Controlling the False Discovery Rate: A Practical and Powerful Approach to Multiple Testing. Journal of the Royal Statistical Society: Series B (Methodological) 57 (1995) 289-300.