the determination of total protein using the …...the determination of total protein using the...
TRANSCRIPT

A P P L I C A T I O N N O T E
Introduction Quantification methods for total protein are among the longest-established fundamental and important experiments of bioscience.
UV/Vis Spectrophotometry is widely used for the determination of protein. This application note describes a typical protein method, the Bradford method. Data is rapidly acquired using the LAMBDA™ 465 UV/Vis Spectrophotometer and processed using the UV Lab™ Software.
Principle
Coomassie Brilliant Blue dye bonds with the protein content of a sample in an acidic solution. As a result, the maximum absorbance of the dye shifts from 465 nm to 595 nm. The absorbance at 595 nm is then proportional to the protein concentration.
The Determination of Total Protein Using the LAMBDA UV/Vis Spectrophotometer: Bradford Method
UV/Visible Spectroscopy
2
ReagentTest Tube No.
1 2 3 4 5 6
0.1 mg/mL Standard Protein (mL) 0 0.1 0.4 0.6 0.8 1
Saline Solution (mL) 1 0.9 0.6 0.4 0.2 0
Concentration (ug/mL) 0 10 40 60 80 100
Result
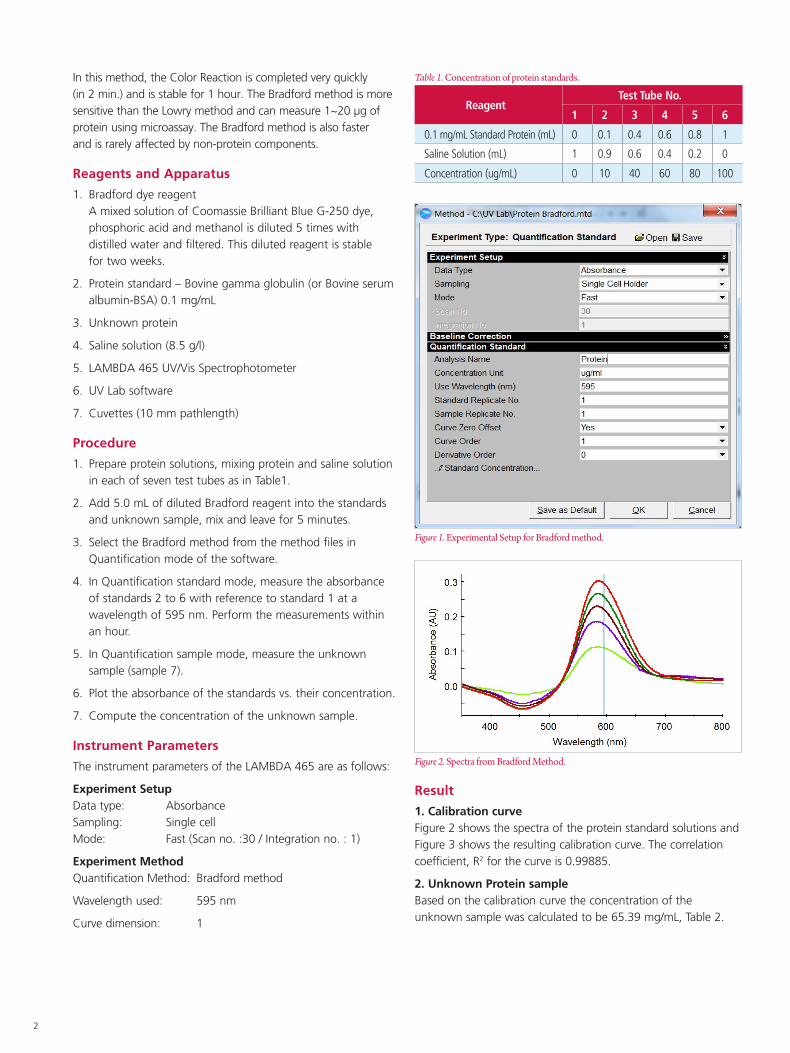
1. Calibration curveFigure 2 shows the spectra of the protein standard solutions and Figure 3 shows the resulting calibration curve. The correlation coefficient, R2 for the curve is 0.99885.
2. Unknown Protein sampleBased on the calibration curve the concentration of the unknown sample was calculated to be 65.39 mg/mL, Table 2.
In this method, the Color Reaction is completed very quickly (in 2 min.) and is stable for 1 hour. The Bradford method is more sensitive than the Lowry method and can measure 1~20 μg of protein using microassay. The Bradford method is also faster and is rarely affected by non-protein components.
Reagents and Apparatus
1. Bradford dye reagent A mixed solution of Coomassie Brilliant Blue G-250 dye, phosphoric acid and methanol is diluted 5 times with distilled water and filtered. This diluted reagent is stable for two weeks.
2. Protein standard – Bovine gamma globulin (or Bovine serum albumin-BSA) 0.1 mg/mL
3. Unknown protein
4. Saline solution (8.5 g/l)
5. LAMBDA 465 UV/Vis Spectrophotometer
6. UV Lab software
7. Cuvettes (10 mm pathlength)
Procedure
1. Prepare protein solutions, mixing protein and saline solution in each of seven test tubes as in Table1.
2. Add 5.0 mL of diluted Bradford reagent into the standards and unknown sample, mix and leave for 5 minutes.
3. Select the Bradford method from the method files in Quantification mode of the software.
4. In Quantification standard mode, measure the absorbance of standards 2 to 6 with reference to standard 1 at a wavelength of 595 nm. Perform the measurements within an hour.
5. In Quantification sample mode, measure the unknown sample (sample 7).
6. Plot the absorbance of the standards vs. their concentration.
7. Compute the concentration of the unknown sample.
Instrument Parameters
The instrument parameters of the LAMBDA 465 are as follows:
Experiment Setup Data type: Absorbance Sampling: Single cell Mode: Fast (Scan no. :30 / Integration no. : 1)
Experiment Method Quantification Method: Bradford method
Wavelength used: 595 nm
Curve dimension: 1
Table 1. Concentration of protein standards.
Figure 1. Experimental Setup for Bradford method.
Figure 2. Spectra from Bradford Method.

For a complete listing of our global offices, visit www.perkinelmer.com/ContactUs
Copyright ©2015-2016, PerkinElmer, Inc. All rights reserved. PerkinElmer® is a registered trademark of PerkinElmer, Inc. All other trademarks are the property of their respective owners. 012399A_01 PKI
PerkinElmer, Inc. 940 Winter Street Waltham, MA 02451 USA P: (800) 762-4000 or (+1) 203-925-4602www.perkinelmer.com
ReagentTest Tube No.
1 2 3 4 5 6
0.1 mg/mL Standard Protein (mL) 0 0.1 0.4 0.6 0.8 1
Saline Solution (mL) 1 0.9 0.6 0.4 0.2 0
Concentration (ug/mL) 0 10 40 60 80 100
Conclusion
Quantitative analysis of protein was performed using the LAMBDA 465 and UV Lab software. Rapid acquirement of spectra and good sensitivity were obtained with the LAMBDA 465. The Quantification mode in the UV Lab software was used effectively for the quantitative analysis and to process the data efficiently.
Figure 3. Calibration curve from the Bradford method .
Function: Y = 0.0021X + 0.0933 R^2 = 0.9988
Name Concentration (µg/mL) Dilution Factor Au (595.00) nm
Sample 1 65.39 1.0 0.2279
Table 2. Concentration of unknown sample.