the development and validation of a spanish elicited
TRANSCRIPT

Brigham Young University Brigham Young University
BYU ScholarsArchive BYU ScholarsArchive
Theses and Dissertations
2013-06-05
The Development and Validation of a Spanish Elicited imitation The Development and Validation of a Spanish Elicited imitation
Test of Oral Language Proficiency for the Missionary Training Test of Oral Language Proficiency for the Missionary Training
Center Center
Carrie A. Thompson Brigham Young University - Provo
Follow this and additional works at: https://scholarsarchive.byu.edu/etd
Part of the Educational Assessment, Evaluation, and Research Commons
BYU ScholarsArchive Citation BYU ScholarsArchive Citation Thompson, Carrie A., "The Development and Validation of a Spanish Elicited imitation Test of Oral Language Proficiency for the Missionary Training Center" (2013). Theses and Dissertations. 3602. https://scholarsarchive.byu.edu/etd/3602
This Dissertation is brought to you for free and open access by BYU ScholarsArchive. It has been accepted for inclusion in Theses and Dissertations by an authorized administrator of BYU ScholarsArchive. For more information, please contact [email protected], [email protected].

The Development and Validation of a Spanish Elicited Imitation Test of Oral Language
Proficiency for the Missionary Training Center
Carrie A. Thompson
A dissertation submitted to the faculty of Brigham Young University
in partial fulfillment of the requirements for the degree of
Doctor of Philosophy
Lane Fischer, Chair Blair E. Bateman Deryle Lonsdale
Peter J. Rich Wendy Baker Smemoe
Educational Inquiry, Measurement, and Evaluation
Brigham Young University
March 2013
Copyright © 2013 Carrie A. Thompson
All Rights Reserved

ABSTRACT
The Development and Validation of a Spanish Elicited Imitation Test of Oral Language Proficiency for the Missionary Training Center
Carrie A. Thompson Educational Inquiry, Measurement and Evaluation
Doctor of Philosophy
The Missionary Training Center (MTC), affiliated with the Church of Jesus Christ of Latter-day Saints, needs a reliable and cost effective way to measure the oral language proficiency of missionaries learning Spanish. The MTC needed to measure incoming missionaries’ Spanish language proficiency for training and classroom assignment as well as to provide exit measures of institutional progress. Oral proficiency interviews and semi-direct assessments require highly trained raters, which is costly and time-consuming.
The Elicited Imitation (EI) test is a computerized, automated test that measures oral language proficiency by having the participant hear and repeat utterances of varying syllable length in the target language. It is economical, simple to administer, and rate. This dissertation outlined the process of creating and scoring an EI test for the MTC. Item Response Theory (IRT) was used to analyze a large bank of EI items. The best performing 43 items comprise the final version MTC Spanish EI test.
Questions about what linguistic features (syllable length, grammatical difficulty) contribute to item difficulty were addressed. Regression analysis showed that syllable length predicted item difficulty, whereas grammar difficulty did not.
Keywords: elicited imitation, oral proficiency assessment, automatic speech recognition, ASR, second language proficiency testing, Spanish second language testing, IRT, Item Response Theory

ACKNOWLEDGEMENTS
I received tremendous support and help during the conception and completion of this
dissertation. I am especially grateful to my Chair Dr. Lane Fischer for his encouragement,
responsiveness and kindness. His guidance has made this an enjoyable and rewarding
experience. I would also like to thank my dissertation committee for their professionalism and
valuable feedback. In addition, Dr. Richard Sudweeks provided valuable Item Response Theory
guidance.
I’m so grateful to Sara Moulton and Robyn Campbell who spent many hours helping me
during the instrument testing process. Additionally I want to especially acknowledge and thank
Sean Murphy who developed the EI test delivery module and Casey Kennington who developed
the MTC Spanish ASR scoring tool. Finally, I would like to thank the MTC administration for
their support and the missionaries for their willing participation.

iv
Table of Contents
Chapter 1: Introduction ....................................................................................................................1
Missionary Training Center Spanish Language Proficiency Measures ........................................2
Measures....................................................................................................................................2
Challenges. ................................................................................................................................3
Elicited Imitation Proficiency Measures ......................................................................................3
Statement of Purpose and Research Questions.............................................................................4
Chapter 2: Literature Review ...........................................................................................................5
Overview of Language Proficiency Testing .................................................................................5
Language Testing at the MTC ......................................................................................................6
Elicited Imitation ..........................................................................................................................9
Theoretical underpinnings. ......................................................................................................10
EI in second language testing. .................................................................................................11
BYU PSST group. ...............................................................................................................13
Design.................................................................................................................................14
Administration. ...................................................................................................................16
Scoring. ..............................................................................................................................17
Statistical Analysis used to develop EI measures. ..................................................................20
Item Response Theory (IRT). ..............................................................................................21
IRT Partial Credit Model. ..................................................................................................22
Multiple regression. ...........................................................................................................23
Chapter 3: Method for Developing Spanish EI Test ......................................................................24
Development of the MTC Spanish EI instrument ......................................................................24

v
Selection of items. ...................................................................................................................24
Selection of an elicitor.............................................................................................................26
Testing Phases ............................................................................................................................27
Phase I. ....................................................................................................................................27
Participants. .......................................................................................................................27
Testing. ...............................................................................................................................28
Phase II. ...................................................................................................................................29
Participants. .......................................................................................................................29
Testing. ...............................................................................................................................30
Test administration. .................................................................................................................30
Scoring EI Tests For Both Phases ..............................................................................................31
Hand rating. .............................................................................................................................31
ASR scoring. ...........................................................................................................................33
Preparing the data for analysis. ...............................................................................................33
Chapter 4: Analysis Results ...........................................................................................................36
Category Probability Curves. .....................................................................................................36
Average Measures ......................................................................................................................37
Category Fit Statistics .................................................................................................................37
Estimated Discrimination ...........................................................................................................38
Overall Test Reliability ..............................................................................................................38
Item Omission Decision Process ................................................................................................39
ASR/Hand ratings Comparison ..................................................................................................41
Item Difficulty Analysis .............................................................................................................43

vi
Chapter 5: Summary and Conclusions ...........................................................................................45
Summary .....................................................................................................................................45
Nature of the MTC EI test. ......................................................................................................45
Process of developing an EI test. ............................................................................................45
Correlation between ASR and hand scoring. ..........................................................................46
Nature of item difficulty. .........................................................................................................46
Discussion and Implications....................................................................................................46
Limitations ..................................................................................................................................48
Recommendations for Future Research ......................................................................................49
MTC Research.........................................................................................................................49
Linguistic Research. ................................................................................................................50
Statistical Research. ................................................................................................................50
References ......................................................................................................................................52
Appendix A: Winsteps Output Phase I ..........................................................................................57
Appendix B: MTC Spanish Elicited Imitation Test Ordered by Difficulty Level .........................59

vii
List of Tables
Table 1: Testing Design for Phase I .............................................................................................. 26
Table 2: Sample for Phase I .......................................................................................................... 28
Table 3: Sample for Phase II ......................................................................................................... 30
Table 4: Data Analysis Organization ............................................................................................ 34
Table 5: Raw Score Conversion Chart.......................................................................................... 35

viii
List of Figures
Figure 1: Example of Rating Tool Interface. ................................................................................ 32
Figure 2: Category Probability Curve ........................................................................................... 37
Figure 3: Person and Item Reliability Chart ................................................................................. 39
Figure 4: Winsteps Table 13.1 Output Example ........................................................................... 40

1
Chapter 1: Introduction
In the field of linguistics and foreign language education, there is an ongoing need for
assessment of language proficiency. There are three major approaches to testing oral language
proficiency: oral proficiency interviews, semi-direct tests and automated tests (Bernstein, Van
Moere, & Cheng, 2010). Oral proficiency interviews and semi-directs tests require highly
trained raters which is costly and time-consuming. Automated tests are administered on a
computer and rated automatically by speech recognition software. Automated test eliminate the
need for highly trained raters, therefore reducing the time and cost needed to administer and rate
oral language proficiency.
The Church of Jesus Christ of Latter-day Saints’ Missionary Training Center (MTC)
teaches foreign language to pre-service missionaries. The MTC teaches 55 different languages.
It trains approximately 19,000 missionaries in a year. The MTC teaches a general lexicon but
also a specialized corpus of religious context vocabulary.
At the beginning of their service, missionaries learning another language usually spend
three to twelve weeks at a Missionary Training Center (MTC) in Provo, Utah. At present,
approximately half of the missionaries studying another language at the Provo MTC are learning
Spanish (roughly 1,000). With so many Spanish language learners, the task of assessing their
language proficiency requires a lot of resources, time and effort. Because of the specialized
language being taught, the MTC needs a custom, valid Spanish oral language proficiency
measure that is easy and practical to administer and rate.

2
Missionary Training Center Spanish Language Proficiency Measures
Currently there are two Spanish proficiency measures used at the MTC: a placement
measure and an exit measure. The placement measure is used to make classroom assignments
and the exit measure is used to gather institutional progress reports.
Measures. When missionaries apply for mission service, they indicate whether or not
they have prior language experience (e.g., studied it in school, lived in another country).
Missionaries who are assigned to a Spanish-speaking mission and indicate a certain level of prior
language experience in Spanish receive a phone call from an MTC employee several weeks
preceding their arrival date and are asked several questions in Spanish in order to determine their
level of proficiency. As a result of these interviews, these missionaries are given a language
proficiency score on a scale from one to seven. Missionaries who receive a placement score of
one or two are placed in beginning level classrooms and stay at the MTC for nine weeks. Those
who receive a three or four are placed in an intermediate level classroom and also stay at the
MTC for nine weeks. Those who receive a five, six or seven are placed in an advanced level
classroom and stay at the MTC for three weeks.
Every week at the MTC, a randomly selected subset of exiting missionaries is tested on
various criteria (e.g., doctrinal knowledge, study skills) for institutional progress reports. One of
these measures for language missionaries is the Language Speaking Assessment (LSA)–a
computerized audio-response assessment that elicits spontaneous speech from the missionaries.
The LSA was developed by the MTC using the American Council on the Teaching of Foreign
Languages (ACTFL) Proficiency Guidelines (Breiner-Sanders et al., 2000). Missionaries read
and respond to a prompt (e.g., “Tell about yourself”). Their responses are recorded and a trained
rater listens to their responses and gives four separate ratings in the areas of pronunciation,

3
grammar, vocabulary and fluency, which are aggregated to one overall language proficiency
score.
Challenges. There are some challenges with the current placement procedures. Because
current procedures are cumbersome, not all missionaries who should receive placement
interviews are actually interviewed. Also, placement ratings are sometimes inaccurate because
the ratings are quite subjective. This becomes problematic because errors in placing missionaries
into the correct training program causes significant logistical and scheduling problems due to the
need to reassign classes and can become quite costly to the MTC. Additionally, such
adjustments in training times affect entrance dates into the mission field.
After missionaries’ training, they should receive an exit assessment of their proficiency
as an estimate of the effectiveness of training. Pragmatically, this has proved to be very difficult
with the number of missionaries to be assessed. Hiring and training LSA raters is a costly,
never-ending process. Because of the difficulty in training and hiring good raters, LSA ratings
can be inaccurate. Inaccurate language proficiency exit scores hinder the MTC’s ability to
measure the institution’s impact on teaching Spanish to missionaries. Because of the challenge
in the current procedure, the MTC needs a practical, accurate and inexpensive instrument to
measure Spanish oral language proficiency. If a more efficient method of measuring language
could be implemented prior to entering and exiting the MTC, many of these problems could be
eliminated. An instrument that is more economical and objective that is also valid and reliable
would be a welcome improvement to the language training and assessment process at the MTC.
Elicited Imitation Proficiency Measures
The MTC currently uses interviews and semi-direct test proficiency tests. They are quite
interested in developing and using automated tests of Spanish oral language proficiency. Elicited

4
Imitation (EI) tests are computerized automated tests that measure oral language proficiency by
having a participant hear and repeat sentences of varying syllable length in the target language.
They are economical and simple to administer and rate. An EI sculpted to the specific needs of
the MTC could provide a way to measure incoming missionaries’ Spanish language proficiency
for training and classroom assignments as well as provide exit measures of institutional progress.
Statement of Purpose and Research Questions
The purpose of this project is to develop and validate a Spanish Elicited Imitation test
that will reliably and accurately measure oral language proficiency skills for missionaries
learning Spanish at the MTC. Additionally, this project will investigate how sentence length and
grammatical difficulty contribute to the overall difficulty of an item. This study will be guided by
the following research questions:
1. What does an MTC Spanish Elicited Imitation test consist of?
2. What is the process for creating an elicited imitation test?
3. What is the correlation between automatic speech recognition (ASR) scoring with hand
scoring of an MTC Spanish EI?
4. What makes an item difficult? What is the main effect of grammar? What is the main
effect of sentence length? Is there an interaction between grammar and sentence length?

5
Chapter 2: Literature Review
This review of literature covers several themes. First, it provides a general overview of
current oral second language proficiency measures and practices. Second, the history of language
testing at the MTC is discussed. Third, the review summarizes the literature on using Elicited
Imitation (EI) tests as overall second language proficiency measures including EI history,
premise, uses, strengths, limitations, design, development, administration, and scoring. Lastly,
this review discusses the statistical analysis methods used to validate and calibrate EI tests, as
well as the analysis of linguistic features of items that may contribute to item difficulty.
Overview of Language Proficiency Testing
At present there are three main approaches to testing oral language proficiency: (a) Oral
Proficiency Interviews, (b) semi-direct tests, and (c) automated tests (Bernstein et al., 2010).
Oral proficiency interviews (OPIs) are carefully constructed conversations between a highly
trained rater and a test taker. Through a series of questions, the rater tries to elicit a ratable
speech sample and then assigns a proficiency score based on the complexity and accuracy of the
speech sample (Buck, 1989). Oral Proficiency Interviews are often considered the “gold
standard” of language testing because they closely mirror authentic language situations.
However, OPIs require time and money. Interviews (or phone interviews) can take 15-30
minutes and the current cost for an official ACTFL OPI is $1341.
Semi-direct tests of oral proficiency use computers to present tasks to elicit language.
The test-takers’ responses are recorded and then evaluated by raters according criteria similar to
the OPI. These semi-direct tests are considered very comparable to, yet more reliable than, live
tests (Stansfield and Kenyon, 1992). Examples of semi-direct tests include the Computer
Assisted Screening Tool (CAST) (Malone, 2007) and the Computerized Oral Proficiency 1 http://www.actfl.org/i4a/pages/index.cfm?pageid=3385

6
Interview (COPI)2. Even though semi-direct tests can be taken anywhere at any time and thus
eliminate the need for face-to-face (or phone) interaction between rater and the test-taker, they
still require highly trained raters which is both costly and time-consuming.
Lastly, automated tests use a series of recorded prompts that are presented to a test-taker
and then the test-taker gives a spoken response in real time. These tasks includes the repetition
of sentences, short questions, sentence builds and passage retells. The test-takers’ responses are
recorded and then analyzed by computer procedures. Scores are given based on sentence
mastery, vocabulary, fluency and pronunciation (Bernstein et al., 2010). Examples of automated
tests include the Versant tests (Pearson, 2009b), the speaking tasks within the Pearson Test of
English (Pearson, 2009a), the speaking section of the TOEFL iBT practice tests (Zechner,
Higgins, XI, Williamson, 2009), and oral response elicitation tools and elicited imitation tests
(EI) (Graham, 2008). Automated tests eliminate the need for face-to-face interaction and highly
trained raters.
Language Testing at the MTC
In the 1970s the Foreign Service Institute (FSI) assessed language proficiency using an
oral language interview. About this time administrators and researchers at the MTC recognized
a need to test the language proficiency of missionaries who were learning a second language.
Therefore, the MTC contacted the Educational Testing Services (ETS) who sent a representative
to train raters on administering and scoring the FSI test with missionaries. Unfortunately, there
were several drawbacks with using the FSI test with missionaries at the MTC. The FSI test did
not adapt well to the unique context of missionary work nor did it discriminate well among
different levels. Over time, administering and scoring the FSI became challenging and
expensive (Moulton, 2012). 2 http://www.cal.org/topics/ta/copi.html

7
In the early 1990s, the MTC developed an internal language proficiency instrument that
incorporated the missionary context. The instrument was called the Modern Language
Performance Test (MLPT). The MLPT was an in-person role-play test conducted by trained
testers. The test engaged missionaries in language tasks of increasing difficulty and then gave
them a rating on five criteria: pronunciation, grammar, vocabulary, comprehension, overall task
performance (Bateman, 1995). The test was used at the MTC throughout the 1990’s but
eventually the MTC stopped using it because they could only test and rate a subset of
missionaries due to the time and cost of administration and rating. Additionally, changes in
MTC curriculum moved away from missionaries teaching fixed discussions and this change
rendered the MLPT content obsolete.
However, around that time new technologies in semi-direct language testing were
developing in the language testing community. The MTC decided to create a more efficient and
practical language semi-direct testing instrument (Moulton, 2012). In 2004, the MTC developed
such a proficiency instrument called the Language Speaking Assessment (LSA). The LSA is a
web-based assessment developed by a team of language experts at the MTC and is currently
considered the “gold standard” of missionary language testing. The LSA is based on criteria
from (a) the MLPT, (b) guidelines set up by the American Council on the Teaching of Foreign
Languages (ACTFL) and (c) the scoring rubric used to rate OPIs 3. To take the LSA,
missionaries (a) read a prompt, (b) prepare to respond (30-60 seconds), and (c) orally respond to
the prompt (30 seconds to 3 minutes) (Moulton, 2012). Subsequently, trained raters listen to the
recorded audio responses and assign four ratings on a seven point scale for pronunciation,
grammar, fluency, and vocabulary. The four ratings are aggregated to one overall proficiency
rating. 3 http://www.actfl.org/files/public/ACTFLProficiencyGuidelines2012_FINAL.pdf

8
The LSA is currently used at the MTC and in the mission field to assess language
proficiency. This instrument has provided valuable insight into missionaries’ language abilities
and it has allowed more missionaries to participate in language testing. However, just like other
semi-direct instruments, the LSA has the pragmatic limitation of requiring human raters to listen
to and rate all of the recordings.
Recently, the MTC administration has expressed interest in finding an additional valid
language proficiency measure that could more practically measure language proficiency while
obtaining a high correlation with the LSA. Recently, the MTC developed an English elicited
imitation test for non-native missionaries learning English (Moulton, 2012). The MTC English
EI hand rating score correlated fairly strongly with the MTC’s LSA (r = 0.83) (Moulton, 2012).
Moulton’s pilot was encouraging; however, because of time constraints her method was not as
refined as current test development practices would require. There were limitations in her item
selection criteria, the initial item pool and the sample size. Her item analysis was restricted to
classical test theory item difficulty estimates. Also, the elicitor was chosen by convenience and
not carefully screed for neutrality of accent. She did, however, coordinate the creation of an
automatic speech recognition (ASR) engine to score the tests. Because of promising results with
the MTC English EI, MTC administrators and researchers were eager to develop a Spanish
elicited imitation test for the largest population of language-learning missionaries.
Any attempt to create a Spanish EI would need to use more refined test development
practices. The literature on developing and validating EI tests covers a variety of topics
including test validity, uses, design, administration, and scoring. The literature shows that some
methods are better than others in developing valid and reliable EI measures.

9
Elicited Imitation
Elicited imitation, as a measure of second language proficiency, has been met with
criticism and skepticism because of its apparent lack of validity. Using EI as a measure of
language proficiency was popular in the 1970s (Naiman, 1974). However, Hood and
Lightbrown (1978) argued that EI tests did not fit requirements of proper research methods. They
questioned the validity and reliability of the EI to measure linguistic knowledge. Language
testing practitioners have been slow to accept elicited imitation because “it is hard for them to
see how repeating sentences orally can measure something as complex as oral language
proficiency” (Graham et al., 2008a, p. 57). Because of Hood and Lightbrown’s criticism, EI lost
some popularity. Despite this loss in popularity, researchers in the 1980s continued to evaluate
the EI as a measure of linguistic competencies.
Gallimore and Tharp (1981) found that EI produced stable test-retest correlations and that
it was related to language behavior in natural settings, and reflected stages of language
development. Even though there were questions of face validity, researchers concluded that EI
works, but at that time, they did not know how or why (Vinther, 2002).
Critics also questioned the ability to know whether the test-taker is really using linguistic
knowledge to understand and repeat an utterance or is merely imitating a chain of sounds without
understanding meaning by holding the information in short-term memory—a process called
“parroting” by some researchers (Vinther, 2002).
Elicited imitation does involve working memory. Working memory contains
information held momentarily as needed to analyze, solve a problem or perform a task (Cowan,
1996). Miller’s (1956) research on working memory discussed the “magic number” of 7 ± 2,
based on the observation that a person can generally hold up to seven completely unrelated items

10
in their mind simultaneously. Miller also introduced the process of recoding, now more
commonly referred to as “chunking”. Chunking takes multiple separate items and compiles them
into patterns, reducing the number of items to remember and speeding up processing.
In a recent study (Okura & Lonsdale, 2012), researchers investigated the role of working
memory with second language elicited imitation tasks. They administered two tests to the same
group of students studying English as a second language: (a) a working memory test, and (b) an
English EI test. Their results indicated that the correlation between the working memory scores
and the elicited imitation scores were not significant. Therefore, parroting does not seem to be a
factor with using elicited imitation tests to measure second language proficiency because the
utterance that test-takers are asked to repeat moved beyond the ability of the working memory.
Theoretical underpinnings. In 1994, Bley-Vroman and Chaudron published a
breakthrough article describing how EI works. They explained that EI is a psycholinguistic
technique used to test language ability. They described that there is a correlation between a test-
takers’ knowledge of a language and their ability to repeat elicited utterances.
Bley-Vroman and Chaudron (1994) described further how the elicited imitation process
works. A test-taker hears the utterance and processes it, forming a representation in their
memory. Because working memory can only handle a certain number of items, test-takers will
“chunk” groups of words together so more information can be stored in the short-term memory.
Chunking occurs when test-takers hear and process an utterance, and then form a meaningful
representation that can be stored. Test-takers who are more proficient in the language have a
greater capacity to chunk longer sentences into manageable units and keep those units in their
short-term memory.

11
The representations of meaning stored in their memories include information at various
levels including visual, orthographic, syllabic, lexical, phrasal, structure, logical, and
interpretive. Test-takers create a representation that is based on as many levels as possible in
order for the representation to be as complete as possible. The more proficient the test-takers are
in the language being examined, the more levels they can access to create their representation of
the utterances. The test-takers then produce an utterance based on the representation they have
been able to construct. Again, the more proficient the test-takers in the language being
examined, the more effective they are at the automatic formulation of a representation and the
more accurate the reconstruction of utterances (Bley-Vroman & Chaudron, 1994). Therefore, if
test-takers are presented with a variety of sentences that vary in length and difficulty, their ability
to understand the utterances and then reconstruct them will vary according to their overall
speaking proficiency.
With some caution, Bley-Vroman and Chaudron (1994) stated,
We regard it as premature to view elicited imitation as a proven method for inferring
learning competence, because a considerable amount of research needs to be conducted
to understand how performance under imitation conditions compares with other methods
and with learners’ underlying knowledge. (p. 245)
They further stated, “The more you know of a foreign language the better you can imitate the
sentences of the language. Thus, EI is a reasonable measure of global proficiency (p. 247).” In
essence, EI can produce a quick indication of a person’s overall language proficiency.
EI in second language testing. Elicited imitation has been used mainly within three
areas: child language research, neuropsychological research and second language research
(Vinther, 2002). For second language research uses, test-takers listen to and repeat, to the best of

12
their ability, utterances of varying lengths and complexities in the language being acquired
(Graham et al., 2008a). The premise is that a person’s ability to accurately repeat is dependent
upon language proficiency. A low proficiency test-taker’s ability to accurately repeat sentences
will diminish as the utterances get longer and more complex.
Using112 students learning French, Naiman (1974) developed an EI test and compared it
with comprehension and production tests. His results showed a strong correlation between the
EI test scores and the scores on other tests.
Henning (1983) assessed 143 adult Egyptian learners of English as a foreign language
using three oral proficiency testing methods (a) EI, (b) oral interviews, and (c) sentence
completion. Similarly, five components under each method (raw score, fluency, pronunciation,
grammar, and combined fluency-pronunciation-grammar ratings) were analyzed separately and
in tandem. Multicomponent-multimethod convergent and discriminant validities were
determined. Stepwise multiple regression was computed using FSI-like interview scores as the
dependent variable. Rasch latent trait calibration and tests of fit validity were also computed for
imitation and completion tests. Researchers compared the three oral testing methods across all
components for all empirical validity indexes and ranked them. The EI test ranked first followed
by the interview and the completion method.
Additionally, Radloff (1991) and other researchers from the Summer Institute of
Linguistics (SIL) used the EI as an assessment of oral proficiency in Pakistan and compared it
with OPI ratings. They also found EI to be reliable and correlated with OPI ratings.
More recently, Erlam (2006) tested EI with 20 native English speakers and 95 English as
second language learners. The design of her test differed from many EI tests. She used some
ungrammatical sentences to see if test-takers would use their implicit language knowledge and

13
correct the ungrammatical sentences. The results show that native speakers were able to
correctly repeat 97% of the grammatical items; additionally, they corrected 91% of the
ungrammatical items. The second language learners were able to repeat 61% of the grammatical
items and they corrected 35% of the ungrammatical ones. She then correlated the scores for
repeating grammatical sentences with the scores for correcting ungrammatical sentences and
found a significant positive correlation for all participants.
Additionally, Erlam (2006) compared the test-takers’ EI performance with their
performance on an oral narrative task and the International English Language Testing System
(IELTS) speaking and listening test (the scores for grammatical and ungrammatical items were
combined). Results showed a significant correlation between the second language learners’
overall scores on the EI task, the oral narrative task, and both the IELTS speaking and listening
tests. She concluded that the EI test is a likely measure of implicit language knowledge.
BYU PSST group. Most recently, the Pedagogical Software and Speech Technology
(PSST) research group in the BYU Department of Linguistics developed, tested and validated EI
tests in several languages. In the first of their studies (Graham et al., 2008a), researchers created
a 60-item English EI test and administered it to 156 adult ESL learners. The subjects were also
given four additional speaking tests. These included an informal 15-minute placement interview,
a 30-minute simulated computer-administered oral proficiency test English Certification Test
(ECT), a 30-minute computer-elicited oral level achievement test (LAT), and an Oral Proficiency
Interview (OPI). Their results indicate that correlations between the EI scores and other
measures are on the same order as intercorrelations among the other four more conventional
methods of measuring oral language proficiency. For example, the EI correlates with the OPI as
well as or better than the informal placement interview and the two computerized speaking tests,

14
which require much more training and time to administer and score. They concluded that overall
comparisons between EI scores and scores on other measures of oral language proficiency were
very promising.
The PSST group has also created and validated French, Japanese and Spanish EI
language proficiency tests (Graham et al., forthcoming; Matsushita, 2011; Millard, 2011). All
three of these EI proficiency tests showed promising results indicating that EI can measure
global language proficiency accurately and reliably.
Additionally, the BYU PSST group has published several articles pertaining to elicited
imitation testing. These include (1) the role of lexical choice in elicited imitation items (Graham
et al., 2008b), (2) the use of automatic speech recognition (ASR) scoring (Graham et al., 2008a),
(3) selecting EI items (Christensen et al., 2010), (4) factors that contribute to item difficulty
(Hendrickson et al., 2010), and (5) morphological features of second language acquisition
(Weitze et al., 2011).
Design. Tomita and Jessop (2009) gave a list of criteria that should be considered in the
development of an EI instrument:
1. Stimulus sentences should exceed participants’ working memory capacity.
2. Target structures (features that are being evaluated) should be embedded in the middle of
the stimulus sentences.
3. Sentences must ensure that the participant is attending to meaning rather than form.
4. The participants’ performance must not be greatly influenced by the sentence’s linguistic
complexity or difficulty.
5. Stimulus sentences should not be too easy or too difficult.
6. Instructions need to be simple and clear.

15
7. The testing environment should be comparable for all test takers.
8. The materials need to be equally appropriate for all participants.
9. Scoring must accurately reflect the participants’ proficiency. Detailed scoring procedures
must be provided for the raters.
10. Two or more trained raters should score the data and have high interrater reliability or
one researcher should score with a relatively long time interval between ratings.
Many of these standards involve considerable work in selecting appropriate items for the test.
There are several ways to develop or select sentences for an EI test: (a) construct sentences that
include features that need to be investigated, (b) administer another proficiency measure, like the
OPI, and use utterances from this test as EI stimuli, and (c) extract naturally occurring sentences
from a corpus of natural language (Millard, 2011). Some studies have found that constructed
sentences are often unnatural and awkward. This can limit their effectiveness (Christensen et al.,
2010). Using naturally occurring authentic sentences improved correlations and better
distinguished higher level speakers (Christensen et al., 2010; Matsushita, 2011).
To aid in constructing and annotating English EI test items from authentic materials,
researchers developed an automatic sentence analysis tool (Christensen et al., 2010). They
brought together several available resources into one tool. The tool drew data from single
sentence input by the user or from a corpus. Then it used several online tools to parse and
annotate relevant features of each sentence. The tool enabled researchers to specify desired
grammatical features, relative position in the sentence (at the beginning or end), lexical density
of the item, morphological complexity and sentence length. Therefore, researchers were able to
select authentic sentences that have all of the desired linguistic features, without having to
construct the sentences themselves.
16
It is important to note that the syllable length ceiling is different for each language.
Native speakers of English usually break down (cannot repeat back) at about 22 syllables,
whereas native Spanish speakers can go up to 32 syllables. Therefore, it is important to test the
ceiling effect for each language in advanced (R. Graham, personal email communication,
August, 28 2012).
Administration. Test administration is critical to the achievement of valid and reliable
scores when using EI tests. Several methods have been used in administering the test. Initially,
sentences were delivered directly from the researcher to the test-taker. The responses were
recorded either by hand or by tape recorders (Erlam, 2006). The current practice is to deliver the
sentences online, record the responses using computer software and save them as .wav files.
As previously mentioned, it is very important that instructions are clear and simple so
that the test-takers know exactly what to do during the test. It is also vital that the stimulus
prompts are high quality recordings that are easy to understand (natural speech rate, sufficient
volume, etc.). In previous BYU testing, the reliability of the proficiency scores was greatly
affected by problems in sound volume and rate of speech (R. Graham, personal email
communication, August 20, 2012).
Research continues with regard to issues concerning the best delivery methods. Some of
these issues include using male or female voices for the prompt, the speed of the delivery,
allowing users to control item advancement, and the length of pause between items. One current
researcher, who has tried several methods of delivery, suggests that it is best to keep things
consistent. The sentences should advance automatically with a three to four second pause in
between each item (R. Graham, personal email communication, August 20, 2012).

17
Scoring. There are two main methods for scoring elicited imitation items; hand scoring
and automatic scoring that uses speech recognition software. For hand scoring, some researchers
have used methods where a subjective score is given according to meeting certain criteria
(Ortega, 2000). Another example is Keller-Cohen (1981) who used a 1 to 7 scale continuum (1=
no repetition and 7= perfect imitation). These methods are considered less reliable because they
require complex subjective grading procedures.
Other researchers have used scoring methods that look for correct imitations of specific
grammatical features. In one study, the correct or incorrect imitation of the specific feature
under investigation rendered a binary score of 1 or 0 (Erlam, 2006). In another study, Müller
(2010) used weighting procedures with the features deemed to be the most important.
To make scoring more objective, Chaudron et al. (2005) introduced a scoring method
where raters counted mispronounced or missing syllables in each sentences and gave a score
ranging from four points (for a perfect repetition) to zero points (for utterances with four or more
errors). To improve upon this method, Graham (2006) implemented a binary scoring method:
one point for each correctly pronounced syllable. Then, each sentence would calculate a total
score for the proportion of syllables pronounced correctly. Finally, there would be a total score
for the proportion of syllables pronounced correctly for the entire test.
All of these methods mentioned describe human hand scoring. Even though methods
have improved to become more objective, raters still need training with issues they encounter
when rating. EI researchers have suggested the following guidelines (R. Graham, personal email
communication, August 20, 2012):
1. If the test-taker inserts a word, it is not counted against them.
2. If the test-taker transposes two words, give one point for one word but not both.

18
3. If the pronunciation is so far off that the syllable would not be recognized, do not give
credit.
4. If an utterance is cut off, the raters can only give credit for what they hear.
Automatic speech recognition (ASR) is an emerging technology that uses software to
transcribe spoken language. It is a complex task combining physics, engineering, mathematics,
statistics and linguistics. Carnegie Mellon University has developed and offered Sphinx as an
open source product. Sphinx requires an acoustic model, a language model and a pronunciation
dictionary. For several languages, including Spanish, there are existing models available (C.
Kennington, personal email communication, August 19, 2012). Automatic speech recognition
involves taking an input acoustic signal and sampling it at regular intervals. The samples are
then analyzed for features that are salient for downstream processing (Graham et al., 2008a).
Developing an ASR involves an iterative refinement process trying out different recognizer
parameters, grammar and lexical specifications, and language models. In order to improve ASR
scoring, developers can even create a unique language model for each individual stimulus. With
this, the recognizer is able to identify what the test-taker said and compare it against the expected
utterance.
Researchers have identified a few issues that need to be considered when using ASR for EI
tests (Graham et al., 2008a). First, ASR is an emerging technology and advancements continue
to be made. Second, automating the task of rating involves a nontrivial integration with already
complex systems. Third, the test-takers are non-native speakers with varying degrees of their
first language accents, whereas ASR models are generally tuned and trained for recognition of
native speakers. Fourth, there is a granularity mismatch in the data since EI scores are done at
the syllable level whereas ASR scores are computed at the word level.

19
On the other hand, these same researchers have identified several considerations that
make ASR use with EI tests convincing (Graham et al., 2008a):
1. Since humans can score EI following strict scoring criteria, it is reasonable to expect that
one could automate the task.
2. The expected input for any given test sentence is already known, so the ASR task is much
more constrained.
3. The ASR task can be developed with open-source technology in languages where the
resources exit.
4. There is a sizable potential economic benefit if the test can be delivered on a large scale,
short turnaround time and at low cost when compared to human scoring.
5. The procedure can be applied to score learners of other languages, provided ASR models
are available for those languages.
Despite the complexities with developing ASR scoring systems with EI, significant progress
has been made and continues to be made. For example, Graham et al. (2008a) reported that they
were able to achieve r = 0.90 correlation with the ASR and the hand scoring of English EI.
Additionally, Moulton (2012) reported r = 0.82 correlation with the ASR and the hand scoring.
For Spanish, Graham, (forthcoming) reports correlations ranging from r = 0.85 to r = 0.88
between ASR and hand scoring of Spanish EI.
The research possibilities for ASR are quite numerous. ASR can provide additional
information regarding recognized utterances. Examples include silent pauses, syllabic timing
(rhythm), speech chunks, disfluencies, pitch, phoneme lengths, and utterance durations (Graham
et al., forthcoming).

20
Statistical Analysis used to develop EI measures. Elicited imitation uses several
methods of analysis. First, simple correlations are used to validate the EI with other external
measures as well as compare hand scoring with ASR scoring. Second, item response theory is
used to analyze the EI items in order to identify the best discriminating items. Lastly, some
recent research has used regression to determine the linguistic features that contribute to item
difficulty.
The most common statistical procedure, which is used to validate elicited imitation tests,
is the use of correlations. The English EI test is often compared to other external measures, such
as the OPI (Graham, 2008a). Overall correlations of external measures with the EI are fairly
strong. In one recent study, Bernstein et al. (2010) found that external tests correlate with the EI
between r = 0.75 and r = 0.85.
At the Missionary Training Center, the results of the English EI test were compared to the
Language Speaking Assessment (Moulton, 2012). In this study, the correlation between the LSA
and the hand-scored EI test was r = 0.83, while the correlation between the LSA and the ASR
was r = 0.89. Another use of correlation includes comparing hand scoring results with ASR
results. For this recent MTC study, the hand scoring and ASR score correlated at r = 0.86
(Moulton, 2012).
There are two popular methods for analyzing and improving tests: Classical Test Theory
(CTT) and Item Response Theory (IRT). CTT uses several statistics: (a) item difficulty index
(the proportion of examinees answering the item correctly), (b) item discrimination index (the
extent to which an item differentiates between examinees), (c) reliability coefficient, and (d)
standard error measurements. There are four limitations of CTT that IRT solves.

21
First, the traditional statistical indicators listed above, are group dependent. In other
words, the size of these statistics varies depending on the group who took the test. Second, the
scores obtained by the examinees are test-dependent: scores are not directly comparable to the
scores of examinees who responded to other forms of the test. Third, CTT assumes that the error
variance is the same for examinees across all levels of ability. It does not provide a way of
estimating differences in measurement error for examinees at varying levels of the trait or ability
being measured. The standard error of measurement based on CTT is a group statistic that
describes the average amount of measurement error in the scores of examinees at varying levels
of ability. Lastly, the CTT concept of reliability is defined in terms of “parallel” test forms, but in
practice it is difficult to obtain or construct alternative forms that are strictly parallel (Sudweeks,
2011).
Item Response Theory (IRT). IRT is the best method to use when constructing and/or
improving tests because it does not have the limitations of CTT. IRT is a family of statistical
modeling procedures used to analyze people’s responses to individual items in a test or other
assessment procedures in order to estimate the degree to which individuals possess the latent trait
measured by a particular test or scale IRT also predicts how the probability of selecting a
particular option varies as a function of the person’s trait level (Sudweeks, 2011).
One advantage of IRT is that both the item difficulty calibrations and the person ability
measures are calculated on the same scale or metric. Consequently, once a researcher has
computed estimates of the difficulty parameters for the various items and the “ability” (or trait
level) of each examinee, these estimates can be graphically displayed on the scale representing
the latent trait collectively measured by that set of items. The latent trait scale usually ranges
between +4 and –4. The zero point on the scale represents an item of average difficulty. Items

22
that have difficulty calibrations below zero are easier, while items with difficulty calibrations
above zero are more difficult. Similarly, persons who have large positive trait levels estimates
are presumed to have more of the trait than persons who have smaller trait level estimates
(Sudweeks, 2011).
IRT Partial Credit Model. In the IRT family, the most common models are used for
dichotomously scored items (1=correct, 0=incorrect). As an extension to the dichotomous
models, there are models used to score polytomous items (more than two possible responses).
Polytomous models are used for test items for which successively higher integer scores are
intended to indicate increasing levels of competence or attainment. Past elicited imitation
projects have used the Rating Scale Model (RSM). For this project, the Partial Credit Model
(PCM) was used. The PCM was developed for use in situations where assessment instruments
contain items that represent ratings of the degree of quality, frequency, amount and where
different items include either varying number or varying kinds of response categories
(Sudweeks, 2011).
The Rating Scales Model and the Partial Credit Model function quite similarly and
produce similar statistical results. The major difference between the two models lies in the
number and function of response categories. With PCM all items are assumed to have the same
discriminating power, but the items may have different number of response categories or
categories that function differently. With the RSM all items have a common set of response
options that are assumed to function in the same manner across all items.
Item response theory helps researchers identify the best discriminating items. Once
these items are identified, the test can be shortened and retested (Graham, 2008a). Specifically,
recent research has shown that the Rasch Rating Scale Model

23
worked the best when analyzing items (Graham, 2008a). To use the rating scales model, overall
test score percentages are divided into categories. For example, five categories may use: 0% = 1,
1%-34% = 2, 35%-64% = 3, 65%-99% = 4, 100% = 5. Once the categories have been
established, the Rasch Rating Scale Model analyzes the items and produces valuable item
information which is used to identify the best items.
Multiple regression. Recently researchers used multiple linear regression analysis to see
what factors have the most impact on item difficulty in English (Hendrickson et al., 2010). The
authors used item difficulty scores from previously administered tests with IRT. They then
tagged each sentence for syntactic, lexical, and morphological features that could affect the
difficulty of an item. Their results indicated that overall syllable length contributes the most to
item difficulty. Further analysis looked at groups of sentences with the same syllable length.
They found that for some syllable lengths, a few specific grammatical features contributed to
item difficulty. Preliminary regression analysis looking at the data from the BYU version of the
Spanish EI test found that sentence length - as measured by the number of syllables - was the
only contributing factor.
In summary, the literature argues that EI tests are valid and reliable measures of global
language proficiency. However, the methods and process for developing, administering and
scoring tests vary and some are better than others.

24
Chapter 3: Method for Developing Spanish EI Test
This chapter outlines the process for developing and administering a specialized Spanish
EI test for use in the MTC, Provo, Utah. The process of creating and refining an EI test is
multifaceted. First, items/sentences need to be carefully selected. Then, the sentences need to be
recorded and placed in a delivery module. Next, the sentences need to be tested with a significant
number of language learners. After that, the sentences need to be scored or rated. Once the
sentences are scored, they are then statistically analyzed to find the best performing items.
Lastly, the best performing items are tested, scored, and analyzed to make sure they are
functioning properly as a group.
Development of the MTC Spanish EI instrument
The development of an EI test starts with selecting items. The items are then tested and
analyzed. The best performing items are used in the final version of the test.
Selection of items. The MTC teaches a specialized language consisting of religious-
related vocabulary found in a teaching context as well as missionary specific tasks (e.g.,
becoming acquainted with someone, asking questions, making invitations, setting appointments).
The MTC Spanish EI test needed sentences that fit the context of the language being assessed.
As indicated in the literature review, research has shown that using authentic naturally-occurring
sentences improves correlations and better distinguishes higher-level speakers because the
sentences are more natural instead of artificially constructed. Other researchers have used
corpus-based item annotation tools to help select items from established texts (Miller, 2011). No
such tools were available in Spanish at the time of this project.
For these reasons, sentences for the MTC Spanish EI were selected from two established
LDS missionary training texts: Preach My Gospel and True to the Faith. The task sentences were
25
selected from speech samples from the Language Speaking Assessment (LSA) of native speakers
performing missionary tasks. Sentence selection was based on sentence length (variety of
sentences of varying lengths) with some attention to vocabulary and grammatical difficulty
(variety of lexical and grammatical difficulty). For example, sentences were grouped by their
sentence length and then researcher made sure that each group of sentences contained examples
of easy (present tense) and difficult grammar (past tense, past subjunctive).
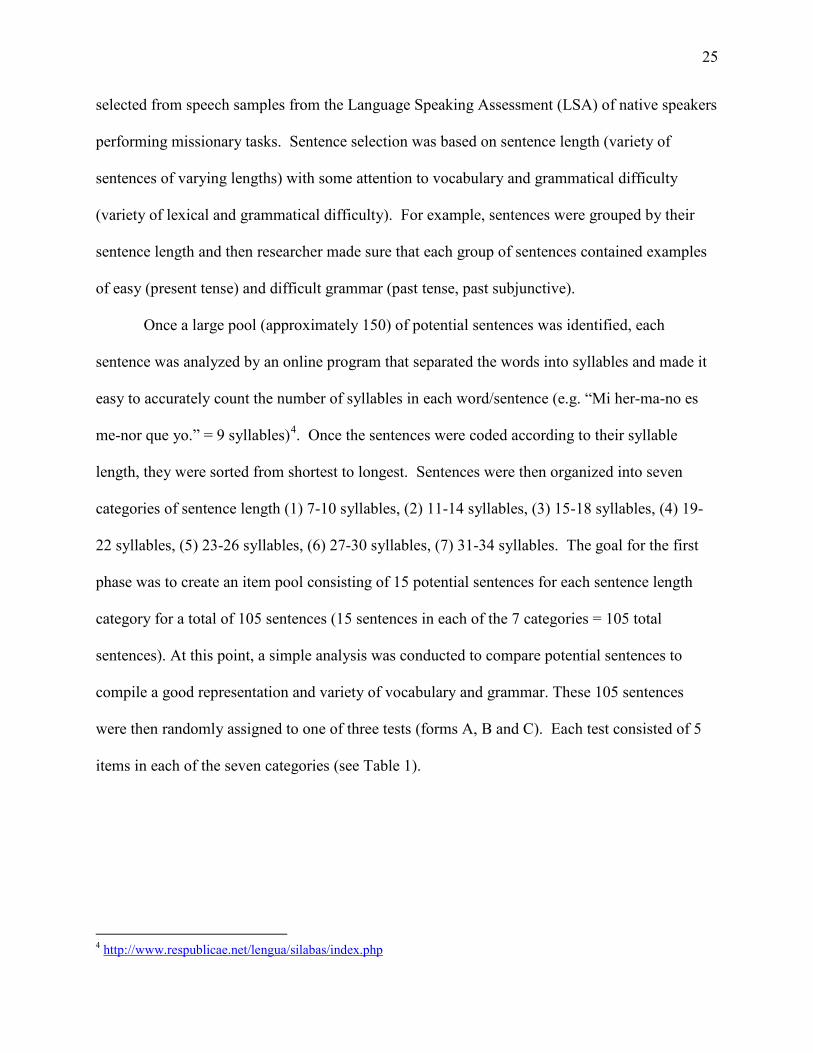
Once a large pool (approximately 150) of potential sentences was identified, each
sentence was analyzed by an online program that separated the words into syllables and made it
easy to accurately count the number of syllables in each word/sentence (e.g. “Mi her-ma-no es
me-nor que yo.” = 9 syllables)4. Once the sentences were coded according to their syllable
length, they were sorted from shortest to longest. Sentences were then organized into seven
categories of sentence length (1) 7-10 syllables, (2) 11-14 syllables, (3) 15-18 syllables, (4) 19-
22 syllables, (5) 23-26 syllables, (6) 27-30 syllables, (7) 31-34 syllables. The goal for the first
phase was to create an item pool consisting of 15 potential sentences for each sentence length
category for a total of 105 sentences (15 sentences in each of the 7 categories = 105 total
sentences). At this point, a simple analysis was conducted to compare potential sentences to
compile a good representation and variety of vocabulary and grammar. These 105 sentences
were then randomly assigned to one of three tests (forms A, B and C). Each test consisted of 5
items in each of the seven categories (see Table 1).
4 http://www.respublicae.net/lengua/silabas/index.php

26
Table 1
Testing design Form A Form B Form C
7-10 syllables 5 items 5 items 5 items 11-14 syllables 5 items 5 items 5 items 15-18 syllables 5 items 5 items 5 items 19-22 syllables 5 items 5 items 5 items 23-26 syllables 5 items 5 items 5 items 27-30 syllables 5 items 5 items 5 items 31-34 syllables 5 items 5 items 5 items
Total: 35 items 35 items 35 items
Selection of an elicitor. Once the 105 potential sentences were identified, they were
audio recorded. Special consideration was taken in selecting the elicitor. Some EI researchers
purport that because male voices are lower, they are easier to hear and understand (T. Cox,
personal communication, May 7, 2012). In addition to this, the elicitor needed to be a native
Spanish-speaker, who could speak “standard” or “neutral” Spanish pronunciation. In order to
test the elicitor’s standard pronunciation, the potential elicitor was asked to record several
Spanish pangrams (i.e., sentences which use every letter of the alphabet at least once). Several
native speakers, from varying countries, listened to the recordings and were asked if they
believed the pronunciation to be standard or neutral. All indicated that the elicitor’s
pronunciation was standard. Additionally, a native Spanish-speaking professor listened to the
recordings and reported that speaker’s accent was acceptable.
The sentences were then recorded using high quality studio equipment by one native,
male, Spanish-speaker using neutral pronunciation. He was instructed to speak methodically and
clearly so that each word could be understood distinctly. He practiced each item several times.
After the sentences were recorded, the audio files were put into the EI test delivery module built
by MTC programmers.

27
In the past, researchers have tested several ways of administering the test, including
giving the test-takers control to advance to the next item when they were ready. The researchers
suggested that the best way was to have the sentences advance automatically with a few second
delay in between each item (R. Graham, personal email communication, August 20, 2012).
Therefore, the delivery module was built to advance the sentences automatically. Additionally,
during the initial testing of the EI delivery, a question arose about how much time to allow the
participant to record their response. At first it was decided to take the amount of time it took the
elicitor to say the sentence and add two seconds. After some testing, the decision was made to
take the elicitor’s time and add four seconds.
Testing Phases
There are two phases to testing the EI instrument. The first phase tested a large pool of
items with a large population. The items were then analyzed to select the best performing items.
The second phase took the best performing items from Phase I and again tested and analyzed
them to make sure that they were performing well as a group.
Phase I. The first phase focused on testing a large pool of 105 items. Previous
researchers used a sample of about 70 participants to test an English EI instrument (Graham,
2006). Therefore, a large sample size is needed to test a large pool of items.
Participants. As described previously, missionaries at the MTC learning Spanish are
assigned to beginning, intermediate or advanced level classrooms. Beginning and intermediate
level missionaries, at the time of this study, were trained at the MTC for nine weeks while
advanced speaking missionaries stayed for three weeks. Class sizes in this study ranged from
three to twelve students with an average size of eight.

28
Since missionaries in the beginning group enter the MTC every week, the subpopulation
of the beginning group consisted of classrooms which had been learning Spanish ranging from
two to nine weeks. The advanced and intermediate subpopulation at the time of testing had four
classrooms each. All of the advanced and intermediate classrooms were used in the sample and
a stratified random sample was used to select classrooms in the beginning subpopulation (see
Table 2). In addition to the 227 missionaries, four native speakers participated for a grand total
of 231 participants.
Table 2
Sample for Phase 1 Week at MTC Number of
Classrooms Total number of
participants
Beginning
2 3
172
3 2 4 3 5 3 6 3 7 3 8 3 9 3
Intermediate
2 1
27 4 1 6 1 8 1
Advanced 1 1
28 2 2 3 1
Native speakers 4 Total 31 231
Testing. To test the items, a researcher went to the classrooms, solicited the participants’
participation and set up an appointment to administer the test in a computer lab. Before the
administration of the test, a researcher explained the purpose of the test and asked the
participants if they were willing to volunteer and then had them sign consent forms.
29
For Phase I, the researcher randomly assigned each participant in a class to take either
test Form A, B, or C. In other words, if a class had nine members, three participants were
randomly assigned Test A, three to Test B, and three to Test C. Each participant was assigned a
different form of the test than the participants on either side of them in order to avoid any
unintended influence from participants sitting next to them.
The initial goal for Phase I was to have 70 participants take each form of the test for a
total of 210 participants. In anticipation of unforeseen problems or losing participants, the
researchers oversampled (231). Some participants did not come to the testing appointments with
their classes (sickness, other commitments) and some computer problems resulted in the loss of
tests. However, the initial goal was met and in the end 70 participants of varying proficiency
took Form A, 70 took Form B, and 81 took Form C. All four native speakers are included in
these totals and each native speaker completed all three forms of the test.
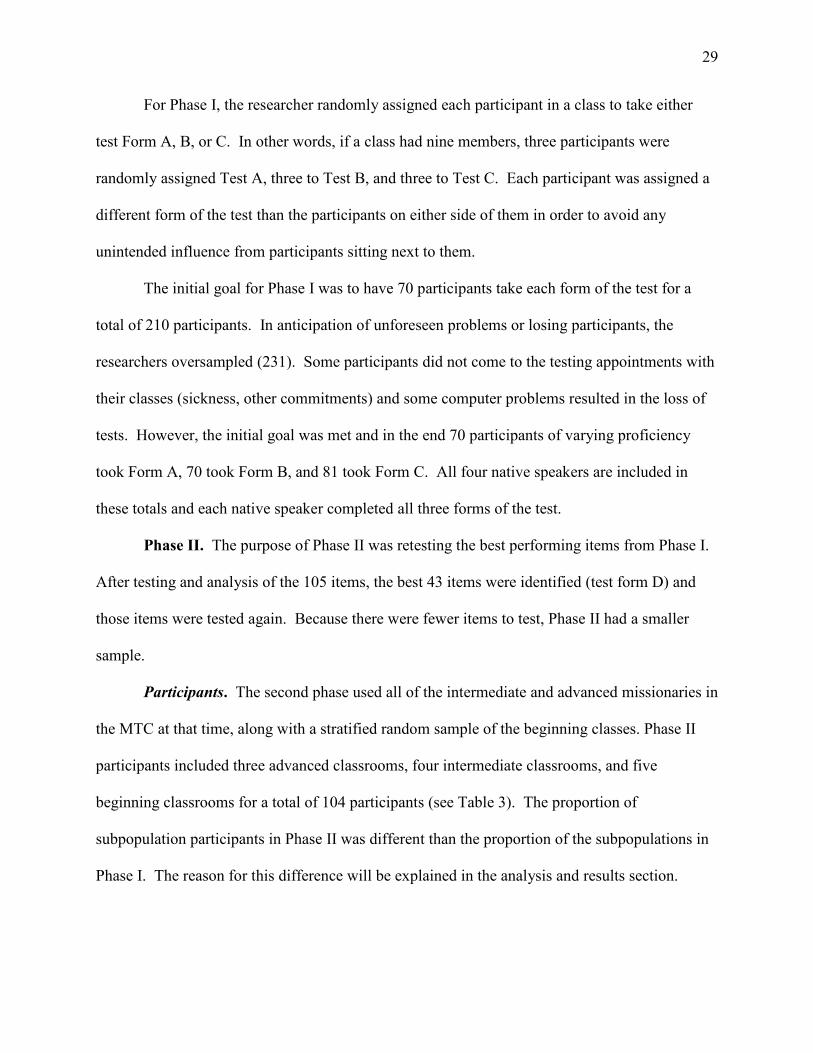
Phase II. The purpose of Phase II was retesting the best performing items from Phase I.
After testing and analysis of the 105 items, the best 43 items were identified (test form D) and
those items were tested again. Because there were fewer items to test, Phase II had a smaller
sample.
Participants. The second phase used all of the intermediate and advanced missionaries in
the MTC at that time, along with a stratified random sample of the beginning classes. Phase II
participants included three advanced classrooms, four intermediate classrooms, and five
beginning classrooms for a total of 104 participants (see Table 3). The proportion of
subpopulation participants in Phase II was different than the proportion of the subpopulations in
Phase I. The reason for this difference will be explained in the analysis and results section.

30
Table 3
Sample for Phase 1I Week at MTC Number of
Classrooms Total number of
participants
Beginning
3 1
47 4 1 5 1 7 1 8 1
Intermediate
3 1
34 4 1 7 1 8 1
Advanced 2 3 23 Total 12 104
Testing. In Phase II, all participants took the MTC Language Speaking Assessment
(LSA) in addition to the elicited imitation test (Form D). In contrast to the Phase I participants,
the Phase II participants were all taking the same test. To avoid participants influencing each
other during the elicited imitation test, every other participant was assigned to start with either
the EI test or the LSA. Therefore, participants sitting next to each other were not taking the same
test at the same time. The initial goal for Phase II was to have 100 participants take Form D of
the test, in the end a total of 95 participants took Form D, which was deemed an adequate
sample.
Test administration. All participants used computers with headsets and microphones.
After an initial login page and a simple exercise to make sure the headsets and microphones were
working properly, the following instructions were presented on the computer screen: For this
test, you will hear a sentence in Spanish followed by a beep. After you hear the beep, repeat the
sentence back as accurately as you can. After you repeat back the sentence there will be a few
seconds pause and the next sentence will start automatically. Click “Begin Test” when you are
ready to start.

31
It took about seven minutes for Phase I participants to complete a test with 35 items. As
mentioned above, Phase II participants took two oral language proficiency assessments, the EI
test and the LSA. Both tests took about 10-15 minutes each to complete.
Scoring EI Tests For Both Phases
Elicited imitation tests were scored using two methods: (a) hand rating by a trained rater
and (b) automatic speech recognition software (ASR). Hand rating was done in this study first
because it is considered the most reliable until the ASR is developed and correlates highly with
the hand scores.
Hand rating. For hand scoring, each item was displayed in a web-based rating interface
developed and built by MTC programmers. The rater interface displayed the target sentence, a
score feature, the audio file and the sentence broken down by syllables (see figure1). The human
rater played the recorded audio file and clicked on (or highlighted) any syllables that the
participant repeated accurately. Participants received either a 1 or 0 score for each syllable in
each item. Each item received a sentence accuracy rating which was the proportion of the
syllables repeated correctly in a sentence (between 0.00 and 1.00). As syllables were marked
correctly, the score was automatically calculated. The “proportion correct scores” for all the
items was averaged together for one overall score (between 0.00 and 1.00) for each participant.

32
Figure 1. Example of rating tool interface.
Hand rating was labor intensive. For this project, 11,820 items were rated. To help with
the task, in addition to the primary researcher, six Spanish speakers were trained how to rate.
After helping the raters become acquainted with the rating tool, they were instructed on the
following rating guidelines.
1. If the test-taker inserts a word, it is not counted against them.
2. If the test-taker transposes two words, give points for one word but not both.
3. If the pronunciation is so far off that the syllable would not be recognized, do not give
credit.
4. If an utterance is cut off, the raters can only give credit for what is heard.
Next, all seven raters rated two tests, and their item ratings were compared. Simple correlation
analysis results showed very high correlations between the seven raters r = 0.98 to 0.99.

33
ASR scoring. The ASR technology was based on the language model used at BYU.
This model utilized the Sphinx ASR engine (Lee, 1989). Sphinx used an acoustic model, a
language model, and a pronunciation dictionary. An existing language model for Spanish was
downloaded from http://www.voxforge.org/home (C. Kennington, personal email
communication, August, 29, 2012). The ASR generated overall proficiency scores for each
subject in the form of proportion correct (0.00-1.00).
Preparing the data for analysis. In Phase I of this project there were three tests (A, B,
and C). All three tests measured the same construct and had the same rating system. The
researcher in this project wanted to assess whether or not response categories in EI tests had the
same number of response options and whether or not the response categories functioned
differently. Therefore, this project used the IRT Partial Credit Model. The IRT model was robust
enough to analyze all three tests at the same time together. Therefore, even though the
participants did not all take the same test (except for the native speakers who took all three tests),
all three tests were analyzed together and all items (105) were measured and compared together.
It was possible to analyze the three tests together because the native speakers took all three tests.
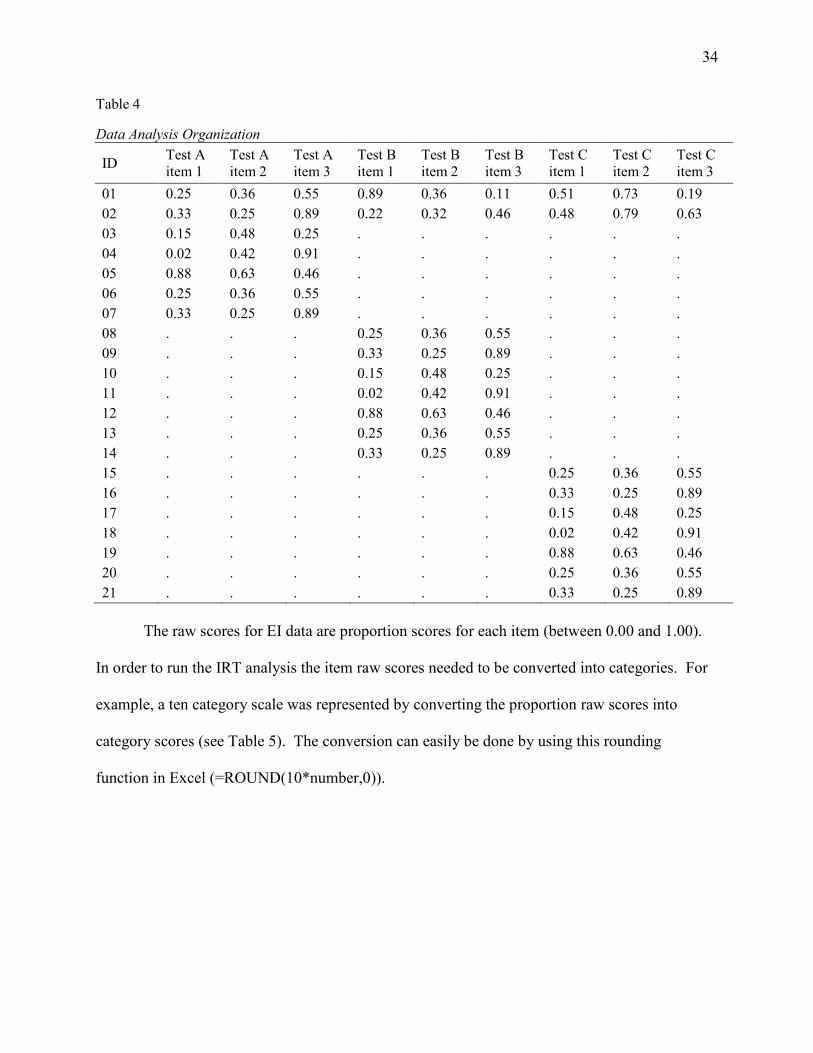
For analysis, the data, needed to be organized into a rectangular matrix with one row for each
person and one column for an ID number and a column for each item. Missing values were put
in the cells where data was lacking. For example if participant 102 completed form A she had
scores for those 35 items. In the cells for the tests that she didn’t complete, a “period” was
inserted to indicate a missing value. The following table illustrates (with arbitrary data) how the
data were organized (see Table 4). Phase II data had a straightforward organization because it
was one test and all participants completed all of the items.
34
Table 4
Data Analysis Organization
ID Test A item 1
Test A item 2
Test A item 3
Test B item 1
Test B item 2
Test B item 3
Test C item 1
Test C item 2
Test C item 3
01 0.25 0.36 0.55 0.89 0.36 0.11 0.51 0.73 0.19 02 0.33 0.25 0.89 0.22 0.32 0.46 0.48 0.79 0.63 03 0.15 0.48 0.25 . . . . . . 04 0.02 0.42 0.91 . . . . . . 05 0.88 0.63 0.46 . . . . . . 06 0.25 0.36 0.55 . . . . . . 07 0.33 0.25 0.89 . . . . . . 08 . . . 0.25 0.36 0.55 . . . 09 . . . 0.33 0.25 0.89 . . . 10 . . . 0.15 0.48 0.25 . . . 11 . . . 0.02 0.42 0.91 . . . 12 . . . 0.88 0.63 0.46 . . . 13 . . . 0.25 0.36 0.55 . . . 14 . . . 0.33 0.25 0.89 . . . 15 . . . . . . 0.25 0.36 0.55 16 . . . . . . 0.33 0.25 0.89 17 . . . . . . 0.15 0.48 0.25 18 . . . . . . 0.02 0.42 0.91 19 . . . . . . 0.88 0.63 0.46 20 . . . . . . 0.25 0.36 0.55 21 . . . . . . 0.33 0.25 0.89
The raw scores for EI data are proportion scores for each item (between 0.00 and 1.00).
In order to run the IRT analysis the item raw scores needed to be converted into categories. For
example, a ten category scale was represented by converting the proportion raw scores into
category scores (see Table 5). The conversion can easily be done by using this rounding
function in Excel (=ROUND(10*number,0)).

35
Table 5
Raw Score Conversion Chart
Raw score Category 0-.05 0
.06-.14 1
.15-.24 2
.25-.34 3
.35-.44 4
.45-.54 5
.55-.64 6
.65-.74 7
.75-.84 8
.85-.94 9 .95-1 10
The data was converted and saved as a “Formatted Text (Space Delimited)(*.prn)” file
and read into Winsteps and Facets Rasch Software 5. For the analysis procedures, the partial
credit model was implemented with additional commands for point biserial correlations (ptbis=y)
and discrimination (discrim=y) parameters.
5 http://www.winsteps.com/index.htm

36
Chapter 4: Analysis Results
IRT produces several types of statistics. These statistics should be used in combination
with each other in any attempt to make decisions about the item categories and items to keep or
omit. These statistics include the category probability curve, the average measures (difficulty),
the category fit statistics, estimated discrimination statistic and overall test reliability.
Category Probability Curves
The first analysis was to assess how the 10 item categories functioned by looking at the
category probability curves. When the PCM is used, a separate graph is produced for each item.
The graph should include one curve for each response option (category) in the corresponding
item(s) (e.g. the raw scores were converted into 10 categories). These curves show the
probability of selecting each response category for persons located at various points along the
latent trait continuum. Ideally, the curves should be shaped like a series of hills with valleys in
between them. Except for the lowest and highest categories, the hills should be approximately
uniform in height. A flat curve indicates that very few persons were in the category represented
by that curve. The presence of flat curves generally produces disordering and indicates that two
or more adjacent categories may need to be combined into one category (Sudweeks, 2011).
Using the PC model, the category probability curves using ten categories showed that
some of the categories were not used in many of the items and that the categories functioned
differently with each item. This indicates that the categories should be collapsed. Ultimately,
after several test iterations, the ten categories were collapsed into six categories (0-.24 = 1; .25-
.44 = 2; .45-.64 = 3; .65-.84 = 4; .85-.95 = 5; .95-1 = 6). Collapsing categories can be done with
extra commands in Winsteps or through find and replace commands in excel. Figure 2 shows
the Category Probability Curve for Test B, Item 14 with six categories.

37
Figure 2. Category Probability Curve
Average Measures
The average measure score is the number reported for each category that describes the
average of the estimated ability measures for all persons in the sample who achieved that
category (averaged across all items). The average measure score is also considered the IRT
difficulty index (Sudweeks, 2011). For example, if an item has a measure score of 3.75, that
means that the estimated average ability measure for all persons in the sample who achieved that
category was 3.75. As mentioned before, these scales ranges between +4 and – 4, therefore this
would be a difficult item. For this project, the tests (Phase I and Phase II) had a good range of
average measure statistics (+3.06 to -3.17).
Category Fit Statistics
Fit statistics are squared standardized residuals between what is observed and what would
be expected. It is meant to indicate unexplained variation or “noise” with each item. Each item
should have an ideal outfit mean square between 0.5 and 1.5. Outfit mean squares greater than

38
the ideal indicates that the item has unexplained variation or noise (Sudweeks, 2011). The outfit
mean square statistics for test forms A, B, and C, identified several items that had poor fit. These
items were omitted. As might be expected, test form D did not contain any items with poor fit
statistics, because poor items from test forms A, B and C had been eliminated.
Estimated Discrimination
This statistic shows the estimate of the discriminating parameter for each item. The
estimated discrimination ideally is as close to 1 as possible. Results for Phase I identified some
items that had poor discrimination and those items were omitted. Again, as might be expected,
analysis for Phase II showed no items with poor discrimination.
Overall Test Reliability
Winsteps produces two test reliability measures: person reliability measures and item
reliability measures. The person reliability statistic produces a decimal number between 0 and
1.0 which is interpreted as the proportion of variability in the person measure that is explained by
variability in the persons’ true abilities. This reliability index is analogous to Cronbach’s alpha
computed for nonlinear, raw scores. However, the value of this IRT statistic is almost always
somewhat lower (more conservative) than the value of Cronbach’s alpha (Sudweeks, 2011). The
person reliability measures for the MTC Spanish IE tests are very good at 0.98 for both Phase I
and Phase II analysis (see figure 3 for Phase I).
Winsteps uses the variance ratio definition of reliability to compute an item reliability
estimate (see figure 3). This estimates whether or not there is adequate range of item difficulty.
CTT has no analog for this reliability estimate coefficient. High item reliability measures
indicate that there is a high probability that items estimated with high measures actually do have
higher measures than items estimated with low measures. The item reliability estimates for this

39
project are very good at 0.99 and 0.98 for Phases I and II respectively. Phase I is slightly higher
because more items were tested (105 vs. 43).
Figure 3. Phase I Person and Item Reliability Chart
Item Omission Decision Process
The goal of Phase I analysis was to reduce the 105 items to the best 43 items. The IRT
statistics should be used in combination with each other when making decisions about which
items to keep or omit. Figure 4 shows the measure statistics (difficulty), category fit statistics,
and the estimated item discrimination parameter. The measure statistics (MEASURE) shows
items from hardest to easiest and is found in the fourth column. The category fit statistics
(OUTFIT MNSQ) is the eighth column and the estimated item discrimination parameter (ESTIM
DISCR) is the fourteenth column.

40
Figure 4. Winsteps Table 13.1 Output
The first step was to divide the 105 items into seven groups according to their difficulty
level (15 items). For example, the 15 easiest items ranged from -3.17 to -2.18. Then, analyzing
the 15 items in each difficulty group, the items that had poor fit statistics (below 0.5 and above
1.5) were omitted. The next step was to cut out the items that had poor discrimination (below
0.75 and above 1.25). For example, the second easiest item had an OUTFIT MNSQ of 9.90 and
an ESTIM DISCR of .61. This item was omitted because the outfit statistic is significantly
higher than the ideal (0.5-1.5) and the estimated discrimination was distant to the ideal 1.
Appendix A contains the complete Winsteps statistical output table with all 105 items showing
how the items were grouped. The process was repeated with each group of items until the best
six or seven items were found in each of the seven difficulty groups (total of 43 items). Most of
the items in the Spanish EI test were within the ideal parameters, so the researcher narrowed the
parameters even further (Outfit = 0.75-1.25; Discrimination = 0.85-1.15) .
Phase II used the best performing items from Phase I. These 43 items were tested again
with 95 participants and the analysis was run again. Phase I analysis showed little variability in
ability measures for participants assigned to the beginning level classes, even in cases where they

41
had been at the MTC for longer periods of time (eight or nine weeks). Therefore, the sampling
procedure for Phase II used a ratio where half of the participants were from beginning level
courses (weeks 3-9) and the other half were from intermediate or advanced level classrooms.
The purpose of the Phase II IRT analysis of the 43 items was to make sure the items were
functioning well together and they were performing well. The second analysis showed a good
range of difficult and easy items and there were no items with poor fit or poor discrimination
(See Appendix B for final version of the test). Ultimately the MTC Spanish EI test is a dynamic
test with about 43 items (roughly seven items in seven difficulty categories). The computer
randomly selects two to three items from each group for a total of 14-16 items. It takes about
three minutes for participants to take the test.
ASR/Hand ratings Comparison
Developing a Spanish ASR engine is an iterative process that involves comparing had
rating scores to ASR scores. An MTC developer found an open source acoustic model, a
language model, and a pronunciation dictionary. The acoustic model is created by taking
phoneme-aligned audio recordings and using software to create statistical representation of the
sounds that make up each word. The language model tries to capture the syntactic properties of a
language and predict the next word in a speech sequence (C. Kennington, personal email
communication, January 19, 2013). The pronunciation dictionary
The MTC developer found two existing Spanish acoustic models produced by Voxforge 6
and another one produced by DFKI 7. For the first test iteration MTC programmers used the
Voxforge model. The ASR/hand rating correlation was very poor r = -0.31. The pronunciation
dictionary and language model appeared to be correct as far as the programmer could see, so he
6 http://www.voxforge.org/ 7 http://www.dfki.de/lt/

42
next tried the other acoustic model (DFKI). Correlations improved with the DFKI model, but
were still poor r = 0.13.
The programmer felt that the next obvious step was to create a new unique acoustic
model (MTC acoustic model). To do this he used the native speaker speech sample of the
elicitor and then added “good” but non-native acoustic information (participants) into the model
so it is less strict and allows less-than-perfect pronunciations. After testing, the programmer
noticed that female participants were getting low ASR scores because the acoustic model was
based on a male elicitor input. He identified the five highest ability female speakers and
combined their samples with the male elicitor.
The MTC acoustic model worked significantly better than the open source models. At
this point, the correlation between the MTC ASR and the hand rating scores was r = 0.80. The
programmer felt that there are a few parameters he can still modify and hopefully the MTC ASR
will be “working” well enough soon so that the ASR score will replace need for hand ratings.
Other EI researchers have been able to achieve correlations above .90; this is the goal for the
MTC Spanish EI. Because of the lack of Spanish resources and limited data availability, the
programmer was able to assemble a respectable ASR is a short amount of time (C. Kennington,
personal email communication January, 21 2013).
ASR scores are affected by participant’s pronunciation. Native speakers can have the
tendency to speak quickly or slur across words. In these instances the ASR will give lower
scores than hand ratings. Special measures will need to be taken to catch potential low scores
with native and native-like speakers.

43
Item Difficulty Analysis
Once the best 43 items were identified, they were coded according to their grammatical
difficulty. Grammatical difficulty was based on the ILR Handbook of Oral Interview Testing for
Spanish (Lowe, 1982). The ILR Handbook identifies eight difficulty levels of Spanish grammar
(0, 1, 1+, 2, 2+, 3, 3+ and 4). For example Level 1 = regular verbs (-ar, -er, -ir), radical changing
verbs (tener, poder, querer, costar), reflexives (llamarse), irregulars (poner, ir, haber, saber,
hacer, ser, estar). Also, for level 1 ratings the speaker should have a clear concept of agreement
(gender, number, subject-verb); articles (definites: el, la, los, las; indefinites: un, una, unos,
unas); contractions (al, del); adjectives (possessives 1st person: mi, mis, 2nd person: su, sus); most
common qualifiers; adjectives and adverbs of quality (mucho, poco, bastante, demasiado); and
idomaitc expressions of weather (hacer).
Some sentences had features that fell into several of the difficulty levels. For example,
the sentence El Libro de Mormón nos enseña la verdad has level 1 grammar (enseña = present
tense –ar verb) with a level 1+ (1.5) indirect pronoun (nos). In instances where the sentences
contained features of more than one level, the rating fell in between the two categories (1.25).
After coding each sentence, hierarchical regression analysis using three blocks was used
to regress the IRT difficulty score on length of each sentence as measured by the number of
syllables and the grammatical features of each sentence. The regression tested for the main effect
of length (block 1), the main effect of grammar (block 2) and the interaction of length and
grammar (block 3) on IRT difficulty. Block 1 resulted in an R2 of .813 which was significant
(F1, 41 = 178.75 p< .05). Adding block 2 and 3 did not significantly increase R2. The final model
3 showed that only sentence length in the presence of grammatical difficulty and the interaction
of sentence length and grammatical difficulty was significant. The results showed that sentence

44
length significantly predicted item difficulty (b model 3= .074, t= 4.66, p < .001). Grammatical
difficulty did not predict item difficulty (b model 3 = .140, t = .655, p = .516). Similarly, the
interaction between grammar difficulty and sentence length did not predict item difficulty (b
model 3= .000, t = -.060, p = .953).
These results seem quite conclusive; however there is still some question about what
contributes to item difficulty. The raters noticed patterns while they were rating the items. They
noticed that although grammar might not have influenced scores greatly, vocabulary undoubtedly
did. If participants missed the conjugation of a verb, they would lose one or two points for the
missed syllables. Conversely, if participants did not know the verb at all, they lost several
syllable points. After a time raters could easily identify which words were contributing to the
difficulty of the sentence. Therefore, the regression results may be spurious without the
inclusion of lexical analysis.

45
Chapter 5: Summary and Conclusions
The goal of this project was to develop a valid, automated oral language proficiency
measure for the Missionary Training Center. The measure needed to easy to administer and
score. The MTC Spanish elicited imitation test fulfills this goal.
Summary
This research project had four research questions:
1. What does an MTC Spanish Elicited Imitation test consist of?
2. What is the process for creating an elicited imitation test?
3. What is the correlation between automatic speech recognition (ASR) scoring with hand
scoring?
4. What makes an item difficult? What is the main effect of grammar? What is the main
effect of sentence length? Is there an interaction between grammar and sentence length?
Nature of the MTC EI test. The MTC Spanish elicited imitation test of oral language
proficiency is a practical, reliable measure of overall language proficiency. The MTC Spanish
EI test is a combination of gospel teaching context sentences and missionary task sentences. The
Spanish EI test will be used at the MTC for pre-MTC screening purpose (class placement), exit
language proficiency measures, and pre/post test language gains analysis.
Process of developing an EI test. The process for developing an EI test includes six
major steps. First, items/sentences need to be carefully selected. Second, the sentences need to
be recorded and placed in a delivery module. Third, the sentences need to be tested with a
significant number of language learners. Fourth, the sentences need to be scored or rated. Once
the sentences are scored, they are then statistically analyzed, using IRT, to find the best

46
performing items. Lastly, the best performing items are tested, scored, and analyzed to make
sure they are functioning properly as a group.
Correlation between ASR and hand scoring. In the end, the open source acoustic
models did not function well with the MTC Spanish EI test. An MTC developer made great
headway in a short period of time in creating a unique MTC acoustic model. Work continues on
improving the reliability of the MTC ASR engine. As of right now the ASR/hand score
correlation is r = 0.80.
Nature of item difficulty. This project attempted to predict the linguistic features
(grammar difficulty, number of syllables) that contributed to item difficulty. After coding each
sentence, hierarchical regression analysis using three blocks was used to regress the IRT
difficulty score on length of each sentence as measured by the number of syllables and the
grammatical features of each sentence. The regression tested for the main effect of length (block
1), the main effect of grammar (block 2) and the interaction of length and grammar (block 3) on
IRT difficulty. Block 1 resulted in an R2 of .813 which was significant (F1, 41 = 178.75 p< .05).
Adding block 2 and 3 did not significantly increase R2. The final model 3 showed that only
sentence length in the presence of grammatical difficulty and the interaction of sentence length
and grammatical difficulty was significant. The results showed that sentence length significantly
predicted item difficulty (b model 3= .074, t= 4.66, p < .001). Grammatical difficulty did not
predict item difficulty (b model 3 = .140, t = .655, p = .516). Similarly, the interaction between
grammar difficulty and sentence length did not predict item difficulty (b model 3= .000, t = -
.060, p = .953).
Discussion and Implications. The Missionary Training Center has approximately 1000
missionaries at any given time, assigned to Spanish language classrooms. With recent age

47
reduction announcements that number is expected to rise significantly. It is essential that the
MTC has a valid and reliable way to measure missionaries’ oral language proficiency for several
reasons: (1) pre-MTC classroom level placement, (2) pre/post assessment measures for gains
scores, (3) exit measures for institutional preparedness indicators, and (4) in-field assessment for
longitudinal studies. Current MTC Spanish language assessments are time consuming and
costly. The MTC Spanish elicited imitation test is a response to the MTC oral language
proficiency assessment needs. Furthermore, the EI instrument design process outlined in this
project be the blueprint for the development of future MTC EI tests in other languages. Some of
the situations where the MTC could use the Spanish EI might be considered high stakes. The
MTC needs to take test security into consideration for the implications for high stake situations.
The MTC Spanish EI takes approximately three minutes to complete at zero personnel
cost to the MTC (once the ASR has been sufficiently calibrated) except for maintaining delivery
and scoring modules. This is a significant improvement considering the MTC LSA that takes 15
minutes to administer and between 5-10 minutes to rate, coupled with the cost of training and
paying raters. Not only has this project produced a valuable assessment tool for the MTC, this
report will act as a blueprint for the development of future EI tests in other languages. In the
next Phase of development, MTC administrators and researchers are planning on using this
project as a template for creating EI tests in Portuguese, Russian and Japanese.
Broader implications beyond the MTC involve the academic conclusions that EI tests can
be used to measure global language proficiency and that unique tests can be developed and
validated for specific situations and corpora. Additionally, there are psycholinguist implications
about how to measure Spanish grammar and lexical difficulty and how those levels of difficulty
contribute to overall item difficulty.

48
There is still some question about what makes a Spanish EI item difficult. The statistical
analysis showed that sentence length unquestionably predicts and contributes to item difficulty.
Grammar difficulty and the interaction between grammar and sentence length were shown not to
predict or contribute to item difficulty. Still, there are still significant questions on how lexical
difficulty influences overall item difficulty. There is important evidence from raters about the
patterns of breakdown involving the lexicon. For example, because one of the shortest sentences
“Todo lo bueno proviene de Dios” has an uncommon verb “proviene,” and most participants
(except the most advanced) missed this verb. Even though this sentence only has 10 syllables
(which would put it in the easiest category), it is number 11 out of 43 in difficulty. Another
example is Item 14 “El Espíritu Santo nos testificará que Jesucristo es nuestro Salvador y
Redentor”. This item has 28 syllables, future tense and an indirect object pronoun (more
difficult grammar), yet is easy. Many low ability participants received high scores on this item
because of the common missionary vocabulary. The implication is that lexical difficulty is
assumed to contribute to sentence difficulty and that the specialized missionary corpus
vocabulary needs to be analyzed further. Also, researchers need to use more accurate ways to
measure grammar difficulty before analysis can be done to determine the effect of grammar
difficulty on item difficulty.
Limitations
There were several limitations with this research project. The first has to do with the
participants. IRT experts assert that at least 200 participants are needed to conduct IRT analysis.
This study used less than 100 participants for each form of the test. However, we know from the
analysis that calibration occurred. If there had not been enough information to run the analysis
the program would have stopped and reported an error.

49
Also, there were some problems with participants not trying or not taking the test
seriously. After noticing this problem, the test administrators emphasized the importance of the
test and how it would be used in the future. Attitudes improved after that, but some scores were
affected by this issue. Additionally, some data were lost because of issues with technology and
equipment furthermore some participants who were assigned to participate were unable to
because of illness.
Another issue is with the scoring. The ASR engine is newly built and has not been
calibrated. Calibration entails adjusting the software to produce scores that are close to the hand
ratings. Calibration takes time and testing; therefore, it could not be accomplished in the
timeframe of this project but, it will in the future. Additionally, the hand scores were not double
rated. Previous EI research has shown that double rating correlations are very high. Therefore,
it was not deemed necessary to conduct double ratings.
Additionally, the ILR Handbook of Oral Interview Testing for Spanish (Lowe, 1982)
used in this study to assess grammar, is assumed to be a subjective estimation of grammar
difficulty and might not accurately assess Spanish grammar difficulty (B. Bateman, personal
communication, February 8, 2013). Better methods of grammar difficulty assessments need to
be done before assumptions can be made about how grammar affects the difficulty of an item.
Recommendations for Future Research
There are three areas for future possible research (a) MTC, (b) linguistically, and (c)
statistically.
MTC research. Future research at the MTC would include determining placement cut
scores for intermediate and advanced level classrooms. Additionally, the MTC could validate
the Spanish EI test with the Language Speaking Assessment (LSA). Because all participants in

50
Phase II took the LSA at the same time they took the Spanish EI test, the LSAs just need to be
rated and the scores compared to the overall EI scores.
Linguistic research. As mentioned in the results and discussion sections pertaining to
item difficulty, it is hypothesized that lexical difficulty will contribute to the variance of item
difficulty. There is a Spanish Vocabulary Online Profiler which could help with this analysis8.
This profiler identifies words that are (1) found in the most common one thousand words in
Spanish, (2) the second thousand most common words, (3) the words found in the Spanish
academic word list, and (4) those not found in the previous three. Individual words could be
coded according to their difficulty (how common they are). Those codes could then be used to
predict lexical difficulty on item difficultly. However, special consideration needs to be taken
with regards to common missionary vocabulary. The Spanish VOP codes the word profeta as an
academic word, arguably less common or more difficult however for missionaries this is a
common, easy word.
Another linguistic feature study could analyze the syllable/word information. The MTC
delivery module was programmed to record information about which syllables or words were
rated correctly and incorrectly. This type of analysis would be able to identify, unquestionably,
what linguistic features make a specific item difficult or what contributes to the difficulty of the
entire test.
Statistical research. Because IRT is not person dependent it is simple and easy to cross
validate different versions of a test that measures the same construct. For example, it would be
interesting to cross validate test versions A, B, C and D or with outside measures such as the
LSA or Oral Proficiency Interview.
8 http://souffil.com/svop/index.php

51
In the end, it has been shown that elicited imitation tests are a valid and reliable measure
of global language proficiency. EI tests can be developed for specific contexts and unique
organizations. The process of developing and EI test involves identify a large pool of items,
testing the items, analyzing the items and selecting the best performing items.

52
References
Bateman, B. (1995). The development and validation of the missionary language performance
tests. (unpublished master’s thesis), Brigham Young University, Provo, UT.
Bernstein, J., Van Moere, A. & Cheng, J. (2010). Validating automated speaking tests. Language
Testing, 27(3), 355–377.
Bley-Vroman, R. & Chaudron, C. (1994). Elicited imitation as a measure of second-language
competence. In E.E. Tarone, S. Gass & A.D. Cohen (Eds.), Research methodology in
second-language acquisition (pp.245-261). Hillsdale: Lawrence Erlbaum.
Breiner-Sanders, K. E., Lowe Jr., P., & Swender, E. (2000). ACTFL proficiency guidelines—
speaking (revised). Foreign Language Annals, 33, 13–18.
Buck, K., Byrnes, H., & Thompson, I. (1989). The ACTFL oral proficiency interview tester
training manual. Yonkers, NY: ACTFL.
Chaudron, C., Prior, M. & Kozok, U. (2005). Elicited imitation as an oral proficiency measure.
Paper presented at the 14 World Congress of Applied Linguistics, Madison Wisconsin.
Christensen, C., Hendrickson, R. & Lonsdale, D. (2010). Principled Construction of Elicited
Imitation Tests. Proceedings of the Seventh Conference on International Language
Resources and Evaluation (LREC’10), 233-238. European Language Resources
Association.
Cowan, N. (2005). Short-term memory, working memory, and their importance in language
processing. Topics in Language Disorders, 17, 1-18.
De Ayala, R. J. (2009). The theory and practice of item response theory. New York, NY: The
Guilford Press.

53
Erlam, R. (2006). Elicited imitation as a measure of L2 implicit knowledge: An empirical
validation study. Applied Linguistics, 27 (3), 464-491.
Gallimore, R., & Tharp, R. G. (1981). The interpretation of elicited sentence imitation in a
standardized context. Language Learning, 31(2), 369-392.
Graham, C. R. (2006). An analysis of elicited imitation as a technique for measuring oral
language proficiency. Selected Papers from the Fifteenth International Symposium on
English Teaching, 57–67. Taipei, Taiwan: English Teachers Association.
Graham, C. R., Lonsdale, D., Kennington, C., Johnson, A., & McGhee, J. (2008a). Elicited
imitation as an oral proficiency measure with ASR scoring. Proceedings of the Sixth
International Conference on Language Resources and Evaluation (LREC ’08), 57–67,
European Language Resources Association.
Graham, C. R, McGhee, J., & Millard, B. (2008b). The role of lexical choice in elicited imitation
item difficulty. Proceedings of Second Language Research Forum (SLRF), 57–67.
Graham, C. R., Cox, T., McGhee, J., & LeGare, M. (forthcoming). Examining the validity of an
elicited imitation instrument to test oral language in Spanish. Paper presented to the
Language Testing Research Colloquium (LTRC), University of Michigan, forthcoming.
Hendrickson, R., Eckerson, M., Johnson, A., & McGhee, J., (2009). What makes an item
difficult? A syntactic, lexical, and morphological study of Elicited Imitation test items,
Proceedings of Second Language Research Forum 2008 (SLRF), 48-56.
Henning, G. (1983). Oral proficiency testing: Comparative validities of interview, imitation, and
completion methods. Language Learning, 33 (3), 315-332.
54
Hood, L., & Lightbrown. P, (1978). What children do when asked to “say what I say”: Does
elicited imitation measure linguistic knowledge? Reprints from Allied Health and
Behavioral Sciences 1, 195.
Keller-Cohen, D. (1981). Elicited imitation in lexical development: Evidence from a study of
temporal reference. Journal of Psycholinguist Research, 10(3), 273-288.
Lee, K., (1989). Automatic speech recognition: The development of the SPHINX system. Boston,
MA: Kluwer Academic Publishers.
Lowe, P. (1982). ILR Handbook on Oral Interview Testing. pp 9-28.
Malone, M., (2007). Oral proficiency assessment: The use of technology in test development and
rater training. In CALdigest.
Matsushita, H. (2011). Computerized oral proficiency test for Japanese: Measuring L2 speaking
ability with ASR Technology. (unpublished master’s thesis), Brigham Young University,
Provo, UT.
Miller, G. A. (1956). The magical number seven, plus or minus two: Some limits on our
capacity for processing information. Psychological Review (63), 343-355.
Millard, B. (2011). Oral proficiency assessment of French using an elicited imitation test and
automatic speech recognition. (unpublished master’s thesis), Brigham Young University,
Provo, UT.
Moulton, S. (2012). Elicited imitation testing as a measure of oral language proficiency at the
Missionary Training Center. (unpublished master’s thesis), Brigham Young University,
Provo, UT.
Naiman, N. (1974). The use of elicited imitation in second language acquisition research.
Working Papers on Bilingualism, 2, 1-37.

55
Okura, E. & Lonsdale D. (2012). Working memory’s meager involvement in sentence repetition
tests. In N. Miyake, D. Peebles, & R.P. Cooper (Eds.), Proceedings of the 34th Annual
Conference of the Cognitive Science Society, 2132-2137. Austin, TX: Cognitive Science
Society.
Ortega, L. (2000). Understanding syntactic complexity: The measurement of change in the
syntax of instructed L2 Spanish learners. (unpublished doctoral dissertation), University
of Hawaii.
Pearson (2009a). Official guide to Pearson Test of English Academic. London: Longman.
Pearson (2009b). Versant Spanish Test: Test description and validation summary. Pearson
knowledge Technologies, Palo Alto, California. Available online at
www.ordinate.com/technology/VersantSpanishTestValidation.
Radloff, C. (1991). Sentence repetition testing: For studies of community bilingualism. Summer
Institute of Linguistics and the University of Texas at Arlington Publications in
Linguistics, 110. Dallas: Summer Institute of Linguistics and the University of Texas at
Arlington.
Tomita, Y., Suzuki, W. & Jessop, L. (2009). Elicited imitation: Toward valid procedures to
measure implicit second language grammatical knowledge. TESOL Quarterly, 43(2),
345-350.
Stansfield, C.W., & Kenyon, D.M. (1992). Research on the comparability of the oral proficiency
interview and the simulated oral proficiency interview. System, 20(3), 347–364.
Sudweeks, R. R. (2011). IP&T 754, Item Response Theory. Course packet. Provo, Utah
Vinther, T. (2002). Elicited Imitation: a brief overview. International Journal of Applied
Linguistics, 12, 1, 54-73.

56
Weitze, M., McGhee, J., Graham, C. R., Dewey D., & Eggett. D., (2011). Variability in L2
acquisition across L1 backgrounds. Selected Proceedings of the 2009 Second Language
Research Forum, ed. L. Plonsky & M. Schierloh, (Eds.) 152-163. Somerville, MA:
Cascadilla Proceedings Project.
Zechner, K., Higgins, D. Xi, X. & Williamson, D. (2009). Automatic scoring of non-native
spontaneous speech in tests of spoken English. Speech Communication, 51, 883–895.

57
Appendix A: Winsteps Output Phase I
TABLE 13.1 All items all participants 6 cat PC ZOU318WS.TXT Dec 19 16:08 2012 INPUT: 214 Person 105 Item REPORTED: 214 Person 105 Item 619 CATS WINSTEPS 3.71.0.1 --------------------------------------------------------------------------------------- Person: REAL SEP.: 6.76 REL.: .98 ... Item: REAL SEP.: 9.55 REL.: .99 Item STATISTICS: MEASURE ORDER ---------------------------------------------------------------------------------------------------- |ENTRY TOTAL TOTAL MODEL| INFIT | OUTFIT |PTBISERL-EX|EXACT MATCH|ESTIM| | |NUMBER SCORE COUNT MEASURE S.E. |MNSQ ZSTD|MNSQ ZSTD|CORR. EXP.| OBS% EXP%|DISCR| Item G | |------------------------------------+----------+----------+-----------+-----------+-----+---------| | 104 143 81 3.06 .20| .91 -.5| .89 -.7| .54 .63| 66.7 63.7| 1.12| C34 0 | | 102 147 81 2.87 .19|1.16 .9| .99 .0| .69 .63| 58.0 61.6| .91| C32 0 | | 103 147 81 2.78 .19| .95 -.2| .89 -.5| .64 .65| 64.2 63.5| 1.06| C33 0 | | 34 121 68 2.46 .21| .65 -2.1| .64 -2.1| .82 .75| 72.1 61.8| 1.35| A34 0 | | 99 161 81 2.41 .18|1.11 .7|1.09 .6| .57 .65| 51.9 58.8| .92| C29 0 | | 62 124 70 2.37 .19|1.19 1.1|1.16 .8| .69 .73| 51.4 59.3| .75| B27 0 | | 98 152 81 2.12 .18|1.10 .6| .93 -.2| .69 .69| 61.7 67.0| .97| C28 0 | | 94 165 81 2.09 .18|1.52 2.5|1.44 2.3| .58 .69| 42.0 59.6| .44| C24 0 | | 35 136 68 2.00 .19|1.13 .8|1.08 .6| .72 .71| 58.8 56.2| .79| A35 0 | | 27 116 69 1.99 .20| .76 -1.0| .59 -1.4| .82 .77| 75.4 71.4| 1.19| A27 0 | | 30 111 69 1.96 .22|1.17 .8|1.20 .7| .71 .74| 65.2 72.2| .89| A30 0 | | 64 145 70 1.94 .18|1.38 2.2|1.43 2.4| .62 .64| 44.3 51.2| .54| B29 0 | | 32 138 69 1.92 .19|1.32 1.7|1.25 1.4| .69 .70| 50.7 57.3| .57| A32 0 | | 29 116 69 1.89 .20| .56 -2.0| .32 -1.5| .81 .76| 76.8 74.6| 1.22| A29 0 | | 28 138 69 1.84 .19| .71 -1.7| .71 -1.8| .79 .75| 62.3 57.3| 1.31| A28 0 | | 66 114 70 1.79 .21| .77 -.9| .80 -.7| .87 .83| 72.9 69.5| 1.14| B31 0 | | 95 173 81 1.73 .17|1.25 1.4|1.19 1.1| .59 .67| 50.6 57.6| .80| C25 0 | | 59 134 70 1.71 .19|1.29 1.5|1.22 1.2| .72 .77| 50.0 57.4| .69| B24 0 | | 31 133 69 1.71 .20| .73 -1.3| .71 -1.8| .78 .78| 60.9 59.8| 1.29| A31 0 | | 101 182 81 1.67 .16| .92 -.5|1.07 .5| .67 .67| 59.3 54.1| 1.10| C31 0 | | 69 152 70 1.61 .18| .81 -1.2| .81 -1.2| .75 .70| 60.0 53.6| 1.24| B34 0 | | 63 139 70 1.58 .16|1.26 1.4|1.37 1.5| .67 .68| 52.9 54.4| .74| B28 0 | | 67 113 70 1.56 .20| .55 -1.6| .49 -1.5| .83 .78| 82.9 75.9| 1.25| B32 0 | | 65 123 70 1.56 .18|1.09 .4|1.47 1.5| .74 .75| 55.7 64.0| .76| B30 0 | | 58 133 70 1.45 .20| .97 -.1|1.07 .4| .82 .80| 51.4 62.5| .86| B23 0 | | 92 186 81 1.43 .17| .80 -1.1| .83 -1.1| .67 .67| 54.3 56.9| 1.16| C22 0 | | 68 149 70 1.40 .19| .73 -1.5| .78 -1.2| .80 .76| 70.0 61.9| 1.16| B33 0 | | 105 199 81 1.33 .17| .86 -.8| .90 -.6| .67 .66| 55.6 58.0| 1.09| C35 0 | | 70 168 70 1.30 .15| .76 -1.6| .73 -1.7| .66 .61| 47.1 46.3| 1.28| B35 0 | | 100 181 81 1.24 .17| .80 -1.1| .79 -.6| .70 .68| 67.9 58.1| 1.18| C30 0 | | 33 161 69 1.19 .19|1.34 1.6|1.31 1.6| .74 .75| 53.6 60.1| .62| A33 0 | | 60 166 70 1.12 .16| .99 .0| .96 -.2| .67 .68| 47.1 50.0| 1.06| B25 0 | | 97 202 81 1.09 .17|1.30 1.6|1.03 .2| .70 .68| 64.2 59.1| .83| C27 0 | | 23 143 69 1.03 .17| .66 -1.8| .60 -1.9| .75 .71| 68.1 58.6| 1.27| A23 0 | | 26 161 69 .97 .20|1.21 .9|1.15 .7| .78 .78| 66.7 66.3| .69| A26 0 | | 89 184 81 .94 .15|1.02 .2|1.73 2.4| .58 .66| 54.3 58.2| .95| C19 0 | | 55 134 70 .94 .17| .87 -.5| .92 -.1| .73 .73| 52.9 60.4| 1.00| B20 0 | | 51 142 70 .93 .16| .86 -.7| .81 -.7| .74 .72| 61.4 56.2| 1.12| B16 0 | | 25 150 69 .90 .17| .91 -.3| .85 -.3| .74 .74| 53.6 56.3| 1.07| A25 0 | | 20 156 69 .80 .16| .87 -.6| .92 -.4| .71 .69| 55.1 53.0| 1.04| A20 0 | | 96 197 81 .78 .17| .98 .0| .89 -.3| .68 .67| 65.4 61.5| .99| C26 0 | | 93 234 81 .67 .16| .97 -.1| .98 -.1| .64 .63| 51.9 50.4| 1.03| C23 0 | | 48 151 70 .55 .15|1.19 .9|1.12 .6| .68 .67| 50.0 55.7| .96| B13 0 | | 90 211 81 .55 .14|1.07 .5| .99 .1| .63 .63| 43.2 50.4| .91| C20 0 | | 85 217 81 .38 .14| .85 -.8| .81 -1.1| .64 .61| 48.1 49.7| 1.14| C15 0 | | 87 219 81 .29 .15| .92 -.3| .88 -.4| .65 .64| 56.8 56.3| 1.03| C17 0 | | 57 183 70 .15 .15| .91 -.4| .93 .0| .66 .66| 47.1 48.4| 1.00| B22 0 | | 86 219 81 .12 .14| .68 -1.9| .60 -.4| .63 .62| 60.5 52.6| 1.35| C16 0 | | 81 241 81 .11 .14| .96 -.2| .95 -.2| .61 .60| 42.0 46.6| 1.05| C11 0 | | 56 177 70 .08 .15| .87 -.6| .82 -.4| .65 .64| 55.7 50.6| 1.08| B21 0 | | 84 256 81 .06 .15|1.20 1.3|1.21 1.2| .50 .60| 50.6 49.1| .79| C14 0 | | 88 226 81 .04 .19| .67 -1.4| .81 -.4| .68 .66| 76.5 70.6| 1.14| C18 0 | | 16 185 69 .03 .15|1.02 .2|1.02 .2| .62 .62| 52.2 50.0| .94| A16 0 | | 24 184 69 .03 .15| .69 -1.6| .69 -1.3| .64 .62| 56.5 54.5| 1.22| A24 0 | | 13 182 69 .02 .15| .81 -1.0| .73 -.9| .62 .61| 58.0 50.0| 1.19| A13 0 | | 17 186 69 .01 .14| .96 -.2| .87 -.3| .61 .60| 40.6 43.1| 1.02| A17 0 | | 22 189 69 .00 .15| .56 -2.8| .55 -1.8| .67 .64| 59.4 52.6| 1.38| A22 0 | | 15 197 69 -.02 .18|1.18 .9|1.11 .5| .63 .69| 46.4 56.2| .73| A15 0 | | 46 190 70 -.16 .13| .70 -1.8| .68 -1.4| .60 .58| 42.9 44.5| 1.27| B11 0 |

58
| 42 196 70 -.21 .13| .78 -1.3| .65 -1.5| .60 .58| 58.6 44.1| 1.26| B7 0 | | 54 196 70 -.23 .14| .67 -1.9|1.13 .6| .58 .60| 55.7 48.6| 1.17| B19 0 | | 11 207 69 -.27 .15|1.12 .7|1.05 .3| .62 .61| 39.1 48.5| .90| A11 0 | | 82 272 81 -.33 .17|1.35 2.0|1.31 1.8| .58 .60| 51.9 55.1| .67| C12 0 | | 21 208 69 -.36 .13| .85 -.8| .74 -1.0| .55 .54| 55.1 42.1| 1.16| A21 0 | | 47 202 70 -.45 .12| .93 -.3| .87 -.1| .55 .55| 44.3 44.6| 1.03| B12 0 | | 76 281 81 -.51 .12| .85 -1.0| .77 -1.1| .54 .52| 55.6 44.7| 1.16| C6 0 | | 83 267 81 -.54 .11|1.00 .1| .81 -.7| .52 .51| 44.4 43.8| 1.06| C13 0 | | 19 209 69 -.54 .15| .67 -1.7| .65 -1.1| .58 .57| 59.4 51.8| 1.20| A19 0 | | 80 279 81 -.60 .13| .96 -.2| .84 -.7| .57 .55| 51.9 48.2| 1.07| C10 0 | | 43 230 70 -.72 .13|1.01 .1| .95 -.1| .53 .53| 47.1 41.0| .98| B8 0 | | 91 274 81 -.75 .15| .87 -.7| .75 -.8| .61 .59| 58.0 53.2| 1.11| C21 0 | | 10 227 69 -.76 .15| .67 -1.9| .63 -1.3| .57 .56| 55.1 49.6| 1.24| A10 0 | | 78 293 81 -.80 .13|1.02 .2| .95 -.1| .53 .52| 48.1 46.5| .98| C8 0 | | 41 233 70 -.98 .12| .88 -.6| .68 -.6| .49 .49| 52.9 47.0| 1.06| B6 0 | | 53 253 70 -1.00 .14| .77 -1.4|1.33 1.5| .46 .52| 44.3 44.7| 1.14| B18 0 | | 9 248 69 -1.10 .12| .67 -2.1| .58 -1.5| .50 .48| 47.8 43.3| 1.36| A9 0 | | 18 249 69 -1.17 .14|1.12 .8|1.19 .9| .52 .53| 42.0 45.7| .87| A18 0 | | 73 344 81 -1.19 .14|1.14 .9|1.10 .4| .49 .49| 42.0 51.7| .85| C3 0 | | 8 320 69 -1.24 .16| .82 -1.1| .89 -.2| .43 .42| 60.9 52.7| 1.20| A8 0 | | 12 266 69 -1.37 .14|1.35 1.9|2.45 4.3| .48 .50| 50.7 46.0| .59| A12 0 | | 7 275 69 -1.47 .13| .70 -1.9| .71 -1.1| .48 .46| 47.8 45.2| 1.28| A7 0 | | 52 279 70 -1.48 .12|1.12 .7|1.16 .5| .44 .44| 42.9 41.8| .87| B17 0 | | 61 286 70 -1.57 .13|1.02 .2|1.09 .5| .45 .45| 40.0 43.8| .96| B26 0 | | 49 279 70 -1.59 .14| .89 -.6| .84 -.7| .50 .49| 55.7 45.4| 1.12| B14 0 | | 14 282 69 -1.62 .14|1.27 1.4|1.38 1.2| .44 .46| 39.1 47.2| .75| A14 0 | | 50 286 70 -1.73 .14| .89 -.6| .81 -.6| .49 .48| 55.7 49.2| 1.10| B15 0 | | 45 299 70 -1.75 .12| .78 -1.3| .66 -1.0| .41 .39| 48.6 44.4| 1.23| B10 0 | | 77 373 81 -1.84 .12| .74 -1.6| .75 -.4| .39 .38| 54.3 47.2| 1.24| C7 0 | | 44 361 70 -1.85 .15| .87 -.7| .84 -.2| .32 .31| 55.7 53.3| 1.11| B9 0 | | 74 377 81 -1.98 .13|1.05 .4|1.29 .7| .39 .40| 48.1 49.4| .91| C4 0 | | 40 331 70 -2.18 .12|1.20 1.1|1.45 .9| .32 .33| 50.0 49.2| .87| B5 0 | | 79 385 81 -2.19 .13| .85 -.8|1.00 .2| .38 .38| 43.2 50.0| 1.01| C9 0 | | 71 393 81 -2.27 .12|1.18 1.1|1.11 .4| .34 .35| 40.7 50.0| .78| C1 0 | | 39 357 70 -2.28 .14| .82 -.9| .59 -.8| .32 .30| 55.7 52.4| 1.15| B4 0 | | 38 343 70 -2.28 .13| .85 -.7| .74 -.4| .32 .31| 51.4 50.1| 1.13| B3 0 | | 6 322 69 -2.35 .15| .76 -1.3| .66 -1.0| .42 .40| 59.4 52.4| 1.25| A6 0 | | 37 381 70 -2.38 .17| .73 -1.3| .82 -.2| .27 .26| 67.1 63.1| 1.13| B2 0 | | 72 412 81 -2.48 .12|1.04 .3|1.44 .9| .29 .30| 53.1 55.1| .86| C2 0 | | 4 345 69 -2.56 .13|1.54 2.5|2.54 1.5| .28 .31| 56.5 54.4| .65| A4 0 | | 75 439 81 -2.62 .16|1.12 .8|9.90 7.7| .24 .28| 56.8 60.1| .54| C5 0 | | 3 346 69 -2.67 .15| .79 -1.0| .81 -.3| .36 .34| 55.1 52.3| 1.18| A3 0 | | 36 371 70 -2.72 .14|2.45 4.7|3.82 2.2| .18 .25| 55.7 63.5| -.19| B1 0 | | 1 378 69 -3.05 .15|1.05 .3|1.10 .4| .21 .22| 75.4 71.6| .98| A1 0 | | 2 397 69 -3.15 .16|1.29 .9|9.90 4.0| .10 .13| 82.6 85.4| .61| A2 0 | | 5 389 69 -3.17 .17| .71 -.9| .55 -.1| .20 .19| 82.6 80.2| 1.08| A5 0 | |------------------------------------+----------+----------+-----------+-----------+-----+---------| | MEAN 225.9 73.3 .00 .16| .97 -.2|1.16 .0| | 55.4 54.7| | | | S.D. 84.8 5.5 1.60 .03| .26 1.3|1.29 1.4| | 9.8 8.7| | | ----------------------------------------------------------------------------------------------------

59
Appendix B: MTC Spanish Elicited Imitation Test Ordered by Difficulty Level
1. El bautismo es esencial. 2. Mi hermano es menor que yo. 3. El Libro de Mormón nos enseña la verdad. 4. Yo tengo dos hermanas, pero tú tienes tres. 5. Hace un mes que los visitamos. 6. Jesús creó la tierra. 7. Debemos seguir al profeta. 8. Dios mora en los cielos. 9. El albedrío es un principio eterno. 10. Nos gustaría pasar y ver cómo le va. 11. Todo lo bueno proviene de Dios. 12. ?Cual es la diferencia entre un profeta y un apostol? 13. Les pedimos que leyeran dos capítulos. 14. El Espíritu Santo nos testificará que Jesucristo es nuestro Salvador y Redentor. 15. Jesús pasó Su vida al servicio de los demás. 16. Las personas que se arrepienten son perdonadas. 17. Este mensaje de la Restauración es verdadero o no lo es. 18. Adán y Eva fueron separados de la presencia de Dios. 19. Yo me levanto a las cuatro de la madrugada. 20. El plan de salvación nos proporciona la respuesta a preguntas. 21. Estaremos enseñando a alguien a esa hora mañana. 22. Jesús obedeció todo lo que Su Padre Celestial le pidió. 23. Nadie puede saber las verdades espirituales sin la oración. 24. De la transgresión resultaron grandes bendiciones. 25. Las Escrituras están disponibles para nosotros en la actualidad. 26. Las enseñanzas de los profetas se encuentran en libros sagrados llamados Escrituras. 27. Debido a la resurrección de Jesucristo, todos seremos resucitados. 28. Dios tiene un cuerpo de carne y huesos perfecto, glorificado e inmortal. 29. Nosotros permaneceremos en el mundo de los espíritus hasta que seamos resucitados. 30. ¿Invitará a amigos y familiares a fijar una cita con los misioneros? 31. Si planificáramos con más eficacia, nuestras lecciones serían mejores. 32. Enós llevaba mucho tiempo orando cuando recibió una respuesta. 33. Quiero llegar a ser como el capitán Moroni, lleno de amor y fuerza para luchar contra el
mal. 34. De esta manera, los investigadores podrán recibir un testimonio de la veracidad de las
Escrituras. 35. Los poseedores del sacerdocio deben presidir con amor y bondad. 36. A través de todas las épocas, Dios ha llamado profetas para que guíen a la humanidad. 37. Al restaurar el Evangelio, Dios le dio nuevamente al hombre el sacerdocio. 38. Se nos ha mandado hacer oraciones familiares para que nuestra familia sea bendecida. 39. Nuestro Padre Celestial delega Su poder del sacerdocio a los varones dignos que son
miembros de la Iglesia. 40. Decidí leer y después pedir a Dios que me hiciera saber que el libro era verdadero.

60
41. Por conducto de Su Hijo Jesucristo, Dios creó los cielos y la tierra y todas las cosas que hay en ellos.
42. Durante Su ministerio terrenal, el Salvador enseñó Su Evangelio y realizó muchos milagros.
43. Podemos fijar una fecha para la que habremos encontrado a alguien con quien compartir el Evangelio.