the development and validation of brief and ultrabrief
TRANSCRIPT

Full Terms & Conditions of access and use can be found athttp://www.tandfonline.com/action/journalInformation?journalCode=hjpa20
Download by: [Carson Sandy] Date: 21 October 2016, At: 15:42
Journal of Personality Assessment
ISSN: 0022-3891 (Print) 1532-7752 (Online) Journal homepage: http://www.tandfonline.com/loi/hjpa20
The Development and Validation of Brief andUltrabrief Measures of Values
Carson J. Sandy, Samuel D. Gosling, Shalom H. Schwartz & Tim Koelkebeck
To cite this article: Carson J. Sandy, Samuel D. Gosling, Shalom H. Schwartz & Tim Koelkebeck(2016): The Development and Validation of Brief and Ultrabrief Measures of Values, Journal ofPersonality Assessment, DOI: 10.1080/00223891.2016.1231115
To link to this article: http://dx.doi.org/10.1080/00223891.2016.1231115
View supplementary material
Published online: 21 Oct 2016.
Submit your article to this journal
View related articles
View Crossmark data

The Development and Validation of Brief and Ultrabrief Measures of Values
Carson J. Sandy,1 Samuel D. Gosling,1,2 Shalom H. Schwartz,3,4 and Tim Koelkebeck5
1Department of Psychology, The University of Texas at Austin; 2Music, Mind and Wellbeing, The University of Melbourne, Parkville, Victoria, Australia;3Department of Psychology, The Hebrew University of Jerusalem, Israel; 4Expert Institute and International Research and Teaching Laboratory for Socio-Cultural Research, National Research University Higher School of Economics, Moscow, Russia; 5MyType, Inc., San Francisco, California
ARTICLE HISTORYReceived 30 November 2015Revised 29 July 2016
ABSTRACTValues are a central personality construct and the importance of studying them has been well established.To encourage researchers to integrate measures of values into their studies, brief and ultrabriefinstruments were developed to recapture the 10 values measured by the 40-item Portrait ValuesQuestionnaire (PVQ; Schwartz, 2003). Rigorous psychometric procedures based on separate derivation (ND 38,049) and evaluation (N D 29,143) samples yielded 10- and 20-item measures of values, which provedto be successful at capturing the patterns and magnitude of correlations associated with the original PVQ.These instruments should be useful to researchers who would like to incorporate a values scale into theirstudy but do not have the space to administer a longer measure.
There is now strong evidence for a near-universal structure ofbasic human values (e.g., Bilsky, Janik, & Schwartz, 2011;Schwartz, 1992; Schwartz & Bardi, 2001). For example, thestructure of Schwartz’s 10 basic values has been supported in210 samples from 67 countries (Schwartz & Boehnke, 2004).These values (universalism, self-direction, stimulation, hedo-nism, achievement, power, security, conformity, tradition, andbenevolence) relate to one another in a quasi-circumplex struc-ture such that values that are adjacent to one another are morepositively correlated than values more distant on the circularstructure. In addition, the relative ranking of the importance ofthe 10 values shows substantial consistency across differentsamples and geographical contexts. This consistency suggeststhat a pancultural hierarchy fosters successful societal function-ing (Schwartz & Bardi, 2001).
The basic values have numerous established external correlates(e.g., age, gender, education level, political orientation, religiosity;Schwartz, 2006) and predict a broad range of meaningful decisionsand behaviors (e.g., Bardi & Schwartz, 2003; Sagiv & Schwartz,2004). In previous research, values have predicted such diversebehaviors as alcohol consumption (Dollinger & Kobayashi, 2003),worrying (Schwartz, Sagiv, & Boehnke, 2000), social attraction(Boer et al., 2011), proenvironmental behavior (Grunert & Juhl,1995; Schultz & Zelezny, 1998), and political attitudes and votingbehavior (e.g., Schwartz, Caprara, & Vecchione, 2010).
Despite such promising findings, the quantity of values-related research has lagged behind that of other individual-dif-ference constructs, such as traits. A keyword search of articlespublished in the top (based on Impact Factor from the 2012
Journal Citation Reports� Social Sciences Edition [ThomasReuters, 2013]) personality journals (Personality and Social Psy-chology Review, Journal of Personality and Social Psychology,Journal of Personality, European Journal of Personality, Person-ality and Social Psychology Bulletin, Journal of Research in Per-sonality, Journal of Personality Assessment, Personality andIndividual Differences) over the past 20 years yielded 2,413articles using the keyword traits compared to 411 articles usingthe keyword values.1
Some researchers have essentially equated traits with personality(Buss, 1989; Hofstee, 1984) but theorists have been quick to pointout that traits alone offer only a limited understanding of personal-ity (McAdams, 1995). In attempts to push more integrative modelsof personality, researchers have proposed values as a candidate foroffering a more comprehensive understanding of the person (e.g.,McAdams & Pals, 2006; Parks-Leduc, Feldman, & Bardi, 2015).The incremental contribution of values over traits is supported bytheir differing patterns and strengths of correlations with outcomesand constructs, such as religiosity (Roccas, Sagiv, Schwartz, andKnafo, 2002), subjective well-being (e.g., Haslam, Whelan, & Bas-tian, 2009), and voting preferences (e.g., Caprara, Vecchione, &Schwartz, 2009).
A recent meta-analysis of 60 studies reporting correlationsbetween values and the Big Five personality traits suggestedthat the two types of constructs are distinct (Parks-Leduc et al.,2015); such findings provide an impetus for researchers to mea-sure both values and traits when studying the effects of individ-ual differences. This more comprehensive approach willprovide scholars with a more holistic view of the person and
CONTACT Carson J. Sandy [email protected] MotiveMetrics, 410 Sherman Avenue, Palo Alto, CA 94306.Carson J. Sandy is now at MotiveMetrics in Palo Alto, CA.
Supplemental data for this article can be accessed on the publisher’s website.1The search result for values overestimates the number of studies examining basic psychological values because the search term also captures additional constructs suchas social value orientation, truth value, and mate value.
© 2016 Taylor & Francis
JOURNAL OF PERSONALITY ASSESSMENThttp://dx.doi.org/10.1080/00223891.2016.1231115

also contribute to a better understanding of how traits and val-ues differentially affect and predict behavior.
One of the main reasons for the relative scarcity of valuesresearch (in comparison to research on personality traits) could bethe costs in time and effort of measuring values, especially forinvestigators for whom values are not their primary research inter-est. Even the already vibrant field of personality trait research sawan upsurge in studies measuring personality with the availability ofvery brief, psychometrically sound personality trait measures (e.g.,Gosling, Rentfrow, & Swann, 2003). Here, we aim to develop ashort measure of values with the hope that it will similarly facilitateawider integration of valuesmeasures into ongoing research. Natu-rally, researchers whose central interests are in values will continueto use the existing longer instruments.
Background of the empirical study of values
Building on the seminal work of Rokeach (1973), Schwartz andBilsky (1987, 1990) sought to develop a theory of basic humanvalues that applies across cultural contexts and is grounded inhuman social nature. Early efforts specified three facets of everyvalue: goal type (terminal vs. instrumental), interests served(collective vs. individual), and motivational domain (e.g., hedo-nism). Subsequently, Schwartz reduced this to two facets, inter-ests served (social vs. personal) and motivational domain. Forexample, the value excitement serves a personal interest in thestimulation motivational domain. The development of thesefacets resulted in a systemic theory of the content and organiza-tion of the value systems of individuals that has been validatedempirically (Schwartz, 1992; Smith & Schwartz, 1997).
Schwartz (1992) settled on 10 basic human values that are orga-nized on a circular motivational continuum such that adjacent val-ues (values that are closer together in the circle) are conceptuallymore closely related. Values include universalism, self-direction,stimulation, hedonism, achievement, power, security, conformity,tradition, and benevolence values. The circular structure has beensupported in adolescent, student, adult, and representative samplesfrommore than 80 countries (Schwartz, 2006, 2011). In addition toreplicating the circular structure with self-reported values, Bardiand Schwartz (2003) found that behaviors chosen as likely toexpress each value (e.g., “obey my parents” [conformity], “Useenvironmentally friendly products” [universalism]) also exhibiteda circular structure of relations that corresponded to the circularmotivational structure of values. Thus, value-expressive behaviorsvalidate themotivational structure, too.
Measurement of the Schwartz values model
The 57-item Schwartz Value Survey (SVS; Schwartz, 1992) wascreated to evaluate these 10 basic human values. Participantsendorse the appropriate level of personal importance (from ¡1to 7) of each value item. For example, to measure power, arespondent indicates how important “social power—controlover others, dominance” is as a guiding principle in his or her
life. The SVS has strong psychometric validity and remains oneof the most pervasive measures of values.
One issue with the SVS was that the values circumplex2
failed to replicate in about 5% of cross-cultural samples, mainlyin Africa (Schwartz et al., 2001). A major reason for this failureis that the SVS requires respondents to have an abstract con-ception of the values they endorse. The SVS provides no infor-mation to contextualize the values in a real-world setting. Someparticipants, especially in societies with a non-Western educa-tion system, might have had difficulty interpreting the abstractitems of the SVS.
To circumvent the problem of using abstract value concepts,Schwartz developed the Portrait Values Questionnaire (PVQ–40; Schwartz, 2003; Schwartz et al., 2001). This 40-item instru-ment presents participants with short portraits of gender-matched individuals. Respondents rate how much the persondescribed in the portrait is like himself or herself. For example,a PVQ power item states, “It is important to him to be incharge and tell others what to do. He wants people to do whathe says.” Respondents’ own values are inferred from their self-reports of how similar they are to the individuals described inthe portraits. With its greater concreteness, the PVQ was moresuccessful in confirming the value circumplex in countrieswhere the SVS had not (Schwartz, 2006). The goal of this studyis to develop brief and ultrabrief scales, based on the PVQ–40,thereby providing researchers with more options to incorporatevalues measures into their research.
Why is a shorter instrument needed?
Researchers in the field of personality assessment have identi-fied numerous contexts where short scales are advantageous(e.g., Gosling et al., 2003; Paulhus & Bruce, 1992; Robins,Trzesniewski, Tracy, Gosling, & Potter, 2002). Some of thesecontexts include longitudinal studies (tracking individuals onmany constructs over time), personality-rating studies (ratingindividuals on multiple personality variables), large-scale Inter-net studies (where participants might lack the patience to takelong questionnaires), and prescreening (researchers desire toidentify a number of traits before moving forward with a fullstudy).
In response to the demand for short measures, a wide rangeof very brief scales have been developed and validated. Theseaddress such topics as relationships (Wei, Russell, Mallinck-rodt, Vogel, 2007), personality traits (Gosling et al., 2003),intelligence (Minshew, Turner, & Goldstein, 2005), and self-esteem (Robins, Hendin, & Trzesniewski, 2001). Typically,these scales demonstrate convergence with the full scale andcorrelate with external variables as predicted. The short scalestend to have lower reliabilities (e.g., internal consistency, test–retest) than the full scales but remain satisfactory (Ziegler,Kemper, & Kruyen, 2014).
Abbreviating the PVQ–40
In abbreviating the PVQ–40, we had two objectives. First, wewished to create brief (two items per value) and ultrabrief (oneitem per value) questionnaires to allow researchers to incorpo-rate values into studies that cannot accommodate the length of
2Strictly speaking, the circular motivational structure of values is a quasi-circum-plex (Schwartz & Boehnke, 2004). For simplicity, we refer to it as a circumplex.
2 SANDY, GOSLING, SCHWARTZ, KOELKEBECK
the standard measures. Second, to promote incrementalresearch, we wanted to construct the scales in a way that wouldreadily facilitate comparisons across the scales of differentlengths. Third, we wished to provide a record of all relevantselection and validation psychometrics.
A brief 21-item measure of values, derived from the PVQ,already exists, the PVQ–21 (Schwartz, 2003). Schwartz devel-oped this abbreviated scale for use in the European Social Sur-vey (ESS; Schwartz, 2003). A number of issues associated withthe development and publication of the PVQ–21 prompted usto create a new scale. First, several of its items were modifiedversions of PVQ–40 items, making direct psychometric com-parisons between the 21-item and 40-item versions problem-atic. Second, few details were reported regarding the sample of444 individuals used for the item-derivation sample other thanthat they originated from the United Kingdom and Nether-lands. Third, no external variables were measured in the scale-development process; evaluating the pattern of relationshipswith values and other constructs is a key step in establishingthe validity of a new measure (e.g., Gosling et al. 2003). Fourth,convergent validity scores are not reported. An abbreviatedscale’s correlation with the original scale is an important step indemonstrating that it can effectively recapture the psychomet-ric properties of the long-form version. Finally, no test–retestdata are available; this form of reliability is particularly impor-tant because, as we discuss later, internal consistency indexesare vulnerable to underestimating the reliability of short scales.
The current scale-development efforts sought to addressthese drawbacks of the PVQ–21. First, to facilitate comparabil-ity across scales, we drew on PVQ–40 items to construct boththe 10- and 20-item scales, using identical methods and equiva-lent samples. This procedure guaranteed that the items of the10-item scale were a subset of the items on the 20-item scale.Because the longer instruments perfectly subsume the shorterinstruments, researchers can directly compare findings acrossstudies that used either of the two new scales or the existingPVQ–40. We also compared the performance of our new 10-and 20-item scales with that of the existing 21-item PVQ. Sec-ond, we present detailed demographic information on partici-pants and documentation of the data collection procedures.Third, a number of external variables were collected, allowingus to examine their expected relationships with the valuesscales, furnishing further evidence regarding the validity of thenew scales. Fourth, convergent validity scores with respect tothe original PVQ–40 were estimated and used in the item-selec-tion and validation phases. Finally, we estimated test–retestreliability data.
Overview of this research
Phase 1 of the study involved the selection of items for the newscales. To derive the best performing 10-item and 20-itemmeasures, the following psychometric criteria were used: con-vergence with the full scale, internal consistency, and patternsof predicted external correlates. Phase 2 then evaluated theabbreviated scales in a new sample. Additionally, two follow-upstudies were performed. The first study aimed to identify thetime savings a researcher might gain from using the newshorter scales The second study estimated test–retest reliability.
A number of automated methods, such as those based onitem response theory and genetic algorithms, can also be usedto select the subsets of items that best represent the longerscales from which the items are drawn. Elsewhere we haveempirically compared the results of the traditional and auto-mated methods and found the results to be virtually identical(Sandy, Gosling, & Koelkebeck, 2014). Here we use the tradi-tional method, which is more widely understood.
Method
Participants
The procedures required a large sample to detect the subtle psy-chometric effects of measurement differences, and one that wasreasonably diverse to establish the generalizability of the find-ings. It was also necessary to obtain responses to a number ofother variables to evaluate patterns of external correlates. Col-lecting the data online facilitated meeting these criteria (Gos-ling & Mason, 2015). Specifically, two samples of volunteersresponded to items hosted on an application (MyType) run-ning on Facebook. Respondents received feedback on theirscores that they could post to their walls if they wished. Sample1 (derivation sample) consisted of 38,049 individuals (63%female; ages 18–94, M D 26.42, SD D 10.01) who respondedbetween December 2009 and November 2010. Sample 2 (evalu-ation sample) consisted of 29,143 individuals (62% female; ages18–92, M D 27.45, SD D 9.52) who responded between August2010 and February 2011 while Sample 1 was being analyzed.Sample 1 and Sample 2 were both pulled from a larger databaseof participants and are completely nonoverlapping (meaningthat no participants appear in both data sets). The nationalityof the participants was as follows: United States (72%), Singa-pore (8%), Canada (3%), Australia (3%), and Great Britain(3%). Twelve percent of participants were from various othercountries and 11% did not report a location.
Measures
The data were collected via a series of questionnaires hosted byMyType.com, an application developed for Facebook. A pri-mary feature of this application is to provide users the opportu-nity to respond to and get feedback on psychometrically validpersonality scales. Participants arrived at MyType.com throughembedded links in other Web sites, online search engines, andword of mouth. Two broad classes of measures were collected.First were the values measures from which the short scaleswere derived. Second were variables that could be used to com-pare the patterns of external correlates of the old and newinstruments. These were demographics, Big Five, political ori-entation, and religiosity, which MyType happened to becollecting.
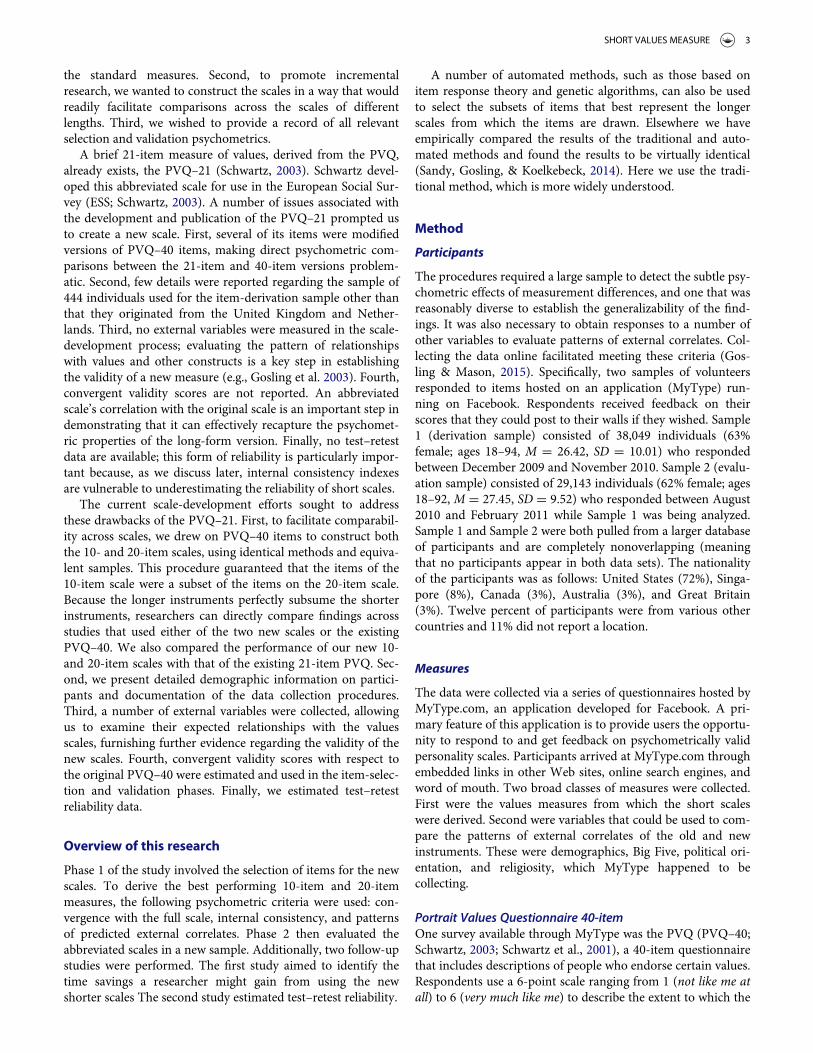
Portrait Values Questionnaire 40-itemOne survey available through MyType was the PVQ (PVQ–40;Schwartz, 2003; Schwartz et al., 2001), a 40-item questionnairethat includes descriptions of people who endorse certain values.Respondents use a 6-point scale ranging from 1 (not like me atall) to 6 (very much like me) to describe the extent to which the
SHORT VALUES MEASURE 3

individuals portrayed in 40 brief descriptions are similar tothemselves (see online supplemental Appendix A for sampleitems). Respondents’ own values are inferred from these self-reported similarity estimates. Reliability reached acceptable lev-els (typically greater than .7; Nunnally, 1978) in both sampleswith one exception (tradition). Cronbach’s alphas for the selec-tion and evaluation samples were, respectively, conformity D.73/.73, tradition D .51/.51, benevolence D .85/.86, universalismD .84/.85, self-direction D .88/.89, stimulation D .77/.78, hedo-nism D .80/.81, achievement D .84/.84, power D .69/.69, andsecurity D .65/.64.
Portrait Values Questionnaire 21-itemSchwartz created a 21-item version of the PVQ (PVQ–21;Schwartz, 2003) for inclusion in the ESS (Schwartz, 2003). Toevaluate whether the new 10- and 20-item instruments offerany improvement over this version, we also calculated scoresfor a close proxy of the PVQ–21. It was necessary to use a proxyfor the PVQ–21 because eight of its items were slightly modi-fied from the PVQ–40 items. Our data set only included itemsfrom the PVQ–40, so we substituted the items from the PVQ–40 that matched the modified PVQ–21 items most closely forour proxy. The differences between the original PVQ–40 andmodified PVQ–21 items are quite minor. For example, “Enjoy-ing life’s pleasures is important to him. He likes to ‘spoil’ him-self” was modified to “Having a good time is important to him.He likes to ‘spoil’ himself” in the PVQ–21.
Nonetheless, to evaluate the extent to which these minoredits had an impact on responses to the items, we conducted aseries of tests that examined the equivalences between theitems. Data were collected via Amazon’s Mechanical Turk (seeBuhrmester, Kwang, & Gosling, 2011, for a description ofMechanical Turk and support for the reliability of data col-lected on that platform). With a sample of 307 participants, weevaluated correlations between the PVQ–21 items and theirPVQ–40 equivalents. The correlations ranged from .43 to .77(M D .64). Combining these estimates across studies and cor-recting them for attenuation (using the test–retest correlationsderived from perfectly identical items) yielded item-equivalenceestimates that ranged from .53 to .91 (M D .74, SD D .10).Based on these estimates, we concluded that the item-equiva-lences were sufficiently strong to proceed with our proxy mea-sure of the PVQ–21. However, readers should keep in mindthat our proxy is not identical to the PVQ–21. Cronbach’salphas for the selection and evaluation samples for the PVQ–21were, respectively, conformity D .67/.68, tradition D .18/.16,benevolence D .83/.85, universalism D .73/.75, self-direction D.77/.79, stimulation D .70/.70, hedonism D .67/.67, achieve-ment D .73/.73, power D .55/.55, and security D .40/.39.
The Big Five InventoryThe Big Five Inventory (BFI; John, Donahue, & Kentle, 1991) isdesigned to measure the factors of the Big Five (Extraversion[E], Agreeableness [A], Conscientiousness [C], Neuroticism[N], Openness [O]). It consists of 44 short items that respond-ents rate on a scale ranging from 1 (strongly disagree) to 5(strongly agree). Cronbach’s alpha reached acceptable levels inboth the selection and validation samples, respectively (E D.77/.77, A D .75/.70, C D .78/.77, N D .81/.77, O D .71/.67).
Demographic and attitudinal variablesThese variables were age (measured in years), gender, income,education level, political conservatism, and religiosity. Incomewas self-reported household income (seven intervals rangingfrom less than $25,000 to $200,000 or more). Political conser-vatism was measured with a single-item scale ranging from 1(extremely liberal) to 5 (extremely conservative). Religiosity wasmeasured with a single-item scale ranging from 1 (not religiousat all) to 5 (devoutly religious).
Phase 1: Item selection
We based item selection on three factors—reliability, patternsof predicted external correlations, and mean external correla-tions. We measured reliability via Cronbach’s alpha, which esti-mates internal consistency, or the degree to which the items tapthe same construct. For scales that are designed to estimate uni-tary constructs, as the value scales are, items that yield higheralpha levels are preferred. In the case of the 10-item measure,internal consistency could not be evaluated because only oneitem measured each value. It is important to note that althoughwe used Cronbach’s alpha as one of the criteria for selectingitems, this index can underestimate reliability, especially whenapplied to very short measures of broad constructs. This biasresults from the fact that alpha is a function of the number ofitems on a scale and average correlation among the items. Typi-cally the goal of a brief measure is to capture the full breadth ofa construct (i.e., content validity) with as few items as possible.To capture the breadth of the construct, maximally differentitems could be chosen, thereby reducing the mean interitemcorrelations. To keep the scale short, few items are selected.Together both these factors (low interitem correlations, fewitems) will tend to diminish the alpha coefficients.
If the new value instruments are to serve as useful alterna-tives to the PVQ–40, the values they measure should show pat-terns of correlation with external variables that are similar tothose found with the PVQ–40. To evaluate the degree to whichthis is the case, we performed a three-step analysis. First, wecentered each participant’s value scores around his or her ownscale mean. This is an important step when evaluating externalcorrelations because it controls for response biases such asacquiescence or social desirability (e.g., Schwartz, 2004). Next,we computed the correlations of the values measured with thePVQ–40 with 11 external variables (e.g., personality traits, soci-odemographic variables). Finally, we computed the correlationsof the values measured with the new instruments with the same11 external variables. For this analysis, we are concerned withthe similarity between the patterns of value correlations of thePVQ–40 and the abbreviated scales. Recapturing the pattern ofcorrelations supports the construct validity of a measure—orits expected relationships with other constructs (whether theybe related or unrelated to the construct of interest; Cronbach &Meehl, 1955).
Ideally, the value correlations of the new instruments shoulddemonstrate both convergent and discriminant validity. So, inthe second step, we computed column-vector correlationsbetween the sets of correlations (i.e., between the correlationsof the PVQ–40 and of the abbreviated scales with the externalvariables). We first transformed the correlations to a linear
4 SANDY, GOSLING, SCHWARTZ, KOELKEBECK

scale using Fisher’s r-to-z formula. Strong vector correlationswould indicate that an abbreviated scale captures external pre-dictions in a manner similar to the full PVQ–40.
In addition to reproducing the original pattern of correla-tions, it is also important that the correlations with the newinstrument are of an approximately similar magnitude as thecorrelations with the original instrument; of course, somereduction in magnitude usually results as a consequence of thesomewhat lower reliability associated with short scales. Toexamine whether the new scales recaptured the magnitude ofcorrelations found with the original scale, the mean of the abso-lute correlations with external variables was computed for theoriginal and new values scales.
The 10-item and 20-item scales that optimized these threecriteria (reliability, patterns of external correlates, magnitude ofexternal correlations) were selected for further evaluation (inStage 2). The 10-item and 20-item scale are henceforth referredto as the Ten Item Value Inventory (TIVI) and the TwentyItem Value Inventory (TwIVI), respectively.
Results
Table 1 presents the scale reliabilities for the TwIVI, the PVQ–40,and the PVQ–21. Scale reliabilities could not be estimated for theTIVI because it consists of only one item per scale. Reliabilities forthe TwIVI, with two items per value, ranged from .33 to .91 (MD.71). Reliabilities for the PVQ–21 proxy ranged from .18 to .83 (MD .62). Reliabilities for the full 40-item PVQ ranged from .51 to .88(M D .76). Two values (security and tradition) had consistentlylow reliabilities, even in the full PVQ–40. Not surprisingly, withthree to six items per scale, alpha levels for the PVQ–40were higheron average than for any of the short scales.
The vector correlations revealed that the values measuredwith the new, abbreviated scales had patterns of correlationwith the 11 external variables that were highly similar to thepatterns for the PVQ–40. Vector correlations ranged from .78to .98 (M D .91) for the 10-item TIVI, from .85 to .99 (M D.93) for the 20-item TwIVI, and from .65 to .99 (M D .91) forthe PVQ–21 proxy (for full results, see online supplementalTable S.1).
Mean external correlates ranged from .09 to .14 (M D .11)for the one-item scales of the TIVI, from .09 to .14 (M D .12)for the two-item scales of the TwIVI, and from .08 to .13 (M D.11) for the PVQ–21 (for full results, see online supplementalTable S.2). The abbreviated scales almost fully reproduced themagnitude of external correlates seen in the scales of the fullPVQ–40 scale, which ranged from .10 to .15 (M D .13). A fullsummary of external correlates can be found in Table 2. Thecompositions of the different scales, including the degree towhich the derived items overlap with the PVQ–21, are shownin Table 3.
Phase 2: Validation
To ensure that the psychometric criteria derived in the originalsample are not capitalizing on correlated error, it is necessaryto compute internal consistency reliability, vector correlations,and mean correlations in a new, independent sample. Thus, thegoal of Phase 2 was to undertake an evaluation of the scales ina new sample. To evaluate the degree to which each new scalerecaptured the full original scale, we also assessed the conver-gent and discriminant validity between the new short scalesand the scales of the original 40-item instrument. Additionally,we tested the ability of the abbreviated scales to recapture thevalue hierarchy (or the mean ranking of the 10 values) of thePVQ–40.
Measures
The same variables were measured in Phase 2 as in Phase 1.These variables were also measured in the same manner (i.e.,the same questionnaires were used).
Validation criteria
It is important to establish that the measures are reliable in anindependent sample to ensure that they are sufficiently precisefor use in research. We evaluated reliability and external corre-lations in the same manner as in Phase 1. Predicting the patternof external correlation (both the magnitude and pattern) is animportant step in establishing a nomological network, therebysupporting the construct validity of the instruments (Cronbach& Meehl, 1955).
In addition to examining the pattern and magnitude of theexternal correlates, we also tested the predicted relationshipsthat the values would have with external variables based on pre-vious literature. For each value dimension, we formed predic-tions about the directionality of the relationship the dimensionwould have with the external variables. These predictions weremade without reference to the findings in this data set.Informed predictions were made only for external variableswith sufficient background research to support the hypothesis.Hypotheses for values and the Big Five are based on meta-anal-yses performed by Fischer and Boer (2015), Parks (2007),Parks-Leduc et al. (2015), and Roccas et al. (2002). Religiosityhypotheses are based on meta-analyses by Saroglou, Delpierre,and Dernelle (2004) and Schwartz and Huismans (1995). Thepredictions for sociodemographic variables (e.g., age, gender)are based on Schwartz and Rubel (2005) and on representative
Table 1. Scale alpha reliabilities in the selection and validation samples.
TwIVI PVQ–40 PVQ–21.
Value Selection Validation Selection Validation Selection Validation
Conformity .61 .60 .73 .73 .67 .68Tradition .50 .50 .51 .51 .18 .16Benevolence .91 .91 .85 .86 .83 .85Universalism .76 .77 .84 .85 .73 .75Self-direction .81 .82 .88 .89 .77 .79Stimulation .70 .70 .77 .78 .70 .70Hedonism .85 .85 .80 .81 .67 .67Achievement .79 .79 .84 .84 .73 .73Power .80 .80 .69 .69 .55 .55Security .33 .33 .65 .64 .40 .39M .71 .71 .76 .76 .62 .63
Note. TwIVI D Twenty Item Values Inventory; PVQ–40 D 40-item Portrait ValuesQuestionnaire; PVQ–21 D 21-item Portrait Values Questionnaire. The Ten ItemValues Inventory (TIVI) is not represented in this table because internal consis-tency cannot be estimated for a scale that only uses one item per dimension.Reliabilities from both the selection phase (Sample 1) and validation phase (Sam-ple 2) are presented side by side.
SHORT VALUES MEASURE 5

national data from 27 countries in rounds one and two of theESS. Hypotheses for values and political conservatism wereformed based on the work of Piurko, Schwartz, and Davidov(2011) and Schwartz et al. (2010). Table 4 displays the fullmatrix of predictions.
In addition, we evaluated the convergent and discriminantvalidity of the abbreviated scales by correlating the 10 valuesmeasured by each scale with the 10 values measured by thePVQ–40. High correlations on the diagonal of the intercorrela-tion matrices would support convergent validity. Traditionally,
near-zero correlations on the off-diagonals support discrimi-nant validity. However, the values form a circumplex, so a dif-ferent test of discriminant validity is appropriate. Valuesadjacent in the circumplex (e.g., power and achievement)should correlate positively, opposing values (e.g., power andbenevolence) should correlate negatively, and only orthogonalvalues (e.g., power and stimulation) should correlate near zero.This pattern is found with the PVQ–40 values.
Finally, we evaluated the ability of the new scales to recapturethe value hierarchy of the PVQ–40. The value hierarchy, or ranking
Table 2. External correlations for selection sample.
CO TR BE UN SD ST HE AC PO SE
PVQ–40
Extraversion ¡.10�� ¡.12�� .19�� .05�� .20�� .39�� .29�� .30�� .43�� .06��
Agreeableness .26�� .24�� .57�� .35�� ¡.07�� .02� ¡.02�� ¡.24�� ¡.39�� ¡.01Conscientiousness .29�� .22�� .06�� ¡.02� ¡.02� ¡.14�� ¡.15�� .16�� .17�� .45��
Emotional Stability .01 .04�� .11�� .04�� .11�� .15�� .01 ¡.04�� ¡.02�� ¡.02��
Openness ¡.18�� ¡.14�� .14�� .26�� .38�� .23�� .02�� .06�� .01 ¡.11��
Conservatism .23�� .32�� .01 ¡.24�� ¡.09�� ¡.08�� ¡.07�� ¡.03� .01 .18��
Religiosity .28�� .47�� .23�� .05�� ¡.07�� .01 ¡.08�� ¡.06�� ¡.04�� .13��
Income ¡.01 ¡.07�� ¡.04�� ¡.06�� .01 ¡.02� ¡.01 .08�� .13�� .05��
Education .02�� ¡.01 ¡.01 .01 .01 ¡.03�� ¡.04�� ¡.02�� .02�� .04��
Gender .03�� .03�� .03�� .05�� ¡.01� .01 .01 ¡.02�� ¡.05�� .03��
Age .01 ¡.01 .05�� .08�� .06�� ¡.09�� ¡.07�� ¡.16�� ¡.05�� .12��
PVQ–21
Extraversion ¡.11�� ¡.23�� .18�� .06�� .20�� .37�� .28�� .25�� .30�� ¡.04��
Agreeableness .14�� .19�� .49�� .34�� ¡.10�� ¡.01 ¡.05�� ¡.20�� ¡.39�� .00Conscientiousness .29�� .23�� .08�� ¡.02� ¡.10�� ¡.11�� ¡.15�� .07�� .12�� .25��
Emotional Stability ¡.04�� ¡.02 .01 .06�� .06�� .17�� .00 ¡.10�� ¡.07�� ¡.12��
Openness ¡.20�� ¡.17�� .11�� .27�� .36�� .26�� .01 .03�� ¡.06�� ¡.16��
Conservatism .25�� .22�� .00 ¡.21�� ¡.09�� ¡.08�� ¡.08�� ¡.03� .02 .20��
Religiosity .24�� .23�� .17�� .03�� ¡.05�� .00 ¡.10�� ¡.05�� ¡.07�� .11��
Income level .01 ¡.04�� ¡.04�� ¡.06�� .00 ¡.01 .00 .07�� .12�� .03��
Education level .02� ¡.02�� ¡.02� .02� ¡.01� ¡.02� ¡.02�� ¡.02� .01 .01Gender .02�� .01� .03�� .05�� ¡.01�� ¡.01� .00 ¡.00 ¡.05�� .05��
Age ¡.01 .00 .03�� .08�� .05�� ¡.07�� ¡.04�� ¡.14�� ¡.07�� .08��
TwIVI
Extraversion ¡.06�� .03�� .19�� .05�� .18�� .37�� .31�� .24�� .49�� .08��
Agreeableness .21�� .13�� .56�� .33�� .01 ¡.01 .04�� ¡.27�� ¡.34�� ¡.03��
Conscientiousness .27�� .22�� .06�� ¡.04�� ¡.10�� ¡.11�� ¡.13�� .17�� .20�� .50��
Emotional Stability ¡.00 .00 .01 .00 .07�� .17�� .05�� ¡.04�� .02� .00Openness ¡.18�� ¡.13�� .13�� .18�� .45�� .26�� .03�� ¡.01 .06�� ¡.07��
Conservatism .23�� .38�� ¡.02 ¡.26�� ¡.10�� ¡.08�� ¡.06�� ¡.01 .02 .15��
Religiosity .28�� .56�� .19�� .03�� ¡.02� .00 ¡.05�� ¡.07�� .01 .11��
Income level .00 ¡.02� ¡.03�� ¡.06�� ¡.01 ¡.01 ¡.03�� .08�� .11�� .05��
Education level .01� .02�� .00 ¡.01 .00 ¡.02� ¡.06�� ¡.03�� .03�� .05��
Gender .03�� .05�� .05�� .05�� ¡.02�� ¡.01� .00 ¡.04�� ¡.03�� .02��
Age ¡.01 .03�� .07�� .05�� .04�� ¡.07�� ¡.09�� ¡.20�� ¡.01 .11��
TIVI
Extraversion .04�� .06�� .19�� .04�� .13�� .36�� .31�� .22�� .39�� .06��
Agreeableness .20�� .16�� .52�� .29�� .04�� ¡.06�� .02�� ¡.21�� ¡.36�� ¡.03��
Conscientiousness .24�� .13�� .05�� ¡.03�� ¡.03�� ¡.10�� ¡.14�� .10�� .17�� .58��
Emotional Stability .06�� .04�� .02� ¡.00 .09�� .17�� .05�� ¡.07�� ¡.04�� .00Openness ¡.12�� ¡.06�� .12�� .13�� .34�� .20�� .03�� ¡.03�� ¡.00 ¡.06��
Conservatism .22�� .37�� ¡.03� ¡.19�� ¡.08�� ¡.04�� ¡.05�� ¡.01 .04�� .10��
Religiosity .28�� .61�� .19�� .02�� ¡.02�� .01 ¡.05�� ¡.06�� .01 .09��
Income level ¡.00 ¡.03�� ¡.03�� ¡.06�� .00 ¡.01 ¡.03�� .07�� .09�� .03��
Education level .02� .03�� ¡.00 ¡.01 .03�� ¡.04�� ¡.06�� ¡.03�� .02�� .06��
Gender .03�� .04�� .05�� .05�� ¡.01� ¡.04�� .00 ¡.02�� ¡.02�� .05��
Age .02�� .02�� .05�� .04�� .05�� ¡.09�� ¡.08�� ¡.20�� ¡.03�� .12��
Note. CO D Conformity; TRD Tradition; BE D Benevolence; UN D Universalism; SDD Self-direction; ST D Stimulation; HE D Hedonism; AC D Achievement; PO D Power;SE D Security; PVQ–40 D 40-item Portrait Values Questionnaire; PVQ–21 D 21-item Portrait Values Questionnaire; TwIVI D Twenty Item Values Inventory; TIVI D TenItem Values Inventory.
�p < .01. ��p < .001.
6 SANDY, GOSLING, SCHWARTZ, KOELKEBECK
of values within a sample (as established through the samplemeans), describes the relative value priorities of a given population.There is considerable convergence regarding the relative impor-tance (and unimportance) of the values across countries. Benevo-lence, self-direction, and universalism typically emerge as the most
important values, and power, tradition, and stimulation as the leastimportant (Schwartz & Bardi, 2001). However, the value prioritiesof different populations tend to vary around this pancultural base-line. Given the importance of the value hierarchy for understandingparticular populations, it is important for any short scale of valuesto be able to effectively capture this hierarchy. We therefore com-pared the mean value ranking obtained with each shorter scale tothat obtained with the PVQ–40.
Results
ReliabilityThe reliability estimates in the validation sample were generallysimilar to those in the selection sample. Table 1 reports coefficientalphas between .33 and .91 (M D .71) for the values measured bythe TwIVI. For the PVQ–21, reliabilities ranged from .16 to .85 (MD .63) and for the PVQ–40 from .51 to .89 (M D .76). As previ-ously noted, reliability could not be estimated for the TIVI becausethe scales consisted of only one item each.
Correlations with external variablesEach computed scale (PVQ–40, PVQ–21, TwIVI, and TIVI) wascorrelated with a set of external variables (e.g., Big Five, gender).We compared these correlations with the predicted relationshipsthat we posited based on past research (predictions can be seen inTable 4). As shown in Table 5, the relationships between the fullPVQ–40 and the external variables closely matched the predictedrelationships in direction and significance. Overall, 82% of the 90predictions matched both in the predicted direction and signifi-cance level. Results for the external correlations of the PVQ–21,TwIVI, and TIVI are also found in Table 5. The results revealedthat the TwIVI matched 85% of the initial predictions. The PVQ–21 and the TIVI both matched 83% of predictions. As can be seenin Table 5, many of the predictions that failed were in the properpredicted direction but onlymetmarginal significance.
The full pattern of external correlations was also similar to thosein the selection sample. Online supplemental Table S.1 reports vec-tor correlations for the TwIVI of .95 to .99 (MD .97). Vector corre-lations for the TIVI ranged from .82 to .99 (M D .91). Vectorcorrelations for the PVQ–21 ranged from .79 to .99 (MD .93).
The correlations of values with external variables were gen-erally stronger for the longer, more reliable measures, as psy-chometric principles would predict. Online supplementalTable S.2 reports absolute mean correlations for the PVQ–40 of.09 to .13 (M D .11), for the 20-item TwIVI of .09 to .13 (M D.11), for the 10-item TIVI scale of .07 to .12 (M D .10), and forthe 21-item PVQ–21 of .08 to .12 (M D .10). Table 5 providesfull details of the correlations with external variables.
Convergence across measuresThe correlations along the diagonals of Table 6 reveal generallystrong convergence between the values measured by the abbrevi-ated measures and by the PVQ–40. As expected, the highest con-vergence emerged for the two-item measures of the TwIVI (M rD.91). Convergent validity for the PVQ–21 values was also strong(MrD .91). The TIVI also performed well with amean r of .81.
For the reasons discussed earlier, we assessed the discrimi-nant validity of the scales by computing the intervalue correla-tions of each abbreviated scale with the intervalue correlations
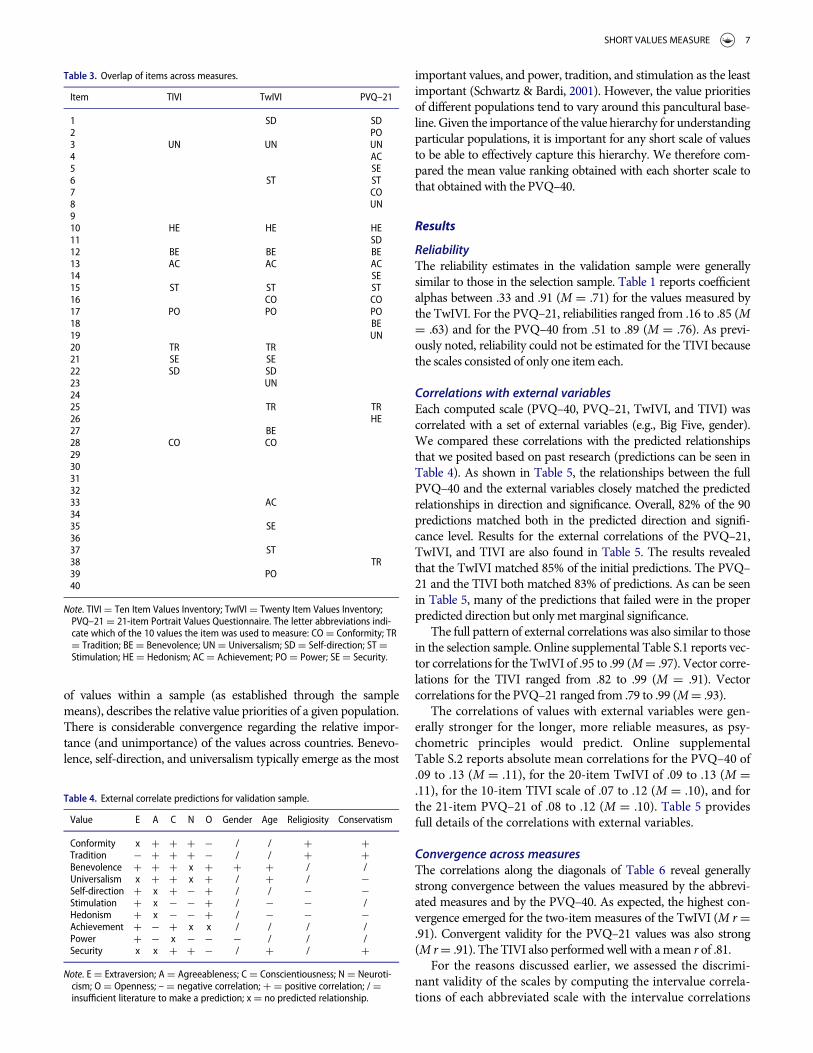
Table 3. Overlap of items across measures.
Item TIVI TwIVI PVQ–21
1 SD SD2 PO3 UN UN UN4 AC5 SE6 ST ST7 CO8 UN910 HE HE HE11 SD12 BE BE BE13 AC AC AC14 SE15 ST ST ST16 CO CO17 PO PO PO18 BE19 UN20 TR TR21 SE SE22 SD SD23 UN2425 TR TR26 HE27 BE28 CO CO2930313233 AC3435 SE3637 ST38 TR39 PO40
Note. TIVI D Ten Item Values Inventory; TwIVI D Twenty Item Values Inventory;PVQ–21 D 21-item Portrait Values Questionnaire. The letter abbreviations indi-cate which of the 10 values the item was used to measure: CO D Conformity; TRD Tradition; BE D Benevolence; UN D Universalism; SD D Self-direction; ST DStimulation; HED Hedonism; ACD Achievement; PO D Power; SE D Security.
Table 4. External correlate predictions for validation sample.
Value E A C N O Gender Age Religiosity Conservatism
Conformity x C C C ¡ / / C CTradition ¡ C C C ¡ / / C CBenevolence C C C x C C C / /Universalism x C C x C / C / ¡Self-direction C x C ¡ C / / ¡ ¡Stimulation C x ¡ ¡ C / ¡ ¡ /Hedonism C x ¡ ¡ C / ¡ ¡ ¡Achievement C ¡ C x x / / / /Power C ¡ x ¡ ¡ ¡ / / /Security x x C C ¡ / C / C
Note. E D Extraversion; A D Agreeableness; C D Conscientiousness; N D Neuroti-cism; O D Openness; – D negative correlation; C D positive correlation; / Dinsufficient literature to make a prediction; x D no predicted relationship.
SHORT VALUES MEASURE 7

of the PVQ–40 scales. The patterns of correlations for the shortscales very closely matched those of the criterion correlationmatrix of the PVQ–40. Correlations were .92 (TwIVI), .93(TIVI), and .92 (PVQ–21).
Value hierarchyThe ranking of the mean score for each abbreviated scale was com-pared to the ranking of the scores for the PVQ–40 scales. TheTwIVI came the closest to recapturing the value hierarchy of thefull scale, with only 4 (out of 50 possible) deviations. The PVQ–21and the TIVI each deviated 8 ranks. Rank-order correlations with
the PVQ–40 were .98 for the TwIVI, .94 for the PVQ–21, and .91for the TIVI. A full report of the ranks and mean differences foreach of the abbreviated scales can be seen in online supplementalTables S.3, S.4, and S.5.
Test–retest reliability
Test–retest reliability statistics are particularly important met-rics to gather when evaluating short measures because, unlikeCronbach’s alpha, they are not deflated by the low number ofitems (e.g., Gosling et al., 2003). We therefore conducted a
Table 5. External correlations validation sample.
CO TR BE UN SD ST HE AC PO SE
PVQ–40
Extraversion ¡.08�� ¡.08�� .19�� .05�� .16�� .36�� .28�� .25�� .37�� .07��
Agreeableness .26�� .25�� .47�� .33�� ¡.04�� .01 ¡.02 ¡.24�� ¡.36�� .00Conscientiousness .26�� .17�� .05�� ¡.02 .02 ¡.11�� ¡.11�� .17�� .17�� .40��
Emotional Stability .02 .03� .08�� .01 .07�� .12�� .03� ¡.03� ¡.01 ¡.01Openness ¡.14�� ¡.11�� .13�� .22�� .31�� .20�� .02 .04�� .00 ¡.09��
Conservatism .22�� .30�� .02� ¡.24�� ¡.10�� ¡.07�� ¡.06�� ¡.02� .01 .17��
Religiosity .27�� .46�� .20�� .04�� ¡.06�� .00 ¡.09�� ¡.06�� ¡.04�� .13��
Income level .00 ¡.06�� ¡.03�� ¡.05�� .02� ¡.02 ¡.01 .07�� .12�� .05��
Education level .02� ¡.01 ¡.03�� ¡.02� ¡.01 ¡.05�� ¡.05�� ¡.03�� .03�� .03��
Gender .03�� .03�� .03�� .04�� ¡.01 .01 .01 ¡.01� ¡.04�� .03��
Age .00 ¡.01 .05�� .08�� .06�� ¡.09�� ¡.07�� ¡.15�� ¡.04�� .11��
PVQ–21
Extraversion ¡.10�� ¡.19�� .17�� .05�� .16�� .34�� .27�� .20�� .25�� ¡.03�
Agreeableness .14�� .22�� .39�� .31�� ¡.03� ¡.02 ¡.05�� ¡.21�� ¡.36�� .01Conscientiousness .26�� .20�� .07�� ¡.02 ¡.05�� ¡.08�� ¡.12�� .08�� .12�� .20��
Emotional Stability ¡.04�� ¡.02 ¡.01 .03� .04�� .13�� .01 ¡.07�� ¡.05�� ¡.10��
Openness ¡.17�� ¡.14�� .10�� .23�� .30�� .23�� .01 .01 ¡.06�� ¡.14��
Conservatism .22�� .21�� .01 ¡.22�� ¡.10�� ¡.07�� ¡.06�� ¡.03�� .02� .19��
Religiosity .23�� .22�� .16�� .02 ¡.05�� ¡.01 ¡.10�� ¡.06�� ¡.06�� .10��
Income level .01 ¡.03�� ¡.03�� ¡.05�� .01 .00 .00 .06�� .11�� .03��
Education level .02� ¡.02� ¡.04�� ¡.01 ¡.03�� ¡.03�� ¡.03�� ¡.03�� .02� .00Gender .02�� .01 .03�� .04�� ¡.01 ¡.01 .01 .00 ¡.05�� .05��
Age ¡.01 ¡.01 .03�� .07�� .05�� ¡.07�� ¡.05�� ¡.13�� ¡.07�� .07��
TwIVI
Extraversion ¡.06�� .07�� .19�� .03�� .15�� .34�� .23�� .19�� .44�� .09��
Agreeableness .22�� .12�� .46�� .30�� .03� ¡.02 .03�� ¡.26�� ¡.32�� ¡.02Conscientiousness .23�� .17�� .05�� ¡.03� ¡.06�� ¡.08�� ¡.10�� .17�� .19�� .45��
Emotional Stability .01 .01 ¡.01 ¡.02 .05�� .13�� .06�� ¡.02 .03� .02Openness ¡.14�� ¡.11�� .11�� .15�� .38�� .23�� .03�� ¡.01 .06�� ¡.05��
Conservatism .22�� .36�� ¡.01 ¡.26�� ¡.11�� ¡.07�� ¡.05�� .00 .02 .13��
Religiosity .27�� .53�� .17�� .02� ¡.02� ¡.01 ¡.06�� ¡.08�� .01 .11��
Income level .00 ¡.02� ¡.02 ¡.06�� ¡.01 .00 ¡.02� .08�� .10�� .05��
Education level .01 .02� ¡.02�� ¡.03�� ¡.02� ¡.03�� ¡.08�� ¡.03�� .03�� .05��
Gender .02�� .04�� .04�� .05�� ¡.01� ¡.01 .01 ¡.03�� ¡.03�� .01�
Age ¡.02�� .03�� .06�� .05�� .04�� ¡.07�� ¡.09�� ¡.18�� ¡.00 .11��
TIVI
Extraversion .04�� .10�� .18�� .03� .12�� .33�� .30�� .17�� .34�� .06��
Agreeableness .21�� .13�� .43�� .26�� .04�� ¡.06�� .02 ¡.23�� ¡.34�� ¡.01Conscientiousness .21�� .09�� .05�� ¡.03� .00 ¡.07�� ¡.11�� .10�� .16�� .52��
Emotional Stability .06�� .04�� .00 ¡.02 .05�� .14�� .05�� ¡.05�� ¡.02 ¡.00Openness ¡.09�� ¡.05�� .11�� .11�� .30�� .18�� .03� ¡.02 .00 ¡.06��
Conservatism .22�� .33�� ¡.01 ¡.21�� ¡.09�� ¡.04�� ¡.04�� ¡.01 .03�� .10��
Religiosity .27�� .59�� .17�� .01 ¡.02� ¡.01 ¡.06�� ¡.06�� .01 .10��
Income level ¡.00 ¡.03�� ¡.03�� ¡.05�� .01 ¡.01 ¡.03�� .08�� .08�� .03��
Education level .01 .03�� ¡.03�� ¡.03�� .01 ¡.05�� ¡.07�� ¡.04�� .02�� .05��
Gender .03�� .04�� .04�� .04�� ¡.01 ¡.03�� .00 ¡.02� ¡.02�� .04��
Age .01 .03�� .05�� .04�� .04�� ¡.09�� ¡.08�� ¡.18�� ¡.03�� .11��
Note. COD Conformity; TRD Tradition; BED Benevolence; UND Universalism; SDD Self-direction; STD Stimulation; HED Hedonism; ACD Achievement; POD Power; SED Secu-rity; PVQ–40D 40-item Portrait Values Questionnaire; PVQ–21D 21-item Portrait Values Questionnaire; TwIVID Twenty Item Values Inventory; TIVID Ten Item Values Inventory.Terms shown in bold italics indicate a conflict with predicted correlations. Terms shown in bold indicate consistency with predicted relationships. Nonbolded numbers indicate thatno predictions weremade about those correlations.
�p < .01. ��p < .001.
8 SANDY, GOSLING, SCHWARTZ, KOELKEBECK

study to establish the test–retest reliability of the two new pro-posed measures (the TIVI and the TwIVI).
Participants and method
Two samples (one for the TIVI and one for the TwIVI) of partici-pants were assessed twice, with a 2-week interval between assess-ments. Data were again collected via Amazon’s Mechanical Turk.One hundred and fifteen participants took the TIVI at Time 1 and76 of them were available to retake it at Time 2. One hundred andtwenty-one participants took the TwIVI at Time 1 and 46 of themwere available to retake it at Time 2. Demographic variables werenot collected for this sample.
Table 6. Convergent and discriminant validity with the full PVQ–40 in validation sample.
Scales CO TR BE UN SD ST HE AC PO SE
PVQ–40
Conformity 1Tradition .62�� 1Benevolence .36�� .27�� 1Universalism .24�� .15�� .72�� 1Self–direction .07�� ¡.05�� .69�� .67�� 1Stimulation ¡.05�� ¡.07�� .45�� .45�� .59�� 1Hedonism .05�� ¡.09�� .47�� .42�� .57�� .61�� 1Achievement .15�� ¡.09�� .30�� .26�� .49�� .41�� .45�� 1Power ¡.06�� ¡.17�� ¡.26�� ¡.25�� ¡.09�� .07�� .09�� .44�� 1Security .49�� .34�� .30�� .28�� .25�� .08�� .22�� .36�� .17�� 1
TwIVI
Conformity .93�� .59�� .34�� .21�� .07�� ¡.02�� .07�� .17�� ¡.02�� .47��
Tradition .49�� .82�� .06�� ¡.10�� ¡.23�� ¡.14�� ¡.16�� ¡.05�� .06�� .28��
Benevolence .33�� .23�� .95�� .70�� .66�� .43�� .46�� .30�� ¡.23�� .28��
Universalism .20�� .10�� .65�� .91�� .60�� .38�� .40�� .24�� ¡.22�� .23��
Self–direction .06�� ¡.04�� .67�� .67�� .94�� .58�� .52�� .43�� ¡.13�� .19��
Stimulation ¡.08�� ¡.08�� .40�� .41�� .56�� .95�� .53�� .38�� .07�� .05��
Hedonism .09�� ¡.02�� .55�� .49�� .62�� .65�� .95�� .43�� ¡.01 .22��
Achievement .12�� ¡.10�� .12�� .09�� .30�� .29�� .34�� .92�� .51�� .33��
Power ¡.03�� ¡.09�� ¡.13�� ¡.14�� .01 .10�� .07�� .41�� .91�� .16��
Security .40�� .29�� .14�� .16�� .11�� .01 .07�� .24�� .20�� .84��
TIVI
Conformity .76�� .54�� .43�� .28�� .18�� .11�� .17�� .17�� ¡.07�� .42��
Tradition .38�� .71�� .13�� ¡.04�� ¡.13�� ¡.06�� ¡.15�� ¡.07�� ¡.01� .19��
Benevolence .32�� .24�� .90�� .67�� .62�� .41�� .42�� .28�� ¡.22�� .27��
Universalism .19�� .08�� .66�� .83�� .62�� .37�� .40�� .26�� ¡.23�� .20��
Self–direction .12�� .00 .68�� .67�� .89�� .53�� .51�� .43�� ¡.15�� .23��
Stimulation ¡.16�� ¡.09�� .18�� .19�� .31�� .81�� .39�� .26�� .16�� ¡.05��
Hedonism .03�� ¡.04�� .45�� .39�� .51�� .60�� .89�� .36�� .02�� .16��
Achievement .13�� ¡.10�� .12�� .08�� .25�� .26�� .33�� .85�� .47�� .27��
Power ¡.01� ¡.07�� ¡.25�� ¡.26�� ¡.15�� ¡.02� ¡.03�� .31�� .86�� .12��
Security .31�� .23�� .12�� .10�� .09�� ¡.01 .02�� .18�� .15�� .60��
PVQ–21
Conformity .86�� .53�� .06�� ¡.03�� ¡.19�� ¡.23�� ¡.15�� .05�� .07�� .39��
Tradition .59�� .81�� .26�� .19�� .04�� ¡.07�� .01 .00 ¡.14�� .38��
Benevolence .33�� .23�� .95�� .70�� .71�� .45�� .49�� .34�� ¡.21�� .30��
Universalism .21�� .11�� .74�� .95�� .71�� .46�� .44�� .28�� ¡.26�� .25��
Self–direction .03�� ¡.06�� .64�� .62�� .95�� .57�� .56�� .45�� ¡.07�� .20��
Stimulation ¡.08�� ¡.08�� .40�� .41�� .56�� .95�� .53�� .38�� .07�� .05��
Hedonism ¡.01 ¡.12�� .34�� .31�� .44�� .54�� .96�� .40�� .15�� .17��
Achievement .14�� ¡.11�� .29�� .23�� .44�� .35�� .44�� .92�� .38�� .29��
Power ¡.05�� ¡.17�� ¡.36�� ¡.34�� ¡.22�� ¡.04�� .04�� .36�� .94�� .14��
Security–21 .45�� .30�� .19�� .15�� .11�� ¡.06�� .16�� .26�� .14�� .83��
Note. CO D Conformity; TRD Tradition; BE D Benevolence; UN D Universalism; SDD Self-direction; ST D Stimulation; HE D Hedonism; AC D Achievement; PO D Power;SE D Security; PVQ–40 D 40-item Portrait Values Questionnaire; TwIVI D Twenty Item Values Inventory; TIVI D Ten Item Values Inventory; PVQ–21 D 21-item PortraitValues Questionnaire. The numbers along the diagonal reflect convergent validity—or the correlations between the PVQ–40 and each other scale. The numbers on theupper diagonal reflect the correlations between the PVQ–40 values and the values computed by each other scale. The lower diagonal reflects discriminant validity—orthe intercorrelations within each scale. Only the lower diagonal for the PVQ–40 correlations is reported because the numbers mirror the upper diagonal.
�p < .01. ��p < .001.
Table 7. Test–retest correlations for TwIVI and TIVI.
Value TwIVI TIVI
Conformity .65 .70Tradition .58 .79Benevolence .69 .73Universalism .81 .60Self-direction .77 .60Stimulation .71 .64Hedonism .76 .60Achievement .51 .68Power .66 .62Security .53 .67M .67 .66
Note. TwIVI D Twenty Item Values Inventory; TIVI D Ten Item Values Inventory. Allcorrelations were significant at p < .001.
SHORT VALUES MEASURE 9

Results
Test–retest correlations for both the TwIVI andTIVI can be seen inTable 7. Correlations for the TwIVI ranged from .51 to .81(M D .67). Correlations for the TIVI ranged from .60 to .79 (M D.66). These results are in line with similarly abbreviated personalitymeasures (e.g., Gosling et al., 2003). Additionally, in the case of thePVQ–40, Schwartz et al. (2001) reported 2-week test–retest correla-tions ranging from .66 to .88 (MD .81) and Bardi, Lee, Hofmann-Towfigh, and Soutar (2009) reported 9-month test–retest correla-tions ranging from .58 to .68 (MD .63).
Given the importance of value priorities in predictingbehavior, profile stability coefficients—or the relative stabilityof the value priorities from Time 1 to Time 2—were com-puted (Schwartz & Bardi, 2001). These coefficients were cal-culated by averaging the intraindividual correlations for theTwIVI and TIVI. The stability coefficient for the TwIVI was.86 (SD D .15) and slightly lower at .77 (SD D .31) for theTIVI.
Discussion
Our goal was to develop psychometrically sound brief (20-item)and ultrabrief (10-item) measures of values. We evaluated theinstruments’ convergent and discriminant validities, reliabilities,and external correlations. The TwIVI outperformed the PVQ–21in almost every area of psychometric evaluation. As expected, thelonger measures outperformed the 10-item measure (TIVI). All ofthe new measures met a satisfactory standard of reliability andvalidity. Additionally, all of the measures were able to almostcompletely reproduce the pattern of predicted relationships withexternal variables.
We wanted to develop measures that made direct cross-instrument comparisons possible, with the ultrabrief measurebeing a subset of the brief measure, and the brief measure beinga subset of the PVQ–40. Our psychometric analyses allowed usto achieve this goal, with the TIVI being completely subsumedby the TwIVI. Specifically, in four cases (at the item-selectionphase), there were two candidate items with virtually identicalpsychometric properties, so we chose the ones that wouldensure cross-instrument overlap. The online supplementalAppendices present the TIVI and the TwIVI along with theirscoring instructions. Normative data (calculated from theMytype.com data) for the two new measures can be found inonline supplemental Tables S.6 and S.7.
Of the two measures, we recommend using the TwIVI overthe TIVI for six reasons. First, the TwIVI has slightly superiorpsychometric properties (see Table 1 and online supplementalTables S.1 and S.2). Second, the TwIVI more successfully recap-tures predicted relationships between values and external varia-bles. Third, the TwIVI comes closer than the TIVI toduplicating the value hierarchy of the PVQ–40. Fourth, the twoitems on each scale allow researchers to undertake rudimentarychecks for random responding and other rating nuisances andto compute indexes of internal consistency (although research-ers are warned against relying too heavily on such measures;see McCrae, Kurtz, Yamagata, & Terracciano, 2011). Fifth, theTwIVI offers greater content validity because there are twoitems measuring each dimension instead of one. The TIVIremains a viable option for researchers extremely short on
time, questionnaire space, or both. Our results showed that,even with a lower internal consistency, the TIVI maintainsequally high test–retest reliabilities as the TwIVI.
Limitations and future directions
A number of limitations with this study should be noted. First,our test–retest sample was relatively small and, therefore, gen-eralizability of these findings is limited. Second, our sampleswere heavily U.S.-based and collected via a Facebook applica-tion; future research should examine these scales in a broadersample of countries and using a broader array of assessmentmethods. Additionally, we were unable to collect nationalityinformation on participants in the test–retest study. This limitsthe generalizability of those findings. Third, the emphasis on adata-driven approach resulted in the selection of some itemsthat suffer from low face validity. For example, the single itemassessing tradition in the TIVI was, “Religious belief is impor-tant to him/her. S/he tries hard to do what his/her religionrequires,” which would appear to miss nonreligious peoplehigh on tradition. Nonetheless, we retained such items becausethe analyses clearly showed them to have the strongest conver-gent validity with the PVQ–40 scales; had we abandoned ourdata-driven decisions for these items, we would be compelledto do so for all the scales, unhitching us from a key strength ofthis work.
Finally, the TwIVI sometimes suffered from low internalconsistency. As previously noted, however, we view this moreas an apparent limitation than a genuine limitation, becauseresearchers should not rely too heavily on measures of inter-nal consistency when it comes to evaluating the efficacy ofabbreviated measures. To attenuate for the bias in alpha reli-abilities, they should put more weight on other forms of reli-ability (e.g., test–retest) and validity (e.g., convergent, externalcorrelates).
Funding
The work of Shalom H. Schwartz on this article was done within theframework of the Basic Research Program at the National Research Uni-versity Higher School of Economics (HSE) that was supported by the Gov-ernment of the Russian Federation for the implementation of the GlobalCompetitiveness Program.
References
Bardi, A., Lee, J. A., Hofmann-Towfigh, N., & Soutar, G. (2009). The struc-ture of intraindividual value change. Journal of Personality and SocialPsychology, 97, 913–929.
Bardi, A., & Schwartz, S. H. (2003). Values and behavior: Strength andstructure of relations. Personality & Social Psychology Bulletin, 29,1207–1220.
Buss, A. H. (1989). Personality as traits. American Psychologist, 44, 1378–1388.
Bilsky, W., Janik, M., & Schwartz, S. H. (2011). The structural organizationof human values—Evidence from three rounds of the European SocialSurvey (ESS). Journal of Cross-Cultural Psychology, 42, 759–776.
Boer, D., Fischer, R., Strack, M., Bond, M. H., Lo, E., & Lam, J. (2011). Howshared preferences in music create bonds between people: Values as themissing link. Personality & Social Psychology Bulletin, 37, 1159–1171.
Buhrmester, M., Kwang, T., & Gosling, S. D. (2011). Amazon’s MechanicalTurk: A new source of inexpensive, yet high-quality, data? Perspectiveson Psychological Science, 6, 3–5.
10 SANDY, GOSLING, SCHWARTZ, KOELKEBECK

Caprara, G. V., Vecchione, M., & Schwartz, S. H. (2009). Mediational roleof values in linking personality traits to political orientation. AsianJournal of Social Psychology, 12, 82–94.
Cronbach, L. J., & Meehl, P. E. (1955). Construct validity in psychologicaltests. Psychological Bulletin, 52, 281–302.
Dollinger, S. J., & Kobayashi, R. (2003). Value correlates of collegiate alco-hol abuse. Psychological Reports, 93, 848–850.
Fischer, R., & Boer, D. (2015). Motivational basis of personality traits: Ameta-analysis of value-personality correlations. Journal of Personality,83, 491–510.
Gosling, S. D., & Mason, W. (2015). Internet research in psychology.Annual Review of Psychology, 66, 877–902.
Gosling, S. D., Rentfrow, P. J., & Swann, W. B. (2003). A very brief measureof the Big-Five personality domains. Journal of Research in Personality,37, 504–528.
Grunert, S., & Juhl, H. (1995). Values, environmental attitudes, and buyingof organic foods. Journal of Economic Psychology, 16, 39–62.
Haslam, N., Whelan, J., & Bastian, B. (2009). Big Five traits mediate associ-ations between values and subjective well-being. Personality and Indi-vidual Differences, 46, 40–42.
Hofstee, W. K. B. (1984). What’s in a trait: Reflections about the inevitabil-ity of traits, their measurement, and taxonomy. Personality Psychologyin Europe, 1, 75–81.
John, O. P., Donahue, E. M., & Kentle, R. L. (1991). The Big Five Inven-tory—Versions 4a and 54. Berkeley, CA: University of California, Ber-keley, Institute of Personality and Social Research.
McAdams, D. P. (1995). What do we know when we know a person? Jour-nal of Personality, 63, 365–396.
McAdams, D. P., & Pals, J. L. (2006). A new Big Five: Fundamental princi-ples for an integrative science of personality. American Psychologist, 61,204–217.
McCrae, R. R., Kurtz, J. E., Yamagata, S., & Terracciano, A (2011). Internalconsistency, retest reliability, and their implications for personalityscale validity. Personality and Social Psychology Review, 15, 28–50.
Minshew, N. J., Turner, C. A., & Goldstein, G. (2005). The application ofshort forms of the Wechsler Intelligence Scales in adults and childrenwith high functioning autism. Journal of Autism and DevelopmentalDisorders, 35, 45–52.
Nunnally, J. C. (1978). Psychometric theory (2nd ed.). New York, NY:McGraw-Hill.
Parks, L. (2007, April). Personality and values: A meta-analysis. Paper pre-sented at the Society of Industrial and Organizational Psychologyannual conference, New York, NY.
Parks-Leduc, L., Feldman, G., & Bardi, A. (2015). Personality traits andpersonal values: A meta-analysis. Personality and Social PsychologyReview, 19, 3–29.
Paulhus, D. L., & Bruce, M. (1992). The effect of acquaintanceship on thevalidity of personality impressions: A longitudinal study. Journal ofPersonality and Social Psychology, 63, 816–824.
Piurko, Y., Schwartz, S. H., & Davidov, E. (2011). Basic personal values andthe meaning of left-right political orientations in 20 countries. PoliticalPsychology, 32, 537–561.
Robins, R. W., Hendin, H. M., & Trzesniewski, K. H. (2001). Measuringglobal self-esteem: Construct validation of a single-item measure andthe Rosenberg Self-Esteem Scale. Personality and Social Psychology Bul-letin, 27, 151–161.
Robins, R. W., Trzesniewski, K. H., Tracy, J. L., Gosling, S. D., & Potter, J.(2002). Global self-esteem across the life span. Psychology and Aging,17, 423–434.
Roccas, S., Sagiv, L., Schwartz, S. H., & Knafo, A. (2002). The Big Five per-sonality factors and personal values. Personality and Social PsychologyBulletin, 28, 789–801.
Rokeach, M. (1973). The nature of human values. New York, NY: The FreePress.
Sagiv, L., & Schwartz, S. H. (2004). Values, intelligence and client behaviorin career counseling: A field study. European Journal of Psychology ofEducation, 19, 237–255.
Sandy, C. J., Gosling, S. D., & Koelkebeck, T. (2014). Psychometric com-parison of automated versus rational methods of scale abbreviation: Anillustration using a brief measure of values. Journal of Individual Differ-ences, 35, 221–235.
Saroglou, V., Delpierre, V., & Dernelle, R. (2004). Values and religiosity: Ameta-analysis of studies using Schwartz’s model. Personality & Individ-ual Differences, 37, 721–734.
Schultz, P., & Zelezny, L. C. (1998). Values and proenvironmental behav-ior: A five-country survey. Journal of Cross-Cultural Psychology, 29,540–558.
Schwartz, S. H. (1992). Universals in the content and structure of values:Theoretical advantages and empirical tests in 20 countries. In M. P.Zanna (Ed.), Advances in experimental and social psychology (Vol. 25,pp. 1–65). New York, NY: Academic Press.
Schwartz, S. H. (2003). A proposal for measuring value orientations acrossnations. In Questionnaire development report of the European SocialSurvey (pp. 259–319). Retrieved from http://www.europeansocialsurvey.org/index.php?optionDcom_docman&taskDdoc_view&gidD126&ItemidD80
Schwartz, S. (2004). Evaluating the structure of human values withconfirmatory factor analysis. Journal of Research in Personality, 38,230–255.
Schwartz, S. H. (2006). Basic human values: An overview. Retrieved fromhttp://www.fmag.unict.it/Allegati/convegno%207-8-10-05/Schwartzpaper.pdf
Schwartz, S. H. (2010). Basic values: How they motivate and inhibit proso-cial behavior. In M. Mikulincer, & P. R. Shaver (Eds.), Prosocialmotives, emotions, and behavior: The better angels of our nature (pp.221–241). Washington, DC: American Psychological Association.
Schwartz, S. H. (2011). Values: Cultural and individual. In F. J. R. van deVijver, A. Chasiotis, & S. M. Breugelmans (Eds.), Fundamental ques-tions in cross-cultural psychology (pp. 463–493). Cambridge, UK: Cam-bridge University Press.
Schwartz, S. H., & Bardi, A. (2001). Value hierarchies across cultures: Taking asimilarities perspective. Journal of Cross-Cultural Psychology, 32, 268–290.
Schwartz, S. H., & Bilsky, W. (1987). Toward a universal psychologicalstructure of human values. Social Psychology, 3, 550–562.
Schwartz, S. H., & Bilsky, W. (1990). Toward a theory of the universal con-tent and structure of values: Extensions and cross-cultural replications.Journal of Personality and Social Psychology, 58, 878–891.
Schwartz, S. H., & Boehnke, K. (2004). Evaluating the structure of humanvalues with confirmatory factor analysis. Journal of Research in Person-ality, 38, 230–255.
Schwartz, S. H., Caprara, G. V., & Vecchione, M. (2010). Basic personalvalues, core political values, and voting: A longitudinal study. PoliticalPsychology, 31, 421–452.
Schwartz, S. H., & Huismans, S. (1995). Value priorities and religiosity infour Western religions. Social Psychology Quarterly, 58, 88–107.
Schwartz, S. H., Melech, G., Lehmann, A., Burgess, S., Harris, M., &Owens, V. (2001). Extending the cross-cultural validity of the theory ofbasic human values with a different method of measurement. Journalof Cross-Cultural Psychology, 32, 519–542.
Schwartz, S. H., & Rubel, T. (2005). Sex differences in value priorities:Cross-cultural and multi-method studies. Journal of Personality andSocial Psychology, 89, 1010–1028.
Schwartz, S. H., Sagiv, L., & Boehnke, K. (2000). Worries and values. Jour-nal of Personality, 68, 309–346.
Smith, P. B., & Schwartz, S. H. (1997). Values. In J. W. Berry, M. H. Segall,& C. Kagitcibasi (Eds.), Handbook of cross-cultural psychology (pp. 77–118). Needham Heights, MA: Allyn & Bacon.
Wei, M., Russell, D. W., Mallinckrodt, B., & Vogel, D. L. (2007).The Experiences in Close Relationship Scale (ECR) short form:Reliability, validity, and factor structure. Journal of PersonalityAssessment, 88, 187–204.
Ziegler, M., Kemper, C. J., & Kruyen, P. (2014). Short scales—Five misun-derstandings and ways to overcome them. Journal of Individual Differ-ences, 35, 185–189.
SHORT VALUES MEASURE 11