the development of a food security assessment toolkit
TRANSCRIPT
School of International and Public Affairs (SIPA) Applied Workshop in International Development
The Development of a Food Security Assessment Toolkit
Presented to
Seva Mandir, Udaipur, Rajasthan,
India May, 2008
Team Members: Annalyn Alenton Jeremy Gaskill
Kyla Levin-Russell Rahul Lahoti
Sethu Nair Valerie Wendell
Faculty Advisor: Maxine Weisgrau
I

ACKNOWLEDGEMENTS.........................................................................................................................................III
EXECUTIVE SUMMARY.......................................................................................................................................... IV
1 BACKGROUND......................................................................................................................................................1 1.1 CLIENT AGENCY ................................................................................................................................................1 1.2 PROJECT RATIONALE .........................................................................................................................................1 1.3 PROJECT OBJECTIVES AND DELIVERABLES ......................................................................................................1 1.4 FOOD SECURITY CONTEXT................................................................................................................................2
2 METHODOLOGY..................................................................................................................................................3 2.1 CONTEXTUAL RESEARCH ..................................................................................................................................3 2.2 LITERATURE REVIEW.........................................................................................................................................3 2.3 CREATION OF THE TOOLKIT PROTOTYPE..........................................................................................................3 2.4 PILOTING OF THE HOUSEHOLD SURVEY ...........................................................................................................3 2.5 FOOD SECURITY CONFERENCE AND TRAINING ................................................................................................3 2.6 FINALIZATION OF THE FOOD SECURITY TOOLKIT ............................................................................................4
3 FOOD SECURITY ASSESSMENT TOOLKIT (FSAT)..................................................................................4 3.1 MIXED METHODS APPROACH ...........................................................................................................................4 3.2 HOUSEHOLD SURVEY ........................................................................................................................................4 3.3 DISCUSSION GUIDE ............................................................................................................................................5 3.4 STRENGTHS AND LIMITATIONS OF THE PROPOSED METHODOLOGIES.............................................................5
4 PILOT OF HOUSEHOLD SURVEY ..................................................................................................................6 4.1 FINDINGS FROM HOUSEHOLD SURVEY PILOT...................................................................................................6
4.1.1 Household Consumption and Diversity...................................................................................................6 4.1.2 Coping Mechanisms .................................................................................................................................7 4.1.3 Perceptions................................................................................................................................................7 4.1.4 Income Sources.........................................................................................................................................7
4.2 DISCUSSION OF PILOT FINDINGS .......................................................................................................................8 5 RECOMMENDATIONS .......................................................................................................................................8
5.1 COMPLEMENTARY RESEARCH METHODOLOGIES: ...........................................................................................9 5.2 APPLICATION OF THE TOOLKIT..........................................................................................................................9 5.3 FOOD SECURITY SCALE .....................................................................................................................................9 5.4 TRAINING .........................................................................................................................................................10 5.5 ONGOING REFINEMENT ...................................................................................................................................10
APPENDIX I - LITERATURE REVIEW .................................................................................................................12 FOOD INSECURITY: THE NUMBERS..................................................................................................................12 FOOD SECURITY: THE EVOLUTION OF A CONCEPT ....................................................................................12 FOOD SECURITY DEFINED....................................................................................................................................14 THE SOCIAL DIMENSION OF FOOD SECURITY...............................................................................................15 THE GENDER DIMENSION OF FOOD SECURITY.............................................................................................17 MEASURING FOOD SECURITY: THE CHOICE OF INDICATORS.................................................................18 MEASURING FOOD SECURITY: METHODOLOGIES......................................................................................20 CONCLUSION .................................................................................................................................................................21
APPENDIX II – HOUSEHOLD SURVEY................................................................................................................34
APPENDIX III – DISCUSSION GUIDE ...................................................................................................................42
APPENDIX IV– GUIDELINES FOR APPLICATION OF THE HOUSEHOLD SURVEY...........................43
II

Acknowledgements
We would like to express our gratitude to the many individuals who, over the course of this project, have contributed their time, resources, support and guidance. First, we would like to thank Maxine Weisgrau, our faculty advisor at Columbia University who, from the beginning, patiently provided us with support, guidance, expertise and insights. We also wish to extend our appreciation to the staff at Seva Mandir headquarters, in particular, Neelima Khetan, S.N. Bhise, Shailendra Tiwari, Vivek Vyas, and Andres Ling for their assistance, generosity, and overall commitment to the project. We are indebted to the Seva Mandir field staff for their support and for providing constructive feedback on improving the toolkit. We are also extremely thankful for the hospitality and guidance of our village hosts and those who took part in focus groups and in the survey. In addition, we could not have conducted our household surveys without the help of Abhishek Ranwah who, as a Seva Mandir volunteer, tirelessly contributed to the translation and administration of the survey pilot. We must also extend our gratitude to Ron Samson who assisted us with our accommodations and was an endless source of encouragement. Thanks to Jenny McGill and Jackie Klopp for their leadership and for making this opportunity possible. Finally, we wish to thank Jake Rollow, whose interest and persistent questions encouraged us to reflect more deeply on the issues and ultimately, we believe, to create a better toolkit.
III
Executive Summary
Food security is an issue of critical concern in India. According to the Food and Agriculture Organization at the United Nations (FAO), India has the largest number of poor, food-insecure people in the world. Around 360 million people consume less than 80% of their minimum energy requirements, with women, children, the rural poor, lower-caste, and tribal populations disproportionately affected. These conditions, meanwhile, continue to worsen as world food prices increase.
Seva Mandir operates in the southern part of Rajasthan, one of the least developed states in India. The rural areas where Seva Mandir works are characterized by degraded, over-exploited soils and recurrent vulnerability to drought, and are categorized as severely food insecure.1 The majority of the population the organization serves depends on subsistence agriculture, small-scale animal husbandry, and low-wage labor, making food security an ongoing challenge for many households. At the request of Seva Mandir, a team of six Columbia University graduate students developed a Food Security Assessment Toolkit. This toolkit assists Seva Mandir to (1) conduct an initial assessment of the food security situation in the villages where they operate; (2) explore the factors both directly and indirectly impacting villagers’ food security situation; and (3) identify changes in food security conditions over time. Seva Mandir can use this toolkit to begin to evaluate the effectiveness of existing projects with respect to food security, as well as create new interventions to better address the needs of their constituents.
What is Food Security?
Our team's working definition of food security is "secure access to sufficient food at all times." Within this definition, however, there are social and gender dimensions that must be considered when attempting to understand individuals' and households' experiences of food security. Because experiences of food security vary, and the means of acquiring food and coping with food shortage will differ from one context to another, indicators of food security must be deeply relevant to local contexts. In addition, there is a range of methodologies that can be used to collect information on food security, including participant observation, household surveys, and secondary data analysis. Selecting context-specific and appropriate indicators of food security, along with choosing a useful methodology or mix of methodologies, is crucial to an effective assessment of food security.
Food Security Assessment Toolkit (FSAT)
The Food Security Assessment Toolkit (FSAT) our team developed for Seva Mandir represents a mixed-methods approach to understanding food security and has two principal components: a household survey instrument that is administered by a trained interviewer, and a discussion guide that is used seasonally at Seva Mandir community meetings. Because of the variety of dimensions to food security, we decided that the most comprehensive tool is one that combines a quantitative measurement with a qualitative and more participatory method. The household survey consists of 31 questions, which capture a range of indicators that are relevant to the villages where Seva Mandir works. These indicators can be loosely
1 Food Insecurity Atlas of Rural India, 2004
IV
grouped into the following three categories: household consumption and diversity, coping mechanisms and perceptions. The discussion guide provides the opportunity for dialogue and information exchange on the issue of food security among Seva Mandir staff and village representatives. In addition, the guide is useful for understanding causal processes and regional events that may affect village-level food security, and includes questions designed to provide information on the overall conditions in agriculture, markets, and employment.
Findings from Household Survey Pilot
Our team piloted the household survey component of the toolkit in 31 households across three villages in Udaipur, Rajasthan. Our major findings from the pilot are the following:
• Overall, food security among surveyed households is low. Based on the initial rankings of the households, almost two-thirds are food insecure. Food diversity among all households in the sample is very poor. More than a third of the households have to resort, at times, to skipping meals or reducing portion size due to scarcity of food. Migration and borrowing for food are prevalent in our sample. Household members tend to worry at least 2-3 months during the year about having enough food.
• Even with inefficiencies in service delivery, government schemes have had a large and positive impact on food security in this region. The National Rural Employment Guarantee Scheme provides labor income, which helps households purchase food. The Public Distribution System provides food at subsidized prices to many households in the villages. The Mid-Day Meal Scheme in schools provides the most nutritious and diverse meal of the day to children attending schools. The Anganwadi's provide supplementary nutrition to children under the age of 6.
• Common property resources, like forests and water sources, play a significant role in enhancing food security at the household level.
Overview of Strengths and Limitations of FSAT Methodologies
Survey Component
Strengths
• Can be administered on a large scale • Produces information which can be generalized • Data is easily aggregated and synthesized • Can be subjected to statistical analysis • Can produce accurate estimates of the impact of interventions • Produces detailed information on household circumstances over a one year period
Weaknesses
• Does not capture complex processes • Does not effectively capture causal processes • Does not measure differences in experiences among household members based on
gender, age, employment status, and other factors • Does not necessarily capture unexpected events • Dependent on respondent's recall of events over past year • Time and resource intensive
V

Discussion Guide Component
Strengths • Requires very few additional resources • Provides opportunity to gather information pertaining to several villages at one time • If applied seasonally, as recommended, can capture fluctuations within a one-year
cycle • Fosters dialogue among village representatives and Seva Mandir staff
Weaknesses
• Captures only perspectives and insights provided by community representatives (and therefore may not reflect the diversity of experiences within a single village)
• Data is not easily collected and synthesized (though there is the potential to tape record and transcribe discussions)
• Relies heavily on the accuracy of community representatives perceptions of circumstances
• Requires a somewhat skilled moderator to carry forth the discussion
VI

1 Background
1.1 Client Agency
Where there is sorrow, where there is poverty and oppression, where man is inhuman to man, where there is the darkness of ignorance, it is here Seva Mandir must reach out. - Dr. Mohan Sinha Mehta (1895-1985) Founder, Seva Mandir Seva Mandir was established in the Udaipur district of Rajasthan, India, in 1968 to address the widespread poverty and deprivation affecting the rural, primarily tribal, communities throughout the region. Central to its work is the philosophy that the development process must begin with and be driven by communities themselves.
The region where Seva Mandir operates is characterized by moderate to low rainfall (400-600 mm/year), severe variations in temperature (4-48 C), and a terrain generally depleted of natural resources. The approximately 600 rural villages in the region depend on subsistence agriculture, small-scale animal husbandry, and low-wage labor. Ongoing social and political marginalization, as well as the absence of economic opportunities, leaves these communities facing widespread livelihood insecurity. Moreover, levels of illiteracy, malnutrition, and infant and maternal mortality remain among the highest in the country.
Seva Mandir’s interventions span the areas of natural resource management, primary and continuing education, healthcare, women's empowerment, child development, alternative income-generating activities, and village-level institution-building.
1.2 Project Rationale
This region’s vulnerability to drought and its degraded and over-exploited soils means that achieving food security over the course of a year – and across multiple years – becomes an ongoing challenge for many households. In order for Seva Mandir to better understand and address the needs of its constituents, it is important that they assess and monitor the food security situation in the villages where they operate.
1.3 Project Objectives and Deliverables
The FSAT that we developed, in addition to providing context-specific indicators, captures the nuanced dimensions of food security and enables Seva Mandir to assess and monitor food security in villages. More specifically, this toolkit assists Seva Mandir to (1) conduct an initial assessment of the food security situation in the villages where they operate; (2) explore the factors both directly and indirectly impacting the food security situation of villagers; and (3) identify changes in the food security situation over time.
In addition to collecting relevant indicators and developing the FSAT, we provided Seva Mandir with a comprehensive review of the literature on food security to supplement their own research on the subject (Appendix I). We conducted a pilot of the survey component of the toolkit and presented these findings at a food security conference hosted by Seva Mandir. We also provided Seva Mandir with training on application of the survey component (Appendix IV).
1

1.4 Food Security Context
The Food and Agriculture Organization at the United Nations (FAO) has identified India as having the largest number of poor, food-insecure people in the world. Around 360 million people consume less than 80% of their minimum energy requirements, with women, children, the rural poor, lower-caste, and tribal populations disproportionately affected.2 India’s abundant food grain reserves since the time of the Green Revolution indicate that household food insecurity is not the result of a national food shortage, but of poor distribution and governance. More disconcerting is the evidence that, although poverty is decreasing in India, household-level food insecurity for the poorest and most vulnerable households has been increasing.3 Our field research shows that most rural households in the Udaipur district rely on a combination of subsistence farming, low-wage labor, and government programs to meet their families' minimum food consumption requirements. Indicators of the food security situation of these households are therefore tied primarily to the availability and quality of land-based resources, access to employment, and participation in government schemes. The size and quality of the land cultivated by a household directly affects the amount and variety of food available for consumption. Because water is scarce throughout most of the year, and the region is prone to droughts, whether a household has access to irrigation facilities represents another key factor in determining the size of the harvest, the number of crop cycles in one year, and the variety of crops produced. Due to the lack of employment opportunities in the rural areas, and the inability of households to subsist on agriculture alone, temporary migration to Udaipur city and to the cotton fields of northern Gujarat is common. Migration generally occurs right after plowing the fields, and the migration period is lasts 1-3 months, depending on the quality of employment encountered. (The more stable and well-paying the employment, the longer villagers will choose to stay away from home.) Finally, a number of national government initiatives are currently attempting to address poverty and food insecurity in India. Many of these government programs operate in the Udaipur district and seek both directly and indirectly to improve food security through the following means: providing prepared food to infants and children, providing foodstuffs to households at reduced prices, and securing a minimum income to households through guaranteed employment. Food security in the communities where Seva Mandir works is related, in part, to the quality of these programs and the extent to which villagers can access them. When the food supply is threatened, villagers in this region employ a variety of strategies to mitigate potential food shortage. The particular strategies that a household employs can offer insight into the severity of the crisis. Collecting and selling firewood in local markets and borrowing food from other villagers reflect less dire circumstances than the mortgaging or selling of livestock, ornaments, or land (the latter being viewed as the ultimate sacrifice). Migration, in circumstances of food shortage, may also be a strategy to mitigate risk and vulnerability.
2 Kaspersma, 2007. 3 ibid
2

2 Methodology
In the following section, we discuss the steps our team took in developing the FSAT. Our work was conducted over the course of six months, from December 2007 to May 2008.
2.1 Contextual Research
In January 2008, two team members traveled to Udaipur, where they spent two weeks discussing and collecting potential food security indicators. The purpose of the fieldwork was two-fold: to gain an understanding of the context in which Seva Mandir operates, and to gather indicators of food security that are relevant to these communities. With the help of a translator, four focus groups were conducted in two villages: Shampura (a village that had received significant Seva Mandir intervention) and Tumdar (a village which had not received any Seva Mandir intervention). Villagers were recruited by a field assistant living in the area, and the size of the focus groups ranged from eight to fifteen participants. In each village, focus groups were conducted with men and women separately. In addition, eight key stakeholder interviews were conducted. Those interviewed include two Panchayat members, a local community-level committee leader, two block-level leaders, a Seva Mandir health program coordinator, a Seva Mandir natural resource development coordinator, and Seva Mandir’s General Secretary.
2.2 Literature Review
At the outset of the project, we initiated a review of existing literature on food security. The literature review discusses the evolution of dialogue around the issue of food security. It presents current consensus on the topic, while seeking to maintain a balance between the universal with the local, and the theoretical with the operational (Appendix I).
2.3 Creation of the Toolkit Prototype
Based on information gathered from the January fieldwork and our review of the literature, we began to develop the FSAT. We designed a household survey component consisting of 20 questions. To complement information obtained through the survey, we designed a discussion guide to use at Seva Mandir's community meetings, where staff and village representatives convene.
2.4 Piloting of the Household Survey
Four team members traveled to Udaipur in March 2008 to further refine these research instruments. With the assistance of a translator and two field assistants, they piloted the household survey with 31 households in the villages of Madla, Jamun, and Umaria over a period of three days.
2.5 Food Security Conference and Training
Food Security Conference: Towards the end of the March fieldwork, we participated in a conference with Seva Mandir staff, various NGO representatives, and two national-level food security experts. At the conference, we presented the toolkit and initial findings from the survey pilot, and received feedback from conference participants.
3

Seva Mandir Staff Training: Following the conference, we conducted a training of block level Seva Mandir employees on the administration of the survey. This presented us with further opportunity to receive comments and suggestions on the survey instrument.
2.6 Finalization of the Food Security Toolkit
After returning to New York in March 2008, we continued to improve the toolkit. Based on information gleaned from the pilot, as well as feedback received at the conference and training, we refined the toolkit to enhance ease of use, validity of measurements, as well as promote a more participatory approach.
3 Food Security Assessment Toolkit (FSAT)
3.1 Mixed Methods Approach
FSAT represents a mixed-methods approach to understanding food security and has two principal components: a household survey instrument that is administered by a trained interviewer to a select household member (Appendix II), and a discussion guide that is used at Seva Mandir community meetings (Appendix III). Because of the variety of dimensions to food security, we determine that the most comprehensive tool is one that combines a quantitative measurement with a qualitative and more participatory approach. 3.2 Household Survey
The household survey is designed to provide Seva Mandir with the opportunity to collect comparable data from large numbers of people, conduct statistical analyses of the information, and generalize results to a larger population. It is important to keep in mind, however, that accurate representation of the larger population depends on the sampling frame and on how individual households are selected for inclusion in the survey (Appendix IV). The household survey can be used to gather baseline data, as well as monitor the food security situation over time. In order to be an effective tool for monitoring, the survey should be administered on at least an annual basis, as survey respondents are generally asked to provide information on their experiences in the preceding year. The survey itself consists of 31 questions. The questions capture a range of indicators, most of which can be loosely grouped into the following three categories: household consumption and diversity, coping mechanisms, and perceptions. In addition, the survey gathers information on demographics, household composition, income, and assets. Food Consumption & Diversity Indicators We capture food consumption by asking the average number of meals consumed daily in each of the three seasons. Food diversity, which has been found to be strongly correlated with caloric intake and food security, is captured by asking about consumption in the past month of a range of different foods.5 Coping Mechanisms When a household is food insecure it may resort to various coping strategies. These strategies include decreasing or skipping meals, borrowing food and/or money,
4

mortgaging and/or selling assets, and distress migration. We thus include a number of questions assessing which, if any, of these strategies a household has engaged in over the past year. Capturing coping mechanisms is a reliable technique to predict the level of food security, since they reflect behaviors associated with food scarcity. Perceptions In order to capture individuals' perceptions of their household's food security we include a question about food-related worry over the past year. We also inquire about the perceived major obstacles to accessing adequate food. Additional Indicators Income and asset questions are asked in order to get a sense of household vulnerability to various shocks; the more stable the sources of income or the more assets the household owns, the more food secure they may be. The survey is designed so that most questions are closed response, a format we arrived at in consultation with Seva Mandir's field staff. Pilot results suggest that the survey should take approximately 20-25 minutes to administer per household. 3.3 Discussion Guide
The discussion guide is administered at community meetings to gather information about the food security status of multiple villages, and monitor changes in the situation that may occur over time. The guide also acts as an early warning system for potential food security shocks. It is useful for understanding causal processes and region-level events, and includes questions about crop conditions, food prices, the performance of food-related government schemes, and coping patterns. It encourages ongoing dialogue and exchange around issues of food security, including strategies for mitigating risks and vulnerabilities. We recommend that the discussion guide be used seasonally (3 times per year), in order to effectively monitor changes that occur over the course of the year.
3.4 Strengths and Limitations of the Proposed Methodologies
In order to apply the tool effectively, it is important to understand the comparative strengths and limitations of each component of the tool.
Survey Component
Strengths
• Can be administered on a large scale • Produces information which can be generalized • Data is easily aggregated and synthesized • Can be subjected to statistical analysis • Can produce accurate estimates of the impact of interventions • Produces detailed information on household circumstances over a one year period
Weaknesses It is important to acknowledge that one key weakness of the survey instrument is that, as a household measure, it does not offer insight into the intra-household distribution of food, nor
5
does it effectively capture the diversity of experiences within a household related to gender, age, employment status, and other "group" differences. Other weaknesses include that the survey:
• Does not capture complex processes • Does not effectively capture causal processes • Does not necessarily capture unexpected events • Depends on respondent's recall of events over past year • Is time and resource intensive
Discussion Guide Component
Strengths • Requires very few additional resources • Provides opportunity to gather information pertaining to several villages at one time • If applied seasonally, as recommended, can capture fluctuations within a one-year
cycle • Fosters dialogue among village representatives and Seva Mandir staff
Weaknesses
• Captures only perspectives and insights provided by community representatives (and therefore may not reflect the diversity of experiences within a single village)
• Data is not easily collected and synthesized (though there is the potential to tape record and transcribe discussions)
• Relies heavily on the accuracy of community representatives perceptions of circumstances
• Requires a somewhat skilled moderator to carry forth the discussion
4 Pilot of Household Survey
In March 2008, members of our team piloted the household survey component of the FSAT in 31 households across three villages. (Because of time constraints, we were unable to pilot the discussion guide.) Due to the small sample size, modifications made to survey questions over the course of the pilot, and likely inconsistencies in administration of the instrument, results can only provide initial insights into the food security situation of households surveyed. 4.1 Findings from Household Survey Pilot
4.1.1 Household Consumption and Diversity
• Most households have, on average, two meals per day. However, one household reported a daily average of only one meal.
• Most households face water scarcity in the summer for 2-3 months. They travel longer distances to collect water and reduce their water consumption during this period.
• All households use firewood as fuel for cooking. All households collect firewood from the forests.
6
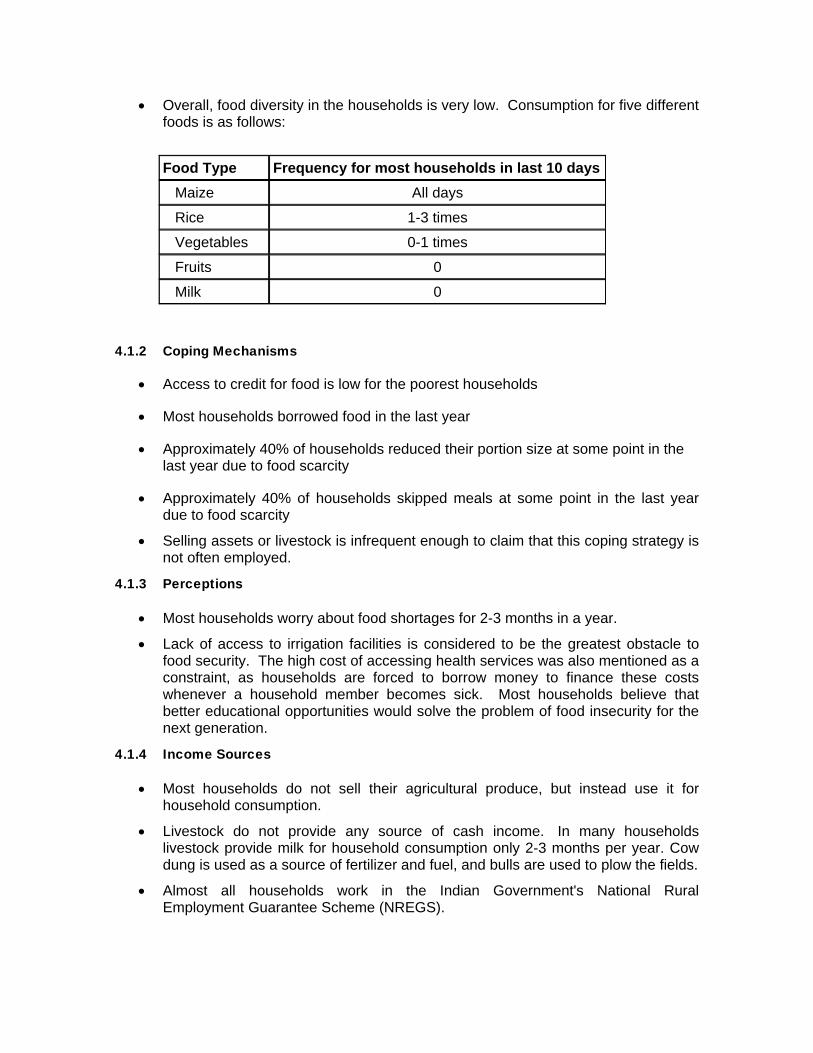
• Overall, food diversity in the households is very low. Consumption for five different foods is as follows:
Food Type Frequency for most households in last 10 days Maize All days
Rice 1-3 times
Vegetables 0-1 times
Fruits 0
Milk 0
4.1.2 Coping Mechanisms
• Access to credit for food is low for the poorest households
• Most households borrowed food in the last year
• Approximately 40% of households reduced their portion size at some point in the last year due to food scarcity
• Approximately 40% of households skipped meals at some point in the last year due to food scarcity
• Selling assets or livestock is infrequent enough to claim that this coping strategy is not often employed.
4.1.3 Perceptions
• Most households worry about food shortages for 2-3 months in a year.
• Lack of access to irrigation facilities is considered to be the greatest obstacle to food security. The high cost of accessing health services was also mentioned as a constraint, as households are forced to borrow money to finance these costs whenever a household member becomes sick. Most households believe that better educational opportunities would solve the problem of food insecurity for the next generation.
4.1.4 Income Sources
• Most households do not sell their agricultural produce, but instead use it for household consumption.
• Livestock do not provide any source of cash income. In many households livestock provide milk for household consumption only 2-3 months per year. Cow dung is used as a source of fertilizer and fuel, and bulls are used to plow the fields.
• Almost all households work in the Indian Government's National Rural Employment Guarantee Scheme (NREGS).
7
• The average daily wage received by households is in the range of Rs.50-55 despite the government’s prescribed minimum of Rs.73 for Rajasthan. On average it takes 1.5-2 months for households to receive their wages. This delay is the biggest complaint against the NREGS.
• Poor households tend to use all of the 100 days provided by the NREGS, while wealthier households tend to work less than 100 days.
• At least one member of all households migrates for work at least once a year. Most migrants traveled to Udaipur city for construction work in the past year. Some households had a member who had migrated to Gujarat in the past five years to work in the cotton fields. The duration of migration to Udaipur ranges from 10-15 days, 1-2 times per year. The average daily wage received from migration to Udaipur is around Rs.120. The duration of migration to Gujarat is, on average, a period of 2-3 months, with an average daily wage of Rs.30-Rs.50. In most households, only men migrate for work. In a few families, unmarried women also migrate.
• Permanent employment or skilled labor are not common. For the few households with skilled members (e.g., carpentry) or permanently employed members, the food security situation is markedly better.
4.2 Discussion of Pilot Findings
Overall, findings indicate that food security in the villages may be low. Based on initial rankings of surveyed households, almost two-thirds are food insecure. Food scarcity tends to be highest during the late summer and monsoon season.
With the current level of resources available, agriculture alone cannot provide the food necessary to make the average household food secure. Government schemes have had a large and positive impact on the food security of households in the sample. The NREGS provides labor income which helps households purchase food. The Public Distribution System (PDS) provides food at subsidized prices to many households in the villages. The Mid-Day Meal Scheme in schools provides the most nutritious and diverse meal of the day to children attending schools. The Anganwadi's provide supplementary nutrition to children under the age of 6. However, there are several inefficiencies in these programs, including incorrect targeting by the PDS, below minimum wage remuneration in NREGS, and poorly operating kitchens for the Mid-Day Meal Scheme, which need to be corrected.
The food security of households within the same village varies based on the location of the household. Households that are situated on more hilly terrain and are farther away from roads tend to be more food insecure.
5 Recommendations
Seva Mandir is well positioned to address the widespread food insecurity that affects the region where they operate. Due to the limitations of the Food Security Assessment Tool, which we discuss in Section 3, we recommend the following complementary activities.
8
5.1 Complementary Research Methodologies:
We believe that additional efforts should be taken to gather information about food security at the village level. Possible additional methodologies for understanding and evaluating food security, and corroborating and complementing findings from the FSAT, include:
(1) Participatory Rural Appraisal (PRA) methods, such as community mapping. A PRA approach would benefit Seva Mandir in several ways. First, the use of community mapping techniques can provide information on proximity to roads, fuel, and water sources as well as insights into the diversity of experiences among households in one village with respect to food security. Second, the use of focus groups segmented along gender, age, and caste lines would provide details about the differences in experiences across groups. Third, information gained through the PRA may be useful to cross reference findings from the FSAT. Finally, PRA activities would permit Seva Mandir to make quick preliminary assessments of a community’s food security level.
Another benefit of PRA is that this approach emphasizes local knowledge and encourages local people to make their own appraisal, analysis, and recommendations. In addition, PRA uses group exercises to facilitate dialogue and information exchange, and provides a space for a range of experiences to be expressed and new insights to be generated.
(2) Participant Observation: This approach involves spending a substantial amount of time within a singe household and observing the behaviors of all household members. This approach captures detailed and accurate information about food consumption, food diversity, intra-household distribution of food, and other observable activities related to food security.
(3) Utilization of Secondary Data: This approach involves collecting information from secondary sources, such as government agencies, NGOs, and the media. Information obtained may pertain to rainfall patterns, nutritional indicators (e.g., body mass index), and price indices.
5.2 Application of the Toolkit
The household survey can be used to gather baseline data, as well as to monitor households over time. In order to be an effective monitoring tool, the survey should be administered on a yearly basis. The discussion guide should be administered at community meetings seasonally (3 times per year).
5.3 Food Security Scale
In order to draw conclusions about household food security based on survey data, there is a need for a system of ranking. United States Department of Agriculture (USDA) employs a scale with four categories: food secure, food insecure without hunger, food insecure with
9
hunger (moderate), food insecure with hunger (severe).6 We recommend that Seva Mandir seek out or design a contextually relevant scale.
5.4 Training
We recommend that Seva Mandir provide training to the people administering the toolkit. Training should be provided in administering each component of the toolkit. We have developed guidelines for administering the household survey, which may be useful for the training (Appendix IV). 5.5 Ongoing Refinement
We recommend that Seva Mandir continuously refine the toolkit based on feedback from field-level staff and people responsible for administering the toolkit.
6 Bickel, et al., 2000.
10

References
Bickel, G., M. Nord, C. Price, W. Hamilton and J. Cook. “Guide to Measuring Household Food Security.” (Revised Ed.) In Measuring Food Security in the United States. Food and Nutrition Service. Office of Analysis, Nutrition and Evaluation. Unted States Department of Agriculture (2000). Retrieved from: < http://www.fns.usda.gov/fsec/FILES/FSGuide.pdf> (15 February, 2008). Kaspersma, J.M. Food Security Context Analysis for South Asia: Bangladesh, India, Pakistan, Nepal. Background paper for the food security situation in Kathmandu, Nepal. April 18-20, 2007. Published March 15, 2007. Retrieved from <http://www.icco.nl/delivery/icco/en/doc.phtml?p=publications> (10 December, 2007) p.45 <http://www.sevamandir.org>
Metra, A.S., A. Aggarwal-Suali, N. Ameta-Nayakheda, P. Roy-Viyal, P. Kaswan-Kojon ka guda and P. Ballabh. “An Exploration of Seva Mandir’s Work with Rural Communities and Governance Mechanisms on Land in Udaipur, Rajasthan,” In Land, Community & Governance, edited by P. Ballabh. Seva Mandir. India. (2007) p.26-28. Poorest Areas Civil Society (PACS). Implementation of Government Food and Livelihood Schemes in India’s Poorest Districts, edited by Kiran, S., Gupta, R., and Malhotra, K.C. Development Alternatives: New Delhi. (2007) p.3-5.
Seva Mandir. Seva Mandir: an Overview. India. (2007). pp. 1-5.
11
Appendix I - Literature Review
Food Security is a topic as complex as it is, at first glance, simple. In its most fundamental form, food security implies an easy calculation: calorie consumption must equal calorie expenditure if a person is to be food secure. Yet, the pathways leading to this caloric equilibrium are far from straightforward: From what foods do these calories come from? How are these foods grown, traded, accessed, and distributed throughout a planet, a country, a village, or a household? These questions lie at the heart of the literature on food security, a topic that has spurred ample debate between social scientists, agricultural scientists, policy makers, development agencies, and the citizens most affected. It is a topic that brings everyone to the table, or at least should, and it is the goal of this literature review to highlight the diverse issues and perspectives that will need to be considered when crafting any programmatic or policy response to food insecurity. FOOD INSECURITY: THE NUMBERS
At the 1996 United Nations Food and Agricultural Organization (FAO) World Food Summit, representatives from 185 countries pledged to reduce the number of food insecure individuals by half by 2015. Despite this commitment and the programs, policies and achievements it initiated, the number of food insecure people worldwide continues to rise. In 2001, an estimated 798 million people were still food insecure – a decrease of only 19 million since 1990. FAO estimates for India, in particular, reveal that the number of food insecure Indians has increased by 18 million since 1990. In aggregate, 233.3 million Indians suffered from chronic food insecurity in 2001.2
FOOD SECURITY: THE EVOLUTION OF A CONCEPT
In 1948, food security was brought to international attention by the United Nations Universal Declaration of Human Rights (UDHR), a historic act which first proposed that access to adequate food be viewed as a fundamental right. Since 1948, the "right to food" has been re-affirmed by numerous international actors and declarations, including the 1966 International Covenant on Economic, Social and Cultural Rights,3 and the 1974 World Food Conference.4 Despite this continued commitment to a rights-based approach, the international community's understanding of the concept of food security has evolved and diversified considerably since the 1970s. Three paradigm shifts, in particular, can be identified in the concept's evolution: 1) from a focus on the global and international level to a focus on the individual and household
2 Food and Agriculture Organization (FAO), “The State of Food Insecurity in the World: Monitoring Progress Towards the World Food Summit and Millennium Development Goals,” Food and Agricultural Organization (2003), retrieved from <www.fao.org/docrep/006/j0083e/j0083e00.htm> (10 February 2008). 3 United Nations, Office of the High Commissioner for Human Rights. “International Covenant on Economic, Social and Cultural Rights,” United Nations (1966), retrieved from <www.unhchr.ch/html/menu3/b/a_cescr.htm> (30 January 2008) 4 S. Maxwell. “Food Security: a post-modern perspective,” Food Policy 21 (1996), p. 155.
12
level, 2) from a food first perspective to a focus on livelihoods, 3) from the reliance on objective indicators to a recognition of the importance of subjective perception.5 During the 1970's, food security was conceptualized primarily at the macro-level, best achieved by controlling the quantity and reliability of a country's aggregate food supplies. During the 1980’s, this macro-level understanding was replaced by a focus on individual-level and household-level concepts of food security, emphasizing access, vulnerability and entitlements.6 This shift was largely influenced by the pioneering work of economist Amartya Sen. In the 1980's, Amartya Sen's writings on food "entitlements" drew the focus of food security scholarship and interventions away from issues of food supply and toward issues of food access. Sen's entitlement framework can be outlined as follows: An individual's entitlement is rooted in his/her endowment (i.e., his/her initial resource bundle) which is transformed through production and trade into commodities which may be exchanged for food. If the individual's initial resource bundle does not allow for a sufficient level of production or trade, an adequate amount of food will not be obtainable and the person will go hungry. In Sen's terminology, this individual has suffered an "entitlement failure." 7
Jeremy Swift extended Sen's framework further by focusing on the role of assets and government social safety nets in determining a household's vulnerability to famine. His analysis presents household vulnerability as being both a function of entitlement failure and asset ownership. The vulnerability of a household is determined by the level of immediate entitlement failure (i.e., a disruption in an individual's means of acquiring food) and the extent to which existing assets, or buffers, have been depleted. The asset depletion level is determined by the frequency, intensity and duration of previous entitlement failures, thus explaining the highly vulnerable status of households in regions experiencing chronic drought or political instability.8 Swift's work is largely emblematic of the second paradigm shift in the thinking on food security: the shift away from a food first perspective to that of a livelihoods perspective. This change was highly influenced by observations of the African famine of 1984/1985 which revealed that individuals and households often choose to go hungry in the short term in order to prioritize longer term livelihood security.9 As de Waal writes, "people are quite prepared to put up with considerable degrees of hunger in order to preserve seed for planting, cultivate their own fields or avoid having to sell another animal."10 Hence, food security must imply the long-term viability and sustainability of a household's ability to meet its consumption needs and must be conceptually linked to issues of poverty, low wages, poor infrastructure, and lack of access to
5 Ibid. 6 S. Maxwell & M. Smith. “Household food security: A conceptual review,” In Household Food Security: Concepts, Indicators, Measurements, edited by S. Maxwell and T. Frankenberger. United Nations Children’s Fund-International Fund for Agricultural Development: New York (1992). 7 A. Sen, Poverty and Famines: An Essay on Entitlement and Deprivation. Clarendon Press: Oxford (1981). 8 J. Swift, “Why are Rural People Vulnerable to Famines?” Institute for Development Studies Bulletin, 37 (2006), p. 63-70. 9 S. Maxwell, 1996. 10 A. de Waal, “Emergency food security in Western Sudan: What is it for?” In To Cure all Hunger: Food Policy and Food Security in Sudan, edited by S. Maxwell. Intermediate Technology, London (1991) p. 68.
13
markets, credit, land and water.11 Lastly, a shift away from a purely objective approach to food security to an approach that values subjective understandings and perceptions, has characterized recent developments in food security thinking. Objective approaches, based on measurements such as caloric intake and Body Mass Index (BMI), have proven problematic. Food quality and cultural acceptability, as well as human dignity and autonomy, cannot be captured by such objective measurements. As a result, both the Indian National Sample Survey and the U.S. Department of Agriculture have developed indicators capable of capturing subjective and highly personalized aspects of food security such as feelings and coping strategies.12
Taken as a whole, these three paradigm shifts have altered the concept of food security dramatically since the 1970s. As Maxwell writes of the concept today: "Flexibility, adaptability, diversification and resilience are key words. Perceptions matter. Intra-household issues are central. Importantly, ... food security must be treated as a multi-objective phenomenon, where the identification and weighting of objectives can only be decided by the food insecure themselves.”13 FOOD SECURITY DEFINED
Drawing from the conceptual understandings stated above, current definitions of food security consistently feature the following four elements: sufficiency, access, security, and time.14 Although specific definitions do vary across organizations and disciplines, food security may be generally understood as, "Secure Access to Sufficient Food at All Times.” Each element of this definition requires additional clarification. These details are provided below: Sufficiency Sufficiency is commonly understood and measured by the number of calories an individual requires to live an active and healthy life.15 Although daily caloric requirements for men, women and children have been estimated by nutritionists, the broad applicability of these caloric intake standards has been questioned.16 An individual's perception of his/her own hunger and the amount of food required to live an “active and healthy” life have been found to vary greatly.17 Despite these debates, food sufficiency is generally understood as the amount of food required by an individual to meet dietary energy requirements as defined by the Food and Agricultural Organization.18
11 R. Gardiner, “Towards Earth Summit 2002 Project: Briefing Paper.” Earth Summit: London (2002).
12 S. Maxwell, 1996. 13 S. Maxwell & M. Smith, 1992, p. 4. 14 FAO, 2003. 15 S. Maxwell & M. Smith, 1992. 16 K. Bagachi & S. Puri, “Food and Nutrition Security and Women.” In, Women and Food Security: The Role of Panchayats, Edited by P. Chaturvedi. Concept Publishing Company: New Delhi. (2002). 17 J. Coates, P. Webb & R.F. Houser, “Comparison of a Qualitative and a Quantitative Approach to Developing a Household Food Insecurity Scale for Bangladesh.” American Society for Nutrition: Boston (2006). 18 R. Gardiner, 2002.
14
Access Access to the means of acquiring food, whether through production, purchase or exchange, is central to contemporary definitions of food security. Human and physical capital, household assets, property resources, markets, and a variety of social contracts at the household, community and state levels, directly affect an individual’s level of access.19 Access to the means of food acquisition is highly dependent on gender biases and social forces. These dimensions of food access will be discussed in detail later in this paper. Security Security refers to the extent to which the access to the means of acquiring food is vulnerable. Vulnerability is a function of risk and insurance. Asset ownership, human and social capital, government safety nets, and the activities of non-governmental organizations (NGO's) all contribute to an individual or household's level of insurance, while variability in crop production, changes in food prices and food supply, employment, and wages all influence the risk profile.20 Time Food insecurity may be chronic, cyclic or transitory based on factors such as seasonal patterns and income regularity. Households or individuals that are continually unable, or are at risk of being unable, to meet caloric needs are categorized as chronically food insecure. Households experiencing a temporary decline in the ability to meet caloric needs are categorized as having transitory food insecurity. Households experiencing re-occurring, regularly timed periods of food insecurity (e.g., hunger seasons) are understood to be facing cyclic food insecurity.21 Together, sufficiency, access, security and time form the basis of a contemporary definition of food security. Beyond defining food security, however, it is important to recognize the multitude of forces that affect one’s experience of food security. Gender, social standing, political capital, and institutions all contribute to this experience different levels of analysis and are important dimensions of the food security concept. The social and gender dimensions, in particular, are critical within the Indian context and will be highlighted in the following sections. THE SOCIAL DIMENSION OF FOOD SECURITY
Secure access to the means of acquiring food depends heavily on the level of social disadvantage an individual, household, or community faces. The more socially disadvantaged one is, the greater the risk to one's means of acquiring food. Poverty, education, social hierarchies and discrimination all contribute to the degree of social disadvantage.22 In India, in particular, the caste system, and its ripple affect on poverty and education levels, renders certain communities and individuals considerably more disadvantaged than others. The hierarchical caste system in India is influential in determining one's access to education,
19 S. Maxwell & M. Smith, 1992 20 Ibid. 21 Ibid. 22 F. Riely, N. Mock, B. Cogill, L. Bailey & E. Kenefick. “Food Security Indicators and Framework for Use in the Monitoring and Evaluation of Food Aid Programs,” Food and Nutrition Technical Assistance. USAID, Washington D.C. (1999) p. 12-17.
15

community resources, arable land, government safety nets, and irrigation facilities.23 It is a system that, as Thorat and Lee state, "lives in tension with the legal system of the Indian state, which is based on the ideals of liberty and equality."24 While the Indian Supreme Court and the central government have taken steps to prevent caste-based discrimination, conventional caste forces often manage to manipulate or evade this progressive legal framework and its anti-discriminatory measures.25 Together, Scheduled Castes and Scheduled Tribes comprise over 24% of India's population. In Rajasthan, in particular, Scheduled Castes (SC) comprise 17.2 percent of the state's total population while Scheduled Tribes (ST) comprise 12.6 percent.26 The majority of these individuals live in remote areas with suboptimal farming lands and limited access to transportation, communication pathways, and government services.27 Barriers to obtaining productive land and irrigation technology limit the majority of SC and ST households from improving their food security situation.28 In addition, social discrimination, co-mingled with geographic and economic separation, has led to significant illiteracy rates within Rajasthan's SC and ST populations. Approximately half of these individuals living in Rajasthan are illiterate, a figure which significantly impacts the ability of the state to ensure the food security of its people.29 Education and skills training have been directly linked to the capacity of farmers to produce food. Knowledge on the management and use of environmental resources such as water and forests correlates highly to one's level of food security. Yet, training on enhanced farming techniques, biotechnology, natural resource management and market forces is often less available to the most socially isolated individuals. High levels of illiteracy, together with this lack of training opportunities, hamper the growth of both the rural non-farm and farm sectors, further eroding the long-term food and livelihood security of the most vulnerable populations.30 Some researchers have argued that social discrimination may build cohesiveness among members of socially excluded groups. Through the formation of such groups, information and knowledge flows are enhanced and innovative thinking and entrepreneurship is encouraged. Groups allow farmers, in particular, to exchange lessons learned, improve skills and production, and decrease the overall cost of supplies and transportation.31 Although the
23 J.M. Kaspersma, Food Security Context Analysis for South Asia: Bangladesh, India, Pakistan, Nepal. Background paper for the food security situation in Kathmandu, Nepal. April 18-20, 2007. Published March 15, 2007. Retrieved from <http://www.icco.nl/delivery/icco/en/doc.phtml?p=publications> (10 December, 2007). 24 S. Thorat and J. Lee, “Caste Discrimination & Food Security Programmes,” Economic & Political Weekly, 24 (2005) p.16. 25 Kaspersma, 2007. 26Ministry of Home Affairs, Government of India. 2001 Census Data. Retrieved from <http://www.censusindia.gov.in/Census_Data_2001/India_at_Glance/scst.aspx> (10 February, 2008). 27 J. von Braun and R. Pandya-Lorch, Taking Action for the Worlds Poor and Hungry People. International Food Policy Research Institute: Washington D.C., (2007) Retrieved from < http://www.ifpri.org/pubs/books/oc57.pdf> (25 January, 2008) p.3-11. 28 S. Chakravarty and S. Dand, Food Insecurity in India: Causes and Dimensions, Indian Institute of Management and the Area Networking and Development Initiatives: New Delhi (2005), p. 3-11. 29 Ministry of Home Affairs, Government of India. 2001 Census Data. Retrieved from <retrievedfromhttp://www.censusindia.gov.in/Census_Data_2001/India_at_Glance/scst.aspx> (10 February, 2008). 30 Karspersma, 2007 31 J. Braun and R. Pandya-Lorch, 2007.
16

benefits of such groups should not be underestimated, they must not be used to downplay the significance of barriers created by widespread social discrimination, discrimination which is faced by nearly a quarter of India's population. THE GENDER DIMENSION OF FOOD SECURITY
The food security status of a nation, community or household cannot be understood without an examination of the existing gender roles, biases, and status differentials within each unit of analysis. Globally, and in India in particular, the food distribution patterns between female and male household members, the contribution of women to food production, and the critical role women play in maintaining an adequate quality and quantity of food within their households, all speak to the food security status of the nation. Indeed, the persistence of malnutrition in South Asia has frequently been attributed to the low status of women.32 “There is a patriarchal bias," Vandana Shiva writes, “of paradigms, processes, policies and projects of global economic structures... [and] the exclusion of women’s concerns, priorities and perspectives in defining the economy is damaging not only to women but to the well-being and food security of all."33 Women, research shows, play a critical role as producers of food, managers of natural resources, income earners, and caretakers of household food and nutrition security. According to the Food and Agricultural Organization, women produce between 60 and 80 percent of the food in most developing countries and are responsible for half of the world's food production.34 While both women and men engage in agricultural work, there are major differences in their work patterns in rural India. A study conducted by the Indian Council of Medical Research in four regions of India revealed that while male farmers work, on average, an 8-10 hour day, adult women farmers worked, on average, 12-16 hours a day with an energy cost of around 2200 kcal.35 Additionally, women’s work has been growing harder and more time-consuming as a result of ecological degradation and changing agricultural technologies and practices.36 Despite this, entrenched social constructs of gender norms continue to identify farmers as men despite the significant levels of agricultural work performed by women. Although both women and men engage in agricultural work, women are often solely responsible for the processing and preparation of food, and frequently use their own earned income in support of their children. Thus, the nutritional status of a household is significantly impacted by the role of women. A woman's knowledge of nutrition and kitchen management skills greatly impacts her ability to provide safe and healthy food to her family. These improved feeding and hygiene practices in turn, affect children’s health and survival rates.37 Opportunities for education and knowledge enrichment in India, however, are intricately linked
32 J. Braun and R. Pandya-Lorch, 2007. 33 M. Karl, Inseparable: The Crucial Role of Women in Food Security. Isis International: Manila (1996) p. 4. 34 FAO, “Women, Agriculture and Food Security.” (2005). Retrieved from <www.un.org/womenwatch/feature/wsis2005/> (15 February 2008). 35 K. Bagchi and S. Puri, 2002. 36 FAO, 2005 37 K. Bagchi and S. Puri, 2002.
17
with one's gender, and female literacy rates are currently less than fifty percent in India as compared to male literacy rates of nearly 75 percent.38 In Rajasthan in particular, despite incredible gains in female literacy between 1991 and 2001, approximately 55 percent of the female population remained illiterate in 2001.39 With evidence showing a strong correlation between women's literacy levels and decreased child malnutrition rates, gender biases in educational opportunities are significantly impacting the food security of India's children. In fact, women’s education was found to have a greater impact on the reduction of child malnutrition than food availability.40 Intra-household food distribution patterns must also be examined for the way in which they elevate the food security of one gender above the other. A global study conducted by the International Food Policy Research Institute (IFPRI) found that the male bias within food distribution patterns was higher in South Asia than in any other part of the world. While young children were frequently given priority in household food allocation, boy children received a disproportional share of the most nutritious food relative to girl children. In addition, adult women, who had greater nutritional requirements than boy children, often consumed far less.41 In order to impact a household's food security, and, if desired, the intra-household food distribution patterns, a woman must have some access and control over resources, decision making power within the household, and an ability to organize with other women.42 There is evidence that women’s employment may benefit household food security; however, it is not clear whether this benefit is the result of the increased purchasing power of women, or the increased household status offered by this work. Although a minimum level of income alone is not enough to ensure household food security, it is clear that maternal income has a greater impact on the achievement of food security than paternal income.43 As Amartya Sen writes, “anything that raises women’s status within the household and thereby contributes towards sharpening their perceived self-interest will enable women to cope more effectively with health-related shocks and, in turn, will enable households to cope more effectively with shocks to their food security.” 44 MEASURING FOOD SECURITY: THE CHOICE OF INDICATORS
The previous sections have all addressed the multiple dimensions of food security as a concept. In this section, the question of measurement is raised. Researchers have
38 Central Intelligence Agency, United States Government. World Fact Book: India. Retrieved from <https://www.cia.gov/library/publications/the-world-factbook/print/in.html> (10 April, 2008) 39 Ministry of Home Affairs, Government of India. 2001 Census Data. Retrieved from <retrievedfromhttp://www.censusindia.gov.in/Census_Data_2001/India_at_Glance/scst.aspx> (10 February, 2008). 40 International Food Policy Research Institute, “Women: The Key to Food Security: Looking Into the Household." IFPRI: London (2000) Retrieved from <www.ifpri.org/pubs/ib/ib3.pdf> (29 March 2008).
41 Ibid. 42 Ibid. 43 S. Maxwell & M. Smith, 1992. 44 A. Sen, 1981, p. 83.
18

operationalized elements of the food security concept in a variety of ways using process, outcome, direct and indirect indicators as appropriate. Each type of indicator is best suited to a particular measurement goal and must be chosen with context in mind. These indicator categories are described in more detail below. Process indicators: Process indicators measure how something is done rather than simply what is done. 45 When applied specifically to food security, these indicators measure the ways in which individuals, households, communities or states produce and gain access to food.46 Process indicators, therefore, can be further broken down into indicators of food availability and indicators of food access. Process indicators measuring food availability will attempt to capture the broader, country-wide aspects of food production and obtainment. Data collected with availability indicators might include the following: rainfall levels,47 agro-ecological availability (e.g., area of grazing lands or area of forest available for grazing),48 crop yields,49 market prices for particular crops,50 or the number of roads or miles of irrigation pipe in a given area.51 Process indicators measuring food access, on the other hand, will provide vital information on how the means of acquiring food is maintained. These access indicators measure the extent to which people are responding to changes in their access to a means of acquiring food. By comparing current behaviors with a pre-established ‘key’ or ‘map’ of local conduct, access indicators provide an estimate of current levels (or perceived future levels) of household food security.52 Predictable changes in behavior are commonly referred to as coping mechanisms and include, among other things, the sale of assets,53 the mortgaging of land, and the diversification of resources (e.g., the substitution of cash crops for subsistence crops). 54 Outcome indicators
45 P. Dearden, “Tools for Development: a Handbook for Those Engaged in Development Activity.” Department for International Development: London (2002). Retrieved from <www.dfid.gov.uk/Pubs/> (15 January, 2008). 46 J. Hoddinott, “Choosing Outcome Indicators of Household Food Security.” International Food Policy Research Institute: Washington, D.C. (1999). Retrieved from < www.ifpri.org/pubs/pubs_menu.asp> (24 January, 2008). 47 S. Davies, M. Buchanan-Smith and R. Lambert. “Early Warning in the Sahel and Horn of Africa: A Review of the Literature.” In, IDS Discussion Papers, Volume 1. Institute of Development Studies: Sussex (1991). Retrieved from <www.ids.ac.uk/index.cfm > (10 February, 2008). 48 N.S., Jodha, “Poor in dry regions of India.” Economic and Political Weekly 11 (1986) p. 1169-1181. 49 S. Davies et al., 1991. 50 J.M. Staatz, V.C. D'Agnostino and S. Sundberg. “Measuring food security in Africa: conceptual, empirical, and policy issues.” American Journal of Agricultural Economics 12 (1990) p. 1311-1317. 51 S. Maxwell and T. Frankenberger. “Household Food Security: Concepts, Indicators, and Measurements.” UNICEF-IFAD: New York (1992). Retrieved from <www.ifad.org/gender/tools/hfs/hfspub/> (28 December, 2007). 52 J. Corbett, “Famine crisis detection: going beyond the balance sheet.” Food Policy 9 (1988) p. 189-217. 53 T.R., Frankenberger and D.M. Goldstein, “Linking Houshold Food Security with Environmental Sustainability Through an Analysis of Coping Strategies.” In Growing Our Future, Edited by K. Smith. Kumarian Press: New York (1991). 54 T. Walker and N. Jodha. “How Small Farm Households Adapt to Risk.” In Crop Insurance for Agricultural Development: Issues and Experience, Edited by P. Hazell. The Johns Hopkins University Press: Baltimore (1986).
19

Outcome (or product) indicators measure the what rather than the how. Data collected with outcome indicators might include the following: individual food intake (e.g., the amount of food that individual consumes over a period of time),55 frequency of food consumption,56 and Nutritional Status Assessments (e.g., Body Mass Index data, wasting measures). Direct indicators Outcome and process indicators may be either direct or indirect. Direct indicators allow for the specific measurement of the object of concern and are generally considered to be a highly accurate means of detecting change or measuring a program's success.57 Direct indicators might attempt to capture the exact consumption habits of household members, or a household's monetary expenditure on food in a given month. Often, the use of direct indicators can prove to be unrealistic, either because an object cannot be directly observed or because directly observing it is too costly in terms of time, skills or money. 58 In these cases indirect indicators may be useful. Indirect indicators Indirect indicators, rather than measuring the direct object, provide measures of peripheral changes that are likely to point toward a change in the object itself. Indirect indicators of food security might include household estimates of stored food, or assessments of the nutritional quality of one’s diet. 59 The choice of indicators used in research, evaluation, and monitoring activities must reflect the availability of monetary and human resources, the level of accuracy required, and specific time constraints.60 Many indicators, which provide high levels of accuracy, also require great commitments of time and money.61 In addition, donor and government measurement preferences must be considered before choosing indicators for research intended to secure such parties’ support.62 Please refer to Table 1 at the end of this document for a detailed description of indicators most commonly used in food security studies. MEASURING FOOD SECURITY: METHODOLOGIES
A variety of quantitative and qualitative methods have been used to measure food security and explore its contextual dimensions. Among the more common methodologies used are ethnographic studies, participatory rural appraisals, interviews, focus groups and surveys. Indicators, as discussed above, will influence the type of methodology chosen, as will the
55 J. Hoddinott, 1999. 56 P. O'Brien-Place and T.R. Frankenberger, “Food Availability and Consumption Indicators.” In Nutrition in Agriculture Cooperative Agreement, Report No. 3. University of Arizona: Tuscon (1988). Retrieved from < www.arid.arizona.edu/> (13 January, 2008). 57 P. Dearden, 2002. 58 Ibid.
59 P. O'Brien-Place and T.R. Frankenberger, 1988. 60 T.R. Frankenberger, “Indicators and Data Collection Methods for Assessing Household Food Security.” UNICEF-IFAD: New York (1999). Retrieved from <www.ifad.org/gender/tools/hfs/hfspub/> (28 December, 2007). 61 S. Davies et al., 1991. 62 F. Riely, et al., 1999.
20
larger objective of the research. An ethnographic approach, for example, is useful for gaining considerable insight into the perceptions and circumstances of a small number of individuals or groups, but may be too time consuming and resource intensive for certain assessment purposes. Rapid rural appraisal (RRA), on the other hand, may be used to rapidly assess problems and situations at the community level for little cost, but will not be able to capture potentially important information at the household level. Household surveys, although excellent tools for gathering extensive information from individual households, generally fail to capture sensitive, intra-household information such as unequal food distribution patterns and other power differentials.63
Because of the advantages and limitations of any particular research method, it is likely that a combination of two or more methods may be preferred depending on the objectives of the research. While qualitative approaches, such as in-depth interviews and focus groups, can provide detailed insight into the multiple dimensions of food security, the information collected may not be easily analyzed or representative of the experiences of larger groups of individuals. Quantitative approaches involve standardized measures that allow for statistical and comparative analyses, but may not provide information on local context and meaning. Ultimately, the approach will depend upon the resources available, the research objectives, and the experience and expertise of the research team. Conclusion
Secure access to sufficient food is something that millions of people around the world still do not have. Ensuring that this basic human right is upheld for all people has been the focus of considerable work by governments, non-governmental organizations, communities and individuals since the 1948, when the concept of food security was first highlighted on the international stage. Despite some progress, the complex issue of food security must be continually explored and re-examined if we are to continue to narrow the still significant gap between proclamations of people’s right to food and the current realities of food insecurity on the ground. This literature review serves as only a starting point, highlighting some of the current thinking on the concept and measurement of food security. It is our hope, that the ideas presented in the preceding pages will provide a base from which additional, contextually-driven thinking, research and programming will evolve.
63 P. Dearden, 2002.
21
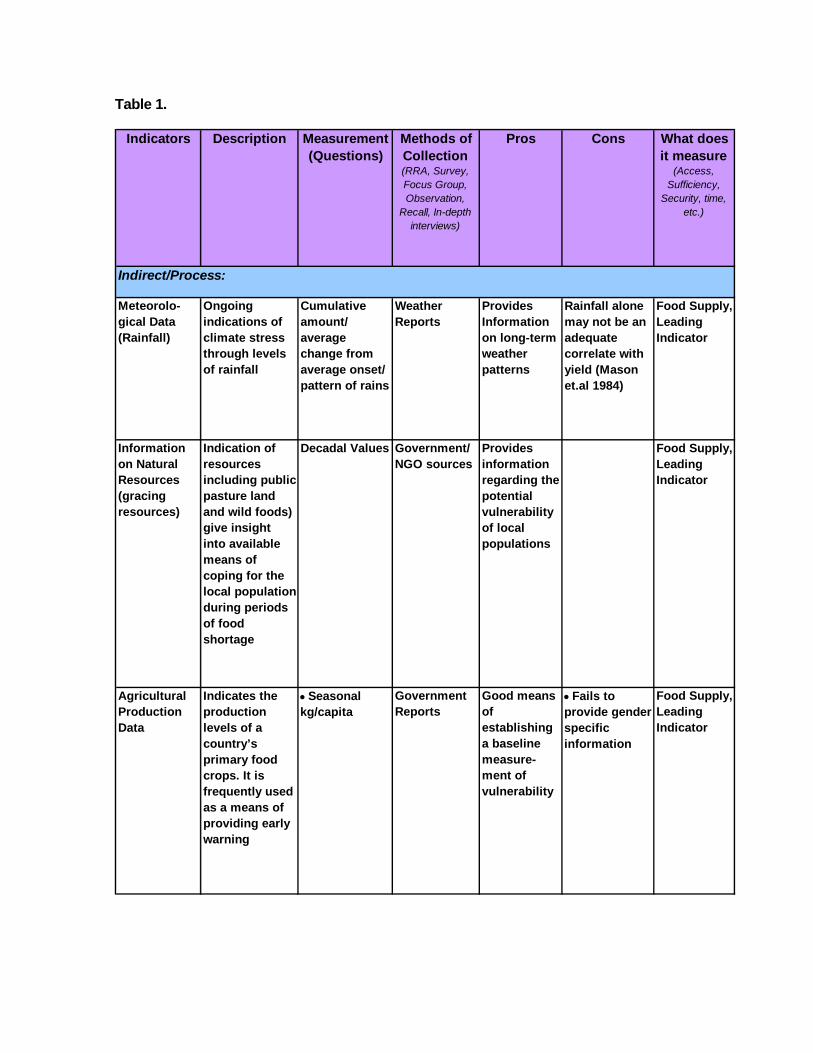
Table 1.
Indicators Description Measurement (Questions)
Methods of Collection (RRA, Survey, Focus Group, Observation,
Recall, In-depth interviews)
Pros Cons What does it measure
(Access, Sufficiency,
Security, time, etc.)
Meteorolo-gical Data (Rainfall)
Ongoing indications of climate stress through levels of rainfall
Cumulative amount/ average change from average onset/ pattern of rains
Weather Reports
Provides Information on long-term weather patterns
Rainfall alone may not be an adequate correlate with yield (Mason et.al 1984)
Food Supply, Leading Indicator
Information on Natural Resources (gracing resources)
Indication of resources including public pasture land and wild foods) give insight into available means of coping for the local population during periods of food shortage
Decadal Values Government/NGO sources
Provides information regarding the potential vulnerability of local populations
Food Supply, Leading Indicator
Agricultural Production Data
Indicates the production levels of a country’s primary food crops. It is frequently used as a means of providing early warning
• Seasonal kg/capita
Government Reports
Good means of establishing a baseline measure-ment of vulnerability
• Fails to provide gender specific information
Food Supply, Leading Indicator
Indirect/Process:
22
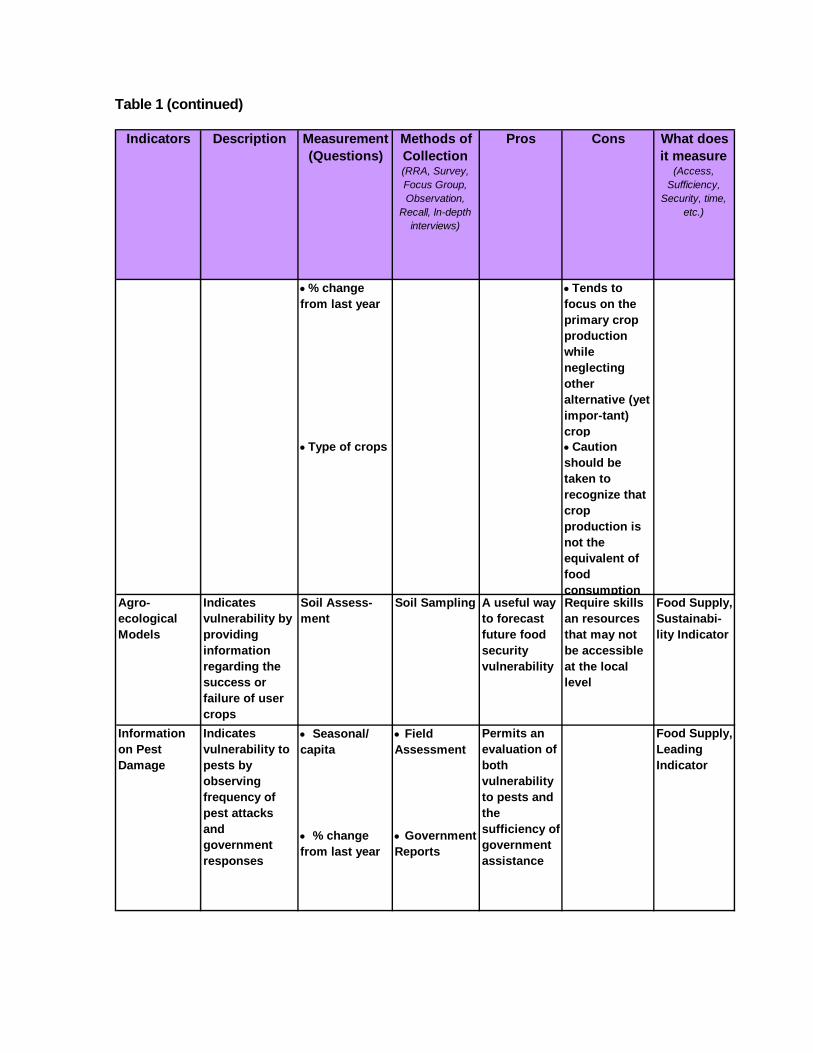
Table 1 (continued)
Indicators Description Measurement (Questions)
Methods of Collection (RRA, Survey, Focus Group, Observation,
Recall, In-depth interviews)
Pros Cons What does it measure
(Access, Sufficiency,
Security, time, etc.)
• % change from last year
• Tends to focus on the primary crop production while neglecting other alternative (yet impor-tant) crop
• Type of crops • Caution should be taken to recognize that crop production is not the equivalent of food consumption
Agro-ecological Models
Indicates vulnerability by providing information regarding the success or failure of user crops
Soil Assess-ment
Soil Sampling A useful way to forecast future food security vulnerability
Require skills an resources that may not be accessible at the local level
Food Supply, Sustainabi-lity Indicator
• Seasonal/ capita
• Field Assessment
• % change from last year
• Government Reports
Food Supply, Leading Indicator
Permits an evaluation of both vulnerability to pests and the sufficiency of government assistance
Indicates vulnerability to pests by observing frequency of pest attacks and government responses
Information on Pest Damage
23

Table 1 (continued)
Indicators Description Measurement (Questions)
Methods of Collection (RRA, Survey, Focus Group, Observation,
Recall, In-depth interviews)
Pros Cons What does it measure
(Access, Sufficiency,
Security, time, etc.)
• Price Data Food Supply, Leading Indicator
• Market Surveys
Regional Conflict
Considers the existence of conflicts which frequently disturb markets and damage local infrastructure thus threatening food security
# of incidents of influx of refugees
Observa-tions
• Changes in crop mix
• Changes in time of planting
• Changes in livestock mix
• # of animal deaths
RRA, Formal Surveys
Food access
RRA, Formal Surveys
Location-specific
Food accessLand use practices
Diversifica-tion of livestock
Prices can vary across persons depending on their access to markets, personal situation (distress or normal sale, t )
Indicates the ability of local households to purchase grain by examining those households ability to obtain an income
Value of crop prices, livestock prices
Market Information (Prices)
24

Table 1. (continued)
Indicators Description Measurement (Questions)
Methods of Collection (RRA, Survey, Focus Group, Observation,
Recall, In-depth interviews)
Pros Cons What does it measure
(Access, Sufficiency,
Security, time, etc.)
• Changes in petty marke-ting patterns
• Changes in wage rates
• Increase # of HH seeking off-farm employ-ment
• Increase in # of people seeking loans
• Help from relative
Sale of production assets
Sale of personal and capital goods (jewelry, draft animals)
# of people selling assets which assist them to produce goods/ food
RRA, Formal Surveys
Food access, Coping Strategies
Seasonal migration
• # of people migrating for work
RRA, Formal Surveys
Food access, Coping Strategies
Distress migration
• # of whole families moving out
RRA, Formal Surveys
Household perception of food security
Indicates levels of food security through examining the perceptions of household members
• # of months of self-provisioning from household production and receipt of in-kind as perceived qby the household
Vulnerable to information distortion from households in order to obtain increased assistance (Household and Food Security pg.97)
Food access
RRA, Formal Surveys
Changes in wage rates, changes in number of people seeking off-farm employment
Diversifica-tion of income sources
RRA, Formal Surveys
Food access, Coping Strategies
Access to loans/ credits
Direct/Process:
25

Table 1 (continued)
Indicators Description Measurement (Questions)
Methods of Collection (RRA, Survey, Focus Group, Observation,
Recall, In-depth interviews)
Pros Cons What does it measure
(Access, Sufficiency,
Security, time, etc.)
Livestock sale
Increase in sale of livestock/decline in livestock prices
RAA, formal surveys
Food Access, Coping Strategies
• # of months of food stores will last as perceived by HH
• # of units of grain stored
• weight for age
• Can provide local data
• height for age
• Inexpen-sive means of measure-ment
• weight for height
• Can often be confirmed by or substitu-ted with pre-existing informa-tion (Kumar 1989)
Indirect/Outcome:
Cultural beliefs or gain preservation concerns may prevent some from answering such questions
Attempts to establish the amount of food that each household currently has stored away
Anthropometric measures
Storage estimates
HH surveys Especially useful in communities that largely grow their food
There are multiple factors which may influence nutritional status including health care, and local sanitation poor nutrition therefore may occur independently of food security
Observes the nutritional status of a random sample of children under the age of five
Nutritional status assess-ments
26

Table 1 (continued)
Indicators Description Measurement (Questions)
Methods of Collection (RRA, Survey, Focus Group, Observation,
Recall, In-depth interviews)
Pros Cons What does it measure
(Access, Sufficiency,
Security, time, etc.)
• arm circumfe-rence
• Frequently given credence by govern-ment and donor organiza-tions
• Increased dependence in wild foods
• # of HH dependence on reserves
• Grain prices increase
• Reduc-tion in # of meals
• Decrease in dietary diversity
• Shift from preferred to low status food
Food Balance Sheets (National/ Regional Levels)
Assist in predicting nationwide food shortages
Production-consumption require-ments at National levels
Common means of determining food security at a national level (household Food Security p. 87)
• Focus on aggre-gates means that local specific informa-tion is frequent-ly inade-quate
Food supply, Leading Indicator
Change of food source
Increase in forest food
Food Access, Coping Strategies
RRA, formal surveys
Food Access, Coping Strategies
Direct/Outcome:
Dietary change (quantitative & qualitative)
RRA, formal surveys, in-depth interviews
27
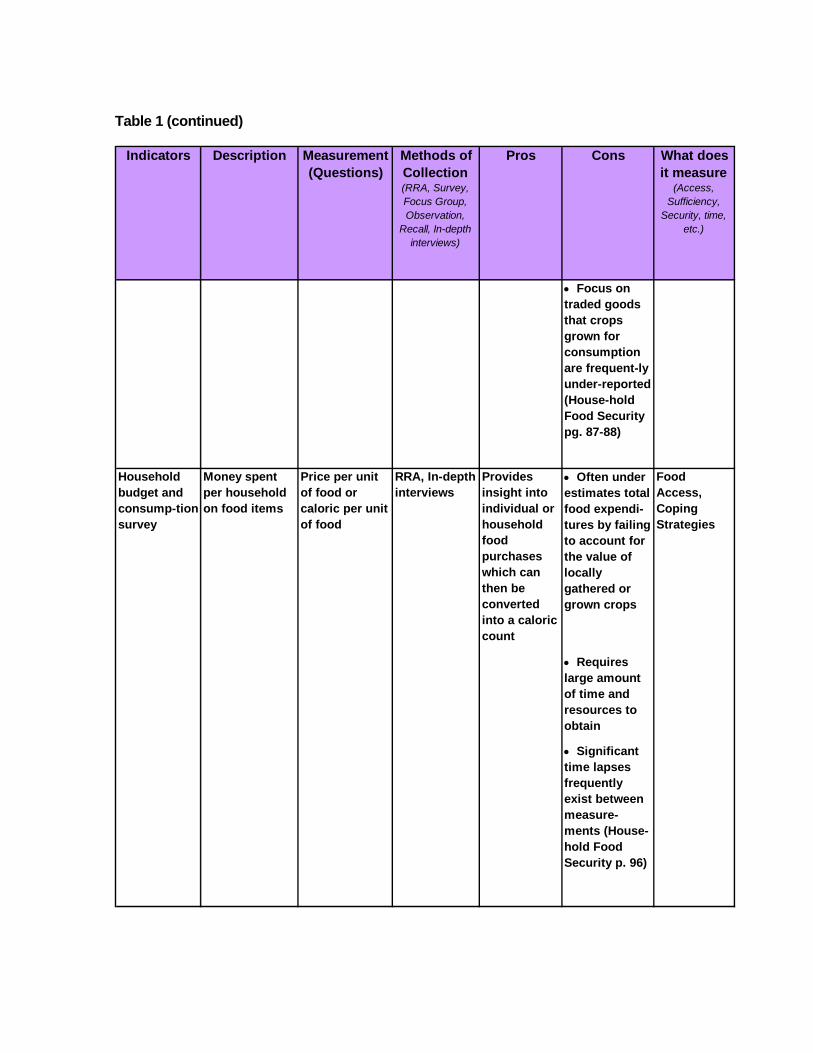
Table 1 (continued)
Indicators Description Measurement (Questions)
Methods of Collection (RRA, Survey, Focus Group, Observation,
Recall, In-depth interviews)
Pros Cons What does it measure
(Access, Sufficiency,
Security, time, etc.)
• Focus on traded goods that crops grown for consumption are frequent-ly under-reported (House-hold Food Security pg. 87-88)
• Often under estimates total food expendi-tures by failing to account for the value of locally gathered or grown crops
• Requires large amount of time and resources to obtain
• Significant time lapses frequently exist between measure-ments (House-hold Food Security p. 96)
Food Access, Coping Strategies
Household budget and consump-tion survey
Money spent per household on food items
Price per unit of food or caloric per unit of food
RRA, In-depth interviews
Provides insight into individual or household food purchases which can then be converted into a caloric count
28

Table 1 (continued)
Indicators Description Measurement (Questions)
Methods of Collection (RRA, Survey, Focus Group, Observation,
Recall, In-depth interviews)
Pros Cons What does it measure
(Access, Sufficiency,
Security, time, etc.)
• Areas that are remote tend to be underrep-resented (Kumar 1989)
• # of meals per day
• # and type of ingredients in meals
• # of times per day a nutrient-poor meal was served as main • Amount of food produced
• Amount of food
• Useful for evaluating purposes
• Can be done on a monthly basis, not time intensive
Household food security card
HH surveys
Food frequency assess-ments
Subsistence potential ratio
Compares how much a household is able to feed itself with how much it needs to feed itself
HH surveys Good means of measuring the food security of households that grow than majority of their own food
Less beneficial for those households which purchase a substantial amount of their food
Compares household food availability to food with household need on a monthly basis
Less effective indicator for families that purchase a substantial portion of their food
Amount of Food available/ amount of food required
Rather than seeking the quantity of food consumption rather seeks the frequency
HH surveys, 24-hour recall
Inexpensive and easy to administer
Although an accurate measure, it is less precise than other more indepth assess-ments
29

Literature Review References Bagachi, K, and S. Puri. “Food and Nutrition Security and Women.” In, Women and Food Security: The Role of Panchayats, Edited by P. Chaturvedi. Concept Publishing Company: New Delhi (2002). Casely, D.J.and K. Kumar. The Collection, Analysis, and Use of Monitoring and Evaluation Data. The John Hopkins Univesity Press: Baltimore, Maryland, USA (1990,1998). Central Intelligence Agency, United States Government. World Fact Book: India. Retrieved from <https://www.cia.gov/library/publications/the-world-factbook/print/in.html> (10 April, 2008) Coates, J., P. Webb and R.F. Houser. Comparison of a Qualitative and a Quantitative Approach to Developing a Household Food Insecurity Scale for Bangladesh. American Society for Nutrition: Boston (2006). Chakravarty, S. and S. Dand. Food Insecurity in India: Causes and Dimensions, Indian Institute of Management and the Area Networking and Development Initiatives: New Delhi (2005) p. 3-11. Corbett, J. “Famine crisis detection: going beyond the balance sheet.” Food Policy 9 (1988) p. 189-217. Davies, S., M. Buchanan-Smith and R. Lambert. “Early Warning in the Sahel and Horn of Africa: A Review of the Literature.” In, IDS Discussion Papers, Volume 1. Institute of Development Studies: Sussex (1991). Retrieved from <www.ids.ac.uk/index.cfm?objectId=D9DF8DB9-0D28-0171-B3D726E67D008C8C> (10 February, 2008). Dearden, P. “Tools for Development: A Handbook for Those Engaged in Development Activity.” Department for International Development: London (2002). Retrieved from <www.dfid.gov.uk/Pubs/> (15 January, 2008). De Sherbinin, Lex. “Population, Development and Human Security”. AVISO. Issue No. 7: Special Double Issue. October 2000. Center for International Earth Science Information Network (CIESIN), Columbia University. Retreived from <http://www.gechs.org/aviso/07/index.html> (15 January 2008) De Waal, A. “Emergency food security in Western Sudan: What is it for?” In, To Cure all Hunger: Food Policy and Food Security in Sudan, edited by S. Maxwell. Intermediate Technology: London (1991) p. 68. Duryea, Michele. “How Population Growth Affects Hunger in the Developing World”. Population Action International. (August 1, 2005.) Retrieved from: <http://www.populationaction.org/Publications/Fact_Sheets/FS30/Summary.shtml> (15 December, 2008)
30
Eklund, P. Rapid Rural Assessments for Sub-Saharan Africa: Two Case Studies. The Economic Development Institute of the World Bank. (1990) Frankenberger, T.R. and D.M. Goldstein, “Linking Household Food Security with Environmental Sustainability Through an Analysis of Coping Strategies.” In, Growing Our Future, Edited by K. Smith. Kumarian Press: New York (1991). Food and Agriculture Organization. “The State of Food Insecurity in the World: Monitoring Progress Towards the World Food Summit and Millennium Development Goals,” Food and Agricultural Organization (2003). Retrieved from <www.fao.org/docrep/006/j0083e/j0083e00.htm> (10 February, 2008). Food Security Briefing Paper. Social Briefing No. 2. Towards Earth Summit 2002 Retrieved from: <http://www.earthsummit2002.org/es/isues/foodsecurity/foodsecurity.pdf> (12 January, 2008) Gardiner, R. “Towards Earth Summit 2002 Project: Briefing Paper.” Earth Summit: London (2002). Hartmann, Betsy. “Population, Development, and Human Security.” Aviso. Issue No. 7. October 2000. Retrieved from: <http://www.gechs.org/aviso/07/index.html> (22 March, 2008) Hoddinott, J. Choosing Outcome Indicators of Household Food Security. International Food Policy Research Institute: Washington, D.C. (1999). Retrieved from < www.ifpri.org/pubs/pubs_menu.asp> (24 January, 2008). IFPRI: Women: The Key to Food Security: Looking Into the Household." International Food Policy Research Institute (IFPRI): London (2000) Retrieved from <www.ifpri.org/pubs/ib/ib3.pdf> (29 March 2008). Jodha, N.S. “Poor in dry regions of India.” Economic and Political Weekly 11 (1986) p. 1169-1181. Karl, M. “Inseparable: The Crucial Role of Women in Food Security.” In, No Short -Cut To Food Security. Quezon City: Jan 31, 1996. Retrieved from: <http://proquest.umi.com/pqdweb?did=592548051&sid=1&Fmt=3&clientId=15403&RQT=309&VName=PQD> (19 February, 2008) p. 1. Kaspersma, J.M. Food Security Context Analysis for South Asia: Bangladesh, India, Pakistan, Nepal. Background paper for the food security situation in Kathmandu, Nepal. April 18-20, 2007. Published March 15, 2007. Retrieved from <http://www.icco.nl/delivery/icco/en/doc.phtml?p=publications> (10 December, 2007). Krishnaraj, Maithrevi. “Food Security, Agrarian Crisis and Rural Livelihoods: Implications for Women.” Economic and Political Weekly. December 30, 2006. p. 2 Maxwell, S. “Food Security: a post-modern perspective,” Food Policy 21 (1996) p. 155.
31

Maxwell, S & M. Smith. “Household food security: A conceptual review,” In, Household Food Security: Concepts, Indicators, Measurements. Edited by S. Maxwell and T. Frankenberger. United Nations Children’s Fund-International Fund for Agricultural Development: New York (1992). McClain-Nhlapo, Charlotte. Africa: Implementing a Human Rights Approach to Food Security. 2020 Africa Conference Brief 13. International Food Policy Research Institute, Sustainable Solutions to Ending hunger and poverty 2020 Vision. p. 4. Retrieved from: <www.ifpri.org/2020africaconference> (10 February, 2008) Ministry of Home Affairs, Government of India. 2001 Census Data. Retrieved from <http://www.censusindia.gov.in/Census_Data_2001/India_at_Glance/scst.aspx> (10 February, 2008). O'Brien-Place, P. and T.R. Frankenberger. “Food Availability and Consumption Indicators.” In, Nutrition in Agriculture Cooperative Agreement, Report No. 3. University of Arizona: Tuscon (1988). Retrieved from: < www.arid.arizona.edu/> (13 January, 2008). Riely, F., N. Mock, B. Cogill, L. Bailey and E. Kenefick. “Food Security Indicators and Framework for Use in the Monitoring and Evaluation of Food Aid Programs,” Food and Nutrition Technical Assistance. USAID: Washington D.C. (1999) p. 12-17. Sen, A. “Poverty and Famines: An Essay on Entitlement and Deprivation.” Oxford University Press: Oxford. (1981). Staatz,J.M., V.C. D'Agnostino and S. Sundberg. “Measuring food security in Africa: conceptual, empirical, and policy issues.” American Journal of Agricultural Economics 12 (1990) p. 1311-1317. Swift, J. “Why are Rural People Vulnerable to Famines?” In, Institute for Development Studies Bulletin, 37 (2006) p. 63-70. Thorat, S. and J. Lee, “Caste Discrimination & Food Security Programmes,” Economic & Political Weekly, 24 (2005) p.16. United Nations Development Programme (UNDP). Human Development Report 1998. Oxford University Press: New York. 1998. United Nations, Office of the High Commissioner for Human Rights. “International Covenant on Economic, Social and Cultural Rights,” United Nations (1966). Retrieved from: <www.unhchr.ch/html/menu3/b/a_cescr.htm> (30 January 2008). United Nations: Women Watch. Women, Agriculure and Food Security. Facts & Findings Sheet. Retrieved from: <www.un.org/womenwatch/feature/wsis2005/> (11 February, 2008) Von Braun, J. and R. Pandya-Lorch, Taking Action for the Worlds Poor and Hungry People. International Food Policy Research Institute: Washington D.C. (2007) Retrieved from < http://www.ifpri.org/pubs/books/oc57.pdf> (25 January, 2008) p.3-11.
32

Walker, T. and N. Jodha. “How Small Farm Households Adapt to Risk.” In, Crop Insurance for Agricultural Development: Issues and Experience, Edited by P. Hazell. The Johns Hopkins University Press: Baltimore (1986). Wolfe, W. S. and E. A. Frongillo. Building household food –security measurement tools from the ground up. The United Nations University Food and Nutrition Bulletin Vol. 22 No. 1. (2001) Retrieved by: <http://www.fantaproject.org/downloads/pdfs/hfs_measure.PDF> p. 1
33
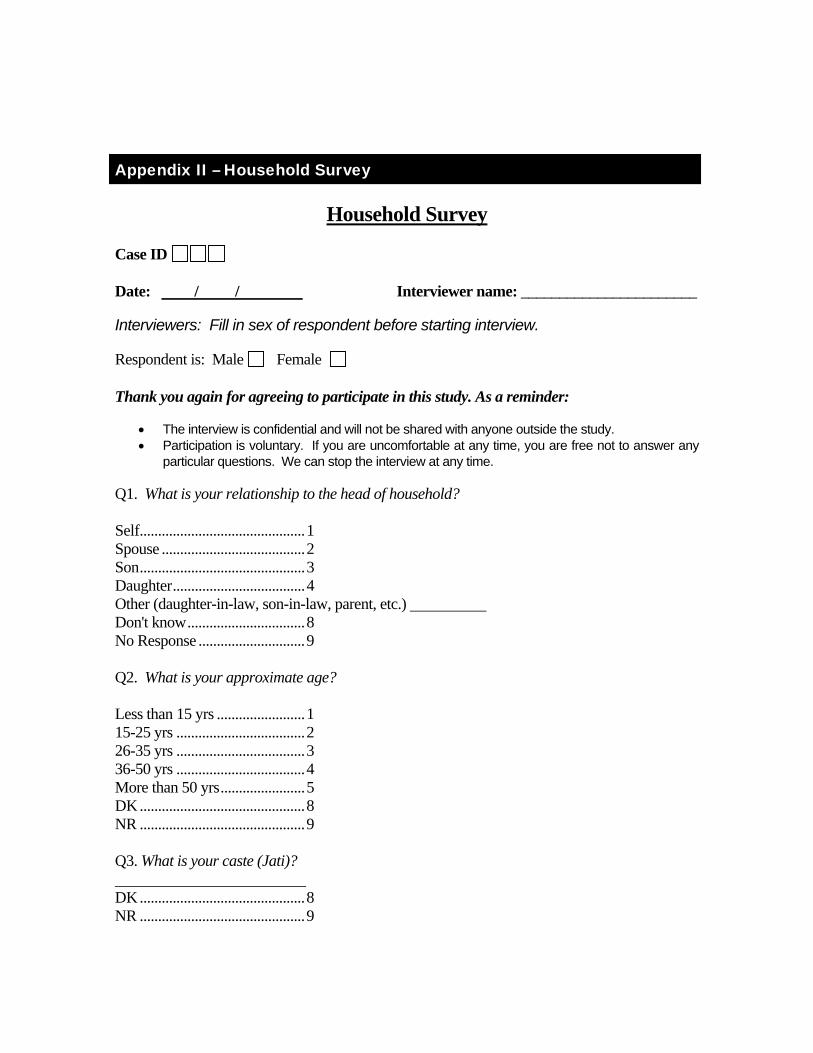
Appendix II – Household Survey
Household Survey
Case ID
Date: / / Interviewer name: _______________________ Interviewers: Fill in sex of respondent before starting interview.
Respondent is: Male Female
Thank you again for agreeing to participate in this study. As a reminder:
• The interview is confidential and will not be shared with anyone outside the study. • Participation is voluntary. If you are uncomfortable at any time, you are free not to answer any
particular questions. We can stop the interview at any time. Q1. What is your relationship to the head of household? Self.............................................1 Spouse .......................................2 Son.............................................3 Daughter....................................4 Other (daughter-in-law, son-in-law, parent, etc.) Don't know................................8 No Response .............................9 Q2. What is your approximate age? Less than 15 yrs ........................1 15-25 yrs ...................................2 26-35 yrs ...................................3 36-50 yrs ...................................4 More than 50 yrs.......................5 DK.............................................8 NR .............................................9 Q3. What is your caste (Jati)? DK.............................................8 NR .............................................9
34

Q4. All together, how many female members are there in the household?
(IF "0" SKIP TO Q6) DK.............................................8 NR .............................................9 Q5. What are the approximate ages of all female household members? Female HH member 1: Female HH member 2: Female HH member 3: Female HH member 4: Female HH member 5: Ages of additional female HH members: DK.............................................8 NR .............................................9 Q6. All together, how many male members are there in the household?
(IF "0" SKIP TO Q8) DK.............................................8 NR .............................................9 Q7. What are the approximate ages of all male household members? Male HH member 1: Male HH member 2: Male HH member 3: Male HH member 4: Male HH member 5: Ages of additional male HH members: DK.............................................8 NR .............................................9 Q8. Does your household own land? Yes.............................................1 No (SKIP TO Q11) ..................2 DK.............................................8 NR .............................................9
35

Q9. All together, how much land does your household own? Less than 5 B.............................1 6-10 B........................................2 11-15 B......................................3 16-20 B......................................4 21-30 B......................................5 More than 30 B.........................6 DK.............................................8 NR .............................................9 Q10. Of this land, how much is irrigated, if any at all? None ..........................................1 1-5 B..........................................2 6-10 B........................................3 11-15 B......................................4 16-20 B......................................5 21-30 B......................................6 More than 30 B.........................7 DK.............................................8 NR .............................................9 Q11. Does any member of your household cultivate land through a sharecropping arrangement or as a tenant farmer on someone else's land? Yes................................................................................................. 1 No (SKIP TO Q13; IF "NO" TO Q8, SKIP TO Q15)................ 2 DK................................................................................................. 8 NR ................................................................................................. 9 Q12. How much land does your household cultivate as a sharecropper or tenant farmer? Less than 5 B.............................1 6-10 B........................................2 11-15 B......................................3 16-20 B......................................4 21-30 B......................................5 More than 30 B.........................6 DK.............................................8 NR .............................................9
36

Q13. What are all the different kinds of crops your household grows on land you own or land you cultivate but do not own. Do you grow….(READ a-g) Yes No DK NR(a) Corn? 1 2 8 9 (b) Wheat? 1 2 8 9 (c) Rice? 1 2 8 9 (d) Chana? 1 2 8 9 (e) Toor Dal? 1 2 8 9 (f) Urad Dal? 1 2 8 9 (g) Any other crop? 1 2 8 9 (SPECIFY): Q14. How many full crop cycles does your household usually have in one year? None ..........................................1 0.5 ..............................................2 1 .................................................3 1.5 ..............................................4 2 .................................................5 2.5 ..............................................6 3 .................................................7 DK.............................................8 NR .............................................9 Q15. Please tell me if your household currently owns any of the following animals? Does your household own a… (READ a-h) Yes No DK NR(a) Bull? 1 (# ) 2 8 9 (b) Goat? 1 (# ) 2 8 9 (c) Cow? 1 (# ) 2 8 9 (d) Ox? 1 (# ) 2 8 9 (e) Horse? 1 (# ) 2 8 9 (f) Chicken? 1 (# ) 2 8 9 (g) Sheep? 1 (# ) 2 8 9 (h) Any other animal? 1 (# ) 2 8 9 (SPECIFY): Q16. Some households may have some cash reserves on hand in some seasons, while other households do not. Thinking back over the past year, on average how much cash did your household have on hand….(READ a-c) (a) In the summer season, if any? Rs DK NR (b) In the monsoon season, if any? Rs DK NR (c) In the winter season, if any? Rs DK NR
37

Q17. Many households have more food in some seasons than in others. Thinking back over the past year, how many meals, on average, did the adults in your household eat per day…(READ a-c) (a) In the summer season, if any? DK NR (b) In the monsoon season, if any? DK NR (c) In the winter season, if any? DK NR Q18. Sometimes there may not be enough food for everyone in the household to eat for reasons that are beyond a household's control. Thinking back over the past year, how many meals, on average, did the children in your household eat per day…(READ a-c). Please include meals children ate at school, as well as in the home. (a) In the summer season, if any? DK NR (b) In the monsoon season, if any? DK NR (c) In the winter season, if any? DK NR Q19. Thinking back over the past month, tell me how frequently you ate the following kinds of food, or if you did not eat the food at all. In the past MONTH, did you eat…(READ a-n) every day, most days, some days, or not at all? Every day Most days Some days Not at all DK NR (a) Wheat 1 2 3 4 8 9 (b) Maize 1 2 3 4 8 9 (c) Rice 1 2 3 4 8 9 (d) Other cereal 1 2 3 4 8 9 (SPECIFY): (e) Pulses 1 2 3 4 8 9 (f) Vegetables 1 2 3 4 8 9 (g) Potatoes/tubers 1 2 3 4 8 9 (h) Fruits 1 2 3 4 8 9 (i) Milk 1 2 3 4 8 9 (j) Eggs 1 2 3 4 8 9 (k) Mammal or fish meat 1 2 3 4 8 9 (l) Forest products 1 2 3 4 8 9 (m) Oil 1 2 3 4 8 9 (n) Sugar or Gud 1 2 3 4 8 9
38

Q20. Please tell me approximately how much money your household spends buying food from the market and/or shops PER MONTH in…(READ a-c) (a) The summer season? Rs DK NR (b) The monsoon season? Rs DK NR (c) The winter season? Rs DK NR Q21. Thinking back over the past year, about how many days total did members of your household, including yourself, work for NREGS or similar government work schemes? Less than 25 days......................1 26-50 days.................................2 51-75 days.................................3 76-100 days...............................4 More than 100 days ..................5 DK.............................................8 NR .............................................9 Q22. What was the average daily wage that you or other household members received for work you did through NREGS or similar government work schemes? Rs DK NR Q23. If you or others in the household did not participate in NREGS or similar government work schemes in the past year, what was the reason? Q24. In the past year, about how much did your household earn by selling agricultural produce, eggs, and milk, if any? Rs DK NR Q25. Has anyone from you household migrated in the past year? Yes (ASK A).............................1 No..............................................2 DK.............................................8 NR .............................................9 A. About how much did your household earn all together in the past year from household members migrating to other areas in order to find work? Rs DK NR
39

Q26. We have talked about income from government work schemes, selling farm products, and migrant labor. Please tell me what other income sources your household has that you have not already mentioned, if any? None (SKIP TO Q28)...............1 Permanent employment............2 Selling non-ag. products...........3 Other..........................................4 (SPECIFY): DK.............................................8 NR .............................................9 Q27. Over the past year, about how much income did your household earn from this (these) additional income sources? Rs DK NR Q28. It can be difficult for a family to have sufficient food every day of the year, and in times of scarcity families may need to make difficult decisions. Thinking back over the past YEAR, please tell me how frequently your household took any of the following actions, if any, due to food shortage. Over the past year, in your household, did .… (READ a-d) every day, most days, some days, or not at all? [NOTE: If respondent answers "most days" or "some days" say: Please tell me in which season or seasons this occurred. Mark seasons (s, m, w) next to circled number.] Every day Most days Some days Not at all DK NR (a) You eat smaller portions 1 2 3 4 8 9 (b) A child eat smaller portions1 2 3 4 8 9 (c) You skip a meal 1 2 3 4 8 9 (d) A child skip a meal 1 2 3 4 8 9 Q29. At any time in the past YEAR, did your household take any of the following actions due to food shortage? Did your household… (READ a-d) (a) Borrow food Yes [In what season(s) ] No DK NR (b) Borrow money Yes [In what season(s) ] No DK NR (c) Mortgage something you own (e.g., livestock, ornaments, land) Yes [In what season(s) ] No DK NR (d) Sell something you own (e.g., livestock, ornaments, land) Yes [In what season(s) ] No DK NR
40
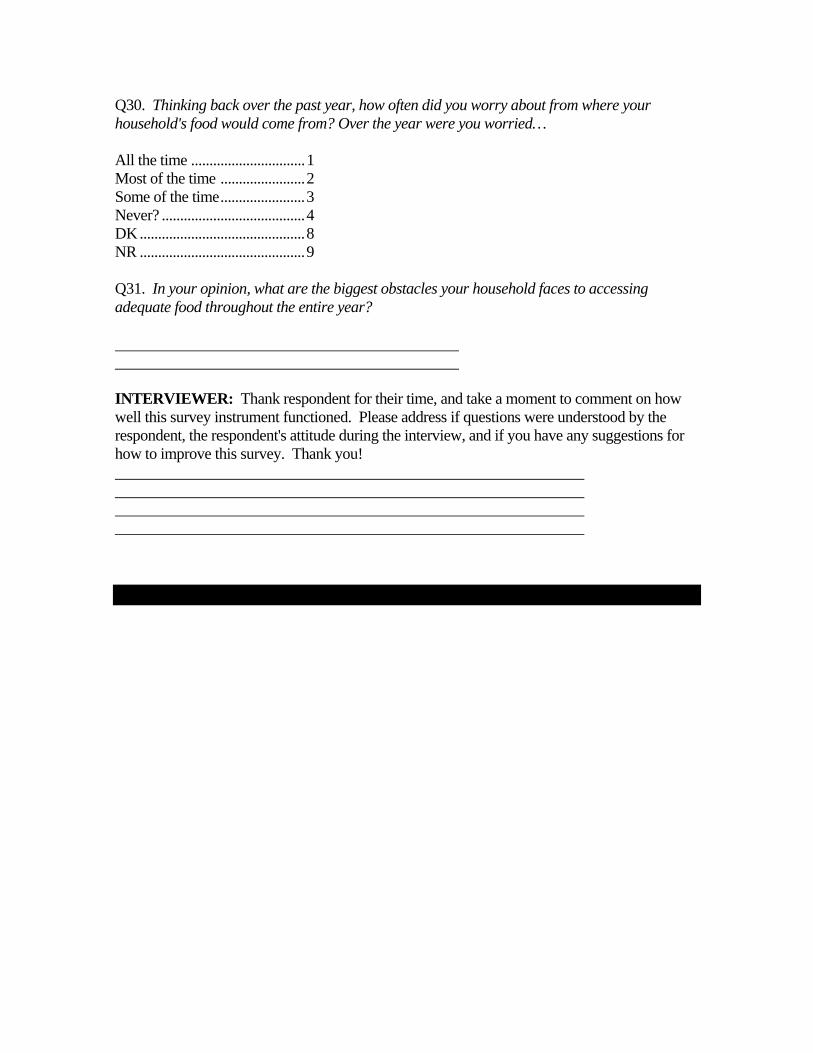
Q30. Thinking back over the past year, how often did you worry about from where your household's food would come from? Over the year were you worried… All the time ...............................1 Most of the time .......................2 Some of the time.......................3 Never? .......................................4 DK.............................................8 NR .............................................9 Q31. In your opinion, what are the biggest obstacles your household faces to accessing adequate food throughout the entire year? INTERVIEWER: Thank respondent for their time, and take a moment to comment on how well this survey instrument functioned. Please address if questions were understood by the respondent, the respondent's attitude during the interview, and if you have any suggestions for how to improve this survey. Thank you!
41

Appendix III – Discussion Guide
Introduction Thank you for your willingness to take part in this group discussion. The purpose of the discussion is to explore your thoughts and observations regarding the food security situation in your communities. Food security – or access to sufficient food at all times – continues to be a challenge for many of our villages. Some communities may at time be more food secure than others, and we would like to understand some of the factors that contribute to these differences. In addition, this discussion may help alert us to potential food crises, as well as enable us to share strategies for achieving food security.
1. What are the obstacles that households currently face in terms of accessing sufficient food? What is the extent of these obstacles? (obstacles)
2. To what extent are natural resources related to food security currently available to the
community? How does the community manage these resources? (natural resources)
3. What can you say about the current prices of primary commodities and major agricultural inputs? How is this affecting the production and consumption of food by households? (prices)
4. What do you think are the biggest problems currently affecting crop production at the
community level? Why do you think these problems exist? (crop condition)
5. How would you describe the consumption patterns of households? Have you noticed any changes in the kinds and/or amounts of food they are consuming? (portions)
6. Have you noticed any changes in the amount and/or quality of productive assets,
particularly livestock, in households in the community? Please discuss the changes. (assets)
7. What are the current patterns of borrowing food or money to buy food in the
community? Are households mortgaging or selling assets (such as livestock, ornaments, or land)? What are the factors that contribute to this? Have you noticed recent changes in these patterns? (borrowing)
8. How frequently are people in your community migrating to find work? Can you describe
any changes in the patterns of migration? Why might these changes have taken place? (migration)
9. What are the current primary income sources for households in the community? Are
there alternative income sources that are easily accessible and used in the community? Please discuss. (income sources)
10. What are your thoughts on how the NREGS is currently functioning? Have there been
any changes in the numbers of people getting employed and/or the wages they receive for their work? Please discuss. (NREGS)
42

Appendix IV– Guidelines for Application of the Household Survey
A. SAMPLING
The survey sample should correspond to at least 5% of the total population of the target areas in the Udaipur District in India. If the households to be surveyed are identified by random sampling methods, the data collected may be generalized to the larger population. In order to sample randomly, information must be obtained on all the households in the area, and then a percentage of these households must be chosen at random to receive the survey. B. PRE-INTERVIEW
1. Explain briefly the purpose of the research study to potential participant 2. Explain that there are no direct benefits from participating 3. Explain that responses to survey are confidential and will not be shared with anyone
outside of the research study 4. Inform potential participant that the survey takes approximately 20-30 minutes to
complete 5. Obtain written or verbal consent (or AT LEAST make sure the potential participant
understands that participation is voluntary)
C. DURING INTERVIEW
1. Locate a quiet, private place to conduct the interview. Ideally, spouse or other adults should not be within hearing distance.
2. Read survey questions EXACTLY as written. 3. Be warm and friendly, but remain NEUTRAL. Do not "approve" or "disapprove" of
responses. DO NOT respond to answers with comments like "That's good" or "I'm really happy for you" or "That's terrible news," etc…YOU MAY respond with non-judgmental phrases like "I see," "I understand," and "Thank you."
4. If respondent does not understand or does not answer the question they are asked, you may re-read the question. If respondent is unsure of his/her answer, you may say "give me your best estimate" or "as best you can remember" or "to the best of your knowledge." If respondent insists that they don't know after you probe once, accept this response, and mark DK on survey. DO NOT reword the question; DO NOT suggest answers; DO NOT be overly persistent.
5. If respondent becomes upset at any time during the interview, tell them that they can skip any question, or pause the interview so that they may collect their thoughts. If respondent appears very upset, tell them that you can stop the interview.
D. POST-INTERVIEW
1. Thank respondent for their time
43

E. DATA ANALYSIS The USDA’s Food Security Scale maybe used to interpret the data collected using the household survey. This scale allows for the categorization of households into Food Secure, Food Insecure without Hunger, or Food Insecure with Hunger. Analysis of the survey information, however, should not be limited to quantitative data analysis. Findings may be enhanced by qualitative information, such as information recorded by interviewers that falls outside the scope of the survey questions and/or interviewers own observations of households' conditions.
44