the development of a novel algorithm for detection of
TRANSCRIPT
THE DEVELOPMENT OF A NOVEL ALGORITHM FOR DETECTION OF COMMON
BACTERIAL, VIRAL AND FUNGAL AETIOLOGIC AGENTS OF
MENINGOENCEPHALITIS
Edouard Ntagwabira
H80/91821/2013
A Thesis submitted in fulfilment for award of the degree of Doctor of Philosophy (Ph.D.) in
Medical Microbiology of the University of Nairobi
University of Nairobi
2019

i
DECLARATION

ii
DEDICATION
To my nuclear family members for their unconditional love and care that has always given me
strength and courage to carry on. Thank you for your tremendous patience, encouragement,
support and prayers.
I also dedicate it to my parents and other family members who were killed in the Rwanda Genocide
against the Tutsi in 1994, who endeavoured their level best to make me who I am today. Thank
you for your fore-sightedness, which encourages our family acquire high-level quality education.

iii
ACKNOWLEDGEMENTS
The completion of this research work required the support and goodwill of several individuals who
directly or indirectly contributed to its success making it difficult to acknowledge each one of them
individually.
I would like to thank my family for their continued support. My wife, Jacqueline Ntagwabira for
her patience, kind heart, understanding and always encouraging me to pursue my dreams. I thank
my children, Doris, Doreen, Darren and Dacia for their continued support and patience in my
absence during the study.
I would like to acknowledge the invaluable contribution of my supervisors Prof. Omu Anzala, Dr.
Jean Baptiste Mazarati and Dr. Marianne Mureithi. They had tremendous confidence and
encouraged me even when the demands of the research and those of my job seemed to overwhelm
me. Being my supervisors from inception of the research work and being aware of the tasks
involved, they offered me a lot of support and advice in all the undertakings. Their commitment
and invaluable suggestions are highly appreciated.
I would also like to express my sincere gratitude to the entire staff at the Department of Medical
Microbiology, School of Medicine, University of Nairobi (UoN) for their great administrative
support. Specifically, I wish to thank Prof. Walter Jaoko, the Chairman who was instrumental in
tirelessly guiding me and ensuring that my studies ran smoothly.
I highly appreciate the management of King Faisal Hospital (KFH), Rwanda Military Hospital
(RMH), Kigali University Teaching Hospital (CHUK), Butare University Teaching Hospital
(CHUB), Kibungo, Nyagatare, Gisenyi and Byumba Satellite Hospitals which assisted me during
recruitment of study participants and samples collection.

iv
I am grateful to the study participants and the study teams with whom I interacted with freely. I
treasure the commitment they showed throughout, as this study would not have been possible
without them. To you all, I say “Murakoze” (Asante sana). I wish to thank my colleagues at the
National Reference Laboratory (NRL), Rwanda, for providing a conducive environment and
granting me the technical support required for such a project. I would like to specifically thank
Theoneste Nizeyimana, Clarisse Murebwayire, Leonce Majambere, Thaddee Bwanakweri,
Therese Mukakwiro, Flora Rwanyagatare and the entire technical staff for their support. Special
thanks also goes to the statisticians, Lawrence Muthami and Bonariba Tharcisse who helped me
in the samples size calculation, preparation of database and data analysis.
I am thankful to Doreen Thuo who has worked determinedly in this research by assisting in
administrative, logistics, data collection and entry from the very beginning of the study.
To all the unknown scientists whose work and thoughts have inspired me and helped me bring this
dissertation to fruition, thank you.
I would like to appreciate Rwanda Biomedical Centre (RBC) for administrative facilitation during
my studies
Last but not least, I am grateful to the Government of Rwanda, Ministry of Health, World Bank,
East Africa Public Health Laboratory Network Project (EAPHLNP) for awarding me the grant
funding towards this research.
Above all, this work is a blessing from the Almighty God, truly an answered prayer from above.
v
TABLE OF CONTENTS
DECLARATION ............................................................................................................................. i
DEDICATION ................................................................................................................................ ii
ACKNOWLEDGEMENTS ........................................................................................................... iii
LIST OF FIGURES ..................................................................................................................... viii
LIST OF TABLES ......................................................................................................................... ix
LIST OF ACRONYMS .................................................................................................................. x
ABSTRACT .................................................................................................................................. xii
CHAPTER ONE: INTRODUCTION ......................................................................................... 1
1.1. Background .............................................................................................................................. 1
1.2. Problem Statement ................................................................................................................... 3
1.3. Justification .............................................................................................................................. 3
1.4. Objectives ................................................................................................................................ 5
1.4.1. Broad Objective ............................................................................................................. 5
1.4.2. Specific Objectives: ....................................................................................................... 5
CHAPTER TWO: LITERATURE REVIEW ............................................................................ 6
2.1. Bacterial, Viral and Fungal Meningoencephalitis ................................................................... 6
2.1.1. Bacterial Meningitis ...................................................................................................... 7
2.1.2. Bacterial Meningoencephalitis Diagnosis ..................................................................... 9
2.1.3. Antimicrobial drugs for treatment of bacterial meningoencephalitis .......................... 10
2.2. Viral Meningoencephalitis ..................................................................................................... 11
2.2.1. Laboratory Diagnosis of Viral meningoencephalitis ................................................... 12
2.2.2. Antiviral drugs for treatment of viral meningoencephalitis ........................................ 12
2.3. Fungal Meningoencephalitis .................................................................................................. 13
2.3.1. Cryptococcus neoformans ........................................................................................... 13
2.3.2. Diagnosis of Cryptococcal meningitis ........................................................................ 13
2.3.3. Coccidioidomycosis..................................................................................................... 13
2.3.4. Histoplasmosis ............................................................................................................. 14

vi
CHAPTER THREE: MATERIALS AND METHODS .......................................................... 16
3.1. Study Design .......................................................................................................................... 16
3.2. Study Area ............................................................................................................................. 16
3.3. Study Population .................................................................................................................... 16
3.4. Sample size calculation .......................................................................................................... 17
3.5. Selection Criteria ................................................................................................................... 18
3.5.1. Inclusion criteria .......................................................................................................... 18
3.5.2. Exclusion criteria ......................................................................................................... 18
3.6. Ethical considerations ............................................................................................................ 19
3.7. Recruitment of Study Teams ................................................................................................. 19
3.8. Recruitment of Study Subjects............................................................................................... 19
3.9. Quality Assurance at sites ...................................................................................................... 20
3.10. Sample collection and transport ........................................................................................... 20
3.11. Onsite sample processing ..................................................................................................... 23
3.11.1. Culture examination .................................................................................................. 25
3.11.2 Culture with growth and organism identification ....................................................... 25
3.11. 3. Sample shipment and transportation from sites to NRL........................................... 27
3.12. Quality Assurance on conventional method ........................................................................ 27
3.13. Sample processing at NRL using conventional method ...................................................... 27
3.14. Real- time multiplex Polymerase Chain Reaction Assay Validation .................................. 29
3.14.1 Quality control ............................................................................................................ 29
3.14.2. Nucleic acid extraction .............................................................................................. 29
3.14.3. Master mix preparation .............................................................................................. 30
3.14.4. Amplification ............................................................................................................. 31
3.14.5. Interpretation of the PCR assays ............................................................................... 32
3.14.6. Processing of Patient samples using Real-time Multiplex PCR ................................ 33
3.15. Data entry and analysis ........................................................................................................ 33
CHAPTER FOUR: RESULTS ................................................................................................. 34
4.1. Characteristics of study population ....................................................................................... 34
4.2. Clinical Characteristics of study population .......................................................................... 35
4.3. Conventional methods results analysed on study sites. ......................................................... 36
vii
4.4 Development of a novel algorithm for detection of most common bacterial, Viral and fungal
etiological agents of meningoencephalitis. ................................................................................... 42
4.5 Determination of the drug susceptibility pattern of the detected bacteria agents of
Meningoencephalitis ..................................................................................................................... 46
4.6 Evaluation and demonstration of the utility of the molecular diagnostic technique over
conventional techniques for detection of pathogens causing meningoencephalitis. ..................... 49
4.6.1. Outcome of culture at NRL ......................................................................................... 49
4.6.2. Outcomes of RT-Multiplex PCR at NRL .................................................................... 51
CHAPTER FIVE: DISCUSSION .............................................................................................. 60
5. Discussion ................................................................................................................................. 60
6. Limitations ................................................................................................................................ 65
7. Conclusion ................................................................................................................................ 65
8. Recommendations ..................................................................................................................... 66
REFERENCES ............................................................................................................................ 67
APPENDICES .............................................................................................................................. 72
viii
LIST OF FIGURES
Figure 1: Lumbar puncture to collect sample of cerebrospinal fluid (Ajello et al., 1984) ........... 22
Figure 2: Picture of bottle of Trans- Isolate medium used in the study ..................................... 23
Figure 3: Existing algorithm for diagnosis of CNS infections using conventional method in DHS
and PHs in Rwanda 2018 ............................................................................................ 26
Figure 4: Demographic representation of study population by age group (n=845) ...................... 34
Figure 5: Gram staining results by age group ............................................................................... 36
Figure 6: Cryptococcus neoformans identified using Indian ink by study sites and gender. ....... 37
Figure 7: Developed novel algorithm for diagnosis of CNS infections using conventional method
at District, Provincial and Referral Hospitals ............................................................. 44
Figure 8: The developed novel algorithm for diagnosis of CNS infections using a combination of
conventional and molecular methods at NRL ............................................................. 45
Figure 9: above shows a petri dish for sample 482 with Escherichia coli sensitive to amikacin,
azitreonam, augmentin, sulfamethoxazole. ................................................................. 46
Figure 10: above shows a petri dish for sample No 44 with Klebsiella pneumoniae sensitive to 47
augmentin, amikacin and meropenem. ............................................................................. 47
Figure 11: above shows a petri dish for sample No 132 with Staphylococcus aureus sensitive .. 47
to oxacillin and methicillin and ciprofloxacin. ................................................................. 47
Figure 12: Representation of Human adenoviruses (Ct values) ................................................... 52
Figure13: Representation of Enteroviruses (Ct values) ................................................................ 52
Figure14: Representation of Epstein Barr Virus ( Ct values). ..................................................... 53
Figure15: Representation of Human Herpes Virus 6 (Ct values) ................................................. 53
Figure 16: Representative of Herpes Simplex 1 virus (Ct values)................................................ 54
Figure 17: Representative of Cryptococcus neoformans (Ct values) ........................................... 54
Figure 18: Representative of Streptococcus pneumoniae (Ct values) ......................................... 56
Figure 19: Representative of Neisseria meningitidis (Ct values) ................................................. 56
Figure20: Representative of Hemophilus influenzae (Ct values) ................................................. 57
Figure 21: Representative of Escherichia coli (Ct values)............................................................ 58
Figure 22: Representative of Listeria monocytogenes (Ct values) ............................................... 59
Figure 23: Representative of Internal control (Ct values) ............................................................ 59

ix
LIST OF TABLES
Table 1: Detection guide for the targets in the four RT- Multiplex PCR kits used for ............... 33
analysis of CSF specimens from patients with CNS infections. .................................... 33
Table 2: Frequency of CNS infections signs and symptoms by age group .................................. 35
Table 3: Frequency of pathogen detected by sites using culture at National Reference Laboratory.
............................................................................................................................. 38
Table 4: The relationship between pathogens isolated and HIV status ........................................ 39
Table 5: The relationship between patient outcome with HIV status ........................................... 39
Table 6: The pathogen isolates compared with CSF protein ........................................................ 40
Table 7: The pathogen isolated compared with glucose concentration in CSF ............................ 41
Table 8: Sensitivity profile of isolated Escherichia coli and Klebsiella pneumoniae. .................. 48
Table 9: Sensitivity profile of isolated Streptococcus agalactiae ................................................. 48
Table 10: Sensitivity profile of isolated Streptococcus pneumoniae ............................................ 48
Table11: Sensitivity profile of isolated Staphylococcus aureus ................................................... 49
Table 12: Frequency of pathogen isolates by age group using culture at NRL ........................... 49
Table 13. Distribution of isolated pathogen by gender ............................................................... 50
Table 14: Frequency of viruses detected using RT multiplex PCR .............................................. 51
Table 15: Frequency of bacteria pathogens detected using molecular method ............................ 55
Table16: Frequency of bacteria pathogens detected from neonatal CSF ..................................... 57

x
LIST OF ACRONYMS
AIDS: Acquired Immunodeficiency Syndrome
API: Analytical profile index
CDC: Center for Disease Control
CHUB: Butare University Teaching Hospital
CHUK: Kigali University Teaching Hospital
CLSI: Clinical and Laboratory Standards Institute
CMV: Cytomegalovirus
CNS: Central Nervous System
CSF: Cerebral Spinal Fluid
Ct: cycle threshold
DNA: Deoxyribonucleic acid
EAPHLNP: East Africa Public Health Laboratory Network Project
EBV: Epstein–Barr Virus
Ep-TB: Extra Pulmonary Tuberculosis
EQC: External Quality Control
GCLP: Good Clinical Laboratory Practice
GCS: Glasgow Coma Scale
HSCT: Hematopoietic Stem Cell Transplant
HIV: Human Immunodeficiency Virus
HSV-1: Herpes Simplex Virus type I
HSV-E: Herpes Simplex Virus Encephalitis
HSV-M: Herpes Simplex Virus Meningitis
KAVI-ICR: Kenya AIDS Vaccine Initiative - Institute of Clinical Research
IC: Internal Control
KEMRI: Kenya Medical Research Institute

xi
KFH: King Faisal Hospital
LAT: Latex agglutination test
MTA: Material Transfer Agreement
NHLS: National Health Laboratory Service
NRL: National Reference Laboratory
PCR: Polymerase Chain Reaction
RBC: Rwanda Biomedical Center
RMH: Rwanda Military Hospital
RNA: Ribonucleic acid
SOP: Standard Operating Procedure
SPIU: Single Project Implementation Unit
TB: Tuberculosis
TBM: Tuberculous Meningitis
T-I: Trans-Isolate
UoN: University of Nairobi
VZV: Varicella-Zoster Virus
WHO: World Health Organization
YPD: Yeast Extract Peptone Dextrose

xii
ABSTRACT
Background:
The incidence of meningitis and encephalitis in developing countries is underestimated due to
inadequate diagnosis as it is mostly based on conventional techniques with a limited detection
capacity for viral, bacterial and fungal aetiological agents. This results in prescription of a
combination of anti-viral, antifungal or antibiotics, as the aetiologic agent is unidentified.
Accurate diagnostic results are required for appropriate treatment options.
Aim: This research was designed to make a contribution in improving quality of diagnostic and
accuracy of meningoencephalitis in Rwanda.
Objectives:
1.To develop a novel algorithm for the detection of the most common bacterial, viral and fungal
etiological agents of meningoencephalitis using both culture and Real-time Multiplex PCR
methods.
2.To determine the drug susceptibility pattern of the detected bacterial agents of
meningoencephalitis.
3.To evaluate and demonstrate the utility of molecular diagnostic method compared with
conventional diagnostic methods in detection of etiologic agents of central nervous system
infections in Rwanda.
Materials and Methods:
Using cross sectional laboratory based study design, 845 hospitalized patients with meningitis and
encephalitis from four referral and four satellite hospitals were enrolled into the study. From each
patient four sterile tubes were used to collect Cerebral Spinal Fluid (CSF) specimens for analysis
using conventional and RT-Multiplex PCR methods. Two tubes were analysed on site for routine
diagnosis: One for bacteriology and fungal detection and the other for cytology and biochemistry.
The remaining two tubes were sent to the National Reference Laboratory (NRL) for conventional
and RT- Multiplex PCR.
xiii
Results:
Objective 1: From the study, 152 viral, 49 fungal and 105 bacterial etiological agents of
meningoencephalitis were detected. This represents 18%, 6% and 22% diagnostic capacities for
viral, fungal and bacterial aetiologic agents respectively.
Objective 2: Klebsiella pneumonia and Streptococcus agalactiae were 100% sensitive to
augmentin and 100% sensitive to cefotaxime respectively. Staphylococcus aureus was 90%
sensitive to penicillin, oxacillin and methicillin.
Objective 3: Using conventional techniques, no viruses were detected. However, with Real- time
Multiplex PCR a range of viruses, 152/845 (18%) were detected. In addition, different types of
bacteria 185/845(22%) were detected using Real-time Multiplex PCR compared with the
59/845(7%), detected using conventional techniques.
Conclusion: The results from this study showed rapid and accurate diagnosis of etiological agents
of Central Nervous System (CNS) infection. There was an improvement on diagnostic capacity
from 9% using conventional methods, to 40% using a combination of conventional and Real time
-Multiplex PCR methods. The use of RT- Multiplex PCR in detection of etiological agents of CNS
infections will contribute to accurate diagnosis and early, appropriate treatment of patients with
meningoencephalitis.
Recommendation: The Ministry of Health in Rwanda should consider developing a policy that
includes the use of this algorithm by Healthcare Professionals and laboratory networks in order to
improve quality of diagnosis for better treatment of patients with meningoencephalitis at all levels
in the country.

1
CHAPTER ONE: INTRODUCTION
1.1. Background
Meningitis is a severe disease resulting from an acute inflammation of meninges. Encephalitis is
the presence of an inflammatory process in the brain parenchyma associated with clinical evidence
of brain dysfunction. Meningoencephalitis is mostly caused by viruses, bacteria, fungi and
protozoa. The disease is known to cause significant morbidity and mortality (Baskin and Hedlund,
2007a).There are no reliable clinical symptoms at the initial stage of meningoencephalitis to
differentiate between viral, bacterial, fungal or protozoal infections. All suspected cases of
meningoencephalitis are therefore hospitalized. Early diagnosis is very important in order to
prescribe appropriate drugs (Baskin and Hedlund, 2007a).
The etiology of central nervous system infections varies depending on age group and region.
According to previously conducted research, approximately 30 to 40% of CNS infections are
caused by bacteria, while 60 to 70% are caused by Cryptococcus Species, viruses and brain
abscess (Mengistu et al., 2013).
Bacterial meningoencephalitis is often fatal in around 50% of untreated cases and causes
permanent pathological changes (Campagne et al., 1999). Bacterial meningitis diagnosis is
confirmed by CSF culture. Antibiotic susceptibility tests should be done to determine appropriate
drugs for treatment in the first critical hours (Mengistu et al., 2013).
Streptococcus pneumoniae, Neisseria meningitidis, Haemophilus influenzae, Listeria
monocytogenes and group B Streptococci are the most common causes of meningitis (Bartt,
2012), while Haemophilus influenzae type b (Hib) and Streptococcus pneumoniae mostly cause
meningococcal infection in children younger than five years (Taylor et al., 2012).

2
Isolation of bacteria from CSF using conventional techniques is unreliable due to 7 to 10 days
incubation period and prior use of antibiotics before sample collection (Ntagwabira et al., 2017).
The neurological complications and mortality by viral meningitis is mostly caused by
Enteroviruses (35 to 83%),and mumps (1 to 40%) (Minjolle et al., 2002). Herpes viruses, Toga
viruses, Bunya viruses, lymphocytic choriomeningitis virus, measles and Rubella viruses also
cause CNS infections.
Congenital Cytomegalovirus (CMV) infections mostly occur in patients with AIDS with
significant morbidity and mortality (Bartt, 2012). In immunocompromised persons adenovirus is
a common cause of viral infection (Cho and Mckendall, 2014). Acyclovir is the drug of choice
but requires early treatment to reduce morbidity caused by CMV (Bartt, 2012).
Diagnosis of viral meningoencephalitis is known to be challenging, but with newer molecular
techniques it has improved (Logan and MacMahon, 2008). Improved specific diagnosis enhances
early treatment with favourable outcomes of viral encephalitis (Baskin and Hedlund, 2007a).
Cryptococcus neoformans, Candida albicans and Aspergillus species are the most common causes
of fungal meningoencephalitis in immunocompromised patients (Baskin and Hedlund, 2007a).
Coccidioides immitis or Coccidioides posadasii also causes fungal diseases. In endemic regions,
this fungus accounts for about 20% of community-acquired pneumonia cases. It is a respiratory
tract infection with symptoms resembling those of bronchitis or pneumonia which can persist for
few weeks followed by spontaneous recovery in immunocompetent people. In most cases it is
asymptomatic (Malo et al., 2014).

3
1.2. Problem Statement
Acute bacterial, viral and fungal meningoencephalitis is a serious disease that needs rapid and
appropriate diagnosis for accurate treatment. These pathogenic and opportunistic infections are not
properly detected using conventional methods in the Sub-Saharan region and particularly in
Rwanda. As results the incidence of CNS infections is underestimated resulting to inappropriate
treatment of patients.
The Direct microscopic examination, culture methods, antibody and antigen detection assays as
conventional techniques in clinical microbiology laboratories for CSF analysis have several
limitations on it sensitivity and specificity.
Based on previous data from a study conducted by National Reference Laboratory from four
referral hospital laboratories in Rwanda for a period of four years (2009 to 2012), 91% of CSF)
specimens collected from hospitalized patients having clinical suspicion symptoms of
meningoencephalitis were found to be negative and only 9% were positive for different
microorganisms (Ntagwabira et al., 2017).
1.3. Justification
In a retrospective cross-sectional study conducted on hospitalized patients with clinical suspicion
of meningoencephalitis at four referral hospitals in Rwanda 2009 – 2012 (Ntagwabira et al., 2017).
,the 91% negative results from hospitalized patients suggest the conducted laboratory tests were
not specific for suspected causative microorganisms or the likelihood that the laboratory diagnostic
processes were incorrectly done. This could be due to lack of an appropriate algorithm for analysis
of CSF samples or prior use of antibiotics before CSF collection thus interfering with isolation of
pathogens cultured.
Despite numerous studies carried out, there are no clear, appropriate algorithms for diagnosis of
CNS infections in East African countries thereby limiting timely clinical interventions.

4
Conventional diagnostic methods used were not adequately guiding physicians to effectively treat
suspected meningoencephalitis patients. As a result, the high level of misdiagnosis not only leads
to inadequate or inappropriate patient treatment but also to delayed decision making by the
physicians in view of the 7 to 10 days waiting period it takes to obtain results from specimen
culture. If this is the case, then lack of accurate diagnostic tools for isolation of
meningoencephalitis causative agents may not only be leading to delays in starting appropriate
treatment and therefore to increased prevalence of serious morbidity and mortality, but also to an
underestimation of the burden of meningoencephalitis hence hampering formulation of effective
control strategies.
This study aimed at making a contribution to improved quality and accurate results in laboratory
diagnosis, appropriate therapy, early treatment and better management of patients with
meningoencephalitis in Rwanda by developing, establishing and implementing conventional and
molecular diagnostic techniques novel algorithms to detect the most common causative agents of
meningoencephalitis in CSF.
It was envisioned that the new diagnostic algorithm would assist the Ministry of Health of Rwanda
to achieve its mission by improving the quality of laboratory services within the laboratory
network, promote health and boost quality of life in Rwanda. An achievement of this study will be
to contribute to the attainment of the wider health sector aspirations for the country as enshrined
in the health sector strategic plan.
Furthermore, this study envisioned that the developed algorithm would help the Ministry of Health
in Rwanda to come up with policies for quick appropriate diagnosis and early treatment of
meningoencephalitis and also implement the use of the developed novel algorithm within the
medical laboratory network as it would greatly assist in patient care at all levels in the country.

5
The results obtained from the study will benefit health care facilities and the Ministry of Health by
providing information on leading causes of meningitis and encephalitis in Rwanda, and the
effectiveness of treatment using appropriate antibiotics from minimum inhibitory concentration
and disc susceptibility testing.
In addition, it is also expected that the outcome from the research will help other medical
laboratories in the African countries improve the quality of their services, such as in analysis of
CSF samples by detecting and identifying the causative agents for meningoencephalitis using
molecular techniques in their medical laboratories.
1.4. Objectives
1.4.1. Broad Objective
To compare detection capacities of conventional and Real-time Multiplex PCR methods of most
common bacterial, viral and fungal etiological agents of meningoencephalitis in Rwanda.
1.4.2. Specific Objectives:
1. To develop a novel algorithm for the detection of the most common bacterial, viral and fungal
etiological agents of meningoencephalitis using both culture and Real-time-Multiplex PCR
methods.
2. To determine the drug susceptibility pattern of the detected bacterial agents of
meningoencephalitis.
3. To evaluate and demonstrate the utility of the Real-time-Multiplex PCR over
conventional methods for detection of pathogens causing meningoencephalitis.
6
CHAPTER TWO: LITERATURE REVIEW
2.1. Bacterial, Viral and Fungal Meningoencephalitis
Meningitis is a serious CNS infection that causes acute inflammation of meninges, it is mostly
caused by viruses, bacteria, fungi and protozoa. It causes substantial morbidity and mortality.
Encephalitis is an inflammation in the brain parenchyma with symptoms of brain dysfunction.
(Baskin and Hedlund, 2007a).
Central Nervous System is protected by the blood-brain barrier which creates an obstacle for
pathogens which circulate in the blood without limiting vital nutrients reaching the brain (Coureuil
et al., 2017). This CNS barrier is made of meninges i.e. dura mater, arachnoid mater and pia matter.
Systemic bacteria can only cross this barrier through three sites. The first is the chroid plexuses
whereby it interacts with loose capillaries in the endothelium and cross the monolayer of
ependymal cells to reach CNS. The second is the capillaries of CNS barriers through interaction
with capillaries of leptominange followed by interstitial fluid drainage towards meninges through
lymphatic circulation. The last pathway is the non-hematogenous route, like crossing through
arachnoid villi or olfactory nerve axonal transport for respiratory tract colonizing bacteria.
This mechanism is also used by intracellular organisms able to multiply in macrophages and
dendritic cells facilitating them to cross through local immune cells of the host (Coureuil et al.,
2017).

7
2.1.1. Bacterial Meningitis
Bacterial meningitis is usually caused by extracellular pathogens, such as Neisseria meningitidis
Haemophilus influenzae, and Streptococcus pneumoniae. This bacteria are the most common
causes of meningitis in infants and adults globally (Thigpen et al., 2011).
Laboratory diagnosis plays a critical role in meningitis surveillance by efficiently detecting the
causative agents and guiding the appropriate treatment options for patients according to the
antimicrobial susceptibility results (Aguilera et al., 2002).
Haemophilus influenzae is a small Gram negative bacilli or coccobacilli. The most frequent
infection is caused by type b strains especially in unvaccinated infants in developing countries
(Pandit et al., 2005).
Streptococcus pneumoniae is a Gram-positive lanceolate diplococcus bacterium, but it can also be
seen in short chains of cocci which may be found in intracellular or extracellular spaces. It is alpha-
haemolytic on blood agar, sensitive to optochin and is bile soluble (Watt et al., 2009).
Pneumococcal meningitis is a rare and severe disease that can develop into a life-threatening
medical emergency. Early diagnosis and timely appropriate treatment is highly recommended to
minimize the risk of adverse outcomes (Johnson, 1996).
Streptococcus agalactiae is the most common cause of neonatal meningitis in industrialized
countries which occurs during or just after birth (Kim, 2016).
Group B Streptococcus is a Gram positive cocci in chain. They are beta-haemolytic, catalase-
negative and facultative anaerobes. They are surrounded by a polysaccharides capsule helping in
sub-classification into 10 serotypes. In general, they are harmless commensal bacteria colonizing

8
gastrointestinal and genitourinary tracts, but can cause opportunistic infections including
meningitis in immunocompromised persons (Berardi et al., 2010).
In pregnant women, hemorrhaging at the time of delivery can allow bacteria to invade the blood
stream and cause post-partum bacteremia, septicemia or even meningitis. It can also be transmitted
to the baby while passing the colonized birth canal and causing neonatal sepsis which can lead to
neonatal meningitis resulting in death or long-term disabilities (Leclercq et al., 2016).
Laboratory diagnosis relies on isolating beta-haemolytic bacteria on blood agar plate under 5-
10% C02, followed by biochemical and serological identification. Group B Streptococci is catalase
negative and reactive to group B antiserum of Lancefield grouping kit. On Gram stain they are
Gram positive cocci in chains (Steer and Plumb, 2011).
Escherichia coli, usually normal flora of gastro-intestinal tract, is Gram negative rod-shaped
bacteria. It causes neonatal meningitis and in the nosocomial setting, after penetration of brain
barrier due to cranio-cerebral injury or after neurosurgical procedures (Grundmann et al., 2011).
Community-acquired cases are mostly exclusively associated with immunosuppression , old age,
diabetes mellitus or chronic alcoholism (Elaldi et al., 2013). Infection with Escherichia coli is
associated with higher mortality rate compared with other bacterial meningitis (Gaschignard et
al., 2011).
Klebsiella pneumoniae is an aerobic, rod shaped, Gram-negative, lactose-fermenting, non-motile
bacterium. It is not a common pathogen, but it affects immunocompromised persons and causes
nosocomial infections (Pomar et al., 2013) with capsule polysaccharide as it virulence factors, it
can affect immunocompetent persons and cause meningitis (Lin et al., 2016).

9
Although Klebsiella pneumoniae meningitis is associated with high mortality rate, the third-
generation cephalosporin (cefotaxime, ceftriaxone, or moxalactam) provide excellent
antimicrobial activity both in vitro and in vivo (Teckie and Karstaedt, 2015). Appropriate
therapeutic drugs are an important factor for patient survival and neurological outcome. Therefore,
diagnosis should be done as soon as possible and empirical therapeutic drugs should be readily
available (Bouadma et al., 2006).
Staphylococcus aureus is Gram positive cocci, grouped in clusters with plasma coagulation
capacity due to its coagulase enzyme. It causes rare meningitis but can be fatal. (Aguilar et al.,
2010). Staphylococcal meningitis is diagnosed by CSF culture and biochemical identification.
The Staphylococcus aureus is catalase positive and coagulase positive. Linezolid is regarded as a
good treatment option due its capacity to penetrate the CNS easily. In severe cases and community-
acquired methicillin resistant Staphylococcus aureus infections, trimethoprim/sulfamethoxazole
or rifampin in addition to vancomycin is recommended (Aguilar et al., 2010). Individuals with
underlying chronic conditions have a higher risk of mortality (Van De Beek, Drake and Tunkel,
2010).
2.1.2. Bacterial Meningoencephalitis Diagnosis
Adequate CSF culture is normally used to identify causative bacteria of meningitis and also to
determiner antimicrobial susceptibility of the isolated bacteria in order to provide appropriate
antibiotics for treatment (Mengistu et al., 2013).
However, the lumbar puncture should be done before antibiotic treatment is prescribed so that the
positivity of CSF culture increases, since antibiotics taken before CSF collection may cause
negative CSF cultures (Mengistu et al., 2013). The PCR technique for diagnosis of

10
meningoencephalitis infection has been proven as useful meningitis detection method even after
antibiotics have been prescribed (Issa et al., 2003).
2.1.3. Antimicrobial drugs for treatment of bacterial meningoencephalitis
Results obtained from antimicrobial susceptibility are reported as either sensitive, resistant or
intermediate. Bacteria are said to be sensitive to an antimicrobial agent if the agent shows ability
to inhibit the growth of bacteria on in-vitro culture. This means that the satisfactory results are
expected when it is used to treat infection caused by that sensitive bacteria.
Resistance is defined as failure to kill or inhibit growth of bacteria on in-vitro culture. This means
that an infection caused by resistant microorganism cannot be treated using the resistant
antimicrobial agent drug (Pal Chugh et al., 2012).
Intermediate sensitivity is the moderate activity of an antimicrobial agent to the tested
microorganism (it is in between sensitivity and resistance). In case of lack of sensitive drugs,
higher doses of intermediate drugs may be used. In this case the toxicity of the antimicrobial
agents has to be taken into consideration (Pal Chugh et al., 2012).
Inappropriate use of antimicrobial agents may cause high resistance to antimicrobial agents.
Bacteria resistance to some antibiotics can be overcome by altering the dosage regimens or
inhibiting the resistance mechanism (e.g., beta-lactamase inhibitors), whereas other resistance
mechanisms can only be overcome by using an antibiotic from a different class. (Chugh et al.,
2011).
A study by Y. Chugh et al.2011, found that Gram positive bacteria causing meningitis are
highly sensitive (100%) to linezolid and vancomycin followed by piperacillin-tazobactam
(95.45%), amikacin (90.91%), cefoperazone-sulbactam (86.36%), meropenem (86.36%) and
pristinamycin (83.33%) (Chugh et al., 2011).

11
Gram-positive isolates have been reported to be sensitive to vancomycin and ceftriaxone while a
large number of gram-positive isolates have a multi-drug-resistance pattern to cefotaxime,
erythromycin, chloramphenicol and penicillin. A systematic microbial susceptibility pattern is
therefore highly recommended in clinical settings before patient treatment (Al Khorasani and
Banajeh, 2006).
A study of susceptibility pattern of gram negative bacteria isolated from CSF samples has
demonstrated that Gram-negative bacteria are 100% sensitive to meropenem and to pristinamycin
recommended for Neisseria followed by piperacillin tazobactam (94%) and observed 100%
susceptibility of E. coli to meropenem, piperacillin-tazobactam and cefoperazone-sulbactam (Pal
Chugh et al., 2012).
2.2. Viral Meningoencephalitis
Viral meningitis is frequently found in young children but it is also observed in patients of all ages.
Due to lack of diagnosis capacity, most viral meningitis cases worldwide are not reported. Specific
viral detection is very important because appropriate treatment will be offered to patients and
unnecessary antibiotics and hospital stay will be reduced. They mainly cause encephalitis and
aseptic meningitis. Encephalitis is also caused by Herpes simplex (HSV) and Varicella-zoster
(VZV) viruses, Cytomegalovirus, Epstein-Barr virus (EBV), and human Herpesvirus 6 (HHV-6) in
immunosuppressed patients (McGill et al., 2018).

12
2.2.1. Laboratory Diagnosis of Viral meningoencephalitis
The Diagnosis of viral meningitis is done by CSF sample analysis. In addition, CSF cytology
assists in the exclusion of neoplastic meningitis, viral meningitis is often characterized by a
lymphocyte pleocytosis particularly in enteroviral meningitis. The polymerase chain reaction is a
new rapid, sensitive and specific method for detection of RNA and DNA viruses in CSF samples,
which improves routine virological diagnosis and reduce costs of drugs and inpatient stays
(Koskiniemi et al., 2001).
2.2.2. Antiviral drugs for treatment of viral meningoencephalitis
Suspected or confirmed CNS viral infection should be treated using anti-viral drugs like acyclovir
for Herpes, Varicella-zoster encephalitis, ganciclovir and foscarnet for Cytomegalovirus
encephalitis and pleconaril for Enterovirus encephalitis.
There is no specific therapy for Adenovirus infection other than supportive and symptomatic
treatment, since most infections are self-limiting in the setting of a normal immune response and
do not require specific therapy (Lion, 2014).

13
2.3. Fungal Meningoencephalitis
2.3.1. Cryptococcus neoformans
Cryptococcus neoformans and Cryptococcus gattii are the main causes of fungal meningitis. They
are opportunistic human pathogens which cause life-threatening meningitis associated with high
morbidity and mortality (Boulware et al., 2010).
Cryptococcal infection is transmitted by inhalation of infectious propagules, that initially colonize
the lung and then enter central nervous system, the yeast can persist in human body by expressing
virulence capsule protein, melanin. Despite the strong association with HIV globally, some cases
are found in non-HIV individuals (Butler et al., 2012).
2.3.2. Diagnosis of Cryptococcal meningitis
Cryptococcus neoformans detection in CSF specimen using conventional methods is carried out
by Crag latex agglutination and microscopic Indian ink tests to identify capsulated yeast, and
culture on Sabouraud Dextrose Agar (Scriven et al., 2017).
Polymerase chain reaction based techniques for detection of C. neoformans, have been developed
for early and rapid detection for DNA from CSF specimen which is very reproducible and stable
over time (Chang et al., 2013).
2.3.3. Coccidioidomycosis
Coccidioidomycosis is infection caused by Coccidioides immitis or Coccidioides posadasii, both
dimorphic saprophytic fungi normally found in soil and cause infection to human by inhalation of
spores after soil disruption. These fungi are common causes of pneumonia which may lead to
systemic infection and meningitis (Taylor et al., 2012).

14
The infection is mostly asymptomatic. However, some cases are associated with clinical symptoms
like respiratory distress and skin lesions. The primary infection site is the respiratory tract. In
immunocompetent people, symptoms resemble bronchitis or pneumonia and can persist for a few
weeks followed by spontaneous recovery. In endemic regions, this fungus accounts for about 20%
of community-acquired pneumonia cases (Malo et al., 2014).
Diagnosis of Coccidioidomycosis is conducted through a combination of different methods, such
as clinical symptoms, radiographic imaging, and laboratory results. Laboratory diagnosis is
conducted through microscopic identification of diagnostic cells in body fluids and tissue biopsy
stained using the Papanicolaou method or Grocott's methenamine silver staining (Pappagianis and
Coccidioidomycosis Serology Laboratory, 2007). The two causative agents of coccidioidomycosis
(C. immitis and C. posadasii) are very similar, and can only be distinguished by molecular
techniques with specific nucleotide primers which have been developed for C. immitis DNA
amplification in PCR assay (Malo et al., 2014).
Treatment of coccidioidomycosis requires long term anti-fungal therapy, lasting approximately
three to six months. In immunocompromised individuals the recommended drugs for disseminated
infection are oral fluconazole and intravenous amphotericin B. Other alternatives include
itraconazole and ketoconazole for milder disease. For coccidioidal meningitis, the medication of
choice is fluconazole due to its penetration into CSF (Botero Aguirre and Restrepo Hamid, 2015).
2.3.4. Histoplasmosis
This is an infection caused by Histoplasma capsulatum, normally found in soil from bird
droppings. Humans are infected through inhalation of infectious elements released by disruption
of soil during excavation or construction. It is primarily a lung infection but can disseminate to

15
other organs, and become fatal if not treated adequately. Histoplasmosis is observed more
frequently among immunocompromised people especially HIV positive patients. In
immunocompetent individuals, the primary infection leads to development of immune memory
resulting in partial protection against this fungus in case of reinfection (Kauffman, 2007). The
infection incubation period is 3 to 17 days after exposure. It is mostly an infection without clinical
manifestations, since intact immune system provides protection.
Among immunocompromised individuals chronic histoplasmosis can develop tuberculosis-like
lung disease. Disseminated histoplasmosis affects different organs including the brain causing
histoplasmal meningitis which is always fatal if not adequately treated.
Diagnosis of histoplasmosis is based on detection of fungus in samples from infected organs.
Antigens or antibodies are detected from blood, urine or CSF samples using ELISA. It often
requires confirmation by culturing on Sabouraud or on YPD agar (Nielsen et al., 2012).
In the majority of immunocompetent individuals, there is no treatment required because it gets
cured spontaneously. Antifungal medications used to treat severe cases of acute histoplasmosis
and all cases of chronic and disseminated histoplasmosis are amphotericin B, followed by oral
itraconazole (Nielsen et al., 2012).

16
CHAPTER THREE: MATERIALS AND METHODS
3.1. Study Design
This was a laboratory based cross-sectional study.
3.2. Study Area
The study was conducted at the National Reference Laboratory using samples collected from eight
selected sites. These were four referral hospitals consisting of King Faisal Hospital, Rwanda
Military Hospital, Butare University Teaching Hospital, Kigali University Teaching Hospital; and
four satellites hospitals namely, Gisenyi Hospital, Kibungo Hospital, Nyagatare Hospital and
Byumba Hospital (See appendix 1).
These hospitals were selected in order to cover all the provinces in Rwanda. A key selection criteria
was that the hospitals had to have a laboratory bacteriology section that had the capability of
examining CSF specimens using conventional diagnostic methods. The CSF samples were
collected in 3 departments namely Emergency, Internal Medicine and Paediatrics. All collected
adequate specimens were taken to the study site laboratory for diagnosis, packaging and shipment
to National Reference Laboratory. The study samples were collected between February 2017 and
February 2018.
3.3. Study Population
Eight hundred and forty-five (845) hospitalized patients with clinical signs and symptoms of
meningoencephalitis, both males and females of all ages. CSF samples were obtained from each
of these patients and examined for causative pathogens using macroscopy, microscopy, staining
culture and RT- multiplex PCR. The collected 845 samples were distributed as follows; King
Faysal Hospital (37), Rwanda Military Hospital (84) Butare University Teaching Hospital (154),
17
Kigali University Teaching Hospital (391), Gisenyi Satellite Hospital (27), Kibungo Satellite
Hospital (55) Nyagatare Satellite Hospital (29) and Byumba Satellite Hospital (68). Only adequate
specimens collected from patients with signs and symptoms indicated in the case report form were
used for this study.
3.4. Sample size calculation
The sample size calculation was carried using the Fishers formula (Fisher et.al., 1998):
n= Z²α/2 (p) (1-p)] /d²
Z= is the corresponding value to the 95% confidence interval
Based on National Laboratory Network surveys on CSF specimen analysis in Rwanda at four
referral hospitals, the diagnostic capacity of identifying causative agents of meningoencephalitis
using conventional method was only 8.6%. Using the application of a novel algorithm for
diagnosis of specific suspected causative aetiologic agents, an improvement in the diagnostic
capacity by at least 40% was desirable.
Thus the minimum sample size required was calculated using the following parameters:
P=0.086 δ=0.40
n = (Z α/2+ Z β) 2 [P (1-P)/(δ)2]
n= (2.82)2[0.078604]/ (δ)2 = 0.6250904496/δ2
Z α/2: Is the corresponding value to the 95% confidence interval = 1.96
Z β : Value corresponding to power of the test taken to be 80% and corresponds to a value 0.86

18
P: Prevalence of the diagnostic capacity for causative agents of meningoencephalitis in different
referral hospitals in Rwanda from CSF specimens.
δ= is the error of margin usually taken around 5% but for the current this varied in accordance to
the proposed simulation method.
N= is estimated samples size
Thus the sample size required for the study was as given below:
δ=40% of 8.6%= 0.0344
n= (2.82)2[0.078604]/ (0.0344)2 =845
3.5. Selection Criteria
3.5.1. Inclusion criteria
All consenting and assenting inpatients and coma patients’ proxies of all ages hospitalized with
clinical signs and symptoms of meningoencephalitis indicated in the case report form in the
selected sites during the study period in Rwanda, who signed consent and assent forms.
3.5.2. Exclusion criteria
All non-consenting, non-assenting patients and coma patients’ proxies of all ages hospitalized with
signs and symptoms of meningoencephalitis indicated in the case report form in selected study
sites during the study period in Rwanda. Patients with the following were excluded from the study:
INR > 1.5, platelet counts < 50,000, intracranial mass, partial/complete spinal block or acute spinal
trauma.
19
3.6. Ethical considerations
This study was reviewed and approved by both Rwanda National Ethical Committee and Kenyatta
National Hospital/University of Nairobi Ethics and Research Committee prior to its
commencement. The approval numbers are No 572/RNEC/2041, KNH/UON ERC-P561/09/2014
respectively). The approvals were renewed annually, see appendices 3A-F, 4A&B, 5 A&B).
Privacy and confidentiality of the patients was upheld at all stages of the study.
3.7. Recruitment of Study Teams
The Principal Investigator and study team trained from National Reference Laboratory met with
the management of the study sites and explained the purpose of the research and its importance.
Thereafter, the management of the hospitals nominated study teams who included medical doctors,
nurses and laboratory personnel based on their capacity. The identified study teams were trained
on the study materials, sample collection, storage and transportation and all required materials
were distributed from National Reference Laboratory to the sites. A research monitor visited all
the selected sites to evaluate the readiness of the sites to carry out the study and once he gave a
directive or positive report, the recruitment of participants and sample collection began. Regular
monitoring visits were conducted to ensure that staff on sites follow procedures correctly for
quality and accurate study results.
3.8. Recruitment of Study Subjects
All consecutive, eligible patients were enrolled into the study by consulting doctors in emergency,
internal medicine and paediatric departments until the required sample size was reached.
20
The clinicians examined the patients for symptoms and abstracted signs like photophobia using
light, tested altered mental status to determine confusion using Glasgow Coma Scale (GCS) and
meningeal signs using Kerning and Brunziski signs.
In addition, they were responsible for selection of meningitis cases to be enrolled and filling of
study case report form. Every patient enrolled was assigned a serial registration number. A pre-
designed case report form was used to obtain patient history and socio-demographic information
(See appendix 2).
3.9. Quality Assurance at sites
Continuous monitoring of all procedures was regularly conducted to ensure quality of all study
steps. Orientation training of research sites medical and laboratory personnel was done before
starting recruitment of study participants and regular monitoring visits were done to ensure that
staff follow procedures correctly and understood their role. Before sample collection, the Standard
Operating Procedures were developed and distributed to all study sites, for use during sample
collection, transportation and analysis.
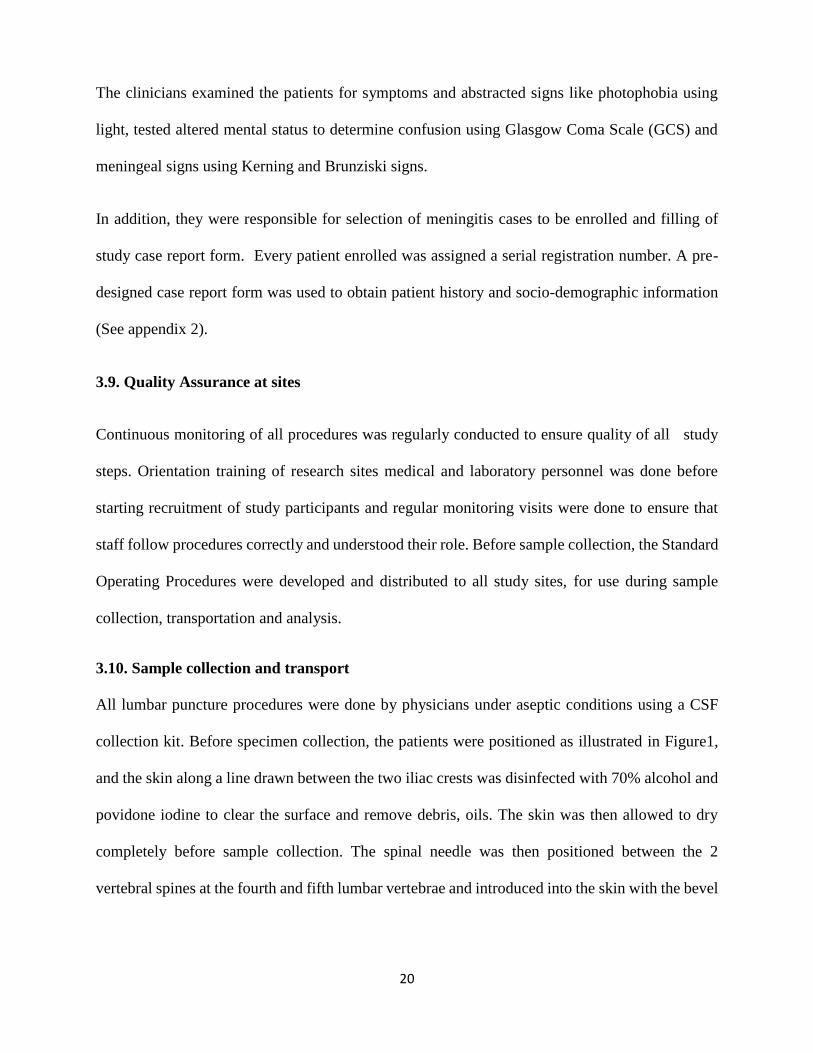
3.10. Sample collection and transport
All lumbar puncture procedures were done by physicians under aseptic conditions using a CSF
collection kit. Before specimen collection, the patients were positioned as illustrated in Figure1,
and the skin along a line drawn between the two iliac crests was disinfected with 70% alcohol and
povidone iodine to clear the surface and remove debris, oils. The skin was then allowed to dry
completely before sample collection. The spinal needle was then positioned between the 2
vertebral spines at the fourth and fifth lumbar vertebrae and introduced into the skin with the bevel

21
of the needle facing up as illustrated in Figure 3. Accurate placement of the needle helped to collect
the fluid, which normally is clear and colorless without blood.
Once the needle was in position, the CSF pressure was measured and a sample of 1 to 3 ml of
CSF was collected into each of the 4 sterile screw up tubes. Four sterile separate tubes each with
at least 1 ml each were needed. The tubes were labelled with the patient’s name, date and time of
specimen’s collection and unique identification number that was matched on both request forms
and report forms. After collection of CSF, 2 tubes were analysed on site, one for biochemistry and
cytology and the other for pathogen detection using routine/conventional diagnostic methods. The
two remaining tubes were transported to NRL, one for pathogen detection by routine/conventional
methods and the other one by molecular diagnostic method.
CSF samples were transported to the site laboratories within 15 minutes after collection and
processed immediately on site in microbiology and clinical chemistry laboratories. Where it was
not possible to be analysed within 1 hour, samples were inoculated into Trans-Isolate (T-I) medium
for culture (see Figure 2).
Samples for molecular diagnosis were transported in cold triple packaging and stored in - 20°C or
- 70°C, waiting for 96 samples for analysis. Before inoculation in T-I medium the aluminium cover
was removed using sterile forceps and the stopper was disinfected with 70% alcohol and allowed
to dry. For inoculation of CSF into T-I medium, sterile syringes and needles were required 0.5 to
1 ml of CSF was inoculated into T-I medium and after inoculation the T-I medium bottle were
mixed several times. If transportation for T-I medium to National Reference Laboratory was
delayed to the next day or longer, averting needle (sterile cotton plugged hypodermic needle) was
inserted through the rubber stopper of the T-I medium bottle, which ensured growth and survival
of the bacteria. The used needles were discarded in a puncture resistant, autoclavable container.
22
CSF were handled as potentially infectious clinical specimens in order to maintain a safe working
environment for health care workers and laboratories. During manipulation of CSF specimens,
proper biosafety guidelines were adhered to and CSF was analysed in biosafety cabinets.
Cerebrospinal fluid is normally sterile but contaminants can easily be introduced by non-
application of aseptic techniques, both in the wards and in the laboratory.
Examination of CSF is an emergency and specimens should be examined without delay. The
preliminary results of tests i.e. Gram stain, latex agglutination and white cell count, were
immediately reported to the attending physician or a senior nursing staff in the ward immediately.
Before a lumbar puncture was done the laboratory staff were informed, to enable the laboratory to
be ready to receive and examine the specimen immediately.
Figure 1: Lumbar puncture to collect sample of cerebrospinal fluid (Ajello et al., 1984)

23
Figure 2: Picture of bottle of Trans- Isolate medium used in the study
3.11. Onsite sample processing
The volume of collected CSF samples was recorded and its gross appearances noted as clear,
bloody, cloudy, or xanthochromic. Clear CSF samples were tested using cryptococcal latex
agglutination and India ink microscopy for detection of C. neoformans antigen.
Adequate turbid samples were tested using latex agglutination for detection of specific
polysaccharide surface antigens, for most common bacteria as causative agents of meningitis.
The specimen was then centrifuged for 20 min at 1,500 to 3,000 ×g if the volume recorded was
>1 ml. The sediment was vortexed vigorously for at least 30 s yeast cells surrounded by a
characteristic polysaccharide capsule, respectively to re-suspend the pellet.
Using a sterile pipette, media was inoculated by placing 1 or 2 drops of sediment on an alcohol-
rinsed slide, allowing drop to form a large heap. The slide was then air dried on a slide warmer
before being gram stained as described by Fouad et al., 2014.
24
The CSF gram stained smears were examined and interpreted immediately and all positive smears
were immediately reported to the physician and nursing unit by telephone. The telephone
notification was documented.
The glucose concentration in CSF was determined using enzymatic oxidation method (peroxidase)
and quantified using spectrophotometer COBAS C311.
The CSF protein concentration is considered as one of the most important indicators of
meningoencephalitis. The protein concentration in CSF sample was determined using
spectrophotometer Cobas C311 automated machine. Normal protein ranges to be considered was
15 to 60 milligrams per mg/dl or 0.15 to 0.6 mg/ml.
The second tube was used Indian ink staining for detection of Cryptococcus neoformans. Indian
ink test was done using one drop of Indian ink reagent mixed with one drop of fresh CSF sample
on slide and covered by cover slide then examined under microscopy in order to identify capsulated
yeast. The capsule of Cryptococcus in Indian ink wet mount preparation appears as clear zone
around the yeast in a black field.
Twenty-five µl of cryptococcus antigen positive control, negative control and was added to CSF
specimen onto the ring slide, then 25 µl of cryptococcal latex to each ring was added. Using
applicator sticks, each ring was thoroughly mixed, and rotated by hand or ring slide placed on a
rotator set to 100 rpm (+/- 25) for 5 minutes at room temperature. The results were read
immediately by looking for cryptococcus antibodies.

25
3.11.1. Culture examination
All collected CSF samples in four referral hospitals were transported within 1 h and centrifuged at
1000 ×g for 10 to 15 min with supernatant, used for rapid diagnostic test. Sediment was used for
gram stain and primary plating on chocolate, blood agar, MacConkey agar and sabouraud dextrose
agar. All plated and thioglycolate broth media were examined for macroscopic evidence of growth.
With no visible growth on the culture media, broth was re-incubated and negative plates were
examined daily for 72 h before discarding. Broth media was also examined daily for 5 to 7 days
before discarding.
3.11.2 Culture with growth and organism identification
From colony appearance, colony was picked to prepare gram stain broth, if positive. Semi
quantitative growth was put on plated media and gram stain prepared for each morphotype. The
microorganisms were identified based on the morphology of colonies, and by biochemical reaction
and serotyping.
Antimicrobial sensitivity was also done according to the isolated microorganisms. The physician
was notified of culture findings and antibiotic sensitivity patterns.
After analysis the results were immediately recorded in the log book and sent to the attending
physician for either initiation or continuation of treatment. The CSF T-I inoculated bottles were
incubated at 37°C in candle jar and untreated CSF tube ,fourth tube was kept at -20°C until
shipment to NRL for DNA/RNA extraction and analysis using molecular method.

26
Figure 3: Existing algorithm for diagnosis of CNS infections using conventional method in DHS and PHs in Rwanda 2018
Aseptic collection of CSF in sterile and capped screw before antimicrobial treatment
Don’t store CSF in refrigerator
Transfer CSF to laboratory within 15 minutes
Macroscopic examination
Cytology
White blood cell count and differential
Send result
Centrifuge at 2000 rpm for 5
Deposit
Gram stain
Send result
Indian ink
Send result
Supernatant
Biochemistry
Glucose and proteins
Send result
Heat at 80-1000C for 5 min or at 560C for 30 min
Centrifuge at 2000 rpm for 5 min
Supernatant
Latex agglutination
Send result

27
3.11. 3. Sample shipment and transportation from sites to NRL
Among four collected tubes the third and fourth CSF sample tubes were transported to NRL for
analysis. The third was inoculated in Trans-Isolate as soon as possible without delay after
collection and transported at room temperature. The fourth tube was transported in a cool box with
ice in triple packaging. All specimens were sent with their signed consent/assent and case report
forms in 4 hours after specimen collection to NRL.
3.12. Quality Assurance on conventional method
To ensure quality and accuracy of study results, the method was validated using the known positive
samples selected from the NRL archived strains of Neisseria meningitis, Streptococcus
pneumoniae, and Haemophilus influenzae B, from the NHLS, South Africa Cryptococcus
neoformans from NRL archive as well as ATCC bacterial species (Neisseria meningitis,
Streptococcus pneumoniae, Escherichia coli and Haemophilus influenzae B) were incorporated in
each culture processing lot. All samples were processed according to the Standard Operating
Procedures.
3.13. Sample processing at NRL using conventional method
The specimen in T-I was aseptically inoculated on chocolate agar, sheep blood agar, and
MacConkey agar. The remaining specimen in T-I bottles was incubated at 35-37°C in ~5% CO2
then checked daily for 7 days for turbidity, to enhance growth in case of failure of the initial culture
The venting needle was inserted in the TI bottle through the bottle rubber stopper plugged with
sterile cotton wool, in order to promote growth and survival of bacteria.

28
When T-I turned turbid, culture on blood and chocolate agar was done then incubated at 35-37°C
in a ~5% CO2 for 24 to 48 hours before reporting negative culture and also on MacConkey agar
and incubated at 35-37°C for 18 to 24 hours. In absence of turbidity after 7 days, sterility of sample
was tested by systemic inoculating specimen on sheep blood, chocolate and Mac Conkey agar,
before discarding the T-I media.
In presence of growth young colonies were used for Gram staining then biochemical testing (API
20E, API NH, catalase, coagulase, oxidase, CAMP test) and serotyping. Antimicrobial
susceptibility test was done on isolated bacteria using recommended antibiotic discs on Mueller-
Hinton agar, Kirby-Bauer method and Clinical and Laboratory Standards Institute (CLSI)
catalogue for result interpretation.
One drop of CSF specimen from molecular samples was inoculated on Yeast Extract Peptone
Dextrose (YPD) and incubated at 35- 37°C, then checked after 48 hours for growth, if no growth,
the plate was re-incubated and checked daily up to 7 days. The specimen for molecular testing was
tightly closed and stored at -20°C. The colonies growing on YPD were identified using Indian ink
and Cryptococci antigen latex agglutination (CSF analysis steps followed at NRL are summarized
in Figure 7).
The results were recorded into Laboratory Information System and Epi-Info data base. All positive
results were reported to attending physician by phone call and all printed results were sent by
sample transportation system once in a week to each study site.

29
3.14. Real- time multiplex Polymerase Chain Reaction Assay Validation
3.14.1 Quality control
Known positive control strains used during culturing above were also used as the positive controls
for the bacteria detection and specificity of the PCR assays. Accuracy and reliability of the study
was validated and verified using known positive samples selected from the following NRL
archived strains: Neisseria meningitis, Streptococcus pneumoniae, Haemophilus influenzae B, and
Cryptococcus neoformans.
ATCC bacterial species (Neisseria meningitis, Streptococcus pneumoniae, Escherichia coli and
Haemophilus influenzae B, and also strains for positive control from the NHLS, South Africa and
from NRL archive were used. 10% of each isolated microorganism and 5% of negative samples
were sent to Kenya AIDS Vaccine Initiative - Institute of Clinical Research for external quality
control which confirmed the study accuracy.
3.14.2. Nucleic acid extraction
Nucleic acid was extracted from the above known positive controls archived from NRL using an
automated nucleic acid extraction platform (QIAsymphony SP-Qiagen, Germany). The
QIAsymphony DSP virus /pathogen mini kit was used according to manufacturer’s instruction
with a starting volume of 250μl and an elution volume of 60μl.
The nucleic acid was then purified by washing in a series of wash buffer on rod covers before
finally being released in the elution buffer. Sterile nuclease free water was used as a negative
control of extraction.
The extracted nucleic acid was collected in elution racks, labelled and quantified using QiAxpert
nucleic acid quantifier system (Qiagen, Germany) to establish the quality and quantity of the
30
eluates. The quality of extracted nucleic acid was validated on wavelengths 230/260 and 260/280
ratios to check for sample purity. The eluted nucleic acid was used directly in Real time-PCR and
the excess stored at -800C for long storage or 4 to 8°C for short storage.
3.14.3. Master mix preparation
Pre-optimized Commercial RT-multiplex PCR kits for in-vitro diagnostics were used. The kits
comprising of PCR buffer, primer and probe mix(PPmix) and Taq polymerase enzyme were
provided in three separate tubes and required constitution of the mastermix before adding the
templates. Both automated and manual mastermix preparations were evaluated for their efficiency
in processes and also on optimal reagent usage. QIAgility (Qiagen, Germany) liquid handler was
used for the mastermix. The system was programmed to pipette 12.5 µl of PCR buffer, 1.5µl of
PPmix, 1.5µl of the enzyme and 2 µl of internal control into a 1.5ml tube and later aliquoted 15µl
into individual 0.1ml PCR ml tubes that were compatible with the thermalcycler (Rotor Gene Q,
QIAGEN-Germany). 10l of the extracted sample nucleic acid was added to the mastermix into
each tube including the extracted negative control sample. Positive and negative controls from the
manufacturer were included in each run. In total, we used four RT-multiplex PCR kits namely:
FTD bacterial meningitis FTD Neonatal meningitis, and FTD Neuro9 all from Fast Track
Diagnostics, Luxembourg, Germany and Cryptococcus neoformans Real-TM kit from Sacace
Biotechnologies, Italy.
The PCR setup for the Cryptococcus neoformans entailed 10 µl of PCR mix -1, 1.5 µl of PCR
mix-2, 0.5 µl of DNA Polymerase, 2 µl of internal control and sterile water into each PCR reaction
tube followed by 10 µl of the extracted nucleic acid. Specificity of the assays was tested by
amplifying known strains in the kits without their targets. The tubes were sealed, labelled and

31
transferred to the real time thermalcycler (Rotor Gene Q -Qiagen, Germany) for amplification.
(See protocol on appendix 7).
3.14.4. Amplification
The DNA was amplified simultaneously in the same tube by polymerase chain reaction. In
multiplex PCR, a cocktail of primers and probes targeted multiple pathogens. The presence of
specific pathogen sequences in the reaction was detected by an increase in fluorescence observed
from the relevant dual-labeled probe, and reported as a cycle threshold value (Ct) by the Real-time
thermocycler. The assays used murine Cytomegalovirus (m CMV) and Brome mosaic virus (BMV)
as the internal controls which were introduced into each PCR reaction tube during the PCR setup
to check for PCR efficiency.
In this study we used the three pre-optimized kits from Fast Track Diagnostics (FTD bacterial
meningitis, FTD Neonatal meningitis kit, FTD Neuro9 kit). The kits used) similar amplification
programme involving an initial enzyme activation step at 950C for 15’ minutes and 5 cycles
comprising of denaturation at 950C for 5 seconds, annealing step at 600C for 20 seconds and
extension step at 720C for 15 seconds without fluorescence detection. This was followed by 40
cycles comprising of denaturation at 950C for 5 seconds, annealing step at, 600C for 15 seconds
and extension step at 720C for 15 seconds with fluorescence detection on four detection channels
of the thermocycler as indicated on table 1.
Similarly, the pre-optimized commercial real-time PCR kits was used for detection of
Cryptococcus neoformans and entailed an initial enzyme activation step at 950C for 15’ minutes
and 5 cycles comprising of denaturation at 950C for 5 seconds, annealing step at 600C for 20
seconds and extension step at 720C for 15 seconds without fluorescence detection, followed by 40
cycles comprising of denaturation at 950C for 5 seconds, annealing step at, 600C for 20 seconds

32
and extension step at 720C for 15 seconds with fluorescence detection on green and yellow at the
annealing step (600C).
3.14.5. Interpretation of the PCR assays
Specific probes were detected on four different channels on Rotor Gene Q, matched up with
specific pathogens as shown on table 1. The detection involved analysing the PCR assay upon
completion using Rotor Gene Q software to check for contamination by analysing the negative
controls and establishing PCR amplification efficiency.
The threshold was set at a point above negative control and the Ct value for the positive and
internal controls was below 33 while the amplification exhibits positive (i.e. exponential trace).
Any specimen displaying an exponential trace with a Ct value below 33 is considered positive. A
detection guide outlined in table 1 was provided by the manufacturer for establishing the pathogens
detected in the positive samples. Appearance of any curve in the negative control was considered
as potential contamination, and therefore the results obtained were not interpretable. The whole
run including extraction had to be repeated. The run was also repeated where the positive and
internal controls did show amplification curves.
The validation of the RT multiplex PCR Assays was considered successful upon detection of the
known NRL strains used as positive controls of nucleic acid purification. The assays also amplified
the positive and internal controls provided in the kits while both the negative control of purification
and the one provided in the kit did not amplify.

33
Table1: Detection guide for the targets in the four RT- Multiplex PCR kits used for
analysis of CSF specimens from patients with CNS infections.
Kit Name Tube Green
Dye(Wavelenth-
520nm)
Yellow
Dye(Wavelenth-
550nm)
Orange
Dye(Wavelent
h-610nm)
Red
Dye(Wavelenth-
670nm)
FTD Neuro9 1 EBV CMV IC NC
2 HSV1 HSV2 IC VZV
3 EV PV IC -
4 HHV6 B19 HHV7 IC
FTD Bacterial
Meningitis kit
1 H. influenzae N. meningitis IC S. Pneumonia
FTD Neonatal
meningitis kit
1 Group B
Streptococci
IC Listeria
monocytogenes
2 E.coli
Cryptococcus
neoformans Real-
TM kit
1 IC Cryptococcus
neoformans
3.14.6. Processing of Patient samples using Real-time Multiplex PCR
Upon validation of the PCR assays, all the 845 patient samples were processed using the above
validated assays. The quality of the assays was continuously monitored by running positive,
negative ad internal controls in each run. The automated extraction system extracted 96 samples
including a positive and negative controls. The Rotor gene was able to run up to 72 reaction tubes
per run. Analysis was done manually by visual inspection of the amplification profiles for every
sample on each wavelength channel.
3.15. Data entry and analysis
Epi Info7 software was used for data entry and data analysis was done using standard statistical
method like univariate, bivariate and multivariate analysis, the data was analysed using Epi Info
7, MS Excel, SPSS and Stata 16.

34
CHAPTER FOUR: RESULTS
Eight hundred and forty-five CSF specimens collected from meningoencephalitis suspected
patients were analysed using conventional and RT Multiplex PCR diagnostic techniques. Female
were 434 (51%) while male was 411(49%) of the total study population.
4.1. Characteristics of study population
The demographic representation of the age groups is shown in figure 4, x axis represents age group
while y axis represents frequency as a percentage. The most frequently affected population was
the age group 25 to 34 years’ old which constituted 21% of the patients seen, while the least
frequently affected age group was that aged 5 to 14 years old constituting 9% of the patient
population.
Figure 4: Demographic representation of study population by age group (n=845)
31%
13%
23%
14%
8%
11%
0%
5%
10%
15%
20%
25%
30%
35%
1 - 10 11 - 20 21-30 31-40 41 - 50 >=51
Pe
rce
nta
ge
Age group
Study population represented in age group

35
4.2. Clinical Characteristics of study population
Table 2: Frequency of CNS infections signs and symptoms by age group
Signs and symptoms 0 – 4
years
5 – 14
years
15 – 24
years
25 – 34
years
35 – 44
years
45 – 54
years
>= 55
yrs Total
Chills 0 2 2 1 5 1 2 13
Coma 5 7 15 12 8 7 11 65
Confusion GCS 19 20 40 67 56 30 32 264
Convulsions 75 31 28 21 15 10 10 190
Cranial nerve
abnormalities 1 0 1 2 0 0 0 4
Fever 124 65 130 136 95 57 56 663
Headache 32 49 151 160 122 69 75 658
Lethargy 28 18 21 19 15 7 14 122
Neck stiffness 19 20 74 58 53 32 31 287
Neurological deficit 1 3 4 6 3 2 6 25
Irritability 43 28 62 69 57 37 37 333
Photophobia 21 19 52 66 52 27 31 268
Kernig/ Brunziski sign 3 2 10 7 8 1 5 36
Nausea 43 35 70 64 68 28 33 341
Vomiting 43 34 57 43 46 21 17 261
The most frequently observed sign was fever, at 663 (76%) while headache was the most
frequently reported symptom by 658 (75%) of the patients. Only 4(0.5%) and 13(1.5%) had
cranial nerve abnormalities or chills, respectively as shown in table 2.

36
4.3. Conventional methods results analysed on study sites.
Gram staining results in the figure 5 below shows bacteria identified in CSF of the patients with
meningoencephalitis. X axis represents age groups while Y axis represents number of isolates.
Only a very small number of the CSF samples 37(4%) showed bacteria on Gram staining. The
most frequently seen bacteria were gram negative bacilli Escherichia coli and Klebsiella
pneumoniae) with positivity rate of 23(62%), followed by gram positive cocci (Staphylococcus
aureus and Streptococcus agalactiae) 10 (27%) and gram negative diplococci (Neisseria
meningitidis) 3(8%). The least seen was gram positive diplococci (Streptococcus pneumoniae)
1(3%). Gram negative bacilli were most frequently identified in the CSF of 0 to 4-year-old
children, whereas gram positive cocci were most frequently identified in the CSF of those aged 55
years and above. No bacteria were seen on Gram staining in CSF obtained from the 34 to 44 years’
age group. The Gram staining results from study sites shows that, the most affected are age group
0-4 with 15 (65%) out of 23, followed by age group >= 55 with 4(40%) out of 10. The less
affected age was age group 34 - 44 with 0(0 %) out of 37.
Figure 5: Gram staining results by age group
15
3
12
0
2
01
0 0 0 0 0
221 1
0 0
2
4
0 0 0 0 01
00
2
4
6
8
10
12
14
16
0 - 4 05 - 14 15 - 24 25 - 34 35 - 44 45 - 54 >= 55
No
of
iso
late
s
Age group
Gram negative Bacilli
Gram negative Diplococci
Gram positive Cocci
Gram positive Diplococci

37
Using Indian ink, Cryptococcus neoformans were identified at each study site as shown in figure
6 below: X axis represents study sites while Y axis represents number of isolates. CHUB 14 out
of 154 samples (9 %), followed by KFH 3out 37(8%), Gisenyi 2 out of 27 (7%), Nyagatare 2 out
of 29 (7%), CHUK 20 out of 391 (5%), RMH 3out of 84(4%), Kibungo 2 out of 55(4%) and
Byumba 2 out of 68(3%).The prevalence of Cryptococcus neoformans was slightly higher in men
25/411 (6%) than in women 23/434 (5%).
Figure 6: Cryptococcus neoformans identified using Indian ink by study sites and gender.
1
7
13
0 01 1
21
7 7
2 2 21 1
0
2
4
6
8
10
12
14
No
of
iso
late
s
Study sites
Male
Female
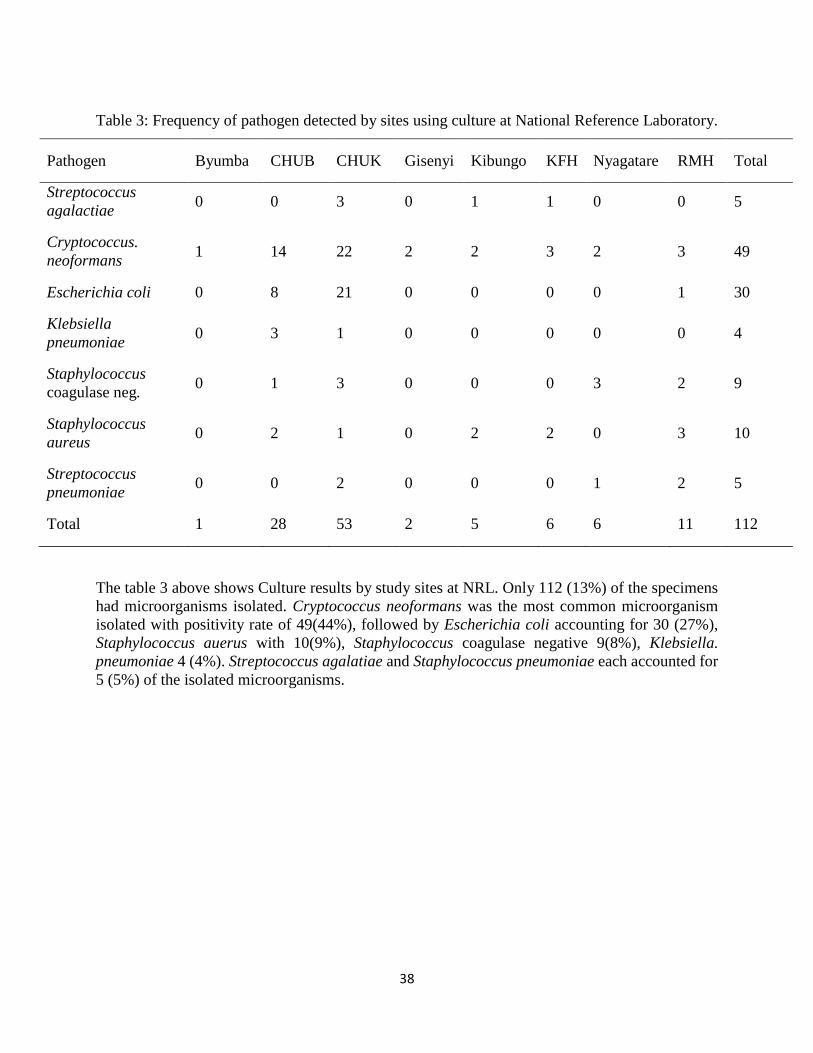
38
Table 3: Frequency of pathogen detected by sites using culture at National Reference Laboratory.
Pathogen Byumba CHUB CHUK Gisenyi Kibungo KFH Nyagatare RMH Total
Streptococcus
agalactiae 0 0 3 0 1 1 0 0 5
Cryptococcus.
neoformans 1 14 22 2 2 3 2 3 49
Escherichia coli 0 8 21 0 0 0 0 1 30
Klebsiella
pneumoniae 0 3 1 0 0 0 0 0 4
Staphylococcus
coagulase neg. 0 1 3 0 0 0 3 2 9
Staphylococcus
aureus 0 2 1 0 2 2 0 3 10
Streptococcus
pneumoniae 0 0 2 0 0 0 1 2 5
Total 1 28 53 2 5 6 6 11 112
The table 3 above shows Culture results by study sites at NRL. Only 112 (13%) of the specimens
had microorganisms isolated. Cryptococcus neoformans was the most common microorganism
isolated with positivity rate of 49(44%), followed by Escherichia coli accounting for 30 (27%),
Staphylococcus auerus with 10(9%), Staphylococcus coagulase negative 9(8%), Klebsiella.
pneumoniae 4 (4%). Streptococcus agalatiae and Staphylococcus pneumoniae each accounted for
5 (5%) of the isolated microorganisms.

39
Table 4: The relationship between pathogens isolated and HIV status
Isolated pathogen HIV Positive
N= 148
HIV Negative
N= 697
Total
N=845
Cryptococcus neoformans 26 (18%) 23 (3%) 49 (6%)
Escherichia coli 1 (1%) 29 (4%) 30 (4%)
Klebsiella. pneumoniae 0 (0%) 4 (1%) 4 (0%)
Staphylococcus coagulase negative 4 (3%) 5 (1%) 9 (1%)
Staphylococcus aureus 2 (1%) 8 (1%) 10 (1%)
Streptococcus group B 1 (1%) 4 (1%) 5 (1%)
Streptococcus pneumoniae 1 (1%) 4 (1%) 4 (0%)
In the table 4 above, Cryptococcus neoformans was more detected in HIV patients with prevalence
of 18% while it was 3% in HIV negative among hospitalized patients. The second most prevalent
pathogen in HIV positive patients was Staphylococcus coagulase negative with a prevalence of
3% against 1% found in HIV negative patients. No Klebsiella pneumoniae was found in HIV
positive patients.
Table 5: The relationship between patient outcome with HIV status
HIV status
Patient outcome Total
Death Recovered
Negative 38 (6%) 659 (94%) 697
Positive 12 (8%) 136 (92%) 148
Total 50 (6%) 795 (94 %) 845
Pearson Chi-Square = 1.547, df = 1 and a p-value = 0.214 (not significant > 0.05)
In patients with CNS infections, the mortality rate was higher in HIV patients at 18%, than in
HIV negative at 6% as shown in table 5 above.

40
Table 6: The pathogen isolates compared with CSF protein
Pathogen < 45 mg/dl ≥ 45 mg/dl Total
Streptococcus agalactiae 2 3 5
Cryptococcus neoformans 3 46 49
Escherichia coli 19 11 30
Klebsiella pneumoniae 1 3 4
Staphylococcus coagulase negative 0 9 9
Staphylococcus aureus 5 5 10
Streptococcus pneumoniae 4 1 5
Total 34 78 112
Pearson Chi-Square = 40.8, df = 60 and a p-value = 0.9 (not significant > 0.05)
Table 6 above shows that infection with Staphylococcus coagulase negative had higher CSF
protein concentration than other isolated microorganisms, 9/9 100%, followed by Cryptococcus
neoformans 46 / 49 CSF protein concentration (93.9 %). The normal protein concentration in CSF
is below 45mg/dl.
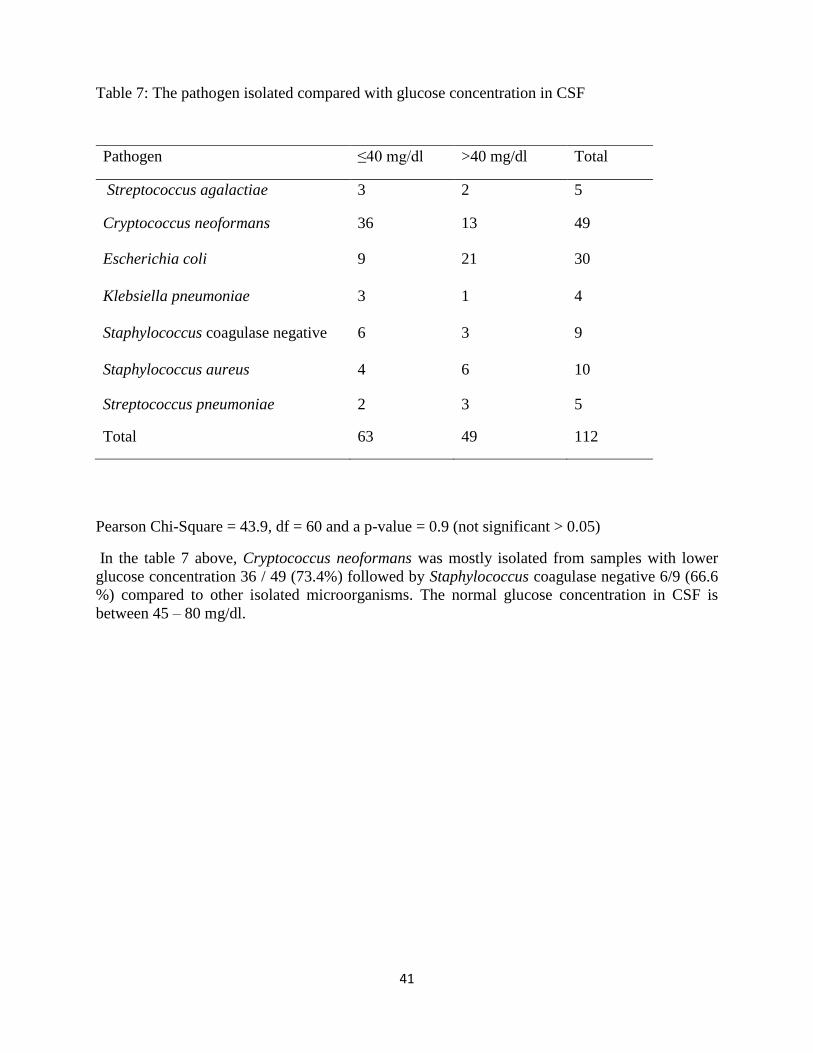
41
Table 7: The pathogen isolated compared with glucose concentration in CSF
Pearson Chi-Square = 43.9, df = 60 and a p-value = 0.9 (not significant > 0.05)
In the table 7 above, Cryptococcus neoformans was mostly isolated from samples with lower
glucose concentration 36 / 49 (73.4%) followed by Staphylococcus coagulase negative 6/9 (66.6
%) compared to other isolated microorganisms. The normal glucose concentration in CSF is
between 45 – 80 mg/dl.
Pathogen ≤40 mg/dl >40 mg/dl Total
Streptococcus agalactiae 3 2 5
Cryptococcus neoformans 36 13 49
Escherichia coli 9 21 30
Klebsiella pneumoniae 3 1 4
Staphylococcus coagulase negative 6 3 9
Staphylococcus aureus 4 6 10
Streptococcus pneumoniae 2 3 5
Total 63 49 112

42
4.4 Development of a novel algorithm for detection of most common bacterial, Viral and
fungal etiological agents of meningoencephalitis.
In the existing CSF samples testing order, only gram staining, biochemistry and cytology were
done on sites which have diagnostic limitations. With the new developed algorithms for CSF
samples analysis on sites additional steps will be done as follows; culture, pathogen identification,
susceptibility testing, submission of isolates and transfer all CSF samples to NRL for Real- time
Multiplex PCR (see figure 10). At National reference laboratory, before new algorithm the
diagnosis was limited to bacterial and fungal culture, isolation, susceptibility testing, biochemistry
and cytology.
The newly developed algorithm for NRL, will do all the above mentioned tests with addition of
Real time Multiplex PCR to detect different viruses, bacteria and fungi in one day instead of 7
days and confirm culture results from all isolated bacteria from the health facilities. Confirmed
strains will be archived for research purposes (see figure 11).
The novel algorithm was developed for both conventional and molecular methods by combining
diagnostic capacity in order to improve the overall diagnosis of CNS infections in Rwanda.
From the developed molecular diagnosis algorithm, 845 CSF samples were analysed. Ten types of
viruses were detected in 152 samples and distributed as below: Adenovirus 38, Epstein-Barr virus
22, Cytomegalovirus 7, Human Herpes virus (6), Human Herpes virus (7) 3, Herpes simplex virus
(1) 6, Herpes simplex virus (2) 3, Enterovirus 52 and Human Parechovirus 4. Varicella-Zoster 1
and Parvovirus (B19) 0. Similarly, 5 types of bacteria (Streptococcus pneumoniae 45, Hemophilus
influenzae 25, Neisseria meningitidis 18, Escherichia coli 15, and Listeria monocytogenes 2) were
detected in 105 samples of the 845 samples in which 88 were from patients over 5 years while 17
were from children under 5 years. Escherichia coli and Listeria monocytogenes were analysed and

43
detected in children under 5 years only. In addition, 49 samples of the 845 were positive for
Cryptococcus neoformans.

44
Figure 7: Developed novel algorithm for diagnosis of CNS infections using conventional method at District, Provincial and Referral
Hospitals
Aseptic collection of CSF in sterile and capped screw tubes before antimicrobial treatment
Transfer CSF samples to the lab within 15minutes and process it within 1 hour
Three tubes to be collected from each patient
TUBE 1
Heat at 80-1000C for 5 min and centrifuge at 2000 rpm for 5 min
Supernatant
Latex agglutination
Send initial report
Deposit
Indian ink
Send initial report
Gram stain
Send initial report Systematic Inoculation
Blood agar
Incubate at 370C for 24 hours at ~5% CO2
atmosphere
Examine colonies and perform Gram stain, serological and biochemistry analysis, if
there is no any colony, re incubate until 48 hours and report sterile culture.
Antimicrobial susceptibility testing
Transfer Isolate to NRL for confirmation and
further studies
Record and report final results
Chocolate agar
Incubate at 370C for 24 hours at ~ 5% CO2
atmosphere
Examine colonies and perform Gram stain, serological and biochemistry analysis, if there
is no any colony, re incubate until 48 hours and report sterile culture.
Antimicrobial susceptibility testing
Transfer Isolate to NRL for confirmation and further
studies
Record and report final results
Mac Conkey agar
Incubate at 37 for 18 hours
Examine colonies and perform Gram stain, serological and
biochemistry analysis, if there is no any colony, re incubate until
24 hours and report sterile culture.
YPD
Incubate at 37 check for growth daily up to day 7
Check for mucoid colonies, yeast and
perform Cryptococcal agglutination
Record and report final results
TUBE 2
Cytology
WBC count and Differential
Send initial report
Biochemistry
Glucose and proteins
Send initial report
TUBE 3
Keep on -200C and send it to NRL for molecular testing

45
Figure 8: The developed novel algorithm for diagnosis of CNS infections using a combination of conventional and molecular methods at
NRL
Aseptic collection of CSF in sterile and capped screw tubes before antimicrobial treatment
Transfer CSF samples to the lab within 15minutes and process it within 1 hour
Three tubes to be collected from each patient
TUBE 1
Frozen sample for molecular
Systematically analyze using Multiplex PCR for viral, Bacterial and Fungi
For quick patient treatment & outbreak confirmation
Submit results in 4 to 6 hours to the attending physician
TUBE 2
Routine microbiology analysis on site (see
figure 29)
Send initial report
Transferred Isolate to NRL for confirmation and furthers
studies
Systematically Inoculate
Blood agar
Incubate at 35-370C for 24 hours at ~5% CO2
atmosphere
Examine colonies and perform Gram stain, serological and biochemistry analysis for
identification, if there is no any colony report sterile culture
Antimicrobial susceptibility testing
Record and report final results to the attending physician
MacConkey agar
Incubate at 37 for 18 hours
Examine colonies and perform Gram stain, serological and biochemistry analysis for
identification, if there is no any colony report sterile culture
Antimicrobial susceptibility testing
Record and report final results to the attending
physician
Chocolate agar
Incubate at 35-370C for 24 hours at ~5% CO2
atmosphere
Examine colonies and perform Gram stain, serological and biochemistry analysis for
identification, if there is no any colony report sterile culture
Antimicrobial susceptibility testing
Record and report final results to the attending physician
TUBE 3
Routine Cytology & Biochemistry examiniation (see figure 29)
Send initial report

46
4.5 Determination of the drug susceptibility pattern of the detected bacteria
agents of Meningoencephalitis
The drug susceptibility pattern was determined for all isolated bacteria using recommended
antibiotic discs. The isolated bacteria were Klebsiella pneumoniae, Escherichia coli, Streptococcus
pneumoniae, Streptococcus agalatiae and Staphylococcus aureus. The following antibiotics were
used according to NRL standard operating procedures(SOPs); Ciprofloxacin, Tetracycline,
Gentamycin, Sulfamethoxazole, Augmentin, Meropenem, Ampicillin, Azitreonam, Amikacin,
Erythromycin, Penicillin, Cefotaxime, Linezolid, Piperacillin, Methicillin, Clindamycin and
Oxacillin. The antibiotic was inoculated on Mueller-Hinton agar, Kirby-Bauer method and Clinical
and Laboratory Standards Institute (CLSI) catalogue for result interpretation.
Representatives of susceptibility disc potency for isolated bacteria
Figure 9 above shows a petri dish for sample 482 with Escherichia coli sensitive to amikacin,
azitreonam, augmentin, sulfamethoxazole.

47
Figure 10 above shows a petri dish for sample No 44 with Klebsiella pneumoniae sensitive to
augmentin, amikacin and meropenem.
Figure 11 above shows a petri dish for sample No 132 with Staphylococcus aureus sensitive
to oxacillin and methicillin and ciprofloxacin.

48
The results on interpreted susceptibility testing are indicated in the tables on the following
pages.
Table 8: Sensitivity profile of isolated Escherichia coli and Klebsiella pneumoniae.
Pathogen Meropenem Sulfamethoxazole Augmentin Azitreonam Amikacin
E.coli 74% 86% 83% 97%
K.
pneumoni
ae
75% 75% 100% 75% 75%
Table 8 above shows that Klebsiella pneumoniae was 100% sensitive to augmentin and
Escherichia coli was 97% sensitive to amikacin.
Table 9: Sensitivity profile of isolated Streptococcus agalactiae
Pathogen Cefotaxime Clindamycin Linezolid Piperacillin Erythromycin
Streptococcus
agalactiae 100 % 80% 80% 80% 80%
Streptococcus agalactiae was 100% sensitive to cefotaxime and 80% sensitive to linezolid,
piperacillin, erythromycin and clindamycin as shown on table 9 above.
Table 10: Sensitivity profile of isolated Streptococcus pneumoniae
Pathogen Piperacillin Meropenem
Streptococcus
pneumoniae 80 % 80%
Table 10 above shows that Streptococcus pneumoniae was 80% sensitive to meropenem and
piperacillin.

49
Table11: Sensitivity profile of isolated Staphylococcus aureus
Pathogen Oxacillin Methicillin Clindamycin Penicillin Tetracycline Ciprofloxacin
S. aureus 90% 90% 80% 90% 70% 80%
Table 11 above shows Staphylococcus aureus was 90% sensitive to penicillin, oxacillin and
methicillin. In addition, it was sensitive at 80% to ciprofloxacin and clindamycin.
4.6 Evaluation and demonstration of the utility of the molecular diagnostic technique over
conventional techniques for detection of pathogens causing meningoencephalitis.
4.6.1. Outcome of culture at NRL
Table 12: Frequency of pathogen isolates by age group using culture at NRL
Age group
Pathogen Isolated 0 - 4 5 - 14 15 - 24 25 - 34 35 - 44 35 - 54 >55 Total
Streptococcus
agalactiae 2 1 0 0 2 0 0 5
Cryptococcus.
neoformans 1 3 7 6 10 12 10 49
Escherichia coli 23 4 1 0 1 1 0 30
Klebsiella pneumoniae 1 0 0 1 0 0 2 4
Staphylococcus
coagulase negative 0 0 5 3 0 1 0 9
Staphylococcus aureus 2 1 0 3 1 2 1 10
Streptococcus
pneumoniae 0 1 0 0 0 0 4 5
Sterile culture 104 63 156 166 118 59 67 732
Total 133 73 169 179 132 75 84 845
The positivity rates for isolated pathogen using culture at NRL was as follows: From 845 CSF
samples cultured, 7% were positive for bacteria. The most isolated bacteria were Escherichia coli
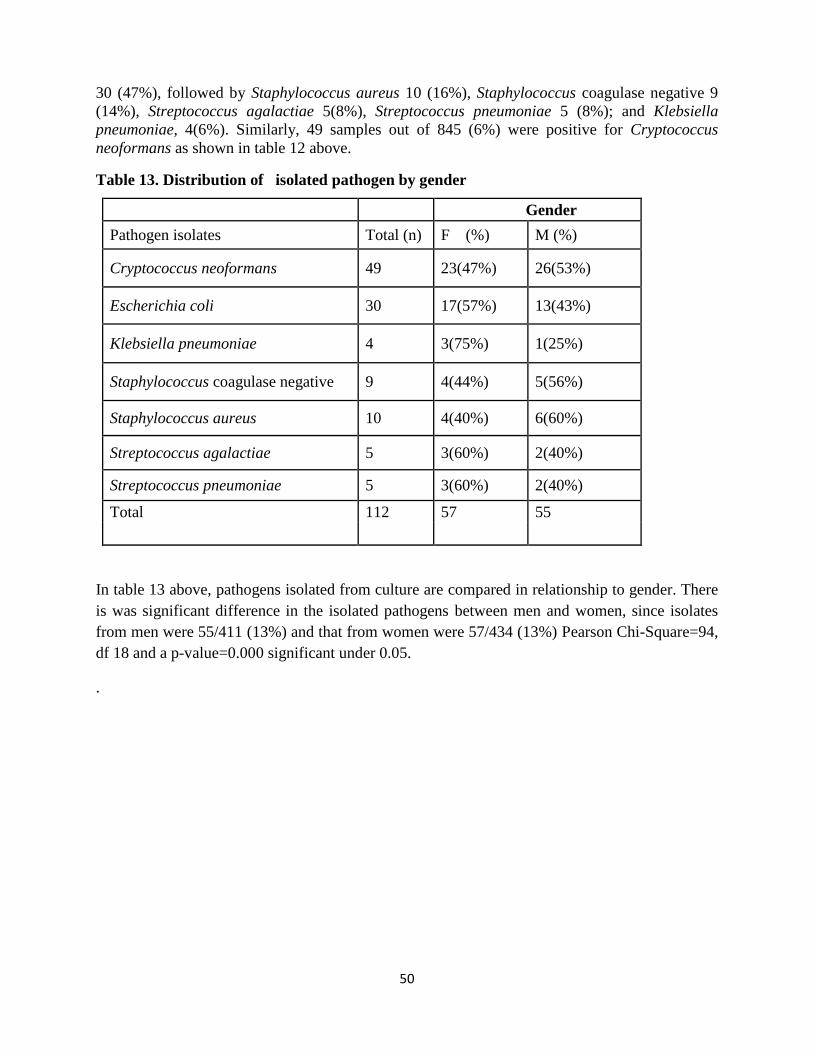
50
30 (47%), followed by Staphylococcus aureus 10 (16%), Staphylococcus coagulase negative 9
(14%), Streptococcus agalactiae 5(8%), Streptococcus pneumoniae 5 (8%); and Klebsiella
pneumoniae, 4(6%). Similarly, 49 samples out of 845 (6%) were positive for Cryptococcus
neoformans as shown in table 12 above.
Table 13. Distribution of isolated pathogen by gender
Gender
Pathogen isolates Total (n) F (%) M (%)
Cryptococcus neoformans 49 23(47%) 26(53%)
Escherichia coli 30 17(57%) 13(43%)
Klebsiella pneumoniae 4 3(75%) 1(25%)
Staphylococcus coagulase negative 9 4(44%) 5(56%)
Staphylococcus aureus 10 4(40%) 6(60%)
Streptococcus agalactiae 5 3(60%) 2(40%)
Streptococcus pneumoniae 5 3(60%) 2(40%)
Total 112 57 55
In table 13 above, pathogens isolated from culture are compared in relationship to gender. There
is was significant difference in the isolated pathogens between men and women, since isolates
from men were 55/411 (13%) and that from women were 57/434 (13%) Pearson Chi-Square=94,
df 18 and a p-value=0.000 significant under 0.05.
.

51
4.6.2. Outcomes of RT-Multiplex PCR at NRL
Table 14: Frequency of viruses detected using RT multiplex PCR
Pathogen Frequency Positivity rate Prevalence
Epstein-Barr virus 22 14 % 3 %
Cytomegalovirus 7 5% 1 %
Adenovirus 38 25 % 4 %
Herpes simplex virus 1 6 4 % 1 %
Herpes simplex virus 2 3 2% 0 %
Human Herpes virus 6 17 11 % 2 %
Human Herpes virus 7 3 2 % 0 %
Enterovirus 52 34 % 6 %
Human Parechovirus 4 3 % 0%
Total positive 152 18 %
Total sample 845
The table 14 above shows that commercial validated RT-multiplex PCR kits for in-vitro
diagnostics were used to detect up to 17 types of viruses, bacteria and fungus causing CNS
infections.
Using the developed novel algorithm 845 CSF samples were collected and analysed. 152 (18%)
were positive for the detected viruses.

52
In the figure 12 representing Human adenovirus below, the Ct value of the positive control is 25.
The strongest Ct value was 22 seen in sample 2, which is stronger than positive control, followed
by sample 145 and 195 both with Ct values of 24. The highest Ct value was 33 with lower
positivity. The negative control did not show any Ct value.
Figure 12. Representation of Human adenoviruses (Ct values)
In figure 13 representing Enteroviruses below, the positive control Ct value was 21, strongest
positive sample has Ct value of 33 which is sample 359 and 369. The lower positive has Ct value
of 34 in which 18 samples were overlapping at the same Ct value.
The control negative does not show any Ct value.
Figure13: Representation of Enteroviruses (Ct values)
In the figure 14 representing Epstein Barr Virus below, the positive control Ct value was 24, the
strongest positive sample has Ct value of 22 which is sample 613, followed by Ct value of 30.
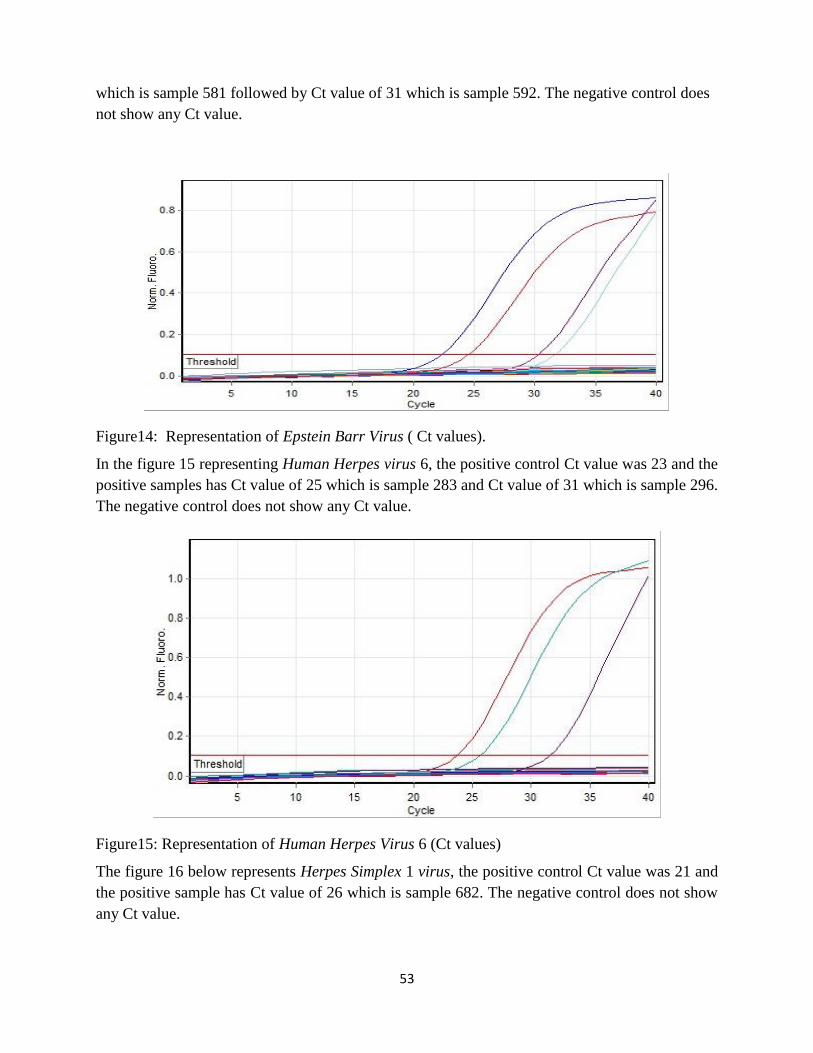
53
which is sample 581 followed by Ct value of 31 which is sample 592. The negative control does
not show any Ct value.
Figure14: Representation of Epstein Barr Virus ( Ct values).
In the figure 15 representing Human Herpes virus 6, the positive control Ct value was 23 and the
positive samples has Ct value of 25 which is sample 283 and Ct value of 31 which is sample 296.
The negative control does not show any Ct value.
Figure15: Representation of Human Herpes Virus 6 (Ct values)
The figure 16 below represents Herpes Simplex 1 virus, the positive control Ct value was 21 and
the positive sample has Ct value of 26 which is sample 682. The negative control does not show
any Ct value.

54
Figure 16: Representative of Herpes Simplex 1 virus (Ct values)
The figure 17 below represents Cryptococcus neoformans, the positive control Ct value was 21,
strongest positive sample has Ct value of 33 which is sample 359 and 369. The lower positive has
Ct value of 34 in which 18 samples were overlapping at the same Ct value. Negative control does
not show any Ct value.
Figure 17: Representative of Cryptococcus neoformans (Ct values)

55
Table 15: Frequency of bacteria pathogens detected using molecular method
Pathogens Frequency Percentage
Hemophilus influenzae 25 2.90%
Neisseria meningitidis 18 2.10%
Streptococcus pneumoniae 45 5.3%
Total positive 88 4.2%
Total sample 845 10 %
In the table 15 above, using molecular methods, 845 collected CSF samples were analysed for
bacterial meningitis detection, 88 (10 %) samples were positive on the following microorganisms.
The most detected was Streptococcus pneumoniae 45 /88 isolated (51%) followed by and
Hemophilus influenzae 25/ 88(28%) and Neisseria meningitidis with 18/ 88 (21%).

56
The figure18 below represents Streptococcus pneumoniae detected. The positive control Ct value
was 24.8, strongest positive sample has Ct value of 23 which is sample 57. The third positive
was known Streptococcus pneumoniae sample one with Ct value of 26.6. The lower positive has
Ct value of 31.8 which was known Streptococcus pneumoniae sample two.
The Control negative does not show any Ct value.
Figure 18: Representative of Streptococcus pneumoniae (Ct values)
The figure 19 below represents Neisseria meningitidis detected. The positive control one Ct value
was 28.1. The positive control two Ct value of 28.9. The strongest Ct value was 17.9 which was
sample 370 followed by known Neisseria meningitidis sample one with Ct value of 19.4 and
known Neisseria meningitidis sample two with Ct value of 20. The lowest Ct value was 32 which
was sample 371.The negative control does not show any Ct value.
Figure 19: Representative of Neisseria meningitidis (Ct values)

57
The figure 20 below represents Hemophilus influenzae detected. The strongest Ct value was 18.8
which was sample 357. The positive control one has Ct value of 24.7. Hemophilus influenzae
known sample has Ct value of 23.6. The positive control two has Ct value of 25. The lowest Ct
value was 29.4 which was sample 371. The negative control does not show any Ct value.
Figure 20: Representative of Hemophilus influenzae (Ct values)
Table16: Frequency of bacteria pathogens detected from neonatal CSF
Pathogen Frequency Prevalence
Listeria monocytogenes 2 1%
Escherichia coli 15 11%
Total Positive 17 12%
Total sample 138
In the table 16 above, using a neonatal kit, 138 CSF samples were collected and analysed using
molecular methods. 17/138 (12%) samples were positive on following microorganisms. The most
detected organism was Escherichia coli 15/17 (88%) positive bacteria followed by Listeria
monocytogenes 2/17 (12%).

58
The figure 21 below represents Escherichia coli. The strongest Ct value was 8 The positive control
one has Ct value of 26 The known sample has Ct value of 26 The second strongest Ct value was
11 which was sample 559. The third Ct value was 12 which was sample 527. The fourth Ct value
was 11.9 which was sample 513. The fifth Ct value was 12 which was sample 322. The sixth Ct
value was 14.8 which was sample 452. The seventh Ct value was 26 which was sample 693. The
lowest Ct value was 27 which was sample 426. The negative control does not show any Ct value.
Figure 21: Representative of Escherichia coli (Ct values)

59
The figure 22 below represents Listeria monocytogenes. The strongest Ct value was 18.8 which
was sample 543 followed by Ct value of 19.8 which was sample 570. The positive control has
Ct value of 25. The negative control does not show any Ct value.
Figure 22: Representative of Listeria monocytogenes (Ct values)
The figure 23 below is a representative of internal control. The results shows that all Ct values
were close together which indicates that the quality of results is quite accurate. This has been
used in all samples including negative and positive controls. In some runs, the known sample
from accredited external quality control laboratories were included in the runs to ensure the
quality of results. The results are varied if the internal control (IC) have a Ct of less than 33.
Figure 23: Representative of Internal control (Ct values)

60
CHAPTER FIVE: DISCUSSION
5. Discussion
The aim of this study was to develop a novel algorithm for detection of causative agents of
meningoencephalitis using combination of conventional and molecular methods in Rwanda.
The study was encouraged by data collected from hospitalized patients in four referral hospitals
namely King Faisal Hospital, Rwanda Military Hospital, Butare University Teaching Hospital,
Kigali University Teaching Hospital for a period of 4 years from 2009 to 2012, which showed the
diagnostic capacity of 9% positive and 91% negative. These results were inadequate for physicians
to treat patients with appropriate drugs since, some bacteria, fungi and all viruses were not detected
using conventional methods. Based on previous research, 75% of patient treatment is based on
laboratory diagnosis. The 91% negative results from hospitalized patients with signs and
symptoms of meningoencephalitis indicate limitation of appropriate treatment decisions by
physicians. The developed novel algorithms combining both conventional and molecular
techniques will help in improvement of diagnostic capacity for detection of causative agents of
meningoencephalitis. The developed novel algorithm for molecular techniques has facilitated the
establishment of new molecular laboratory at National Reference Laboratory, well equipped with
high technology equipment from Germany and inaugurated by the Minister of Health. Laboratory
staff have been recruited and trained on molecular techniques. The new technology established at
NRL will be rolled out in the referral hospital laboratories, while the developed conventional
algorithm will be established in referral, provincial and district hospitals laboratories.
The existing conventional methods before the development of the novel algorithm did not detect
any viral infection, therefore treatment of patients suspected to have viral CNS infections was done
based on signs and symptoms alone without differential diagnosis. The developed algorithm

61
improved diagnostic capacities by detecting 152 viral infections using Real-time Multiplex PCR.
This represents 18% detection capacities of viral infections and is in agreement with similar study
by (Koskiniemi et al., 2001) which reported Real-time Multiplex PCR as being specific and highly
sensitive and rapid in detection of RNA and DNA viruses.
Real-time Multiplex PCR detected viruses as the most common cause of meningoencephalitis.
Enterovirus had the highest positivity rate of 34%, followed by Adenovirus 25%, Epstein-Barr
virus 15%, Human Herpes virus (6 )11 %, and Cytomegalovirus 5%. The lowest positivity rate
was Varicella-Zoster 1%. Moreover, based on our findings, molecular diagnostic method
improved diagnostic capacity and therapeutic management of CNS infections by detecting
multiple viral infections potentially responsible for mengoencephalitis , as reported similarly by
(Quereda et al., 2000).
The detection capacity of bacterial infections improved from 7% using conventional to 22% using
Real-time Multiplex PCR diagnostic methods. The usefulness of PCR diagnostic method is
supported by previous studies (Issa et al., 2003) which emphasized the use of PCR diagnostic
method in the detection of causative agents of CNS infection. However, the detection capacity of
causative agents of fungal infections using conventional and Real-time PCR methods was the same
at 6%.
Using Real- time Multiplex PCR different bacteria were detected using different Kits. Using
bacterial meningitis Kit, 845 samples were analysed, 88 (10%) were positive for the following
microorganisms; Streptococcus pneumoniae had a positivity rate of 45/88 (51%) followed by
Hemophilus influenzae with positivity rate of 25/ 88(28%) and Neisseria meningitidis with
positivity rate of 18/ 88 (21%).
62
Using Neonatal bacterial meningitis kit, 138 CSF specimens were analysed using Real time
multiplex PCR.17/138 (12%) samples were positive for following microorganisms; Escherichia
coli had a positivity rate 15/17 (88%) followed by Listeria monocytogenes 2/17 (12%). No Group
B Streptococcus was detected.
Using both molecular and conventional techniques, 845 specimens were analysed. 49% were
positive for Cryptococcus neoformans. Cryptococcus neoformans was more prevalent in HIV
positive patients at 18% while it was 3% in HIV negative patients, as reported similarly by
(Boulware et al., 2010).This indicates that Cryptococcus neoformans is mostly an opportunistic
infection. The second most prevalent pathogen in HIV positive patients was Staphylococcus
coagulase negative with a prevalence of 3% against 1% found in HIV negative patients.
The demographic representation of study population shows that about 65% of study population
was between 24-34 years old. The highest prevalence of Cryptococcus neoformans was detected
in CHUK study site. This could be due to HIV infection persons who had not actively participated
in sensitized HIV screening in order to start ARV drugs treatment. The age group between 24 and
34 years old appears to be the most infected with HIV in this site since C. neoformans is primarily
an opportunistic infection.
Escherichia coli was the most detected pathogen at CHUK. This could be due to referral nature of
the hospital with paediatric speciality. CHUK study site had the most diverse number of pathogen
isolates due to referral nature of the hospital.
The study shows that the diagnostic capacity of etiological agents of CNS infection improved
from baseline of 9 % using routine conventional methods (Ntagwabira et al., 2017), to 40% using
developed novel algorithm combining both conventional and Real-time Multiplex PCR.

63
The antimicrobial susceptibility patterns of isolated bacteria causing meningitis, showed that
Klebsiella pneumoniae was 100% sensitive to augmentin and 75% sensitive to meropenem, which
is similar to previous research by (Pal Chugh et al., 2012) which reported 100% sensitivity of
Klebsiella pneumoniae to meropenem.
Streptococcus pneumoniae was 100% sensitive to cefotaxime and 80% sensitive to piperacillin.
This compares well with previous research which reported that Streptococcus pneumoniae had
94% susceptibility to piperacillin (Chugh et al., 2011)., and Escherichia coli was 97% sensitive
to amikacin.
Streptococcus agalactiae was 100% sensitive to cefotaxime and 80% to linezolid, piperacillin
erythromycin and clindamycin. Staphylococcus aureus was 90% sensitive to penicillin, oxacillin
and methicillin and 80% sensitive to ciprofloxacin and clindamycin.
Due to the small number of isolated bacteria in this study (less 30% of the study population), these
findings from the susceptibility profile cannot be used by the Ministry of Health to recommend as
appropriate antibacterial treatment guideline but can be used as patient to patient treatment
depending on isolated bacteria.
From the developed novel algorithm for diagnosis of central nervous system infections using
conventional methods at district, provincial and referral hospitals, a recommendation that all
isolates from these hospitals be transferred to the National reference laboratory for confirmation
of bacterial isolates, antimicrobial susceptibility testing and further studies will guide the ministry
of health to recommend every year appropriate antibiotics to be used for specific isolated bacteria
in Rwanda health facilities .

64
The utility of molecular diagnostic method compared with conventional method was
demonstrated. In the study, no viruses were detected using the conventional methods while a range
of viruses, 152/845 (18%) were detected using Real time multiplex PCR. In addition,
185/845(22%) samples were detected as positive for different types of bacteria using the PCR
compared with the 59/845(7%) that were positive using conventional methods. There was however
no difference in the detection capacity of fungal agents between the two methods with a detection
level of 6 %( 49).
The results from this study indicate that, Real time Multiplex PCR is the best method to use for
detection of causative agents of meningoencephalitis, after considering its cost compared with
conventional method and turn- around time of patients results of 1 day for Real time Multiplex
PCR and 7 to 11 days for conventional methods.
The cost of patient’s hospitalization for seven to ten days waiting for the results is higher than a
difference of two to four dollars cost for PCR test for conventional and Real time Multiplex PCR
respectively. Furthermore, the cost of treatment with non-specific drugs will be reduced and other
costs like those of molecular laboratory reagents and consumables will be negotiated in order to
lower the costs of tests. In addition, the diagnostic results turnaround time of one day will
significantly reduce mortality.
The Real-time PCR method facilitates rapid and early detection of causative agents of Central
Nervous System infections with turn-around time of one day compared to conventional methods
that take seven to ten days which delays treatment of patients with meningoencephalitis.
The findings from this research will furthermore help in use of appropriate drugs for treatment of
patients. This will in turn prevent development of resistance to various drugs.

65
The use of the new diagnostic methods will help in disease surveillance to determine prevalence
of meningoencephalitis accurately especially in Rwanda and Sub-saharan Africa in general.
6. Limitations
The RT multiplex PCR kits used in the study had specific number of targeted pathogens to be
detected. This means that some other non-targeted pathogens could have been missed.
Additionally, the study was not able to detect tuberculous and parasitic meningitis due to lack of
reagents and consumables due to budget constraints.
Despite use of combined conventional and molecular methods, the detection capacity of etiological
agents of meningoencephalitis was 40%. There is still need to conduct additional studies using
various kits with more probes to enhance etiological diagnosis of meningoencephalitis.
7. Conclusion
This study shows that the diagnostic capacity of etiological agents of CNS infection improved
from baseline of 9% using routine conventional methods, to 40% using developed novel algorithm
combining both conventional and Real-time Multiplex PCR methods.
The novel algorithm was useful in detection of 18.0% of specific viral pathogens from CSF that
were not previously detected using routine conventional diagnostic methods.
The study showed that from all the isolated bacteria causing meningitis, Klebsiella pneumoniae
and Streptococcus pneumoniae were 100% sensitive to augmentin and cefotaxime respectively,
while Streptococcus pneumoniae was highly resistant at, 60% to cefotaxime.

66
8. Recommendations
1. In order to improve the detection of causative agents of meningoencephalitis, all CSF
samples collected from patients with meningoencephalitis should be transported to the
National Reference Laboratory for molecular diagnosis. This will help in prompt treatment
using appropriate drugs.
2. Based on the small number of isolated bacteria in this study, the susceptibility profile can
only be used for patient treatment, but cannot help the Ministry of Health to recommend
appropriate antibacterial treatment guidelines. Further studies on systematic susceptibility
patterns should be done in clinical settings with more isolates to help policy makers come
up with treatment guidelines for CNS infections.
3. The Ministry of Health in Rwanda should consider developing a policy that includes the
use of this algorithim by health care professionals and laboratory networks in order to
improve diagnosis and treatment of patients with meningoencephalitis at all levels in the
country.
4. Additional studies with larger samples size should be done to increase detection capacity
of etiologic agents of meningoencephalitis including Mycobacterium tuberculosis,
Toxoplasma gondii, and Naegleria fowleri.

67
REFERENCES
Aguilar, J. et al. (2010) ‘Staphylococcus aureus Meningitis’, Medicine, 89(2), pp. 117–125. doi:
10.1097/MD.0b013e3181d5453d.
Aguilera, J.-F. et al. (2002) ‘Outbreak of serogroup W135 meningococcal disease after the Hajj
pilgrimage, Europe, 2000.’, Emerging infectious diseases, 8(8), pp. 761–7. doi:
10.3201/eid0805.010422.
Ajello, G. W. et al. (1984) ‘Trans-isolate medium: a new medium for primary culturing and
transport of Neisseria meningitidis, Streptococcus pneumoniae, and Haemophilus influenzae.’,
Journal of clinical microbiology, 20(1), pp. 55–8. Available at:
http://www.ncbi.nlm.nih.gov/pubmed/6430956 (Accessed: 22 August 2018).
Bartt, R. (2012) ‘Acute Bacterial and Viral Meningitis’, CONTINUUM: Lifelong Learning in
Neurology, 18(6), pp. 1255–1270. doi: 10.1212/01.CON.0000423846.40147.4f.
Baskin, H. J. and Hedlund, G. (2007a) ‘Neuroimaging of herpesvirus infections in children.’,
Pediatric radiology, 37(10), pp. 949–63. doi: 10.1007/s00247-007-0506-1.
Baskin, H. J. and Hedlund, G. (2007b) ‘Neuroimaging of herpesvirus infections in children.’,
Pediatric radiology, 37(10), pp. 949–63. doi: 10.1007/s00247-007-0506-1.
Berardi, A. et al. (2010) ‘Group B Streptococcus Early-Onset Disease in Emilia-Romagna: Review
After Introduction of a Screening-Based Approach’, The Pediatric Infectious Disease Journal,
29(2), pp. 115–121. doi: 10.1097/INF.0b013e3181b83cd9.
Botero Aguirre, J. P. and Restrepo Hamid, A. M. (2015) ‘Amphotericin B deoxycholate versus
liposomal amphotericin B: effects on kidney function’, Cochrane Database of Systematic Reviews,
(11), p. CD010481. doi: 10.1002/14651858.CD010481.pub2.
Bouadma, L. et al. (2006) ‘Adults with spontaneous aerobic Gram-negative bacillary meningitis
admitted to the intensive care unit’, Clinical Microbiology and Infection, 12(3), pp. 287–290. doi:
10.1111/j.1469-0691.2005.01346.x.
Boulware, D. R. et al. (2010) ‘Clinical features and serum biomarkers in HIV immune
reconstitution inflammatory syndrome after cryptococcal meningitis: a prospective cohort study.’,
PLoS medicine. Edited by D. G. Lalloo, 7(12), p. e1000384. doi: 10.1371/journal.pmed.1000384.
Brouwer, M. C., Tunkel, A. R. and Beek, D. van de (2010) ‘Epidemiology, Diagnosis, and
Antimicrobial Treatment of Acute Bacterial Meningitis’, Clinical Microbiology Reviews.
American Society for Microbiology (ASM), 23(3), p. 467. doi: 10.1128/CMR.00070-09.
Butler, E. K. et al. (2012) ‘Long term 5-year survival of persons with cryptococcal meningitis or
asymptomatic subclinical antigenemia in Uganda.’, PloS one. Edited by D. W. Cameron, 7(12), p.
e51291. doi: 10.1371/journal.pone.0051291.
Campagne, G. et al. (1999) ‘[Epidemiology and control of bacterial meningitis in children less
than 1 year in Niamey (Niger)].’, Bulletin de la Societe de pathologie exotique (1990), 92(2), pp.
118–22. Available at: http://www.ncbi.nlm.nih.gov/pubmed/10399603 (Accessed: 23 August
2018).

68
Chang, C. C. et al. (2013) ‘Clinical and mycological predictors of cryptococcosis-associated
immune reconstitution inflammatory syndrome.’, AIDS (London, England), 27(13), pp. 2089–99.
doi: 10.1097/QAD.0b013e3283614a8d.
Chaudhuri, A. et al. (2008) ‘EFNS guideline on the management of community-acquired bacterial
meningitis: report of an EFNS Task Force on acute bacterial meningitis in older children and
adults’, European Journal of Neurology, 15(7), pp. 649–659. doi: 10.1111/j.1468-
1331.2008.02193.x.
Cho, T. A. and Mckendall, R. R. (2014) ‘Clinical approach to the syndromes of viral encephalitis,
myelitis, and meningitis’, Handbook of Clinical Neurology. Elsevier, 123, pp. 89–121. doi:
10.1016/B978-0-444-53488-0.00004-3.
Chugh, Y. et al. (2011) Study of antimicrobial sensitivity pattern of Gram-positive CSF isolates
among children suffering from septic meningitis in a tertiary care hospital. Available at:
http://medind.nic.in/jac/t11/i4/jact11i4p274.pdf (Accessed: 19 September 2018).
Coureuil, M. et al. (2017) ‘A journey into the brain: insight into how bacterial pathogens cross
blood-brain barriers.’, Nature reviews. Microbiology, 15(3), pp. 149–159. doi:
10.1038/nrmicro.2016.178.
Elaldi, N. et al. (2013) ‘Community-acquired CTX-M-15-type ESBL-producing Escherichia coli
meningitis: a case report and literature review.’, Journal of infection in developing countries,
7(5), pp. 424–31. Available at: http://www.ncbi.nlm.nih.gov/pubmed/23669434 (Accessed: 18
September 2018).
Gaschignard, J. et al. (2011) ‘Neonatal Bacterial Meningitis: 444 Cases in 7 Years.’, The
Pediatric infectious disease journal, 30(3), pp. 212–7. Available at:
http://www.ncbi.nlm.nih.gov/pubmed/21416693 (Accessed: 18 September 2018).
Grundmann, H. et al. (2011) ‘A framework for global surveillance of antibiotic resistance’, Drug
Resistance Updates, 14(2), pp. 79–87. doi: 10.1016/j.drup.2011.02.007.
Hodson, E. M. et al. (2005) ‘Antiviral medications to prevent cytomegalovirus disease and early
death in recipients of solid-organ transplants: a systematic review of randomised controlled trials’,
The Lancet, 365(9477), pp. 2105–2115. doi: 10.1016/S0140-6736(05)66553-1.
Issa, M. et al. (2003) ‘PCR of cerebrospinal fluid for diagnosis of bacterial meningitis during
meningococcal epidemics; an example from Sudan.’, Scandinavian journal of infectious diseases,
35(10), pp. 719–23. Available at: http://www.ncbi.nlm.nih.gov/pubmed/14606610 (Accessed: 18
September 2018).
Johnson, F. T. (1996) Acute Encephalitis. Available at: https://academic.oup.com/cid/article-
abstract/23/2/219/366873 (Accessed: 18 September 2018).
Kauffman, C. A. (2007) ‘Histoplasmosis: a clinical and laboratory update.’, Clinical microbiology
reviews, 20(1), pp. 115–32. doi: 10.1128/CMR.00027-06.

69
Al Khorasani, A. and Banajeh, S. (2006) ‘Bacterial profile and clinical outcome of childhood
meningitis in rural Yemen: A 2-year hospital-based study’, Journal of Infection, 53(4), pp. 228–
234. doi: 10.1016/j.jinf.2005.12.004.
Kim, K. S. (2016) ‘Human Meningitis-Associated Escherichia coli.’, EcoSal Plus, 7(1). doi:
10.1128/ecosalplus.ESP-0015-2015.
Koskiniemi, M. et al. (2001) ‘Infections of the central nervous system of suspected viral origin: a
collaborative study from Finland.’, Journal of neurovirology, 7(5), pp. 400–8. doi:
10.1080/135502801753170255.
Kyaw, M. H. et al. (2006) ‘Effect of Introduction of the Pneumococcal Conjugate Vaccine on
Drug-Resistant Streptococcus pneumoniae’, New England Journal of Medicine, 354(14), pp.
1455–1463. doi: 10.1056/NEJMoa051642.
Leclercq, S. Y. et al. (2016) ‘Pathogenesis of Streptococcus urinary tract infection depends on
bacterial strain and β-hemolysin/cytolysin that mediates cytotoxicity, cytokine synthesis,
inflammation and virulence’, Scientific Reports, 6(1), p. 29000. doi: 10.1038/srep29000.
Lin, H.-A. et al. (2016) ‘Regulator of the mucoid phenotype A gene increases the virulent ability
of extended-spectrum beta-lactamase-producing serotype non-K1/K2 Klebsiella pneumonia’,
Journal of Microbiology, Immunology and Infection, 49(4), pp. 494–501. doi:
10.1016/j.jmii.2014.08.023.
Lion, T. (2014) ‘Adenovirus infections in immunocompetent and immunocompromised patients.’,
Clinical microbiology reviews. American Society for Microbiology (ASM), 27(3), pp. 441–62.
doi: 10.1128/CMR.00116-13.
Logan, S. A. E. and MacMahon, E. (2008) ‘Viral meningitis.’, BMJ (Clinical research ed.),
336(7634), pp. 36–40. doi: 10.1136/bmj.39409.673657.AE.
Malo, J. et al. (2014) ‘Update on the diagnosis of pulmonary coccidioidomycosis.’, Annals of the
American Thoracic Society, 11(2), pp. 243–53. doi: 10.1513/AnnalsATS.201308-286FR.
McGill, F. et al. (2018) ‘Incidence, aetiology, and sequelae of viral meningitis in UK adults: a
multicentre prospective observational cohort study’, The Lancet Infectious Diseases, 18(9), pp.
992–1003. doi: 10.1016/S1473-3099(18)30245-7.
Mengistu, A. et al. (2013) ‘Antimicrobial sensitivity patterns of cerebrospinal fluid (CSF) isolates
in Namibia: implications for empirical antibiotic treatment of meningitis.’, Journal of
pharmaceutical policy and practice. BioMed Central, 6, p. 4. doi: 10.1186/2052-3211-6-4.
Minjolle, S. et al. (2002) Detection of herpesvirus genomes by polymerase chain reaction in
cerebrospinal fluid and clinical findings, Journal of Clinical Virology. Available at:
www.elsevier.com/locate/jcv (Accessed: 25 August 2018).
Nielsen, J. S. et al. (2012) ‘Intravitreal anti-vascular endothelial growth factor therapy for
choroidal neovascularization secondary to ocular histoplasmosis syndrome.’, Retina (Philadelphia,
Pa.), 32(3), pp. 468–72. doi: 10.1097/IAE.0b013e318229b220.

70
Ntagwabira, E. et al. (2017) ‘African Journal of Microbiology Research Challenges in diagnosis
of central nervous system infections using conventional method: Need for better approach in
Rwanda’, 11(35), pp. 1379–1385. doi: 10.5897/AJMR2017.8627.
Pal Chugh, Y. et al. (2012) Internet Journal of Medical Update Prevalence of Gram-negative
Pathogens and their antimicrobial susceptibility in bacterial meningitis in pediatric cases, Internet
Journal of Medical Update. Available at: http://www.akspublication.com/ijmu (Accessed: 19
September 2018).
Pandit, L. et al. (2005) ‘Diagnosis of partially treated culture-negative bacterial meningitis using
16S rRNA universal primers and restriction endonuclease digestion’, Journal of Medical
Microbiology, 54(6), pp. 539–542. doi: 10.1099/jmm.0.45599-0.
Pappagianis, D. and Coccidioidomycosis Serology Laboratory (2007) ‘Coccidioidomycosis in
California state correctional institutions.’, Annals of the New York Academy of Sciences, 1111(1),
pp. 103–11. doi: 10.1196/annals.1406.011.
Pomar, V. et al. (2013) ‘Spontaneous gram-negative bacillary meningitis in adult patients:
characteristics and outcome’, BMC Infectious Diseases. BioMed Central, 13(1), p. 451. doi:
10.1186/1471-2334-13-451.
Quereda, C. et al. (2000) ‘Diagnostic utility of a multiplex herpesvirus PCR assay performed
with cerebrospinal fluid from human immunodeficiency virus-infected patients with neurological
disorders.’, Journal of clinical microbiology, 38(8), pp. 3061–7. Available at:
http://www.ncbi.nlm.nih.gov/pubmed/10921978 (Accessed: 19 September 2018).
Richardson, A. R. et al. (2002) ‘Mutator clones of Neisseria meningitidis in epidemic serogroup
A disease.’, Proceedings of the National Academy of Sciences of the United States of America,
99(9), pp. 6103–7. doi: 10.1073/pnas.092568699.
Saarinen, M. et al. (1995) ‘Spectrum of 2,836 cases of invasive bacterial or fungal infections in
children: results of prospective nationwide five-year surveillance in Finland. Finnish Pediatric
Invasive Infection Study Group.’, Clinical infectious diseases : an official publication of the
Infectious Diseases Society of America, 21(5), pp. 1134–44. Available at:
http://www.ncbi.nlm.nih.gov/pubmed/8589133 (Accessed: 22 August 2018).
Scriven, J. E. et al. (2017) ‘The CSF Immune Response in HIV-1-Associated Cryptococcal
Meningitis: Macrophage Activation, Correlates of Disease Severity, and Effect of Antiretroviral
Therapy.’, Journal of acquired immune deficiency syndromes (1999), 75(3), pp. 299–307. doi:
10.1097/QAI.0000000000001382.
Steer, P. J. and Plumb, J. (2011) ‘Myth: Group B streptococcal infection in pregnancy:
Comprehended and conquered’, Seminars in Fetal and Neonatal Medicine, 16(5), pp. 254–258.
doi: 10.1016/j.siny.2011.03.005.
Stephens, D. S. (2007) ‘Conquering the meningococcus.’, FEMS microbiology reviews, 31(1), pp.
3–14. doi: 10.1111/j.1574-6976.2006.00051.x.

71
Taylor, W. R. et al. (2012) ‘The Spectrum of Central Nervous System Infections in an Adult
Referral Hospital in Hanoi, Vietnam’, PLoS ONE. Edited by J. A. Stoute. Public Library of
Science, 7(8), p. e42099. doi: 10.1371/journal.pone.0042099.
Teckie, G. and Karstaedt, A. (2015) ‘Spontaneous adult Gram-negative bacillary meningitis in
Soweto, South Africa’, International Journal of Infectious Diseases, 30, pp. 38–40. doi:
10.1016/j.ijid.2014.10.006.
Thigpen, M. C. et al. (2011) ‘Bacterial meningitis in the United States, 1998-2007.’, The New
England journal of medicine, 364(21), pp. 2016–25. doi: 10.1056/NEJMoa1005384.
Van De Beek, D., Drake, J. M. and Tunkel, A. R. (2010) Downloaded from www.nejm.org at
CAUL on March 16, N Engl J Med. Available at: www.nejm.org (Accessed: 18 September 2018).
Watt, J. P. et al. (2009) ‘Burden of disease caused by Haemophilus influenzae type b in children
younger than 5 years: global estimates’, The Lancet, 374(9693), pp. 903–911. doi: 10.1016/S0140-
6736(09)61203-4.
Zaal, M. J. W., Völker-Dieben, H. J. and D’Amaro, J. (2003) ‘Visual prognosis in
immunocompetent patients with herpes zoster ophthalmicus.’, Acta ophthalmologica
Scandinavica, 81(3), pp. 216–20. Available at: http://www.ncbi.nlm.nih.gov/pubmed/12780396
(Accessed: 25 August 2018).

72
APPENDICES
1. Appendix 1: Case report form
2. Appendix 2: Study sites map
3. Appendix 3: A and B- Consent forms
4. Appendix 4: A and B- Assent forms
5. Appendix 5: Ethics Approvals
6. Appendix 6: Molecular protocols
7. Appendix 7: Published paper 1 and 2 abstracts