the development of a processing window for the continuous galvanizing of a mn–cr–si martensitic...
TRANSCRIPT
The Development of a Processing Windowfor the Continuous Galvanizing of a Mn–Cr–SiMartensitic Steel
Anirban Chakraborty, Joseph R. McDermid,� Ranganathan Kavitha, Benoit Voyzelle,Elhachmi Essadiqi, and Frank E. Goodwin
Martensitic or complex phase steels are leading candidates for automotive impact
management applications. However, achieving high strengths while obtaining high quality
coatings via continuous galvanizing is a challenge due to cooling rate limitations of the
processing equipment and selective oxidation of alloying elements such as Cr, Mn, and Si
adversely affecting reactive wetting. The galvanizability of a Cr—Mn—Si steel with a target
tensile strength above 1250MPa was investigated within the context of the continuous
galvanizing line. The continuous cooling transformation behavior of the candidate alloy
was determined, from which intercritical and austenitic annealing thermal cycles were
developed. The evolution of substrate surface chemistry and oxide morphology during
these treatments and their subsequent effect on reactive wetting during galvanizing were
characterized. The target strength of 1250MPa was achieved and high quality coatings
produced using both intercritical (75% g) and austenitic (100% g) annealing using a
conventional 95%N2–5%H2, �308C dew point process atmosphere and 0.20wt% dissolved
(effective) Al bath, despite the presence of significant Mn and Cr oxides on the substrate
surfaces. It is proposed that complete reactive wetting by the Zn(Al, Fe) bath was
promoted by in situ aluminothermic reduction of the Mn and Cr-oxides by the dissolved
bath Al.
1. Introduction
In order to improve automotive fuel efficiency while main-
taining or improving vehicle safety, the use of advanced high
strength steels (AHSS) to reduce vehicle weight has increased
significantly in recent years and will continue to increase.[1]
Among the AHSS grades, the so-called ultra high strength
steels (UHSS) are strong candidate materials for anti-intrusion
and anti-rollover applications. The UHSS usually have a
microstructure consisting of martensite, bainitic ferrite, or
mixtures of these constituents with small amounts of ferrite.[1]
However, as in the case with all of the AHSS grades, corrosion
protection is a necessity in order to meet consumer longevity
expectations and maintain structural integrity, for which the
application of sacrificial Zn coatings by continuous galvaniz-
ing is amongst the most cost-effective solutions.
Several challenges have to be overcome in order to
process the above steels in the continuous galvanizing line
(CGL) without compromising the target tensile strength
of 1250 MPa (minimum). The challenges are as follows:
(i) obtaining the desired martensitic or complex phase
(martensiteþbainite) microstructures and (ii) providing
a substrate surface which can be reactively wet by the
Zn(Al, Fe) CGL bath to form the required h-Fe2Al5Znx
interfacial or ‘‘inhibition’’ layer and the desired metallic
Zn coating. Challenge (i) can be addressed by choosing
compositions with sufficient hardenability such that either
martensitic or martensite/bainite complex phase micro-
structures are produced using cooling rates compatible
with normal CGL operation (�308C s�1 or less). In addition,
in order to prevent martensite tempering during the 4608Chold immediately prior to and during galvanizing, the alloy
martensite start (Ms) temperature should chosen such
that it is lower than 4608C, thereby preventing martensite
formation prior to dipping into the galvanizing bath.
It is well known that in order to avoid the formation of
pearlite and promote the formation of martensite, alloying
[�] A. Chakraborty, Prof. J. R. McDermid, R. KavithaMcMaster Steel Research Centre, McMaster University, Hamilton,Ontario, CanadaEmail: [email protected]. Voyzelle, E. EssadiqiMaterials Technology Laboratory, CANMET, Ottawa, Ontario, CanadaF. E. GoodwinInternational Zinc Association, Durham, NC 27713-3210, USA
DOI: 10.1002/srin.201200124
www.steel-research.de
� 2012 WILEY-VCH Verlag GmbH & Co. KGaA, Weinheim steel research int. 83 (2012) No. 9999 1
FULLPAPER
elements such as Mn, Al, Si, Cr, Mo, and B can be used in
steel compositions.[2–4] However, many of these alloying
elements selectively segregate to the surface during
annealing prior to galvanizing and form oxides which
can prevent reactive wetting by the CGL bath.[5–12] This
issue (challenge (ii)) can be addressed through proper
alloying element and process atmosphere oxygen partial
pressure (pO2) selection such that surfaces with sufficient
reactive wetting are formed and which are compatible with
typical CGL operation.
Some open literature is available on the galvanizing of
martensitic and complex phase UHSS, most of which are
related to electro-galvanizing or the Quench and Partition
process.[13–16] However, Song et al.[3,17] recently advocated
a C–Mn–Cr–Mo–B alloy composition which produced alloy
strengths of >1300 MPa using cooling rates of 308C s�1
during simulated galvanizing and galvannealing thermal
cycles, although it should be noted that the steels were not
actually coated and no information was provided concern-
ing the surface chemistry or microstructure following
annealing and prior to galvanizing.
The present study will examine the development of a
process window for the continuous galvanizing of a C–Mn–
Si–Cr UHSS having a target tensile strength (UTS) in excess
of 1250 MPa. In particular, the present investigation will
examine the effect of CGL-compatible thermal treatments
and process atmospheres on the microstructural develop-
ment and mechanical properties of the experimental steel
as well as the reactive wetting of the substrate surface by a
simulated CGL Zn(Al, Fe) bath. The reactive wetting of the
steel will be related to the development of the surface
chemistry and morphology as a function of the annealing
parameters and the process atmosphere composition, as
characterized by its oxygen partial pressure (pO2).
2. Experimental Methods
The chemical composition of the experimental steel is
shown in Table 1. The steel substrate was industrially
fabricated via conventional hot and cold rolling and was
supplied in the form of 1.7 mm thick cold rolled sheet with
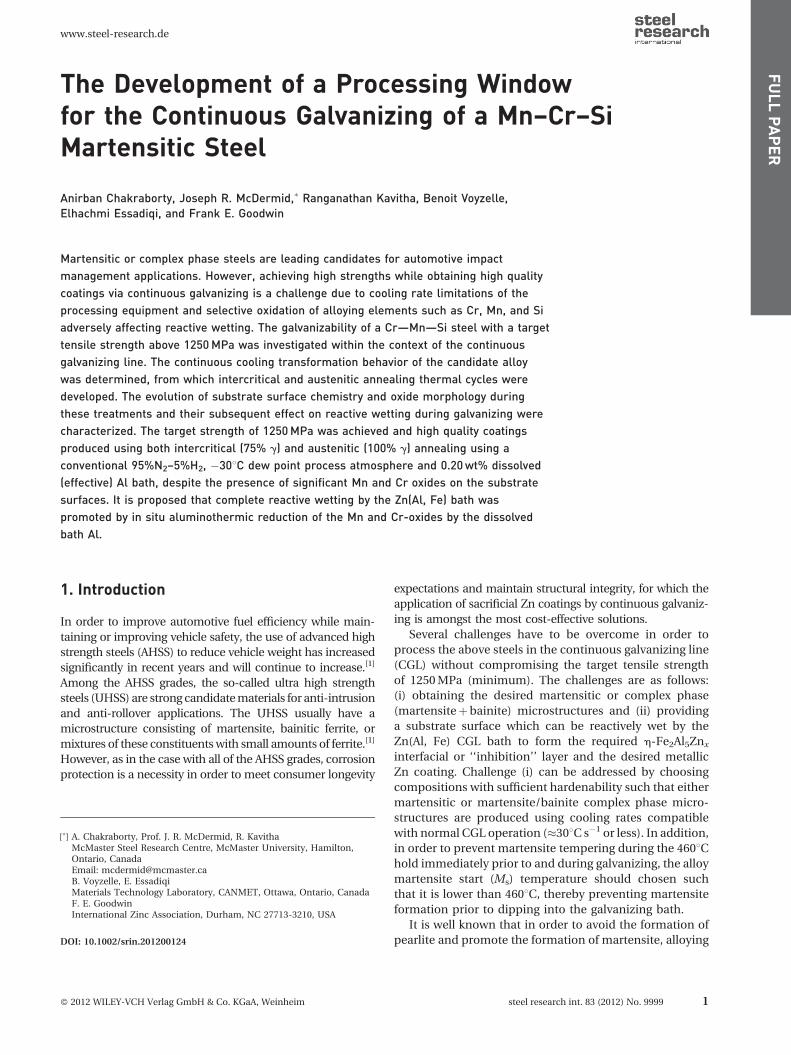
a ferrite/pearlite microstructure. A schematic of the exper-
imental heat treatments employed throughout this study is
shown in Figure 1. Galvanizing was carried out in an iron
saturated Zn-0.2 wt% dissolved or effective Al bath main-
tained at 4608C[18] for all dipping experiments. The sample
immersion time was 4 s for all coating experiments. The
peak annealing temperature (PAT) was selected such that
75 and 100% austenite (g) were formed. The 75% g
and 100% g formation temperatures (827 and 8788C,
respectively) along with a complete continuous cooling
transformation (CCT) diagram were determined using a
BAHR-Thermoanalyse quench dilatometer. In this CCT
determination study, cooling rates for the fully austenitized
samples were varied from 0.3 to 1108C s�1. A preliminary
study on the mechanical properties was performed
on the CCT samples via microhardness assessment.
Microhardness was measured using a Clemex microhard-
ness tester using a 200 gf load coupled with a 10 s dwell
time and CMT 5.0 software. Using the results of the
dilatometry studies (discussed in detail below), a heat
treatment schedule compatible with typical CGL capabili-
ties was constructed, complete details of which are
summarized in Table 2.
All heat treatment and galvanizing experiments were
carried out using the McMaster Galvanizing Simulator
(MGS) (Iwatani Surtec). The MGS comprises an atmos-
phere controlled column equipped with a gas mixing panel
(including a resident humidification system) for atmos-
phere compositional control, a quartz lamp infrared fur-
nace used for all heat treatments and parallel platens for
controlled cooling using high flows of N2 gas. Prior to heat
treatment, samples were degreased in an 808C aqueous 2%
NaOH solution, rinsed with deionized water, cleaned ultra-
sonically in isopropanol and dried with a warm air stream.
A final cleaning with acetone was performed immediately
prior to the sample entering the galvanizing simulator. All
heat treatments were carried out under a 95%N2–5%H2
atmosphere with a controlled dew point of �308C. The
process atmosphere oxygen partial pressure as a function
of PAT is shown in Table 3, from which it can be seen that
the pO2 for the 8788C process atmosphere was approxi-
mately two orders of magnitude greater than that of the
8278C process atmosphere. The sample thermal cycle was
C Mn Si Al S P Cr
0.26 1.15 0.28 0.04 0.002 0.016 0.61
Table 1. Experimental steel chemical composition [wt%].
Figure 1. Schematic heat treatment schedule.
www.steel-research.de
2 steel research int. 83 (2012) No. 9999 � 2012 WILEY-VCH Verlag GmbH & Co. KGaA, Weinheim
FULLPAPER
controlled using a type K (0.5 mm) thermocouple welded
directly to the sample before the start of the experiment.
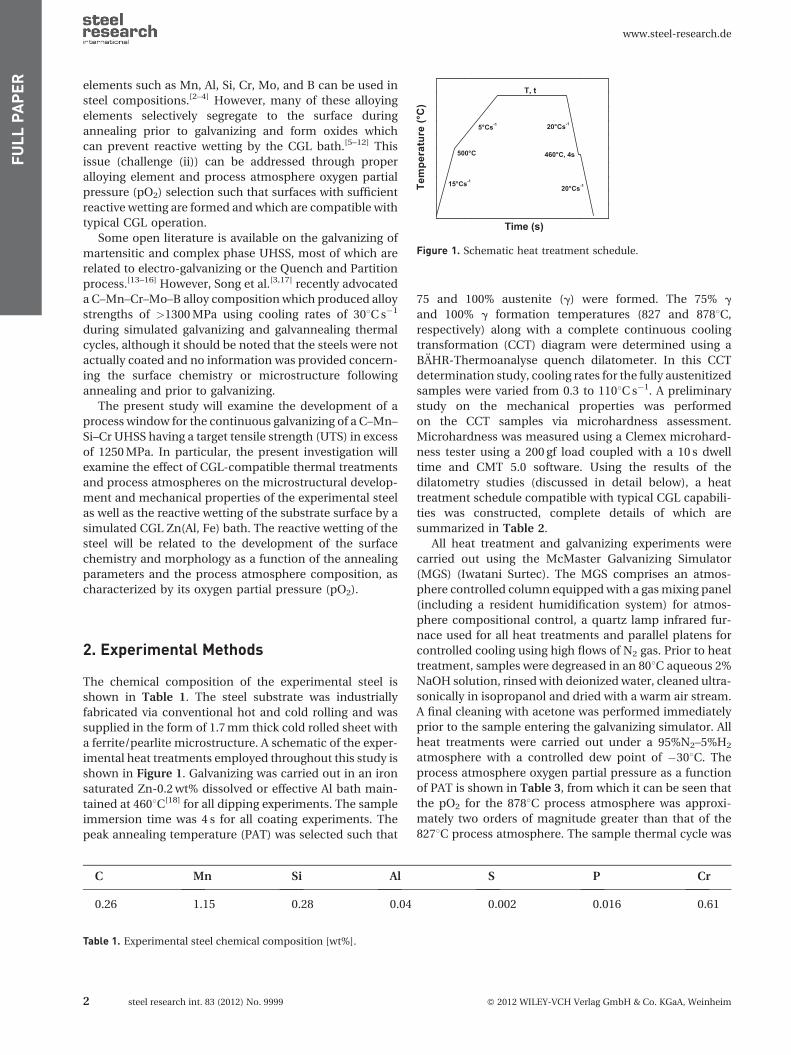
Experimental samples comprised 120 mm� 200 mm pan-
els with the longitudinal axis of the sample parallel to the
rolling and dipping directions. A uniform temperature and
coating area of 90 mm� 90 mm was centered in the lower
portion of the panel and only material from this area was
analyzed. A schematic of the experimental samples show-
ing the uniform coating area and control thermocouple
placement is shown in Figure 2.[19].
After heat treatment a cross-section of the substrate
was polished using conventional metallographic tech-
niques and etched using 2% nitric acid in ethanol.
Microstructural analysis of the substrate was performed
using a JEOL 7000F field emission scanning electron
microscope (FEG SEM). An acceleration voltage of
10 keV was used for all samples. The microhardness of
the as heat-treated samples were measured using the pre-
viously mentioned 200 gf load and 10 s dwell time.
Hardness measurements were taken at five different
locations for each sample.
The mechanical properties of the heat treated substrates
were assessed by tensile testing using an Instron 100 kN
electromechanical load frame with Merlin software.
Tensile samples were cut using a water jet cutter and finish
machined using carbide tools to the dimensions outlined
in ASTM E 8/E 8M-08[20] for sub-sized specimens with a
gage length of 25 mm and width of 6 mm. All tensile
samples were oriented such that the tensile axis was paral-
lel to the rolling direction. A constant crosshead speed of
1 mm min�1 was used for all tensile tests. An extensometer
was used to measure sample extension for all samples. In
all cases, five samples were tested for each annealing con-
dition and the results averaged.
In order to analyze the selective oxidation of the sub-
strate surface during annealing, small (50 mm� 10 mm)
samples were metallographically polished to remove the
effect of surface roughness. Samples were then heat
treated without galvanizing and stored in anhydrous iso-
propanol to minimize further oxidation before SEM, X-ray
photoelectron spectroscopy (XPS) and scanning Auger
microscopy (SAM) examination. Oxide morphology was
determined using SEM. SEM analysis was performed using
a JEOL 7000F field emission scanning electron microscopeFigure 2. Uniform temperature and coating area for galvanizingsimulator samples.
Sample ID. Peak annealing parameters Galvanizing parameter Cooling
Rate
[8C s�1]Temperature
(T) [8C]
Time
(t) [s]
Temperature
[8C]
Time
[s]
8278C – 60 s 827 (75% g) 60 460 4 20
8278C – 120 s 827 (75% g) 120
8788C – 60 s 878 (100% g) 60
8788C – 120 s 878 (100% g) 120
Table 2. Summary of experimental heat treatment parameters.
Peak annealing
temperature [8C]
N2 content
[vol%]
H2 content
[vol%]
Dew point
[8C]
pO2
[atm]
827 95 5 �30 8.86� 10�23
878 1.00� 10�21
Table 3. Annealing atmosphere compositions.
www.steel-research.de
� 2012 WILEY-VCH Verlag GmbH & Co. KGaA, Weinheim steel research int. 83 (2012) No. 9999 3
FULLPAPER
and an acceleration voltage of 10 keV. Samples were sput-
ter coated with gold to avoid sample charging.
Chemical analysis of the substrate surface was carried
out using XPS. XPS analysis was performed using a PHI
Quantera X-ray photoelectron spectroscope with an Al Ka
X-ray source (Physical Electronics, Chanhassen, MN). The
spot size used was 100 mm and the take off angle was 458.All spectra were calibrated using the metallic iron peak
position at 706.62 eV. The binding energy values obtained
were accurate to within �0.1 eV and the accuracy of
the chemical compositions measurements were �5% of
the measured value in atomic percent for each element.
The binding energy results shown were collected after
sputtering with Ar to a depth of �5 nm. Elemental depth
profiles were obtained by Ar sputtering followed by XPS
analysis of the new surface. Sputtering depth measure-
ments are considered to be accurate to within �10%.
The correlation between oxide morphology and
elemental distribution was studied with elemental
mapping using SAM. SAM data were collected using a
JEOL JAMP-9500F field emission Auger microprobe. The
energy of the primary electron beam was 15 keV and
samples were tilted 308 toward the electron analyzer in
all cases. Auto probe tracking was in effect during the
collection of elemental maps to eliminate the effects of
sample drift. Auger maps were collected from the substrate
surface after Ar sputtering to a depth of 20 nm to remove
oxidation artifacts from sample exposure to ambient
atmosphere. The accuracy of the sputtering depth was
�10%.
Reactive wetting of the steels by the liquid Zn alloy bath
was studied by measuring the area of bare spots in the
galvanized coating. Measurements of any bare spots
present on the galvanized panels were performed using
a Nikon AZ100M Stereoscope on the 90 mm� 90 mm
uniform coating area. Images were captured using 10�magnification. The bare spot area was measured by man-
ually selecting the bare spot perimeter.
Reactive wetting behavior was also investigated by ana-
lyzing the steel/coating interface via SEM. An acceleration
voltage of 10 keV was used for all samples. Any reaction
products at the substrate/coating interface were exposed
for SEM analysis by stripping the zinc overlay using: (i) an
inhibited 10% H2SO4 solution in water, which leaves any
Fe—Zn intermetallics as well as any Fe–Al (Fe2Al5�xZnx
0< x< 1, i.e., h-Fe2Al5Znx) intermetallics intact and
(ii) fuming nitric acid (HNO3), which removes any Fe–Zn
intermetallics, leaving the h-Fe2Al5Znx interfacial layer
intact.
The reactions occurring at the substrate/coating inter-
face were further investigated using a JEOL 2010F trans-
mission electron microscope (TEM) equipped with an
Oxford INCA Pentafet energy dispersive X-ray (EDX) spec-
trometer (Oxford Instruments, Abingdon, Oxfordshire,
UK). The acceleration voltage was 200 keV for all samples.
EDX was performed in scanning transmission electron
microscopy (STEM) mode with a probe size of 1 nm.
TEM sample preparation was performed using focused
ion beam (FIB) milling with an NVision 40 by Zeiss.
Adherence of the coating to the substrate steel was
determined using a 1808 ‘‘U’’ bend test per ASTM A
653/A 653M-09.[21] The occurrence of any flaking of the
coating was analyzed using a Nikon AZ100M Stereoscope
at the top of the ‘‘U’’ bend sample.
3. Results
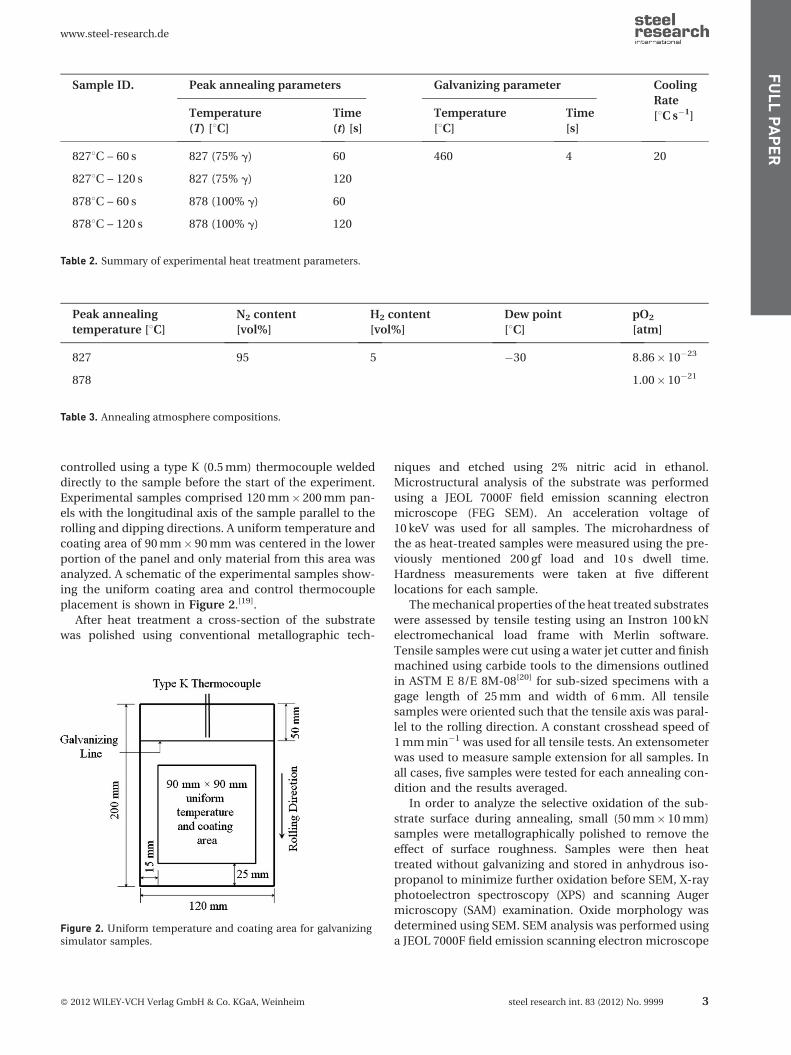
Figure 3 shows the experimentally determined CCT dia-
gram of the steel. Microhardness values for the steel as a
function of cooling rate are superimposed on the diagram.
It should be noted that the martensite start (Ms) and finish
(Mf) temperatures were determined to be �400 and 2008C,
respectively. Since the martensitic transformation takes
place after galvanizing at 4608C, it was determined there
was little possibility of tempering the martensite during
galvanizing. It was further determined that the critical
cooling rate to obtain 100% martensite was �208C s�1,
which is well suited for thermal processing in a conven-
tional CGL. It should also be pointed out that use of a
cooling rate of 108C s�1 would result in a complex phase
bainite–martensite microstructure of approximately the
same hardness (HV¼ 530) as the samples cooled at
208C s�1 (HV¼ 544). This latter finding implies that the
strength of the steel should be relatively insensitive to
cooling rates in excess of 108C s�1.
The use of a minimum annealing temperature which
will allow the target UTS of 1250 MPa (minimum) to be met
is always beneficial from the economic point of view. For
this reason, two PATs were selected based on the results of
the dilatometry studies conducted to determine the Ac1
and Ac3 temperatures (Figure 3). Based on these results,
intercritical annealing (IA) was carried out at 8278C such
Figure 3. Continuous cooling transformation diagram ofexperimental steel (F! ferrite, P! pearlite, B! bainite, andM! martensite).
www.steel-research.de
4 steel research int. 83 (2012) No. 9999 � 2012 WILEY-VCH Verlag GmbH & Co. KGaA, Weinheim
FULLPAPER
that 75% g formed and austenitic (100% g) annealing was
carried out at 8788C. As outlined in Table 2 and Figure 1,
the samples were isothermally held at their PAT for 60 and
120 s for the heat treatment trials.
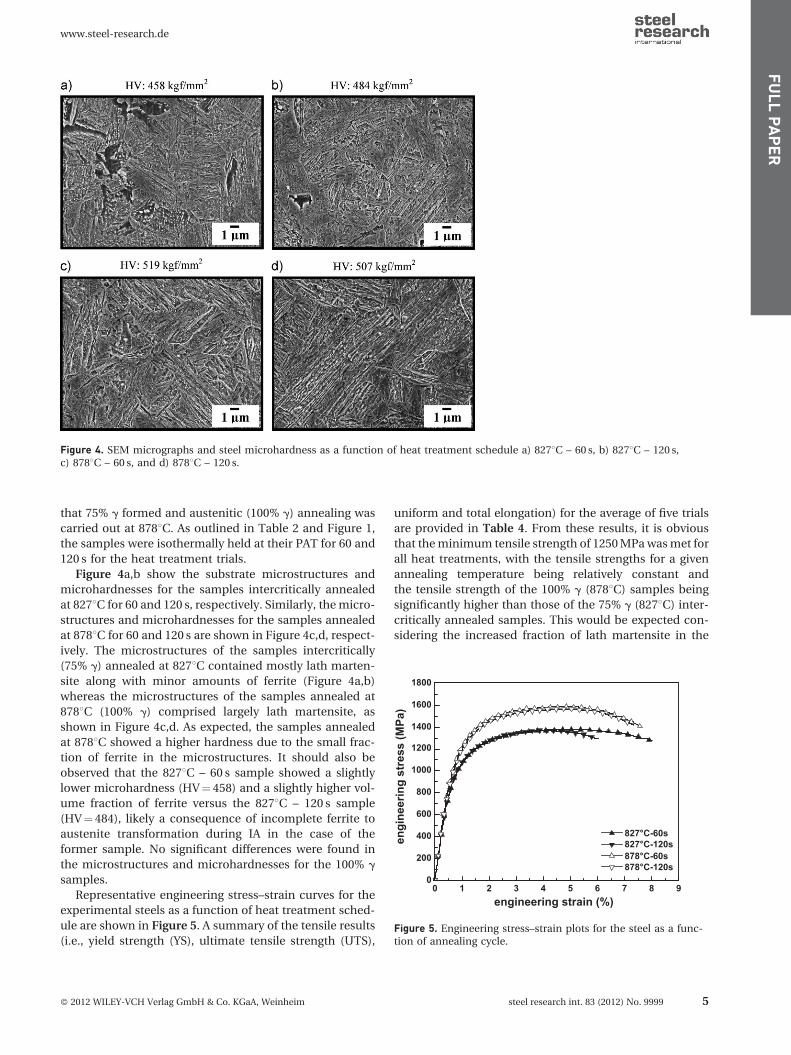
Figure 4a,b show the substrate microstructures and
microhardnesses for the samples intercritically annealed
at 8278C for 60 and 120 s, respectively. Similarly, the micro-
structures and microhardnesses for the samples annealed
at 8788C for 60 and 120 s are shown in Figure 4c,d, respect-
ively. The microstructures of the samples intercritically
(75% g) annealed at 8278C contained mostly lath marten-
site along with minor amounts of ferrite (Figure 4a,b)
whereas the microstructures of the samples annealed at
8788C (100% g) comprised largely lath martensite, as
shown in Figure 4c,d. As expected, the samples annealed
at 8788C showed a higher hardness due to the small frac-
tion of ferrite in the microstructures. It should also be
observed that the 8278C – 60 s sample showed a slightly
lower microhardness (HV¼ 458) and a slightly higher vol-
ume fraction of ferrite versus the 8278C – 120 s sample
(HV¼ 484), likely a consequence of incomplete ferrite to
austenite transformation during IA in the case of the
former sample. No significant differences were found in
the microstructures and microhardnesses for the 100% g
samples.
Representative engineering stress–strain curves for the
experimental steels as a function of heat treatment sched-
ule are shown in Figure 5. A summary of the tensile results
(i.e., yield strength (YS), ultimate tensile strength (UTS),
uniform and total elongation) for the average of five trials
are provided in Table 4. From these results, it is obvious
that the minimum tensile strength of 1250 MPa was met for
all heat treatments, with the tensile strengths for a given
annealing temperature being relatively constant and
the tensile strength of the 100% g (8788C) samples being
significantly higher than those of the 75% g (8278C) inter-
critically annealed samples. This would be expected con-
sidering the increased fraction of lath martensite in the
Figure 4. SEM micrographs and steel microhardness as a function of heat treatment schedule a) 8278C – 60 s, b) 8278C – 120 s,c) 8788C – 60 s, and d) 8788C – 120 s.
0 1 2 3 4 5 6 7 8 90
200
400
600
800
1000
1200
1400
1600
1800
engi
neer
ing
stre
ss (M
Pa)
engineering strain (%)
827°C-60s 827°C-120s 878°C-60s 878°C-120s
Figure 5. Engineering stress–strain plots for the steel as a func-tion of annealing cycle.
www.steel-research.de
� 2012 WILEY-VCH Verlag GmbH & Co. KGaA, Weinheim steel research int. 83 (2012) No. 9999 5
FULLPAPER
100% g samples versus the 75% g samples (Figure 4). An
examination of Table 4 will further show that the uniform
elongation for the samples was relatively insensitive to the
heat treatment parameters. It should be noted that a slight
increase in total elongation was observed for the 8278C –
60 s sample, likely due to the slightly higher amount of
ferrite present in this microstructure (Figure 4a).
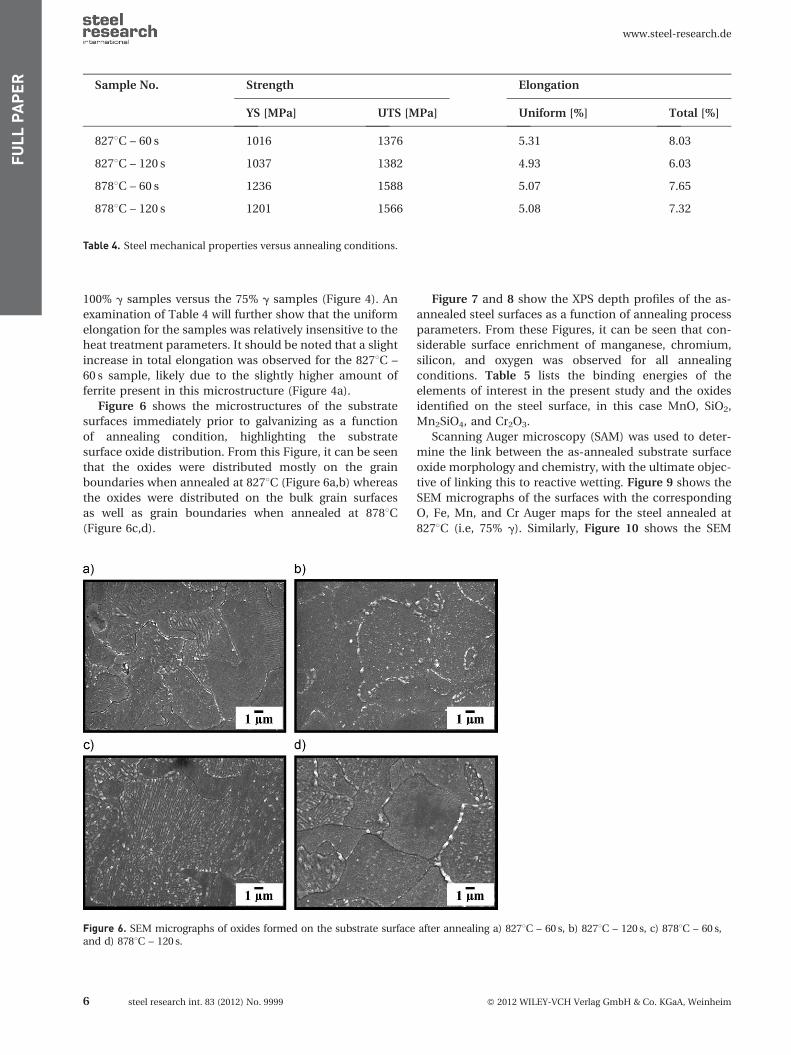
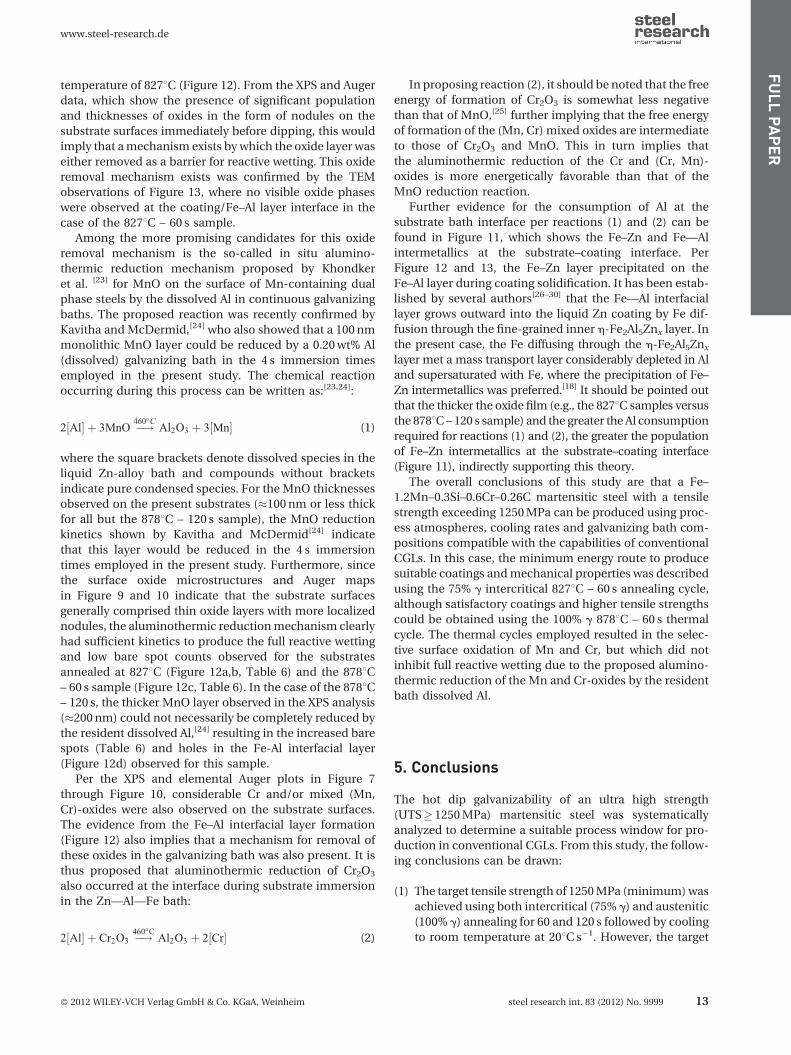
Figure 6 shows the microstructures of the substrate
surfaces immediately prior to galvanizing as a function
of annealing condition, highlighting the substrate
surface oxide distribution. From this Figure, it can be seen
that the oxides were distributed mostly on the grain
boundaries when annealed at 8278C (Figure 6a,b) whereas
the oxides were distributed on the bulk grain surfaces
as well as grain boundaries when annealed at 8788C(Figure 6c,d).
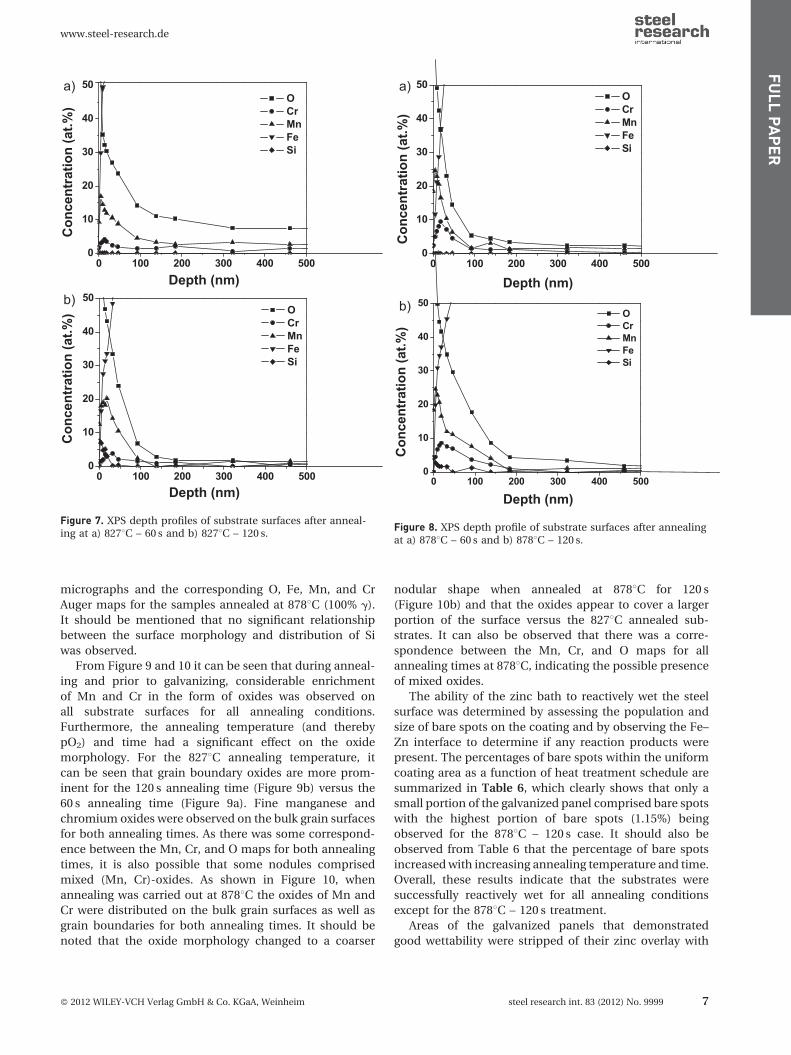
Figure 7 and 8 show the XPS depth profiles of the as-
annealed steel surfaces as a function of annealing process
parameters. From these Figures, it can be seen that con-
siderable surface enrichment of manganese, chromium,
silicon, and oxygen was observed for all annealing
conditions. Table 5 lists the binding energies of the
elements of interest in the present study and the oxides
identified on the steel surface, in this case MnO, SiO2,
Mn2SiO4, and Cr2O3.
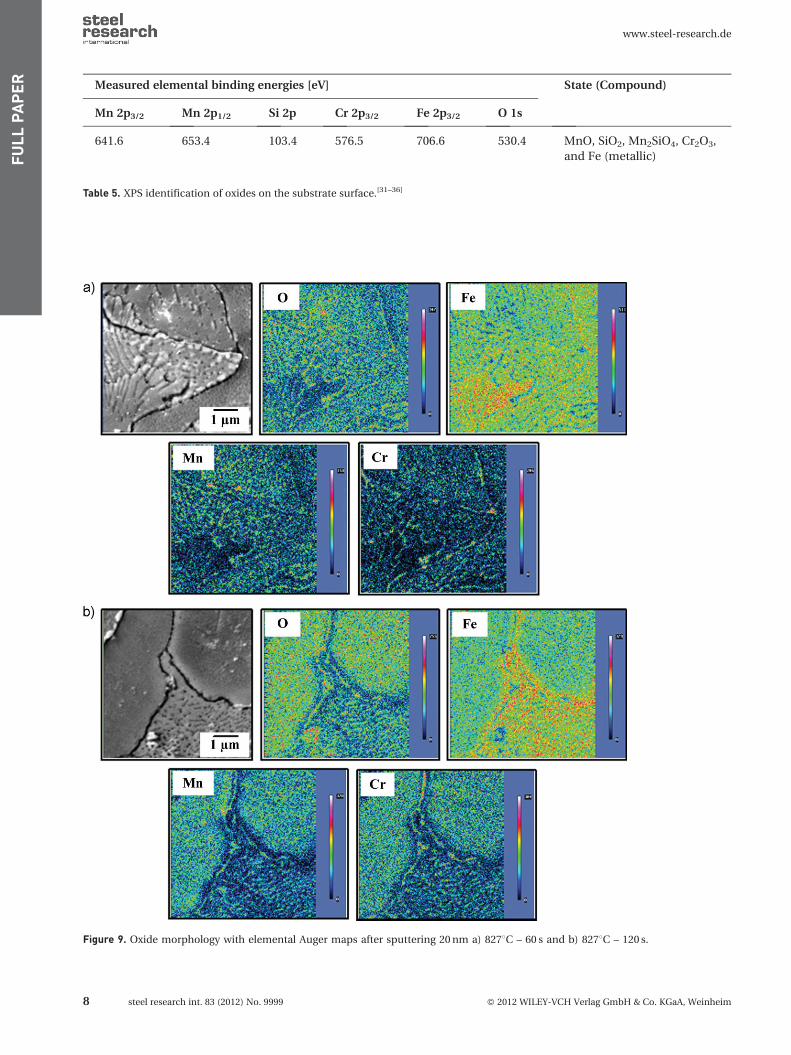
Scanning Auger microscopy (SAM) was used to deter-
mine the link between the as-annealed substrate surface
oxide morphology and chemistry, with the ultimate objec-
tive of linking this to reactive wetting. Figure 9 shows the
SEM micrographs of the surfaces with the corresponding
O, Fe, Mn, and Cr Auger maps for the steel annealed at
8278C (i.e, 75% g). Similarly, Figure 10 shows the SEM
Sample No. Strength Elongation
YS [MPa] UTS [MPa] Uniform [%] Total [%]
8278C – 60 s 1016 1376 5.31 8.03
8278C – 120 s 1037 1382 4.93 6.03
8788C – 60 s 1236 1588 5.07 7.65
8788C – 120 s 1201 1566 5.08 7.32
Table 4. Steel mechanical properties versus annealing conditions.
Figure 6. SEM micrographs of oxides formed on the substrate surface after annealing a) 8278C – 60 s, b) 8278C – 120 s, c) 8788C – 60 s,and d) 8788C – 120 s.
www.steel-research.de
6 steel research int. 83 (2012) No. 9999 � 2012 WILEY-VCH Verlag GmbH & Co. KGaA, Weinheim
FULLPAPER
micrographs and the corresponding O, Fe, Mn, and Cr
Auger maps for the samples annealed at 8788C (100% g).
It should be mentioned that no significant relationship
between the surface morphology and distribution of Si
was observed.
From Figure 9 and 10 it can be seen that during anneal-
ing and prior to galvanizing, considerable enrichment
of Mn and Cr in the form of oxides was observed on
all substrate surfaces for all annealing conditions.
Furthermore, the annealing temperature (and thereby
pO2) and time had a significant effect on the oxide
morphology. For the 8278C annealing temperature, it
can be seen that grain boundary oxides are more prom-
inent for the 120 s annealing time (Figure 9b) versus the
60 s annealing time (Figure 9a). Fine manganese and
chromium oxides were observed on the bulk grain surfaces
for both annealing times. As there was some correspond-
ence between the Mn, Cr, and O maps for both annealing
times, it is also possible that some nodules comprised
mixed (Mn, Cr)-oxides. As shown in Figure 10, when
annealing was carried out at 8788C the oxides of Mn and
Cr were distributed on the bulk grain surfaces as well as
grain boundaries for both annealing times. It should be
noted that the oxide morphology changed to a coarser
nodular shape when annealed at 8788C for 120 s
(Figure 10b) and that the oxides appear to cover a larger
portion of the surface versus the 8278C annealed sub-
strates. It can also be observed that there was a corre-
spondence between the Mn, Cr, and O maps for all
annealing times at 8788C, indicating the possible presence
of mixed oxides.
The ability of the zinc bath to reactively wet the steel
surface was determined by assessing the population and
size of bare spots on the coating and by observing the Fe–
Zn interface to determine if any reaction products were
present. The percentages of bare spots within the uniform
coating area as a function of heat treatment schedule are
summarized in Table 6, which clearly shows that only a
small portion of the galvanized panel comprised bare spots
with the highest portion of bare spots (1.15%) being
observed for the 8788C – 120 s case. It should also be
observed from Table 6 that the percentage of bare spots
increased with increasing annealing temperature and time.
Overall, these results indicate that the substrates were
successfully reactively wet for all annealing conditions
except for the 8788C – 120 s treatment.
Areas of the galvanized panels that demonstrated
good wettability were stripped of their zinc overlay with
0 100 200 300 400 5000
10
20
30
40
50C
once
ntra
tion
(at.%
)
Depth (nm)
O Cr Mn Fe Si
0 100 200 300 400 5000
10
20
30
40
50
Con
cent
ratio
n (a
t.%)
Depth (nm)
O Cr Mn Fe Si
a)
b)
Figure 7. XPS depth profiles of substrate surfaces after anneal-ing at a) 8278C – 60 s and b) 8278C – 120 s.
0 100 200 300 400 5000
10
20
30
40
50
Con
cent
ratio
n (a
t.%)
Depth (nm)
O Cr Mn Fe Si
0 100 200 300 400 5000
10
20
30
40
50
Depth (nm)
Con
cent
ratio
n (a
t.%)
O Cr Mn Fe Si
a)
b)
Figure 8. XPS depth profile of substrate surfaces after annealingat a) 8788C – 60 s and b) 8788C – 120 s.
www.steel-research.de
� 2012 WILEY-VCH Verlag GmbH & Co. KGaA, Weinheim steel research int. 83 (2012) No. 9999 7
FULLPAPER
Measured elemental binding energies [eV] State (Compound)
Mn 2p3/2 Mn 2p1/2 Si 2p Cr 2p3/2 Fe 2p3/2 O 1s
641.6 653.4 103.4 576.5 706.6 530.4 MnO, SiO2, Mn2SiO4, Cr2O3,
and Fe (metallic)
Table 5. XPS identification of oxides on the substrate surface.[31–36]
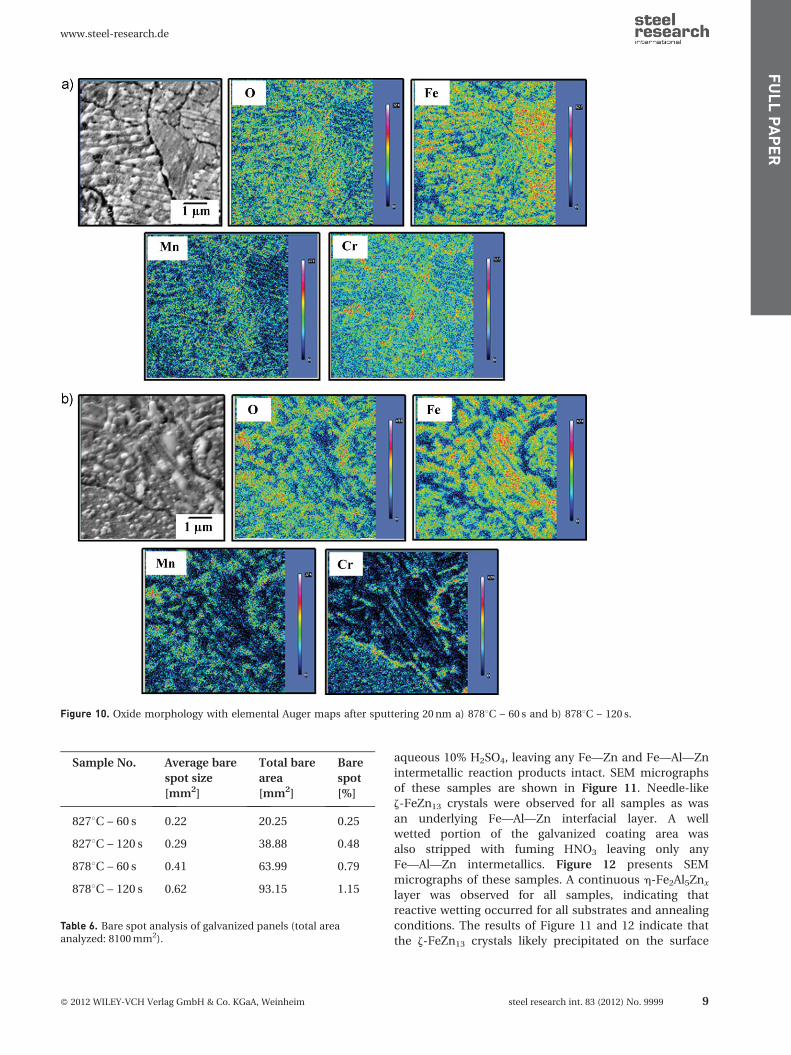
Figure 9. Oxide morphology with elemental Auger maps after sputtering 20 nm a) 8278C – 60 s and b) 8278C – 120 s.
www.steel-research.de
8 steel research int. 83 (2012) No. 9999 � 2012 WILEY-VCH Verlag GmbH & Co. KGaA, Weinheim
FULLPAPER
aqueous 10% H2SO4, leaving any Fe—Zn and Fe—Al—Zn
intermetallic reaction products intact. SEM micrographs
of these samples are shown in Figure 11. Needle-like
z-FeZn13 crystals were observed for all samples as was
an underlying Fe—Al—Zn interfacial layer. A well
wetted portion of the galvanized coating area was
also stripped with fuming HNO3 leaving only any
Fe—Al—Zn intermetallics. Figure 12 presents SEM
micrographs of these samples. A continuous h-Fe2Al5Znx
layer was observed for all samples, indicating that
reactive wetting occurred for all substrates and annealing
conditions. The results of Figure 11 and 12 indicate that
the z-FeZn13 crystals likely precipitated on the surface
Figure 10. Oxide morphology with elemental Auger maps after sputtering 20 nm a) 8788C – 60 s and b) 8788C – 120 s.
Sample No. Average bare
spot size
[mm2]
Total bare
area
[mm2]
Bare
spot
[%]
8278C – 60 s 0.22 20.25 0.25
8278C – 120 s 0.29 38.88 0.48
8788C – 60 s 0.41 63.99 0.79
8788C – 120 s 0.62 93.15 1.15
Table 6. Bare spot analysis of galvanized panels (total areaanalyzed: 8100 mm2).
www.steel-research.de
� 2012 WILEY-VCH Verlag GmbH & Co. KGaA, Weinheim steel research int. 83 (2012) No. 9999 9
FULLPAPER
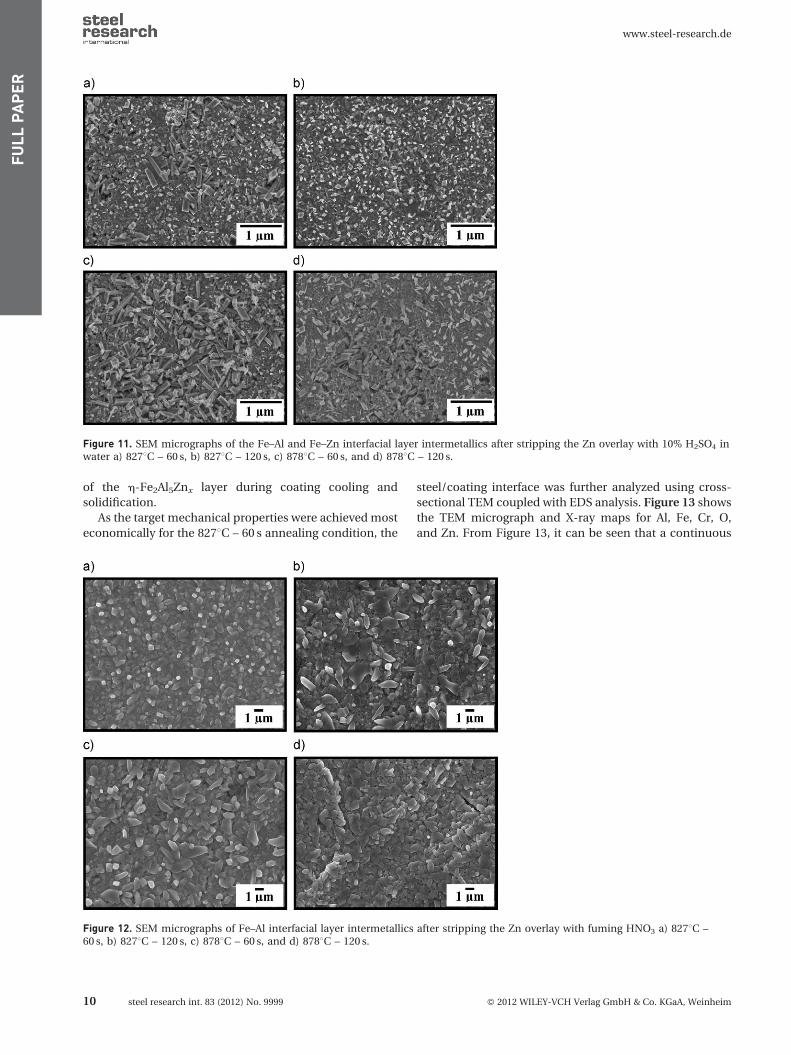
of the h-Fe2Al5Znx layer during coating cooling and
solidification.
As the target mechanical properties were achieved most
economically for the 8278C – 60 s annealing condition, the
steel/coating interface was further analyzed using cross-
sectional TEM coupled with EDS analysis. Figure 13 shows
the TEM micrograph and X-ray maps for Al, Fe, Cr, O,
and Zn. From Figure 13, it can be seen that a continuous
Figure 11. SEM micrographs of the Fe–Al and Fe–Zn interfacial layer intermetallics after stripping the Zn overlay with 10% H2SO4 inwater a) 8278C – 60 s, b) 8278C – 120 s, c) 8788C – 60 s, and d) 8788C – 120 s.
Figure 12. SEM micrographs of Fe–Al interfacial layer intermetallics after stripping the Zn overlay with fuming HNO3 a) 8278C –60 s, b) 8278C – 120 s, c) 8788C – 60 s, and d) 8788C – 120 s.
www.steel-research.de
10 steel research int. 83 (2012) No. 9999 � 2012 WILEY-VCH Verlag GmbH & Co. KGaA, Weinheim
FULLPAPER
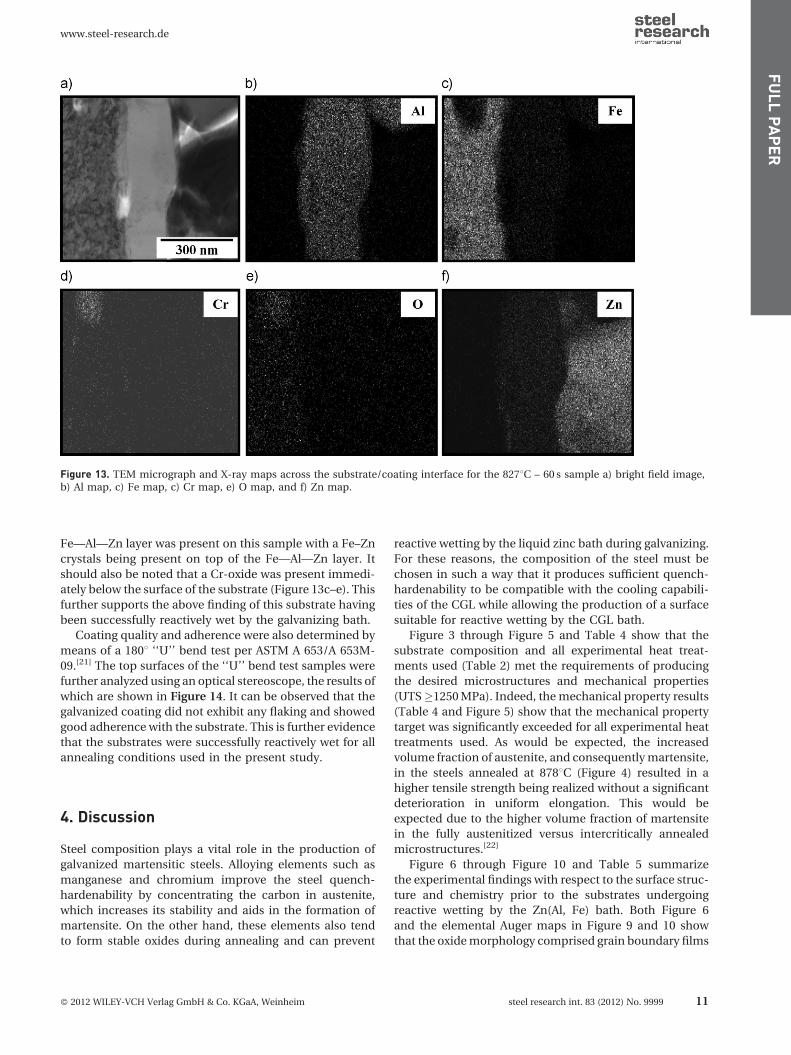
Fe—Al—Zn layer was present on this sample with a Fe–Zn
crystals being present on top of the Fe—Al—Zn layer. It
should also be noted that a Cr-oxide was present immedi-
ately below the surface of the substrate (Figure 13c–e). This
further supports the above finding of this substrate having
been successfully reactively wet by the galvanizing bath.
Coating quality and adherence were also determined by
means of a 1808 ‘‘U’’ bend test per ASTM A 653/A 653M-
09.[21] The top surfaces of the ‘‘U’’ bend test samples were
further analyzed using an optical stereoscope, the results of
which are shown in Figure 14. It can be observed that the
galvanized coating did not exhibit any flaking and showed
good adherence with the substrate. This is further evidence
that the substrates were successfully reactively wet for all
annealing conditions used in the present study.
4. Discussion
Steel composition plays a vital role in the production of
galvanized martensitic steels. Alloying elements such as
manganese and chromium improve the steel quench-
hardenability by concentrating the carbon in austenite,
which increases its stability and aids in the formation of
martensite. On the other hand, these elements also tend
to form stable oxides during annealing and can prevent
reactive wetting by the liquid zinc bath during galvanizing.
For these reasons, the composition of the steel must be
chosen in such a way that it produces sufficient quench-
hardenability to be compatible with the cooling capabili-
ties of the CGL while allowing the production of a surface
suitable for reactive wetting by the CGL bath.
Figure 3 through Figure 5 and Table 4 show that the
substrate composition and all experimental heat treat-
ments used (Table 2) met the requirements of producing
the desired microstructures and mechanical properties
(UTS�1250 MPa). Indeed, the mechanical property results
(Table 4 and Figure 5) show that the mechanical property
target was significantly exceeded for all experimental heat
treatments used. As would be expected, the increased
volume fraction of austenite, and consequently martensite,
in the steels annealed at 8788C (Figure 4) resulted in a
higher tensile strength being realized without a significant
deterioration in uniform elongation. This would be
expected due to the higher volume fraction of martensite
in the fully austenitized versus intercritically annealed
microstructures.[22]
Figure 6 through Figure 10 and Table 5 summarize
the experimental findings with respect to the surface struc-
ture and chemistry prior to the substrates undergoing
reactive wetting by the Zn(Al, Fe) bath. Both Figure 6
and the elemental Auger maps in Figure 9 and 10 show
that the oxide morphology comprised grain boundary films
Figure 13. TEM micrograph and X-ray maps across the substrate/coating interface for the 8278C – 60 s sample a) bright field image,b) Al map, c) Fe map, c) Cr map, e) O map, and f) Zn map.
www.steel-research.de
� 2012 WILEY-VCH Verlag GmbH & Co. KGaA, Weinheim steel research int. 83 (2012) No. 9999 11
FULLPAPER

with an increasing area of the bulk grains being covered by
nodular oxides as the annealing time and temperature
increased. These nodules comprised mainly manganese
(Mn) and chromium (Cr) oxides with some evidence of
mixed (Mn, Cr) oxides being present on the bulk grain
surfaces and grain boundaries. This overall trend was con-
firmed by the XPS profiles (Figure 7 and 8), which showed
considerable enrichment of manganese (as MnO, Table 5)
and chromium (as Cr2O3) with minor enrichment of silicon
(as SiO2). For example, the manganese enrichment was
�20 at% when annealed at 8278C (Figure 7) versus�25 at%
when annealing at 8788C (Figure 8). Similar trends are also
seen for the chromium enrichment, where there was
�5 at% Cr at the surface when annealing at 8278C whereas
there was �10 at% Cr on the surfaces annealed at 8788C.
These observations are not surprising given that the selec-
tive oxidation process is diffusion driven and that the
atmospheric pO2 is two orders of magnitude greater for
the 8788C annealing temperature (Table 3), thereby pro-
viding a more significant oxygen flux into the substrate. It
should also be noted that internal oxidation of chromium
was clearly observed for all annealing conditions, where
the peak chromium concentration was invariably located
some 25 nm below the initial surface. It should be further
noted that internal oxidation of chromium was observed
for the cross-sectional TEM study conducted on the
galvanized 8278C – 60 s sample (Figure 13a,d,e), supporting
this finding. From these observations, it can be concluded
that the post-annealing surfaces comprised mixtures of Mn
and Cr-oxide nodules and grain boundary films whose
thickness and coverage increased with both annealing
temperature (and thereby increase atmospheric pO2)
and annealing time, with some internal oxidation of Cr
having taken place.
The interaction of the as-annealed surfaces with the
0.20 wt% dissolved Al galvanizing bath are highlighted
in Figure 11 through Figure 14 and Table 6. From the
interfacial microstructures shown in Figure 11 and 12 com-
bined with the bare spot analysis shown in Table 6, it is
obvious that a high degree of reactive wetting was obtained
for all annealing conditions except for the 8788C – 120 s
thermal cycle. In addition, Figure 14 shows that all of the
coatings produced showed high adherence, indicating that
the Fe–Zn phases shown in Figure 11 did not have a del-
eterious effect on the coating properties. From the above, it
can be concluded that, despite the presence of significant
oxides on the as-annealed surfaces, the substrate surfaces
annealed at 8278C and 8788C – 60 s were reactively wet and
formed the desired Fe–Al interfacial layer to produce high
quality, adherent metallic Zn coatings. The exception to
this was the high temperature, longer annealing time 8788C– 120 s condition. However, since there are no significant
strength benefits to be gained by using this annealing cycle
versus the 8788C – 60 s cycle, there is no practical reason
to employ this cycle in processing these substrates
industrially.
From Figure 11 through Figure 13, it can be seen that
a well developed Fe–Al interfacial layer was formed
for the majority of the annealing conditions explored
and in particular for the lower energy intensity annealing
Figure 14. Stereo micrographs from the top of the 1808 ‘‘U’’ bend galvanized steel samples a) 8278C – 60 s, b) 8278C – 120 s,c) 8788C – 60 s, and d) 8788C – 120 s.
www.steel-research.de
12 steel research int. 83 (2012) No. 9999 � 2012 WILEY-VCH Verlag GmbH & Co. KGaA, Weinheim
FULLPAPER
temperature of 8278C (Figure 12). From the XPS and Auger
data, which show the presence of significant population
and thicknesses of oxides in the form of nodules on the
substrate surfaces immediately before dipping, this would
imply that a mechanism exists by which the oxide layer was
either removed as a barrier for reactive wetting. This oxide
removal mechanism exists was confirmed by the TEM
observations of Figure 13, where no visible oxide phases
were observed at the coating/Fe–Al layer interface in the
case of the 8278C – 60 s sample.
Among the more promising candidates for this oxide
removal mechanism is the so-called in situ alumino-
thermic reduction mechanism proposed by Khondker
et al. [23] for MnO on the surface of Mn-containing dual
phase steels by the dissolved Al in continuous galvanizing
baths. The proposed reaction was recently confirmed by
Kavitha and McDermid,[24] who also showed that a 100 nm
monolithic MnO layer could be reduced by a 0.20 wt% Al
(dissolved) galvanizing bath in the 4 s immersion times
employed in the present study. The chemical reaction
occurring during this process can be written as:[23,24]:
2½Al� þ 3MnO �!460CAl2O3 þ 3½Mn� (1)
where the square brackets denote dissolved species in the
liquid Zn-alloy bath and compounds without brackets
indicate pure condensed species. For the MnO thicknesses
observed on the present substrates (�100 nm or less thick
for all but the 8788C – 120 s sample), the MnO reduction
kinetics shown by Kavitha and McDermid[24] indicate
that this layer would be reduced in the 4 s immersion
times employed in the present study. Furthermore, since
the surface oxide microstructures and Auger maps
in Figure 9 and 10 indicate that the substrate surfaces
generally comprised thin oxide layers with more localized
nodules, the aluminothermic reduction mechanism clearly
had sufficient kinetics to produce the full reactive wetting
and low bare spot counts observed for the substrates
annealed at 8278C (Figure 12a,b, Table 6) and the 8788C– 60 s sample (Figure 12c, Table 6). In the case of the 8788C– 120 s, the thicker MnO layer observed in the XPS analysis
(�200 nm) could not necessarily be completely reduced by
the resident dissolved Al,[24] resulting in the increased bare
spots (Table 6) and holes in the Fe-Al interfacial layer
(Figure 12d) observed for this sample.
Per the XPS and elemental Auger plots in Figure 7
through Figure 10, considerable Cr and/or mixed (Mn,
Cr)-oxides were also observed on the substrate surfaces.
The evidence from the Fe–Al interfacial layer formation
(Figure 12) also implies that a mechanism for removal of
these oxides in the galvanizing bath was also present. It is
thus proposed that aluminothermic reduction of Cr2O3
also occurred at the interface during substrate immersion
in the Zn—Al—Fe bath:
2½Al� þ Cr2O3 �!460C
Al2O3 þ 2½Cr� (2)
In proposing reaction (2), it should be noted that the free
energy of formation of Cr2O3 is somewhat less negative
than that of MnO,[25] further implying that the free energy
of formation of the (Mn, Cr) mixed oxides are intermediate
to those of Cr2O3 and MnO. This in turn implies that
the aluminothermic reduction of the Cr and (Cr, Mn)-
oxides is more energetically favorable than that of the
MnO reduction reaction.
Further evidence for the consumption of Al at the
substrate bath interface per reactions (1) and (2) can be
found in Figure 11, which shows the Fe–Zn and Fe—Al
intermetallics at the substrate–coating interface. Per
Figure 12 and 13, the Fe–Zn layer precipitated on the
Fe–Al layer during coating solidification. It has been estab-
lished by several authors[26–30] that the Fe—Al interfacial
layer grows outward into the liquid Zn coating by Fe dif-
fusion through the fine-grained inner h-Fe2Al5Znx layer. In
the present case, the Fe diffusing through the h-Fe2Al5Znx
layer met a mass transport layer considerably depleted in Al
and supersaturated with Fe, where the precipitation of Fe–
Zn intermetallics was preferred.[18] It should be pointed out
that the thicker the oxide film (e.g., the 8278C samples versus
the 8788C – 120 s sample) and the greater the Al consumption
required for reactions (1) and (2), the greater the population
of Fe–Zn intermetallics at the substrate–coating interface
(Figure 11), indirectly supporting this theory.
The overall conclusions of this study are that a Fe–
1.2Mn–0.3Si–0.6Cr–0.26C martensitic steel with a tensile
strength exceeding 1250 MPa can be produced using proc-
ess atmospheres, cooling rates and galvanizing bath com-
positions compatible with the capabilities of conventional
CGLs. In this case, the minimum energy route to produce
suitable coatings and mechanical properties was described
using the 75% g intercritical 8278C – 60 s annealing cycle,
although satisfactory coatings and higher tensile strengths
could be obtained using the 100% g 8788C – 60 s thermal
cycle. The thermal cycles employed resulted in the selec-
tive surface oxidation of Mn and Cr, but which did not
inhibit full reactive wetting due to the proposed alumino-
thermic reduction of the Mn and Cr-oxides by the resident
bath dissolved Al.
5. Conclusions
The hot dip galvanizability of an ultra high strength
(UTS� 1250 MPa) martensitic steel was systematically
analyzed to determine a suitable process window for pro-
duction in conventional CGLs. From this study, the follow-
ing conclusions can be drawn:
(1) The target tensile strength of 1250 MPa (minimum) was
achieved using both intercritical (75% g) and austenitic
(100% g) annealing for 60 and 120 s followed by cooling
to room temperature at 208C s�1. However, the target
www.steel-research.de
� 2012 WILEY-VCH Verlag GmbH & Co. KGaA, Weinheim steel research int. 83 (2012) No. 9999 13
FULLPAPER
strength was achieved most economically when
employing the 8278C – 60 s annealing cycle.
(2) Surfaces which could be successfully reactively wet by
the Zn (Al, Fe) bath were produced using a conventional
95%N2–5%H2, �308C dew point process atmosphere for
the intercritically annealed (8278C – 60s, 8278C – 120s)
and austenitically annealed sample 8788C – 60s, despite
the presence of significant thicknesses (100 nm) of Mn
and Cr-oxides on the bulk grain surfaces and in the form
of grain boundary films. Reactive wetting was adversely
affected in the case of the 8788C – 120s sample due the
presence of a thicker oxide layer on this sample.
(3) The morphology of the surface oxides changed when
annealing was carried out at higher temperatures and
the oxide layer thickness increased with annealing
temperature (and thereby process atmosphere pO2)
and annealing time on the surface of the austenitically
annealed steel. It was also observed that these oxides
were distributed mostly on the grain boundaries when
annealed at 8278C whereas they were distributed on the
bulk grain surface as well as grain boundaries when
annealed at 8788C.
(4) It is proposed that both the Mn and Cr-oxides on the
surface of the steel were reduced and reactive wetting
promoted due to in situ aluminothermic reduction of
MnO and Cr2O3 by the dissolved bath Al. This mech-
anism was not able to fully reduce the oxide layers on
the 8788C – 120s due to the thicker oxides observed on
this sample.
(5) A Fe–1.2Mn–0.3Si–0.6Cr–0.26C martensitic steel with a
tensile strength significantly exceeding 1250 MPa was
produced using process atmospheres, cooling rates
and galvanizing bath compositions compatible with
the capabilities of conventional CGLs. In this case,
the minimum energy route to produce suitable coat-
ings and mechanical properties was described using
the 75% g intercritical 8278C – 60s annealing cycle.
Acknowledgments
The authors would like to thank the members of the
International Zinc Association, Galvanized Autobody
Partnership, ArcelorMittal (Dofasco), and the Natural
Sciences and Engineering Research Council of Canada
(NSERC) for their financial support and provision of exper-
imental materials. The author would like to thank the
RIEM program of CANMET-MTL for access to the quench
dilatometer for determination of the CCT diagram.
The authors would also like to thank John Thomson,
Mariana Budiman, Doug Culley, Steve Koprich and Rob
Lemmon for their technical support.
Received: May 18, 2012
Keywords: aluminothermic reduction; continuous
cooling transformation; continuous galvanizing;
martensitic steel; reactive wetting
References
[1] C. Scott, N. Guelton, S. Allain, M. Faral,
Developments in sheet products for automotive
applications, Materials Science and Technology Conf.
Proc., AIST 2005, p. 127.
[2] J. Mahieu, S. Claessens, B. C. De Cooman, F.
Goodwin, 6th International conference on zinc and
zinc alloy coated steel sheet, Galvatech Conf. Proc.,
AIST 2004, p. 529.
[3] T. Song, J. Kwak, B. C. De Cooman, Metall. Mater.
Trans. A 2012, 43A(1), 263.
[4] E. De Bruycker, B. C. De Cooman, M. De Meyer,
Steel Res. Int. 2004, 75(2), 147.
[5] A. R. Marder, Prog. Mater. Sci. 2000, 45, 191.
[6] J. Lee, J. Park, S. H. Jeon, Metall. Mater. Trans. B
2009, 40B, 1035.
[7] S. H. Jeon, K. G. Chin, K. S. Shin, J. H. Lee,
H. S. Sohn, J. Korean Inst. Met. Mater. 2009, 47(7),
423.
[8] P. Drillet, Z. Zermout, D. Bouleau, J. Mataigne, S.
Claessens, 6th International conference on zinc and
zinc alloy coated steel sheet, Galvatech Conf. Proc.,
AIST 2004, p. 1123.
[9] J. Mahieu, S. Claessens, B. C. De Cooman, Metall.
Mater. Trans. A 2001, 32A, 2905.
[10] J. Maki, J. Mahieu, B. C. De Cooman, S. Claessens,
Mater. Sci. Technol. 2003, 19, 125.
[11] J. Mahieu, S. Classens, B. C. De Cooman, F. E.
Goodwin, 6th International conference on zinc and
zinc alloy coated steel sheet, Galvatech Conf. Proc.,
AIST 2004, p. 529.
[12] J. Mahieu, B. C. De Cooman, J. Maki, S. Claessens,
Iron Steelmaker 2002, 29, 29.
[13] K. Matsumura, N. Fujita, T. Nonaka, 7th
International conference on zinc and zinc alloy
coated steel sheet, Galvatech Conf. Proc. 2007,
p. 392.
[14] E. C. Oren, F. E. Goodwin, 6th International
conference on zinc and zinc alloy coated steel sheet,
Galvatech Conf. Proc., AIST 2004, p. 737.
[15] M. Babbit, Steel Res. Int. 2006, 77(9–10), 620.
[16] K. Sugimoto, B. Yu, ISIJ Int. 2005, 45(8),
1194.
[17] T. Song, J. Kwak, B. C. De Cooman, Metall. Mater.
Trans. A 2012, 43A(1), 245.
[18] J. R. McDermid, M. H. Kaye, W. T. Thompson,
Metall. Mater. Trans. B 2007, 38, 215.
[19] E. M. Bellhouse, J. R. McDermid, Mater. Sci. Eng. A
2008, 491, 39.
[20] Standard Test Method for Tension Testing of
Metallic Materials, ASTM Standard, Designation:
E 8/E 8M-08.
[21] Standard Specification for Steel Sheet, Zinc-
Coated (Galvanized) or Zinc-Iron Alloy-Coated
(Galvannealed) by the Hot-Dip Process, ASTM
Standard, Designation: A 653/A 653M-09.
www.steel-research.de
14 steel research int. 83 (2012) No. 9999 � 2012 WILEY-VCH Verlag GmbH & Co. KGaA, Weinheim
FULLPAPER
[22] E. M. Bellhouse, J. R. McDermid, Metall. Mater.
Trans. A 2010, 41A, 1460.
[23] R. H. Khondker, A. Mertens, J. R. McDermid, Mater.
Sci. Eng. A 2007, 463(1–2), 157.
[24] R. Kavitha, J. R. McDermid, 8th International confer-
ence on zinc and zinc alloy coated steel sheet,
Galvatech Conf. Proc., AIM 2011.
[25] D. R. Gaskell, Introduction to the Thermodynamics
of Materials, 5th ed., Taylor and Francis, London
2008, pp. 359.
[26] L. Chen, R. Fourmentin, J. R. McDermid, Metall.
Mater. Trans. A 2008, 39A, 2128.
[27] N. Tang, G. R. Adams, The Physical Metallurgy
of Zinc Coated Steel, Conf. Proc., TMS, 1994,
p. 41.
[28] J. Faderl, W. Maschek, J. Strutzenberger, 4th
International conference on zinc and zinc alloy
coated steel sheet, Galvatech Conf. Proc. 1995,
p. 675.
[29] E. Baril, G. L’Esperance, Metall. Mater. Trans. A
1999, 30A, 681.
[30] P. Toussaint, L. Segers, R. Winand, M. Dubois, ISIJ
Int. 1998, 38, 985.
[31] B. R. Strohmeier, D. M. Hercules, J. Phys. Chem.
1984, 88, 4922.
[32] S. Swaminathan, M. Spiegel, Appl. Surf. Sci. 2007,
253, 4607.
[33] W. H. Casey, M. F. Hochella, Jr, H. R. Westrich,
Geochim. Cosmochim. Acta 1993, 57, 785.
[34] I. Olefjord, H. J. Mathieu, P. Marcus, Surf. Interface
Anal. 1990, 15, 681.
[35] H. F. Franzen, M. X. Umana, J. R. McCreary, R. J.
Thorn, J. Solid State Chem. 1976, 18, 363.
[36] A. Aoki, Jpn. J. Appl. Phys. 1976, 15, 305.
www.steel-research.de
� 2012 WILEY-VCH Verlag GmbH & Co. KGaA, Weinheim steel research int. 83 (2012) No. 9999 15
FULLPAPER