the development of power specific redlines ssme … · the development of power specific redlines...
TRANSCRIPT

NASA Contractor Report 185 12 1 AIAA-89-24 13
The Development of Power Specific Redlines for SSME Safety Monitoring
(NASA-CE-185121) THE DEVELOPHENT GF PCWEa bT8 9 -260 27 S P E C I F I C BEDLINES E'OR SSME SAFETY BOIi I S O R X N G F i n a l Report (Sverdrup Technoloqy) 36 F
C S C t 1 4 8 U n c l a s G3/15 0219680
William A. Maul and Claudia M. Bosch Sverdrup Technology, Inc. NASA Lewis Research Center Group Cleveland, Ohio
June 1989
Prepared for Lewis Research Center Under Contract NAS3-25266
National Aeronautics and Space Administration
https://ntrs.nasa.gov/search.jsp?R=19890016656 2018-09-12T03:06:59+00:00Z
The Development of Power Specific Redliiies for SSME Safety Monitoring
William A. Maul and Claudia M. Bosch Sverdrup Technology, Inc./NASA Lewis Research Center Group
Cleveland, Ohio 44135
ABSTRACT
Over tlie past several years, there has been an increased awareness in the ne- ccssity for rocket engine health iiionitming because of the cost and coniplexity of present anel future systenis. A current rocket engine system, the Space Shuttle hIaiti Engine ( SShIE), combines a limited redline system with closed-loop control o f tlie eiigine’s tliriist level and iiiixtrire ratio. Despite these features, 27 tests of the SShl E h a v t i.csiilted in iiiajor iiicidriils. In this investigatioii, a n SSME transient iiiodtl was iised to examine tlie eftiact of variations in high pressure turbopump 1wrforiiiance on varioiis engine paraiiic.lers. Based on analysis of the responses, sev- eral new parameters are proposed for further investigation as power-level specific recllines.
Introduction
The object.ive of t,Iiis effort was t,o analytically invest.igat.e a set of paraniet,ers and t.o select, ca.ndidat,es for t.he development. of power-level specific redlines which could indica.te Space Shut,tle Main Engine (SSME) failure earlier than the current, clet,ect.ion system. In recent, years, there has been increased act,ivit,y in the area of rocket, engine health monitoring and controls driven by concern over the safet,y and mai~it~ainabilit~y of the SSME and fut.ure engines. Historically, limits, or redlines, on cri t,ica.l paraiiiet,ers 1ia.ve been iised t,o minimize cat,astropliic failures of expendable l i q i i i d rocket, engines on launch vehicles such a.s the Atlas a.nd Titman. Although the SSME is reusa.ble a.nd relatively more coiiiplex t,lian previous engines, its fa.ilure cont.ro1 syst.eiii employs only ba.sic redlines combined wit,li cont,roller limit logic, reduiida.rit. sensors a.nd cont.roller voting logic.
I>csl)it,e t.liis fa.iI1ir.e cont.ro1 syst.t.111. st-si t\ra.l SShlE tcs t firiiigs 1ia1.c res111tc-tl i l l coiiiple1.e or pa,rt.ia.l loss o f ari e i i g i i i t a . Fortj--fivc firiilgs l iave bee11 classilirtl iis
failures, a n d 27 1ia.ve liatl sufficient sevt,i.ity to be labelletl a,s m a j o r fa.iIiires ( re f . 1 ). i\lt,lioiigli t.liis represe1it.s a s1liilll percmt,age o f t.he more t’lia.11 1200 test. firings 1 . 0 tlat.e, t.lie t.inie and cost. impacts 1iil.ve been significant.: aniount,ing t.0 several liuntlretl niillion dollars. Due t,o t,lie t.iiiie, cost. and safet.y faclors involved in rocket. engine opera.t,ion, niaiiy invest,iga.tions a.re underway which are a.tt~enipt.ing t.0 proviclc iiiiprovenient,s t,o t,lie current. st,a t.e of rocltet. eiigiiie liealtli iiioiiit,oririg systems.
Some efforts Iiave focused on t.he exist,iiig sensor set, wliile ot.liers have focused o i l t,he clevelopiiieiit. o f new sensors. The existmirig sensors have been used in 1.lic

clcvclopiiie~it of a Survey/Acqiiire Faillire Detection (SAFT)) algorithni to detect Ii\illil.es during the s teady state operatioti of the SSME (ref. 2-4). W h e ~ i tested using tlat a from a limited iiuiiiber of aiioiiialoiis test firings, SAFD signaled a shutdown earlier than the redliiie cutoff. In the area of sensors, specialized bearing and turbine l>lade iiionitoriiig techniques have been developed as part of the SSME Alternate Tiirl~opuiiip Developriien t ( ATD) program (ref. 5 ) arid advanced sensors have been iiiipleuie~itetl on a rocket engine liealtli iiioriitoring laboratory test bed (ref. 6 ) . Spwt ronietric techniques have also been developed to iiioiiitor the SSME plunie as a iiicaiis of indicating engine failure or degradation (ref. 7-8) .
In tliis study, a transient model of the SSME was used to examine tlie effect of variations in high pressure turbopump performance on modeled parameters which are also sensor iiieasiireiiient s. Based (111 the analysis of the responses, several new pijratiieters are proposed as promising candidates for power-level specific redliiies ~ ~ l i i c l i , ill the evelit of failure, could resiilt in earlier engine shutdown. The effect of var ia t ions in liipli pressure turbopiiiiip performance o n system beliavior was inves- t igatecl for two reasoli?. First, these t iii.I)opuiiips are line replaceable units (LRIJs) which exliihit a wide range of accept al)Ic perforniance. Second, the test history o f i lie eiigine aiicl failure analysis re1)oi.t s ( ref. (3-1 1) iiidicat c f h a t the liigli pressrrre t i i r h o p ~ i i i ~ p s cleserve a high priority i l l SSME health iiioiiit ()ring eRorts.
Background
S S h l E 11 e s c r i p t i 011
The Space Shuttle Main Engine (SSME) is a reusable liquid hydrogen and liq- uid oxygen fueled rocket engine that supplies thrust through a two stage combustion process. Tlie engine consists of two similar subsystems, each cont aiiiing a low pres- sure turbopunip, high pressure turbopiimp and a preburner, as shown in figure 1, which supply the oxidizer and tlie fuel to the main coinbustion chamber. In the first st age of t lie comhiistion process, each preburner produces a hot fuel-rich gaseous mixture t h a t is used to drive its respective high pressure turbine. The second stage is a co~itrolle(l hurn i n tlie main comblistion chamber t liat produces the engine’s t 11 r11s t .

The corit rol syst eiii coiiiniences closed-loop control of t lie iiiaiii conibust.ioii c.liaiiilier pressure at start +.74 seconds and closed loop control of the niixture ratio at start +3.G seconds. Thrust control is achieved by using the error between the reference aiid actual main combustion chamber (MCC) pressures to drive the oxi- dizer prehurner oxidizer valve (OPOV). The fuel preburner oxidizer valve (FPOV) is iisetl t o control tlie main combustion chamber mixture ratio. This coiitrol system a l l o w tlie SSME to he a tlirottleable rocket eiigiiie with an operating raiige between 6.3 and 111% o f rated power level (RPL). At 100% RPL, the SSME has a vaciiiiiii thrust of 470,000 111s and a chamber pressure of 3006 psia (ref. 12).
Ourrent Flight Hedlined Parameters
Reclliiies place perforiiiance bountlaries upon critical parameters which, when exceeded, result i n engine shutdown. 'I'he SSME has seven start confirm and five flight redlined paraiiicters (ref. 13) . Experience and engineering judgenient have IW.=II responsil>le for the redlined paraiiieters selected, the type and value of tlic I etllilic limits, and t lie iiiiplenietation of tlie redlines during flight aiid ground test firings. Soiiie of tlicsc redlines have hecii in place since the 1)egiiiiiiiig of SSME test- ing wliile otliers have I~een established in response to failures. The five flight redlined parameters, all of which monitor the high pressure turbopumps, are suniiiiarized in this section.
The high pressure fuel turbine (HPFT) discharge temperature has an upper limit redline set at 1960"R and is initiated at start +5.04 seconds. This limit was established to prevent turbine blade stress rupture due to the high temperatures experienced during operation. The liiiiit was based upon the iiiaxiiiiuiii tempera t tire that tlie blade could withstand at 1 0 % R P L with a 100"R margin of safety.
The High Pressure Oxidizer Turbine (HPOT) discharge temperature, has both ail upper limit retlline of l7GO"R aiid a lower limit redline of 720"R. The lower limit wits set to prevent icing conditions wliich could cause loss of the preburner oxidizer v a l v e cont 1-01. The upper redline was assigned to prevent degradation of the lieat exchanger based ~ i p o r i its life capabilities for teniperatures up t o 1860"R. Liiiiit inonito~iiig coriiiiiciices a t start +2.:3 set oiids for the upper liniit, aiid at start t 3.8 w-oiids for t lie lower limit .
Tlie high pressure fuel t urbopump (HPFTP) coolant liner pressure has an upper limit redliiie that varies with tlie operating power level; thus, it is a power- level specific redline. This varying redline was established to prevent bucltling of the HPFTP coolant liner wliicli would result i i i the restriction of the coolant flow; limit iiionitoriiig hegins at start t.5.04 seconds. The limit is based upon ground test (lata a n d provides a i i i in i I i iu i i i safety margin of 100 psi. This power-level specific redline limit is determined by the following linear function of main conihustion cliaiiiber ])ressIlrc, P,, (ref. 3 )
Redline Limit --= A. t i\ * P, + Limit. Tolerance,
wlierc tlie rioniiiial values for the coeflicicnts are A. : -97.3 psi and A I = 1.1583. ant1 the tolerancc~ l i i i i i t is 451 psi.
3
Tlie f i l ia l two redlined para.tiieters were estal~lislied i,o prevent, int.erfa.ciiig o f tlie hot, ga.s and liquid oxidizer in the high pressure oxidizer t,urbopump. A lower limit redline 170 psia was establislied for the iiit,eriiiediate seal purge pressure t,o tlt+riiiine excessive seal wea.r or loss of helium purge pressure. An upper liiiii t, of 100 psia was established for t,lie secondary turbine seal pressure to detect sea.] failure. Bot,li redliiies are activated at. engine start , and bot.11 are based on aiialyt,ical ~ i i~ ,de l s of experinient.a.l dat,a and nia,iiit,a,i~i a 10 psi safety iiia.rgin for the worst. case operat.ing condi t.ions.
Monitoring of the redlined paranietas involves a voting logic procedure among t lie redundaiit, sensor nieasurenient,s of a given paraiiieber in order to prevent a p r t m a t.ure sliut.tlowii due to a. failed sensor. Each qualified sensor cliaiinel of a i w l l i t i e c l j>a.raiiiet,er is monitored during every data collection cycle t,o determine if it. i s wit,liiii its liiiiit,s; l i i i i i t monit.oriiig is suspended if a channel has been disqualified. A sensor wliicli exceeds its limit, for three or more consecut,ive cycles represents a v0t.e for engine sliiit.down; a c o n ~ e i i ~ i i ~ of all qualified sensors for a given redlined p a r a me t,er resid t,s i ii engi 11 e shu t,dow 11.
SSME Fliglil. and Test Data The SShlE c1at.a. files a m divided i 1 i t . o t.wo separate data. types, CADS (Coin-
i i i a ~ i t l m t l 1ja.t.a. Siniula.tor) dat,a. a.11~1 fwility data. The CADS dat,a. set. cont,a.ins 1 1 1 ) to 125 cwgine pai~~iiiet,ers ant1 iiicl iitles t lie flight, redlined pa.raniet.ers. These pa,ra.iiiet.ers are ident.ified by paraiiiet.er itleiitification (PID ) iiuiiibers ranging froni 1 to 299. The CADS t,est stand c1a.t.a files 1ia.ve the same parametper set recorded in t,lie flight. tlat,a files for a given liistsorica.l t,iiiie period and all CADS data files, bot.11 flight. and best., a.re recorded at, a. ra.t.e of 2.5 sa.mples per second.
During SSME t.ests, additional digital data are recorded by t,he t*est stmalid fa,cili t,y systems. This facility dat,a include paraiiiet,ers from bob11 the engine and t.lie facility t.est. st.and t,hat, t,est, engineers consider necessary for t,he cont,rol and evaluat,ion of t.lie t,est.. These iiieasured paraiiieters are ident,ified by PID iiunibers ranging from 300 t,o 1999. The recording r a k for this type of d a h file varies from 50 t.o 60 samples per second, depending upon the test stand facility.
Both t.he CADS and facilit,y c1at.a files are available froiii t,he various test. st.and firings. ‘T’hese iiiclitde t,lie single engine firings at t,est, st,ands A l , A2 and B l loca.tec1 at NASA S1.ciinis Spa.ce Cent er (SS ’V) . test. stand A 3 locat,ed a.t. t.lie Rocketdyne faci1it.y i i i (‘aiioga. Park. C!a.liforiiia, a i i c l t lie hlaiii F‘ropiilsioii Test Ai. t . ic le (1.1 I’TA ) c - l l l s t c ~ l . firings perto1.111e(l at. SS(!. ‘ I ’ l i c ~ SSRlb: tcsl hc>d at N;\S:\ h l ; t~ . s l~ ; l l l Sl ) i \< ’ ( ’ Flight. (leiit,cr (PISF(!) i i . l S 0 prodiicf’s t l i t . t w o types of (lata tiles. 0 1 1 1 ~ tlic (‘:\I)S’ d a t a files a.rc itwiilahle fro111 SSb,lli: fliglit 5.
SSME Digit.a.1 Trarisient, Model
The c1igit.d t.ra.iisient, niodel (1)‘riIl) wliich is described i n reference 13 simii- 1a.tes bhe Spa.ce Shut,t le Mtiiii E~igirie’s performance cliara.ct,eristics 1.hrough st,a.rt., iiia.inst,a.ge cont.rol (sclieduled t.lirot.t.les) and shut.down. The input. describes a, noiii- ilia1 engine; source code and input changes a,re required 1.0 adequately siniu1a.t.e off-noniiiial engine behavior.
3
Tlie motlel is divided i1it.o t,lirec ilia jor su1~progra.nis: fuel, oxidizer, and hot, gas . ‘I’ l ic . siriiiiIa.t.ion iises t.lie siiiiple Kiilcr t.iiiie iiit.egrat.ioii sclienie; a. t.ypica.1 t.iiiie
s1.c.l) is .0002 seconds. The CADS parii.liiet.ers wliicli are currently siniulat,ed hy t,lie DTh.4 are given in ta.hle 1. Only t,wo flight, redlined parameters are siriiulat,ed 11y t lie comput,er iiiotlel, t.he HPOT and HPFT discharge temperat,ures. In addition, t,he dyriaiiiic response of t,liese t.empera.t,ure sensors is modeled by the DTM.
Tlie DThI has been run on bot,li a \;AX 8800 aiid an Anidalil 5560 t.0 insure t.liat, the iiiotlel did not, exhibit machine specific behavior; no significant difference was observed in t,lie resu1t.s. A startup siniula.t.ion of 5 seconds requires approximately 9 niiiiut.es of CPIT t.iiiie 011 t.lie VAX 8800 aiid 4 iiiiiiut,es of CPtJ t h e on t,lie Aiiidalil 5860.
The D T M wa.s obt,airied t,lirougli permission of the program office at, N A S A Rlarshall Spa.ce Flight. Cent.er. The iiiotlel used in this invest,igation was current. a.s o f Sept.e111l,er, 1988.
Results and Discussion
Simula tioii Results
Tlie DTM contains liead and torque multipliers which can be varied to adjust t lie t ur1)oiiiacliinery efficiencies and thus to simulate changes in high pressure tur- h>puiiip operation. Calculations were perforiiied using an SSME performance code and engine test data to establish a range for these iiiultipliers which represent one standard deviation from tlie test data (ref. 15). The ranges are given in table 2. A low performing HPOTP, for example, is characterized by reduced efficiencies for the oxidizer t whine, oxidizer pump, and prebtirrier boost puiiip.
Nine t urhopiinip coiiibitiatioiis w c w considered in this st utly; t lie cases are described in table 3. For each case, the engine was throttled froiii 100% R P L to 65% R P L arid froiii 65% R P L to 104% RPL; this is typical of ail SSME tiiissiori profile (see figrire 2) . Tlie tluratioii of a steady state interval of tlie simulation was shortened in coniparisoii to the corresponding flight interval in order to coiiserve coniputer resources; a given power level was simulated long enough to deiiionst rate that steady st ate performance had beeii achieved.
AI t liougli all of the parameters in table 1 were siniulated, several were disiiiissed froni further consideration for power-level specific redlines for a variety of reasons. The fiiel and oxidizer flowrates, the calciilatecl mixture ratio. a n d tlie & I ( ’ ( ‘ i iijcclor end pressure are involved in the c I o s ( ~ ~ I loop control of the engine‘s t Iirtist an( l iiiixt tire rat io and were riot considered for flirt her iiionitoriiig hy power-le\ el specific redlines i n th i s iiivestigatioii. Tlie siiiiiilated h1C‘c’ coolant discharge teiiiperatiirc and the HPFI’ in lv t teiiiperatiire exhi1)itecl almost no response t o either tiirhopiiiiil) etficiency variations o r the power Icl-cl cliariges; therefore, these parameters were also not coiisitleretl. V i i ~ a l l y , The main tiicl l-alvc ( h I F V ) , m a i n oxidizer valve ( h 1 0 1 ’ ) i l i i c l coolant control valve (CC’V) posit ions are sclietluletl parameters aiitl a r e not affected I)y t lie vaI.yiiig turl>opuii i l ) efficicwcies. Tlie behavior o f the 17 reiiiaiiiiiig p : ~ r i ~ ~ i i ~ t e r ~ is show11 i n figtires 3- 1:).

Several general coiiiiiieiits regardiiig t lie figures are i l l order. During no~ninal I)erforniance tlie engine is restricted t o a niaxiniuni power level change of lO%/sec. This is reflected in tlie 3.5 seconds required for each parameter to transition from its 100% R P L value to its 6.5% RF‘I, value. Likewise, tlie throttle up t o 104% R P L requires approxiiiiately 3.9 seconds. As sliowri in t lie figures, the siiiiulated t railsitions are relatively smooth.
Furt liermore, the figures show tliat variations in tlie high pressure turbop- i i i i i p efficiency result in shifts of each paranieter’s perforriiaiice from its noiiiinal perforniance. These shifts, with a few exceptions, were consistent tlirougliout the steady-state and transient regions thus allowiiig tlie parameter responses to be ana- lyzed qiialit at ively. A paranieter’s response above, below or unchanged with respect to its ~ ioui i~ ia l perforniance in case 1 w a s assigned the qualitative values (+), (-) or ( O ) , respectively. Two types of qualitative trends can be defined. A direct or a i l inverse qualitative treiicl between t w o parameters indicates that tlie qualitative \allies for hot Ii parameters change in a siiiiilar or opposite nianner, respectively. A qiialitative suiiiniary of cases 2, 3, 5 and 6, wliere only one high pressure turbop- i i i i11) efficiency was varied froiii tlie nonilrial operating case, is given in table 4. The otlier cases were not included in this t al)le hecause their qualitative trends may be csf 1 apolatecl froni the cases considered. For example, a parameter wliicli exhibits a11 inverted qiialitative trend with respect to changes in the HPOTP efficiency at, iioiiiirial HPFTP efficiency, also exhibits the saiiie qualitative trend for changes in t lie FIPOTP efficiency at low or high HPFTP efficiency.
The prehurner cliatiiher pressures (figures 3 and 4) display an inverse qualitative trend with efficiency changes of both high pressure turbopumps. This demonstrates the erigiiie’s inherent ability t o stabilize itself from uncontrollable oscillations, due to sriiall changes within the system. Both the fuel and oxidizer preburner chaniber 1)ressures are cotisistent with tlie behavior of their respective oxidizer control valves; the FPOV and OPOV responses are shown in figures 5 and 6. As additional oxidizer is slipplied to the fuel-rich prehurner mixtures, more coiiibustion takes place and the conibustion cliamber pressure increases. Both oxidizer control valves respond with ail inverse qualitative trend to changes in their respective high pressure turbopump efficiencies. The iiiaxiniuiii deviations for both valve responses are approximat.ely q i i a l . The FPOV response, however. varies inversely with respect to the HPOTP efTicicncy wliile tlic OPOV position varivs directly with respect to the HPFTP e f f i c i e 11 cy.
17igiires i’ a n d S show that t l i t - Iiigli I)rc‘siirc turhiiie t l isc Iiargc teiiil’erat iin-
tlisi)lay itii inverse cliialit at ivc t rent1 wit 1 1 chaiiges in their wspect i \ e t i i r I ) o l ) ~ i i i i l ) V I - ticiciicies. Since a i i i o r e eflicieiit t i l l l > i i i t > IS able to est ract i i i o i ~ ’ iiieclianical e1ic.i.g~ I r o t i i t he working f l r i ic l . a decrease i n (Ii\(.liarge teiiipm-atiire is oI>ser\-ed. i\iiot Iici.
f a c t o r affecting t hc turl)iiie tlischarge teiii1wriitiire is the pwbi i i ’ i i er c1iaiiil)er I)IT>- sure; since t lie t iirl)iiie inlet flows exit 1 1 o i i i tlie prehiiriiers. ‘The iiiaximuiii devia- t ions froin the Iioiiiiiial case a re ol)sei.\ et1 for t lie high-low eflicieiicy coiiiliiiations.
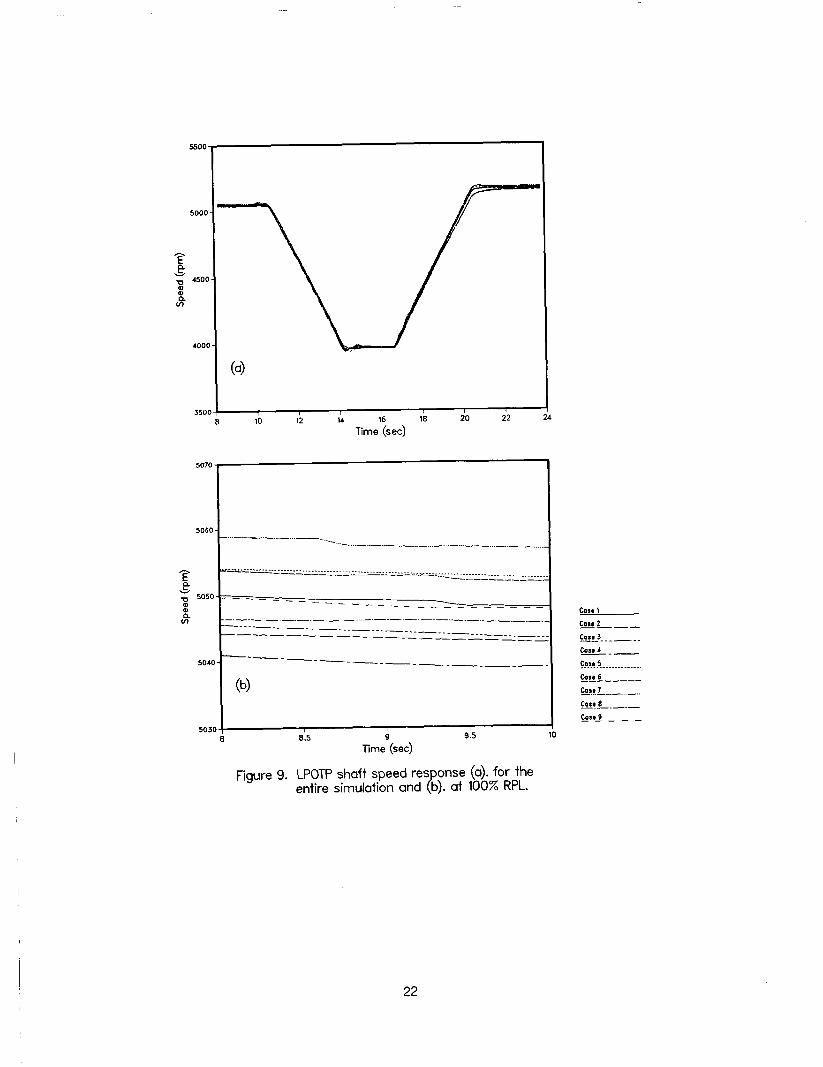
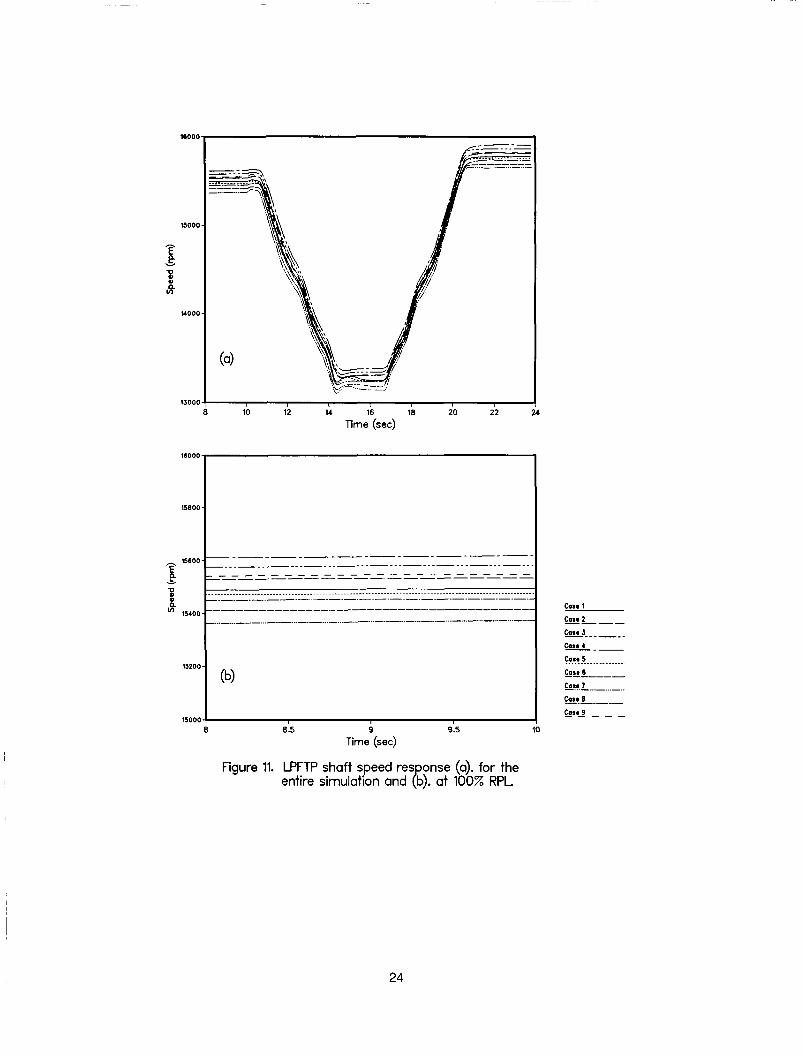
Figures 9-12 show the heliavior of‘ 1 lir. available low pressure t urbopuniy parani- ct ers. Both the low pressure oxidizer t rirpopump shaft speed and puiiip discharge
6

pressure display a direct qualitative response to the changes in turlxqminp effi- ciencies, while inverse qualitative responses are observed for the low pressure fuel t i i r l )opu i i ip shaft speed and punip discharge pressure. Tlie deviations in the re- \I)orise of t lie 1,l’O‘T’P paraiiieters a r e a factor of three sinallcr t Iiilli the eqiiivalent 1, PF‘I‘P paraiiieters; high pressure turl)opump performance changes appear to be reflected more by the LPFTP than the LPOTP.
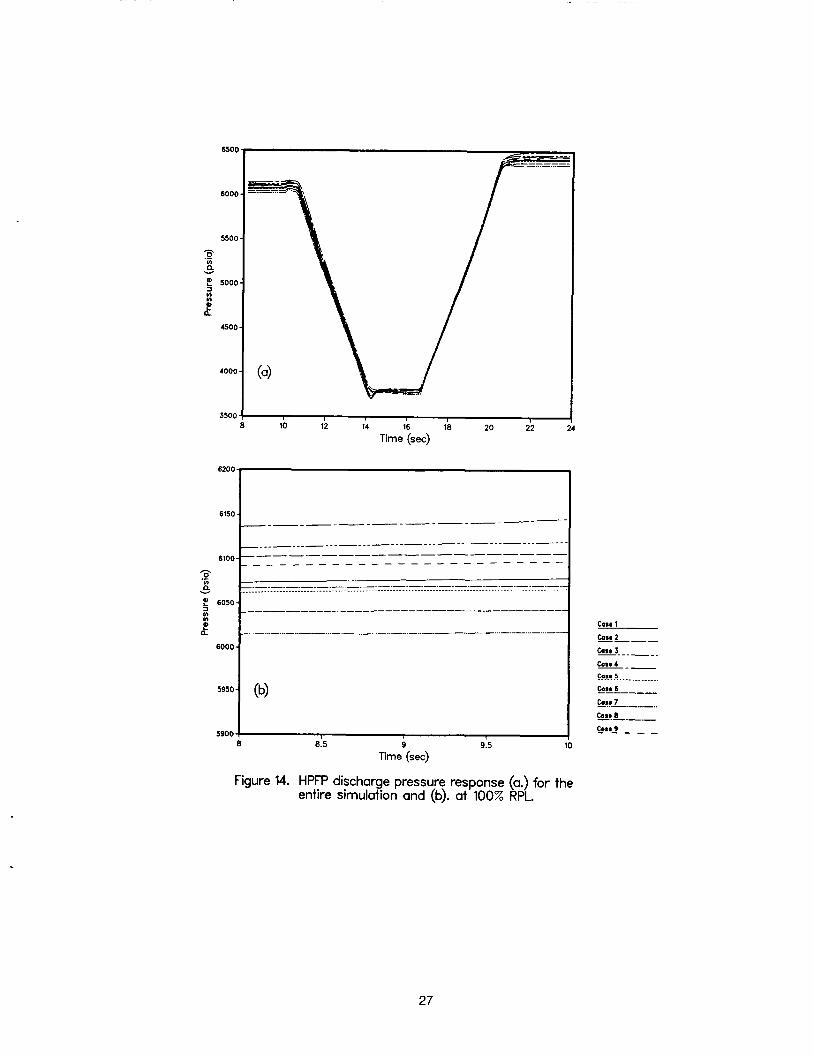
The responses of the HPFTP parameters to changes in turbopump performance are sliowi in figures 13 and 14. The shaft speed and pump discharge pressure show inverse qualitative responses t o changes in HPFTP and HPOTP efficiencies. A l t Iiough these trends may appear contradictory, they are consistent- with variations i i i fuel preburner cliaiiiber pressure. As t lie cliaiiiber pressure increases, t lie shaft speed and piiiiip discharge pressure also illcrease. Tlie HPFTP shaft speed responds ~ i iore to changes i n HPFTP efficiency while the HPFP discharge pressure responses ill.? evenly tlistriliutetl for the tiine test cases.
‘I’he siniiila tetl responses of the HPOTP performance parameters are shown in figiires 15- 17. The HPOP discharge pressure shifts display direct qualitative trends wi th respect to HPF’I’P efficiency cliaiiges and relatively siiiall inverted qualitative trends for t he H J’OTP efficiency cliang~s. For the PBP discharge pressure, a direct qualitative trend wit 11 efficiency variations for Imth high pressure turbopumps is ob- served, while the PBP discharge temperature’s qualitative response varies inversely wi th the HPOTP and directly with HPFTP efficiency changes. The PBP discharge teniperattire experiences larger variations due to changes in HPOTP than HPFTP performance.
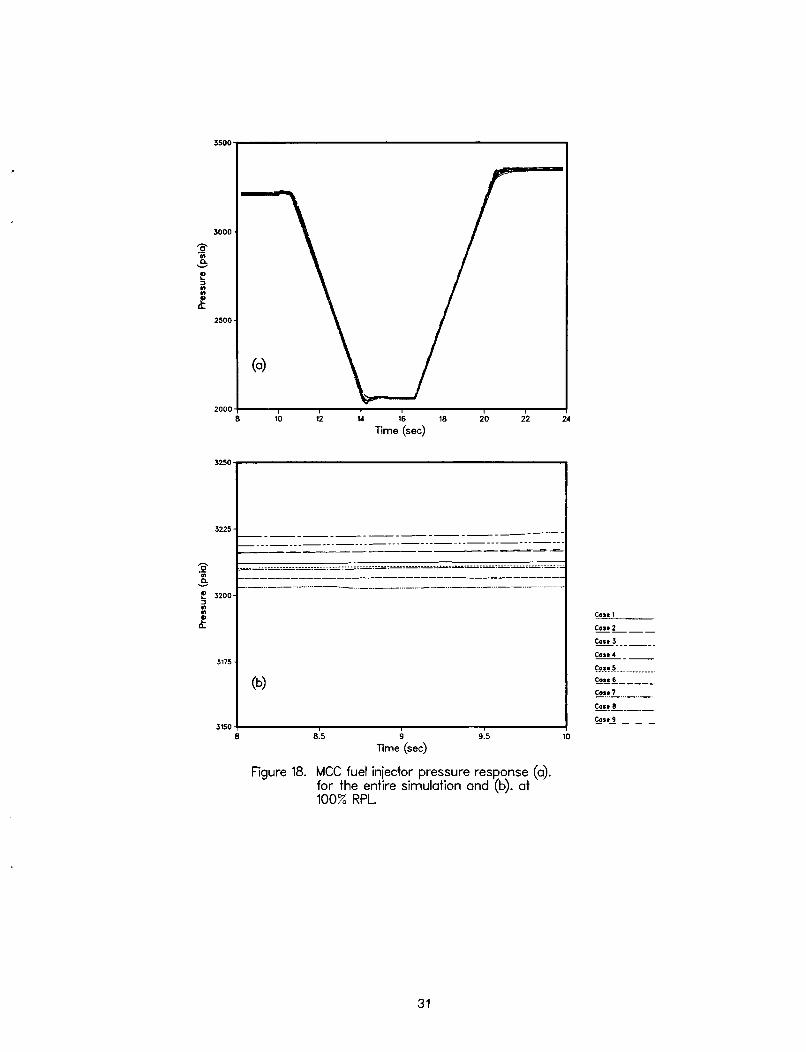
Figures 18 and 19 show the responses of the MCC fuel iiijector pressure and A I C‘CI coolant discharge pressure to the nine turbopump efficiency combinations. Bot 11 paranieters display inverse qualitative responses to changes in both high pres- sure turbopunip efficiencies. The response of the coolant discharge pressure is di- rectly related to the HPFP discharge pressure since the HPFP supplies the coolant to all of the cooliiig circuits. The MCC’ fiiel or hot-gas injector pressure is dependent priiiiarily upon the performance of bot Ii preburners.
The operat ion o f the SSME is coiiiplex and the interdependency of tlie various conipoiierit s is extensive. Thus, a coiiiplete explanation of the engine‘s responses caiii iot I)e cxtractcd from t l i c plots. ‘J’lit. trends displayed hy tlic siiiiulated re.;uIts iiic quiil i t a t ive ly coiisisteiit with t l i c 1,cliavior of tlie ciigint).
Paraiiieter Selection
In order to select new paranieters for power-level specific redlines, 1 lie seiisi- t ivity o f tliost paranieters to system changes was examined. The high pressure t urhoptiinps were selected as the systeiii variables for two reasons. First, tlie Iiigli pre~. ;ure t urhopiiiiips are LKTrs wliicli cxliihit performance variability. Second, t lie test history of the engine and failure analysis reports indicate t h a t the high pressure t iirl)opiinips are coiiiponents wliich deserve a liigli priority in SSME health iiioni- toring efforts. Forty- five test firings of the SSME have been classified as failures,
7

arid 27 have had sufficient severity to be labelled as major failures. Breakdowns iJy coniponent of the two failure classifications are given in figures 20 and 21; the high pressure turbopump assemblies have been responsible for more failures than any other components.
There are two issues regarding the implementation of tlie power-level specific rerlliries. First, the ideal power specific redline would monitor a parameter through transient. as well as steady state regions of performance. At scheduled intervals during the power-level bransition, the sensor value would be compared to the per- missible operat,ing range at that instant,aneous power-level. Sensor noise, sensor lag t,inies and difficulties in modeling the t,ransient behavior of the engine are all fat,- tors which contribute to the complexit,y of the problem. As a first. step, therefore, t,his investigation focused on monitoring the steady statme behavior of the engine. Tlie objective of t,his health monitoring effort was to recommend parameters for new power-level specif:c redlines. However, since power level specific parameters on facility data would preclude future implementation in flight, it was concluded that, the siiiiulat,ed parameters should also be available on CADS data tapes.
Two crit,eria were established in determining which of the 17 previously se- lect.ed paranieters were mcst promising for new power-level specific redlines. The first. criterion involves a no~malizat~ion which allows comparisons betweeii parame- ters of different, iiiagnit,udes and dimensions. The maximum parameter deviation due to the simulated efficienc,y variations, over a 1.5 second steady state interval at 100% R.PL was calculated for each parameter. Tliis deviation was then compared to tlie variation of that parameter during a nominal simulated transition from 100% R P L to 65% R.PL. Thk ratio of the two parameters should be relatively small for a power specific redline to be feasible. The HPFT discharge temperature, for exani- ple, exhibits a larger variation at 100% RPL than during the transition from 100% R.PL to 65% R.PL; thus, the current overall redline may be more appropriate than a power-level specific redline for this parameter. This 9 case simulation has demon- st,rated a possible nominal operation envelope of the SSME for each parameter. A relatively tight, envelope would show t,lie parameter’s invariance to accept,able con- ditions for SSME operat.ion. In figure 22, two nornialized parameters, one having a tight envelope, parameter A , and the ot,her having a wider envelope, parameter B, are presented to visually demonstrate t.his feature. Table 5a presents the results of t,liis a idys is . Orily t,hose parameters having a ratio of 0.5 or less were chosen for furt.lier considerttt,ion. By establishing t,he cut.off rat,io level a.t, 0.5, oiily t.liose pa- raniet.ers with re1lat.ively t.ight. opera.ting envelopes were select,ed. This should a.llow for more dist,inct. power-level specific redlines t.0 he est.ablislied, t.lierebg providing a more effective nioiiit.oring of t.liese redlines t.lirough a t.ransient.
Tlie second criterion involves a noise to signa.1 comparison of t,he parameters. The sensor noise deviation ab 100% R P L was compared t.0 t.lie variat,ioii of the ya.ranieter during a. simulated nominal t.ra.nsit,ion from 100% RPL t,o 65% RPL. The maximuni sensor devia.t,ion was coiiipubed from a. 30 second segment. of a typical SSME test firing at, 100% RPL. A low signal noise relat,ive to the siniula.t,ed signal range is desired so that the sensor’s noise will not force the bandwidth of the power
8

sl’ccific retllirie t o he too broad. The seiisor deviations and ratios are given ill table Y)b. Only paranieters having a ratio of 0.1 or less were cliosen for power-level specific re tlli ne candidates.
Application of these two criteria resulted in the selection of nine parameters for further investigation as power-level specific redlines: PBP discharge tempera- t lire. MC‘C’ coolant discharge pressure, MCC fuel injector pressure, HPFP discharge pressure, FPB chamber pressure, HPOP discharge pressure, OPB chamber pressure, PBF’ discharge pressure, and LPOTP shaft speed. These parameters are feasible as power specific redlines because they denionstrated resistance to the iiiiposed system variations arid sinal1 signal noise deviations. Of the nine recoinmetided parameters, seven are associa tetl with engine component pressure, one is the LPOTP shaft. speed a i i d the n i n t h is the PBP discharge teinperature.
C o n c 1 ti d i ng R e marks
The focus of this investigation was to develop a list of promising parameters for new power-level specific redlines. Through computer simulations, responses of several parameters to clianges in high pressure t urbopunip efficiency were aiialyzed ant1 coinpared. Each paranieter’s siiiiulated variation and signal deviation at a given power level were iioriiialized so tliat tlie characteristics of tlie various parameters co11It1 be conipared. The nine selected paranieters displayed an invariaiice to sim- ulated clianges in engine performance arid a low signal noise relative tjo tlie otlier parameters. These features allow closer and more distinct redlines, which may de- tect a failure earlier than the current retllirie system. They also facilitate a possible application of tlie redlines through tlie transient regime. The selected parameters include PBP discharge temperature, MC‘(’ coolant discharge pressure, MCC‘ fiiel i r i -
jector pressure, HPFP discharge pressure, FPB chanilier pressure, I-IPOP discliarge pressiire, OPB chaiiiher pressure, PH P tliscliarge pressure, a n d LPOTP shaft spectl.
Thc paraiiietcrs listed above will Iic further analyzed and tested so tliat spe- cific values call lie imposed as power-level specific redlines during tlie steady state operation of the engine. The proposed redlines must then be tested against previ- 011s engine firings to establish their ability to detect, engine failure earlier than the current detection system without introducing false alarms. The issue of iiiiposing power-level specific redlines during the scheduled transients must also be addressed. Exteiisive analysis of engine data is requiiwl t o deteriiiine the feasibility o f s1ic-h ail
eiitleavor. Iiiil~lemeiitation of 1)ower-lel-el specific redlines during t raiisient s will also require a good understanding o f the tlyiiaiiiic response of the seiisoi’s.
9

R e f e r e n c e s
1 . Cikanck, H. A., Characteristics of Space Shuttle Main Engine Failures. AIAA Paper 87-1 939, June 1987.
2 . Norman, A. and Taniguchi, M., Dcvclopment of an Advanced Failure Dctcction Algorithm for the SSME. A I A A Paper 88-3408, July 1988.
3 . Taniguchi, M. H., Failure Control Techniques f o r the SSME, Contract NAS8- 3605, Phase I Final Report. RIIRD86-165, Rockwcll International/ Rockctdyne Division, 1986.
4. Taniguchi, M. H., Failure Control Techniques f o r the SSME, Contract NAS8- 3605, Phase I1 Final Report. RI/RD87- 198, Rockwell International/ Rockctdyne Division, 1987.
5 . Gass, F. D.; Alcock, J. F.; and Flickinger, S. A., Space Shuttle Main Engine - Altcrnatc Turbopump Dcvelopment (SSME-ATD) Health Monitoring Program. A l A A 88-3411, July 1988.
6 . Nguycn, K. D.; Cole, D. H.; Perry, J.; and Norman, A., An Integrated Laboratory Test Bed for Rockct Engine Health Monitoring Expcrimcntation. AIAA 88-3240, July 1988.
7. Cikanck, H. A.; ct al., Space Shuttle Main Engine Plumc Spectral Monitoring Prcliniinary Rcsults. A l A A Puper 87-1782, June 1987.
8. Powcrs, W. T.; ct al., Plumc Spcclrometry for Liquid Rocket Engine Health Monitoring. In AGARD CPP No. 448 , Engine Condition Monitoring -
Technology and Experience, May 1988.
9 . Glovcr, R. C.; Kcllcy, B. A.; and Tischer, A. E., Studies and Analyses Space Shuttle Main Engine, Contruct NASw-3737. Battelle, Columbus Division, April 1987.
of the BCD-SSME-TR-67- 1,
10. Failure Modes and Effects Analysis and Critical Items List, Final Report. MMC-ET-SEO5- 18 1 , Martin Marietta Denver Aerospace, September 1987.
1 1 . Space Shuttle Main Engine Failure Modes and Effects Analysis and Cri t i ca l Items List. RSS-8553- 1 1 and RSS-8740-11, Rockwell International/ Rockctdync Division, July 1988.
12. S S M E Orientution (Part A-Engine). Course No. ME-1 10(A)RIR, Rockwell Intcrnational/Rockctdync Division, August 1988.
13. Roth, P., Cornputcr Program Contruct End Item, Flight 4C Configuration, S S M E Cnntrollcr- Operational Progrnm, Parts I and 11. Rcvision F, Rockwell International/ Rocketdyne Division, November 1988.
CP406RO001,
14. Nguycn, D. G., Specificution: Enginci Balance and Dynamic Model. RI,OOOO I , Rockwcll Inlcrnaiional/Rockctdyne Division. May 198 1

15. Nelson, R. A., Rocketdyne Division/Rockwell International, private communication, February 1989.
Table 1. CADS Parameters Which Are Simulated by the DTM
CADS / DTM PARAMETERS
Flowrate fuel flowrate LOX flowrate calculated mixture ratio
I3mLuam HPFT discharge temperature HPOT discharge temperature preburner boost pump discharge temperature MCC coolant discharge temperature HPFP inlet temperature (LPFP discharge temperature)
Pressure MCC injector end pressure MCC hot gas injector pressure MCC coolant discharge pressure LPFP discharge pressure (HPFP inlet pressure) HPFP discharge pressure HPOP inlet pressure (LPOP discharge pressure) HPOP discharge pressure preburner boost pump discharge pressure fuel preburner chamber pressure oxidizer preburner chamber pressure
Speed LPOTP shaft speed LPFTP shaft speed HPFP shaft speed
Valve Position FPOV actuator position OPOV actuator position MFV actuator position MOV actuator position CCV actuator position

Table 2. Eflciency variation representing one standard deviation from the current DTM values for the High Pressure Turbopump Components
Component
High Pressure Fuel Turbine
High Pressure Oxidizer Turbine High Pressure Oxidizer Pump Preburner Pump
High Pressure Fuel Pump
Efficiency Variation
-2.2% to +2.2% -2.6% to +2.7% -2.8% to +2.8% -1.2% to +1.2% -8.2% to +9.0%
Table 3. High pressure turbopunip efficiencies for each simulated test case
Case
1 2 3 4 5 6 7 a 9
HPOTP HPFTP
Nominal Nominal Low Performing Nominal Nominal Low Performing Low Perforning Low Performing High Perfomling Nominal Nominal High Performing High Performing High Performing Low Performing High Performing High Performing Low Performing

Table 4. Qualitative performance of the DTM simulation
Parameter
-
Engine Fuel Flowrate Engine Oxidizer Flowrate LPFTP Shaft Speed LPOTP Shaft Speed LPFP Discharge Pressure LPOP Discharge Pressure HPFTP Shaft Speed HPFP Discharge Pressure HPOP Discharge Pressure PBP Discharge Pressure PBP Discharge Temperature M C1 C Coolant Discharge Pressure FPB Clhaniber Pressure OPB Chamber Pressure MCC Injector End Pressure MCC Fuel Iiijector Pressure HPFT Discharge Temperature HPOT Discharge Temperature OPOV Position FPOV Position
Qualitative Response
Case 3
0 0 - -
+ + + -
- -
- + + + 0 + + - -
+
Case 5 Case 2 I 0 0 + + + +
-
-
- -
+ + + + 0 + + + +
-
(- ) indicates a qualitative decrease froni Case 1 performance ( + ) indicates a qualit,ative increase from Case 1 performance (0 ) indicates no qualitative change from Case 1 performance
13

~ ~
Table 5a. Parameter response characteristics to simulated conditions
Parameter
HPOP Discharge Pressure MCC Fuel Injector Pressure LPOTP Shaft Speed MCC Coolant Discharge Pressure HPFP Discharge Pressure LPOP Discharge Pressure FPB Chamber Pressure OPB Chamber Pressure IIPFTP Shaft Speed LPFTP Shaft Speed PBP Discharge Pressure LPFP Discharge Pressure PBP Discharge Temperature FPOV Position OPOV Position HPOT Discharge Temperature H P F T Discharge Temper at u re
~
Nominal Range
100% * 65% APnom
1665.11 1149.82 1076.72 1662.03 2283.06 80.66
2012.03 2094.18 7536.17 2217.28 2933.16 55.83 16.29 8.92 9.74
303.35 1.56.93
Maximum Deviation
@loo% APQlOO%
17.58 19.68 19.88 65.89 126.73 4.95
133.79 164.12 602.40 253.80 409.12 10.59 6.82 6.84 8.82
351.60 191.83
0.0106 0.0171 0.0185 0.0396 0.0555 0.0613 0.0665 0.0784 0.0799 0.1145 0.1395 0.1897 0.4189 0.7667 0.9051 1.1591 1.2224
Table 5b. Parameter signal noise compared to transition response
Parameter
PBP Discharge Temperature MCC Coolant Discharge Pressure MCC Fuel Injector Pressure HPFP Discharge Pressure FPB Chamber Pressure HPOP Discharge Pressure OPB Chamber Pressure PBP Discharge Pressure LPOTP Shaft Speed LPOP Discharge Pressure LPFTP Shaft Speed LPFP Discharge Pressure HPFTP Shaft Speed
Nominal Range
100% * 65% APnom
16.29 1662.03 1149.82 2283.06 2012.03 1665.1 1 2094.18 2933.16 1076.72 80.66
2217.28 55.83
7536.17
Signal Noise
@loo% ASOlOO%
0.058 44.57 38.18 80.49 74.79 74.22 89.25 121.48 80.98 10.26
387.60 8.27
2463.40
0.0036 0.0268 0.0332 0.0353 0.0370 0.0400 0.0430 0.0550 0.0750 0.1300 0.1700 0.2260 0.3300
14
I

FLOWMETER
OXIDIZER
CCV = COOLANT CONTROL VALVE FPB = FUEL PREBURNER FPOV = FUEL PREBURNER OXIDIZER VALVE HPFP = HIGH PRESSURE FUEL PUMP HPFT = HIGH PRESSURE FUEL TURBINE HPOP = HIGH PRESSURE OXIDIZER PUMP HPOT = HIGH PRESSURE OXIDIZER TURBINE LPFP = LOW PRESSURE FUEL PUMP LPFT = LOW PRESSURE FUEL TURBINE LPOP = LOW PRESSURE OXIDIZER PUPP LPOT = LOW PRESSURE OXIDIZER TURBINE
W V = MAIN FUEL VALVE ROV = M I N OXIDIZER VALVE OPB = OXIDIZER PREBURNER OPOV = OXIDIZER PREBURNER OXIDIZER VALVE PBP = PREBURNER BOOST PUMP
HCC = RAIN COMBUSTION CHAMBER
Figure 1. - Space Shuttle Main Engine Schematic.
105
100
C .- - p 80
75
70
9 z
65
60
Time (sec)
Figure 2. - Typical Space Shuttle Main Engine 104% Mission.
15

5500
so00
4500 h
Lo v
.- a
4000 Y)
e, a 3500
3000
2500
5100
5000
h
Lo .- a v
f 4900 Lo
g
4800
4700
, I 1
10 12 14 16 18 20 22
Time (sec)
I I 8.5 9 9.5
Time (sec)
Figure 3. Fuel preburner chamber pressure response (a). for the entire simulation and (b). at 100% RPL.
16

5500
5000
300C
2500
5200
5100
h .- B v
e 5000 n
g
4900
4800
, I 1 10 12 14 16 18 20 22
Time (see)
1
8.5 9 9.5
Time (sec)
Figure 4. Oxidizer preburner chamber pressure response (a). for the entire simulation and (b). at 100% RPL.
17

85
80
n C 0) Q 0 w
75 C 0 ;t v)
.- 2
70
65
85
80
n c a, Q 0 E
75 C 0 c In .- 2
70
65
/-7\
3 I
0 10 12 14 16 18 20 22 Time (sec)
I
8.5 9 9.5 Time (sec)
Figure 5. Fuel preburner oxidizer valve position response (a). for the entire simulation and (b). at 100% RPL.
18

75
70
A C
0 65
R W
C 0 .-
6C
B
55
5c
70
65 a Q 0 R W
C 0 c ln 2 60
.-
55
I r I 1 10 12 14 16 18 20 22
Time (sec)
I 1 8.5 9 9.5
Time (sec)
Figure 6. Oxidizer preburner oxidizer valve position response (a). for the entire simulation and (b). at 100% RPL.
19

n00
1600
1501
1201
1650.
1550 h
v E
1450
1350
_ _ - - c -
I I 1 I 10 12 14 16 18 20 22
Time (sec)
.................................. .................................... ................................
8.5 9 9.5
Time (sec)
I
Figure 7. HPFT discharge temperature response (a). for the entire simulation and (b). at 100% RPL.
20

1600
1400
h
v E
e e 1200
e
c
0
i?
1000
800
1600
1500
h
1400 e +
E
1200
1100
I I ~~~ , I
10 12 14 16 18 20 22 Time (sec)
- - - - - - - - - - - - - - - - - - _ _ - (b) - - -
~ ~~
8.5 ; 9.5 Time (sec)
i
Figure 8. HPOT discharge temperature response (a). for the entire simulation and (b). at 100% RPL.
21
5500
5000
4001
350
5070
5060
t. 50%
P)
e m
5041
503
1 I I I 12 14 16 18 20 22 10
Time (sec)
9 9.5 10
Time (sec)
Figure 9. LPOTP shaft speed res onse (a). for the entire simulation and 6). at 100% RPL.
22

u o
420
400 h .- 67 Q v
f 380 67 67
360 c f
340
320
415
41C h 0 m Q W
.-
E
E 3 m m
a 405
40C
1 I 1 1
10 12 14 16 18 20 22 Time (sec)
I , 8.5 9 9.5
Time (sec)
Figure 10. LPOP discharge pressure res onse (a). for the entire simulation and (bf at 100% RPL
23
moo0
15000
uooo
13000
16000
15800
.5
n B
l5400
1520C
1500C
1 , 1 - 1 - - 1 -
10 12 14 16 18 20 22
Time (sec)
s:5 9 9:5
Time (sec)
Figure 11. LPFTP shaft speed res onse (a). for the entire simulation and 6). at 100% RPL
24

320
300
h .; 280 a v
v) v)
260
240
220
310
305
300 h 0 v) Q
W
.-
f! 295 I? v)
P L 290
2ao
I I I
10 12 14 16 18 20 22 Time (sec)
I
8.5 9 9.5 Time (sec)
Figure 12. LPFP discharge pressure response (a). for the entire simulation and (b). at 100% RPL.
25

36000
34000
32000
f t. v
39000
28000
16000 I I I 1 I
10 12 14 16 18 20 22 Time (sec)
33800
33700
33600 I 1
8 8.5 9 9.5 Time (sec)
Figure 13. HPFTP shaft speed res onse (a). for the entire simulation and 6). at 100% RPL.
26
650C
6000
5500
g 5000 M
f 4500
4000
3500
6200
6150
6100
h
M Q v
.-
6050 v)
6000
f
5950
5900
I I
10 12 14 16 18 20 22 Time (sec)
1
8.5 9 9.5 Time (sec)
Figure 14. HPFP discharge pressure response (a.) for the entire simulation and (b). at 100% RPL.
27

4000
h .E 5500 a
e 2
v
h 300C
25oc
200c
4130
4125
4120
h - B v
4115 v)
4110
4105
4100
I I I 10 12 14 16 18 2 0 22
Time (sec)
8.5 9 9.5 Time (sec)
Figure 15. HPOP discharge pressure response (a). for the entire simulation and (b). at 100% RPL.
28

8000
7000
h - a v
f 6000
n n
h"
5000
400C
7400
7300
7200
h .- "a 7100 v
?! v) E 7000
6900
680C
670C
I,--=_ ~ - - _ _
, I 10 12 14 16 18 20 22
Time (sec)
I I 8.5 9 9.5
Time (sec)
Figure 16. Preburner boost pump discharge pressure response (a). for the entire simulation and (b). at 100% RPL.
29

215
210
205 E. f! e 200
P
3
9)
4-
E 195
190
185
210
208
n E. e 3
9)
c 206
E 8
204
20i
1 I 10 12 14 16 18 20 22
Time (sec) 1
9 Time (sec)
9.5 10
Figure 17. Preburner boost pump discharge temperature response (a). for the entire simulation and (b). at 100% RPL.
30
3500
3000
e M
g, 2500
2000
3250
h
M .- a v
g 3200 2 H
3175
3150
10 12 14 16 18 20 22 Time (sec)
I I , 8.5 9 9.5
Time (sec)
Figure 18. MCC fuel injector pressure response (a). for the entire simulation and (b). at 100% RPL.
31

4500
e n
2 3500
5000
2500
4700
4650
e 4600 3 v)
n. e
4550
4500
I
10 12 14 16 18 20 22
Time (sec)
1
8.5 9 9.5 Time (sec)
Figure 19. MCC coolant discharge pressure res onse (a). for the entire simulation and (bf at 100% RPL.
32

L
PREBURNERS AND RCC
CONTROL
VALVE
HPOTP
HPFTP 14
0 2 4 6 8 10 12 14 Number of Failures
Figure 20. - SSME Test Failures Versus Failed Component.
DUCTS
PREBURNERS AND RCC 8
CONTROL
VALVE
HPOTP
HPFTP
I 1 0 1 2 3 4 5 6 7 8
Number of Major Failures
Figure 21. - SSME Major Test Failures Versus Failed Component.
33

Paramder A Pammetw B
Figure 22. Example response envelopes for arbitrary parameters through the same power level transient.
34

National Aeronautics and Space Administration
7. Key Words (Suggested by Author@))
Space Shuttle Main Engine (SSME) Safety monitoring Rocket engine ’
Diagnostics
Report Documentation Page
18. Distribution Statement
Unclassified - Unlimited Subject Category 15
2. Government Accession No. NASA CR-185121 AIAA-89-24 13
1. Report No.
9. Security Classif. (of this report)
Unclassified
4. Title and Subtitle
The Development of Power Specific Redlines for SSME Safety Monitoring
20. Security Classif. (of this page) 21. No of pages 22. Price’
Unclassified
7. Author@)
William A. Maul and Claudia M. Bosch
9. Performing Organization Name and Address
Sverdrup Technology, Inc. NASA Lewis Research Center Group Cleveland, Ohio 44135
12. Sponsoring Agency Name and Address
National Aeronautics and Space Administration Lewis Research Center Cleveland, Ohio 44135-3191
3. Recipient’s Catalog No.
5. Report Date
June 1989
6. Performing Organization Code
8. Performing Organization Report No.
None (E-4949)
10. Work Unit No.
553- 13-00
11. Contract or Grant No.
NAS3-25266
13. Type of Report and Period Covered Contractor Report Final
14. Sponsoring Agency Code
15. Supplementary Notes
Project Manager, Larry P. Cooper, Space Propulsion Technology Division, NASA Lewis Research Center. Prepared for the 25th Joint Propulsion Conference cosponsored by the AIAA, ASME, SAE, and ASEE, Monterey, California, July 10-12, 1989.
16. Abstract
Over the past several years, there has been an increased awareness in the necessity for rocket engine health monitoring because of the cost and complexity of present and future systems. A current rocket engine system, the Space Shuttle Main Engine (SSME), combines a limited redline system with closed-loop control of the engine’s thrust level and mixture ratio. Despite these features, 27 tests of the SSME have resulted in major incidents. In this investigation, an SSME transient model was used to examine the effect of variations in high pressure turbo- pump performance on various engine parameters. Based on analysis of the responses, several new parameters are proposed for further investigation as power-level specific redlines.
.
’For sale by the National Technical Information Service, Springfield, Virginia 221 61 NASA FORM 1626 OCT 86