the differential valuation of women’s work: a new … differential valuation of women’s work: a...
TRANSCRIPT

The Differential Valuation of Women’s Work: A New Look at the Gender Gap in Lawyers’ Incomes
Ronit Dinovitzer, University of Toronto and American Bar FoundationNancy Reichman, University of DenverJoyce Sterling, University of Denver
This article seeks to identify the mechanisms underlying the gender wage gap among new lawyers. Relying on nationally representative data to examine the salaries of lawyers working fulltime in private practice, we find a gender gap of about 5 per-cent. Identifying four mechanisms – work profiles, opportunity paths and structures, credentials, and legal markets – we first estimate how much of the gap stems from the differential valuation of women’s endowments; second, we estimate the effects of different endowments for men and women; and third we assess both these possibilities. The analyses indicate that none of these mechanisms can fully account for the gender gap. Experimental studies that indicate women’s work is less valued and rewarded than men’s suggest new directions for research on gendered compensation.
Across occupations, it is professional women who experience the largest within-job gender wage gap (Peterson and Morgan 1995). The disparity emerges quickly, with a small gender wage gap among college graduates, then widens over time (Dey and Hill 2007; Maume 2004) – so that as women’s professional careers prog-ress, they lose ground in cumulative fashion (Peterson and Saporta 2004; Valian 1998). Yet with the unprecedented numbers of women entering professional ca-reers in recent decades, the sources and the extent of this initial wage gap for the most recent cohort remain elusive.
Early work attributed this persistent inequality to a comparatively small number of women in professions (Kanter 1977). However even with the recent surge in the number of women joining the professions (Spraggins 2005; Wootton 1997), it remains unclear whether this influx of women has now leveled the occupational ter-rain. Across different professions, studies indicate conflicting findings about whether the longstanding pattern of inequity is ending for these new cohorts (Bertrand and Hallock 2001; Blair-Loy and Wharton 2004; Morgan 1998; Noonan et al. 2005; Prokos and Padavic 2005). For example, Morgan’s work on engineers suggests a generational convergence in male and female salaries, with the gender gap among younger cohorts of engineers now close to nil (see also Petersen and Morgan 1995).
This research was supported by grants from the American Bar Foundation, National Science Founda-tion (Grant No. SES0115521), Access Group, Law School Admission Council, National Association for Law Placement, National Conference of Bar Examiners and the Open Society Institute. The views and conclusions stated herein are those of the authors and do not necessarily reflect the views of individuals or organizations associated with the After the JD study. Direct correspondence to Ronit Dinovitzer, Department of Sociology, University of Toronto, 725 Spadina Ave., Toronto, Ontario, M5S 2J4, Canada. E-mail: [email protected].
© The University of North Carolina Press Social Forces 88(2) 819–864, December 2009

820 • Social Forces 88(2)
However research on lawyers (Noonan et al. 2005), physicians (Boulis 2004) and scientists (Prokos and Padavic 2005) indicates otherwise. Sex-based inequalities have not abated, despite women entering these professions in significant numbers.
The majority of research on women in the professions has focused on female lawyers (Dixon and Seron 1995; Epstein 1993; Epstein et al. 1995; Hagan 1990: Hagan and Kay 1995; Hull and Nelson 2000; Noonan et al. 2005). This is not surprising since the dramatic expansion of the legal profession in the 1980s drew large numbers of women (Chiu and Leicht 1999; Heinz, Nelson et al. 2001). Indeed, women now comprise nearly 50 percent of law graduates (ABA 2008), with law schools trailing only MBA programs in terms of female participation and graduation (Baker 2002). If law firm expansion drove this 1980s’ influx of women to the legal profession, more recent years have witnessed an equally dra-matic “second transformation” of the legal profession (Galanter and Henderson 2008). Large law firms have continued to grow unabated and have now reached
“behemoth” proportions; starting salaries for lawyers have skyrocketed; there are relentless demands on lawyers to work ever more billable hours; many law firms have changed their partnership structures; and there is an emerging class of pro-fessional lawyer-managers that is transforming law firms to better meet business demands (Galanter and Henderson 2008; Regan 2005). However the status of female entrants to this new legal profession remains unexamined despite the fact that pioneering research on gender in the legal profession is now more than 20 years old (Dixon and Seron 1995; Epstein 1993; Epstein et al. 1995; Hagan 1990; Hagan and Kay 1995; Hull and Nelson 2000; Noonan et al. 2005).
Understanding the income distribution for this new generation of female law-yers requires a wide range of measures. As past work demonstrates, job segregation is the single most important cause of gender wage gaps (England et al. 1994; Kilbourne et al. 1994; Reid 1998; Reskin and Padavic 1994). Research on job segregation in the professions has considered the hierarchy of professional special-ties and job titles (Boulis 2004; Hagan 1990; Morgan 1998; Peterson and Morgan 1995), channeling mechanisms such as networks, and hiring criteria, including the gender of those making hiring decisions (Gorman 2005; Marini and Fan 1997; Skuratowicz 2004). Studies of the legal profession have further documented the salary consequences of women’s family status, part-time work, and sector and specialization of legal practice (Dixon and Seron 1995; Kay and Hagan 1995; Noonan et al. 2005). It has also been documented that women lawyers receive lower returns for their human capital – including elite credentials – than men (Kay and Hagan 1995), and incur more negative effects when moving across geographic legal markets (Dinovitzer and Hagan 2006). Taken together, previous research identifies four major areas of inquiry as possible sources of the gender wage gap for lawyers: work profiles, opportunity paths and structures, credentials and legal markets.
Yet we argue that research on this second transformation of the legal profession must also attend to the importance of career stage for female lawyers. At one level,

Gender Gap in Lawyers’ Incomes • 821
this requires attention to the dynamics relevant to early careers, such as a focus on aspirations regarding work and family (Marini and Fan 1997) or on school per-formance and prestige in determining the first jobs of junior lawyers (Dinovitzer and Garth 2007; Hull and Nelson 2000). Without the correct sampling design, efforts to understand the gender wage gap in early careers – even if they incor-porate sophisticated measures – will be consistently stymied. Unfortunately, this has been true of cross-sectional studies of lawyers to date: almost all have relied on insufficiently large samples from which to disaggregate to lawyers in the early years of their careers. And while there has been one study that does rely on cohort data (Noonan et al. 2005) – and which finds that the dramatic influx of women lawyers in the 1980s did not result in a narrowing of the earnings gap – its im-portant findings are based on the graduates of one elite law school. As a result, it cannot speak to the career trajectories of non-elite law school graduates who tend to obtain positions in less prestigious, less lucrative settings (Dinovitzer and Garth 2007) where set salaries may not be the norm, and where gender disparities may therefore be ever more pronounced (cf., Galanter and Henderson 2008).
This article focuses on this newest generation of female lawyers – who are enter-ing the legal profession during a second major change in its structure – to deter-mine the extent, if any, of a gender-based wage gap and to assess the sources of any such gap. We do so by focusing on cohort data from a nationally representative sample of newly minted lawyers, which provides access to an unprecedented range of measures that have either been found or speculated to be sources of the gender gap in professional earnings.
Finding that a gender gap in earnings persists for female lawyers, we employ a method of decomposition to ask three critical questions about the observed dispar-ity. This method begins by hypothesizing that men and women do not receive the same rates of return for their efforts and asks if the gap would disappear if women were paid at men’s rates for the work they perform or for the credentials they pos-sess. Second, we ask whether the gap in earnings between men and women would be eliminated if women had the same profile or characteristics as men (e.g., same law school GPA, same work hours, same representation in large law firm practice) but continued to be paid at women’s rates for those same characteristics. Finally, we ask how much the gap would change if the women had the same characteristics (e.g., worked the same number of hours) and were paid the same rates as men. Answers to these questions offer a more nuanced understanding of the impact of key variables on the earnings gap and consequently suggests interesting profes-sional responses to observed inequity in pay.
Explaining Pay Gaps and their Potential to Disappear
Recent work on gender segregation argues that we must look beyond “ascriptive inequality” – inequality based on ascribed characteristics such as sex and race – to study the institutional, organizational and allocative factors that lead to workplace
822 • Social Forces 88(2)
inequality (cf., Reskin 2003). In this article, we focus on factors such as work pro-files and sectors of practice, organizational opportunity paths and structures, and geographic labor markets as key sites for investigating the sources of lawyers’ wage inequality, as are their credentials. Prior research has not consistently examined this full range of locations where mechanisms of inequality may reside, mostly due to limitations of available datasets.
Work Profiles
The organizational context of work is an often-cited and less well understood dimension of earnings and gender wage gaps (e.g., Baron and Bielby 1980; Leicht and Fennell 1997). Studies of lawyers have conceptualized practice setting in two ways: sector and firm size. Sector is used to distinguish public and private practice as well as corporate (in-house) lawyers. Although gender differences in earnings have been linked to sector (Dixon and Seron 1995; Hagan 1990; Hagan and Kay 1995; Hull and Nelson 2000; Kay and Hagan 1995), the analyses in this research bracket that issue by focusing only on lawyers working in private law firms that include more than one lawyer. Firm size, the other dimension of practice setting, is well established as a key determinant of lawyers’ income (Hull and Nelson 2000; Kay and Hagan 1995; Noonan et al. 2005). Larger law firms are the site of more lucrative corporate work (e.g., Heinz et al. 2005) with commensurate salaries for associates and partners (National Law Journal 2006; Dinovitzer et al. 2004).
The form of compensation itself may also be a site for gendered differences. Research suggests that lawyers’ compensation, including salary and bonus, requires significant contestation and negotiation (Sterling and Reichman 2004) – and as firms shift from lockstep to eat-what-you-kill compensation schemes,1 discretionary forms of compensation such as bonuses may increasingly become a source of disparities.
Finally, we also recognize that private law firms recruit lawyers not only through lucrative salaries, but also by promoting various aspects of the firm’s culture. Firms promoting their “lifestyle” credentials (such as fewer billable hours, a more col-legial environment, and training and mentorship opportunities) may compensate for these amenities by offering somewhat lower salaries. Budig and England (2001) for example hypothesized that jobs described as “mother friendly,” i.e., having flex-ible hours, few demands for travel or offering on-site daycare, will pay lower wages because of these amenities. They found, however, that such job characteristics did not explain the wage penalty experienced by mothers. While research to date has relied on detailed measures of practice settings, it has not included measures of the form of compensation or of job characteristics in analyses of earnings.
Opportunity Structures and Paths
Beginning with Kanter’s (1977) classic work, research on gender segregation and re-segregation at work suggests that women and men are differentially slotted
Gender Gap in Lawyers’ Incomes • 823
into occupations and tasks offering different opportunities to advance. Bielby and Baron (1986), for example, demonstrate that within the same occupation, women are allocated different jobs and different job titles, resulting in lower pay. In the context of the legal profession, areas of practice may function in an analogous manner. The landmark Chicago Lawyers Study in 1975 (Heinz and Laumann 1982) established that area of specialty and access to clients are key ingredients in the opportunity structures available to lawyers. Subsequent research, including the follow-up to the Chicago study (Heinz et al. 2005), suggests that area of practice creates opportunity, prestige (Hagan 1990; Sandefur 2001), and consequently, in-come (Hagan 1990; Uzzi and Lancaster 2004). However, rather than considering areas of practice as specific “jobs” with the potential for creating salary differentials, prior work on lawyers’ earnings has relied instead on areas of practice as a single continuous measure with prestige scores (Hagan 1990; Kay and Hagan 1995). As a result, research has yet to carefully examine whether men and women are dif-ferentially allocated across fields of practice within law firms, and the implications of this allocation for earnings.
The structure of the modern law firm, as Galanter and Palay (1991) have ar-gued, involves an important relationship between senior and junior lawyers. The labor of the junior lawyers allows senior lawyers to fully exploit the value of their own capital, while the junior lawyers rely on more senior lawyers to try to win the “promotion-to-partner tournament.” Among young lawyers, therefore, a key question is whether they have opportunities to connect to more senior lawyers and their clients, and to experience work in areas of practice that are likely to yield greater financial returns in the future. For new associates, connections with more senior lawyers are therefore critical: they are the source of the work assignments that are necessary for billable hours (Hagan and Kay 1995); they provide guid-ance and advice on substantive work matters; and they serve as informal mentors offering broader career advice and connections.
Legal Markets
Data consistently indicate that geographic location is an important determinant of salaries and, as Cohen and Huffman (2003) argue, researchers studying gendered wage inequality in particular need to account for the labor market in which jobs are embedded. While lawyers are members of a profession that is part of a national labor market (Huffman and Cohen 2004), there is a local level dynamic that gov-erns the marketplace for lawyers, with demand and competition for legal services varying by city (Uzzi and Lancaster 2004). Working in the nation’s largest cities is correlated with higher earnings. These cities are the site of the largest law firms and the most lucrative corporate work (National Law Journal 2007), with these firms engaging in bidding wars to attract the best and brightest elite law school graduates (Rosen 2006; Schmitt 2006). As Henderson and Alderson (2008) point out, however, it is not merely city size that governs the marketplace. Their work

824 • Social Forces 88(2)
documents that although private law firms have enjoyed tremendous growth and prosperity in recent decades, some cities and regions have prospered more than others. Geographic location is also related to the types of substantive legal work available, which in turn can determine the size of lawyers’ billings. Jurisdiction itself can lead some forms of law practice (e.g., civil litigation) to be more lucra-tive than others (e.g., Van Hoy 1997). Finally, legal markets matter because some research identifies women as less geographically mobile than men, thus if women are not equally represented in the highest paying cities or regions, this may con-tribute to the gender gap in earnings (Fernandez and Su 2004). Taken together, introducing labor markets – and not merely city size – into analyses of lawyers’ earnings will not only improve the models being specified, but it also introduces a potentially important mechanism in understanding the gender gap in earnings. This approach offers an important corrective to prior work on the legal profession which has been based on geographically bounded samples.
Human Capital
Aside from the potential mechanisms described above, much research has ex-plored the contention that, relative to men, women do not have the same set of marketable skills, qualifications or experience to reap similar levels of extrinsic professional rewards (e.g., compensation). Women bring less capital or skills to their work and therefore receive less in return. A diverse range of studies that examine human capital variables to explain differences in earnings between men and women find these variables explain nearly half of the earnings gap, some even less (Blau and Ferber 1992; Marini and Fan 1997; Roth 2003).
Significant to our study of men and women at the earliest stages of their legal careers, Marini and Fan (1997) found that human capital variables explained less than a third of the gender wage gap at career entry. As professionals, educational credentials are one of the key determinants of lawyers’ earnings, yet research consistently finds gender differences in the valuation of these credentials. Studies find that men not only receive larger returns than women for their educational credentials (Dixon and Seron 1995; Hagan and Kay 1995; Huang 1997), but also for their academic performance (Dixon and Seron 1995).
Consistent with the approach that expects discrimination to be lower for newer entrants to the profession, research on lawyers suggests that the numbers of years in practice is generally an important predictor of income and of the wage gap. Hersch’s (2003) analysis of data from the National Survey of College Graduates found that differences in years of experience explained most of the wage gap in lawyers’ salaries, while Dixon and Seron (1995) found that years of experience had a positive effect on women’s earnings in the private and government sectors, but no effect in the corporate sector (Dixon and Seron 1995).
In early applications of human capital explanations, Becker (1964) and Mincer and Polachek (1974) linked gender differences in the investment in human capital

Gender Gap in Lawyers’ Incomes • 825
to women’s orientation to family. Women were less productive, and thus com-manded lower earnings, because they did not make the same kinds of investments in education and experience. Contemporary analyses typically conceptualize this as choice and examine the effect of marriage and children on earnings. Studies find that marriage lowers earnings for women, but has no effect or creates a premium for men (Korenman and Neumark 1992; Lundberg and Rose 2000). Motherhood results in a wage penalty for women that remains unaccounted for even after elaborate controls for work experience (Budig and England 2002). With respect to lawyers’ earnings, a similar pattern emerges. Studies find that marriage produces a premium for men, but not for women (Hersch 2003; Kay and Hagan 1995), particularly in the private sector (Dixon and Seron 1995). Research also suggests that having a child is more beneficial for men than for women (e.g., Hersch 2003), but there is also no clear evidence that children are a penalty for women’s earnings. For example, according to Noonan et al. (2005), the negative effect of children on women’s earnings is fully accounted for after controlling for demographics, work experience and hours worked.
Human capital explanations also hypothesize different career investments, and thus different work profiles, for men and women. Some studies of legal careers find that women work fewer hours than men (e.g., Noonan et al. 2005; Rosen 1992), while others find no difference in hours worked (Kay and Hagan 2003). And, indeed, as with other human capital credentials, studies find that men earn more than women for every hour worked (Kay and Hagan 2003). Studies further suggest that the rationale for women working fewer hours may have little to do with investment or choice. Women’s career choices are circumscribed by the social practices of the workplace. Lawyers routinely given more complex cases may have more opportunities to put in hours, irrespective of their personal preferences for work. Women, more often than men, are likely to report being excluded from the challenging and hours-generating cases (Kay and Brockman 2003; Kay and Hagan 2003; Reichman and Sterling 2002).
Valuation/Discrimination
When a gender wage gap persists after accounting for all mechanisms and forms of capital, differential outcomes are often understood as the result of discrimina-tion. In professional work settings – especially law firms – discrimination will most likely manifest in unconscious behaviors, attitudes and practices that devalue women. Authors have identified a number of mechanisms through which this devaluation can result in lower pay: through gender schemas (Ridgeway 1997) and other forms of gender practices (Yancey Martin 2003), women are not rewarded equally as men because they are consistently underrated and discounted. While difficult to measure, the statistical technique we employ in this study has allowed researchers to identify the portion of the gap that remains “unexplained” and to assess its relative contribution to pay inequity.

826 • Social Forces 88(2)
Data and Measures
After the JD Study
This research relies on the first wave of data from the After the JD (AJD) study, a national longitudinal survey of law graduates (Dinovitzer et al. 2004). The study is based on a sample representative of the national population of lawyers who were admitted to the bar in 2000 and graduated from law school from June 1998 through July 2000. The sampling design used a two-stage process. In the first stage, the nation was divided into 18 strata by region and size of the new lawyer population. Within each stratum one primary sampling unit – metropolitan area, portion of a state outside large metropolitan areas, or entire state – was chosen. The PSUs included all four “major” markets, those with more than 2,000 new lawyers (Chicago, Los Angeles, New York and Washington, DC); five of the nine “large” markets, those with 750 to 2,000 new lawyers (Boston, Atlanta, Houston, Minneapolis, San Francisco); and nine of the remaining, smaller markets (Connecticut, New Jersey remainder, Florida remainder, Tennessee, Oklahoma, Indiana, St. Louis, Utah and Oregon). In the second stage, individu-als were sampled from each of the PSUs at rates that would, combined, generalize to the national population. In addition, the study included an oversample of 1,465 new lawyers from minority groups (black, Hispanic and Asian).2 The final sample included 9,192 lawyers in the 18 PSUs. Data collection was based on a mail questionnaire initially fielded in May 2002. Nonrespondents were followed up by mail and phone, with the telephone survey using a somewhat abridged ver-sion of the mail questionnaire. Of the sample members who were located and who met the criteria for inclusion in the study, 71 percent responded either to the mail questionnaire or to a telephone interview, for a total of 4,538 valid responses.3
Roughly 20 percent of the sample members proved to be lawyers moving from one state bar to another rather than lawyers entering a bar for the first time. Researchers opted to keep these “movers” in the sample so long as they had gradu-ated from law school no earlier than 1998 and as long as they were admitted to a bar in the year 2000. Consequently, about 6 percent of the AJD sample began law practice in 1999 and 1.5 percent began practice in 1998. In order to maintain the integrity of the cohort design, all analyses were restricted to lawyers who had been admitted to the bar no more than four years earlier (since data collection began in 2002), with 91 percent of respondents reporting that they were admitted to the bar in 2000. As a result, respondents reported about two years of work experience at the time of the survey.4
Comparisons with external data indicate that the AJD sample is representative of the general population from which the sample was selected. When compared with young lawyers in the 2000 U.S. Census, we find that the racial composition of the sample is almost identical and the sample also closely approximates the distribution of lawyers across firms, government and business employers (U.S.

Gender Gap in Lawyers’ Incomes • 827
Census Bureau 2002; Carson 2004). Finally, the gender composition in the sample closely matches data published by the American Bar Association (2005).
The analyses in this research rely on data from the national sample only, com-prised of 3,950 respondents, with analyses restricted to the 94 percent of respon-dents working fulltime in the labor force (n = 3,590). Because lawyer salaries vary dramatically by sector of practice (public vs. private) (Dixon and Seron 1995; Kay and Hagan 1995), we focus here on the subsample of respondents working fulltime in the private sector (n = 2,231). About 70 percent of new lawyers work in private law firms, making this a critical practice setting on which to focus our inquiry. Furthermore, the dynamics that may affect gender disparities are likely quite different in the private sector that is governed by the billable hour and bonus structure compared to the salaried public or business sector (see Dixon and Seron 1995). Also, because women are overrepresented in the public sector which is characterized by lower incomes, narrowing our focus to this subset of respondents helps us investigate the incomes of new lawyers without the confounding influ-ence of sector of practice that plagues much earlier research. Solo practice has unique organizational dimensions that distinguish it from other forms of private practice, with lawyers as business owners rather than employees (Seron 1996; Van Hoy 1997; Heinz et. al 2005), so we also exclude the small number of respondents working in solo practice. Finally, the sample followed a two-stage design, where weights are available to adjust for selection probabilities, but sampling weights are a function of the independent variables in the analysis, thus we do not rely on them in our analyses (Winship and Radbill 1994).
Cohort data are ideal for documenting the gender wage gap because they allow researchers to parcel out the age and seniority effects that have been confounded in prior research. Moreover, analyzing data of a cohort of new entrants to a profes-sion provides the unique advantage of studying men and women at their most comparable work/life stage, with the majority of women having delayed marriage and childbearing.
Measures
To identify the sources of the gender wage gap, we canvass a full range of mecha-nisms and forms of capital. The mechanisms we examine – work profiles, opportu-nity paths and structures, geography, and credentials – are operationalized through detailed measures, many of which have not been considered simultaneously in prior research. Variables, definitions and descriptive statistics are presented in Table 1.
SalaryBecause we are analyzing the earnings of professionals, we follow Morgan and Arthurs (2005) and employ annual salary (rather than hourly wage) as the dependent variable in our analyses. Indeed, most, if not all, full-time workers are paid on annual salary basis, with hourly wages more typical of part-time or contract work. This

828 • Social Forces 88(2)
measure is based on self-reported lawyers’ annual earnings at the time of the survey. Respondents reporting a salary of $201,000 or greater were removed as outliers (n = 25). There is a significant gender gap in salary of almost $6,000, with women reporting a mean salary of $90,527 and men $96,486 (p < .001). The analyses below rely on the natural log of salary in order to reduce heteroskedasticity (Hodson 1985).
DemographicsWe draw on a range of demographic characteristics that prior research indicates have important relationships with income. We begin by measuring years in prac-tice, with about 90 percent of men and women having begun practice in the year 2000. We control for age of respondents by using a dummy variable coded 1 to
Tabl
e 1: M
eans
, Sta
ndar
d De
viatio
ns an
d T
Test
s, by
Gen
der
Fem
aleMa
le
Mean
SDMe
anSD
T St
atisti
cSa
lary l
ogge
d11
.32.44
11.38
.45-7
.126*
**Sa
lary
9052
7.63
3738
7.36
9648
6.36
4008
0.46
-7.84
5***
Dem
ogra
phics
Numb
er of
year
s sinc
e bar
admi
ssion
.11.39
.08.38
3.726
***Bl
ack
.06.23
.04.19
4.915
***Hi
span
ic.04
.19.04
.19.12
4As
ian.08
.26.05
.224.4
76***
Has c
hildr
en.17
.38.29
.4614
.794*
**Ma
rried
.49.50
.61.49
11.69
6***
Over
36 ye
ars o
ld.15
.35.14
.341.5
74Cr
eden
tials
(for l
aw sc
hool
, exc
lude
d ca
tego
ry is
Tier
4)GP
A3.3
4.34
3.31
.344.7
01***
Rank
ed 1-
10.11
.31.12
.33-2
.943*
*Ra
nked
11-2
0.12
.32.12
.32.42
5Ra
nked
21-4
0.16
.37.20
.40-5
.407*
**Ra
nked
41-1
00.31
.46.28
.453.9
21***
Tier 3
(101
-137
).18
.38.15
.363.7
83***
Wor
k Pro
files
Prac
tice S
etting
s (ex
clude
d cate
gory
is firm
of 2-
20 la
wyer
s)
Firm
21-1
00.19
.39.20
.40-1
.660
Firm
101-
250
.13.34
.11.32
3.099
**Fir
m 25
1+
.29.45
.30.46
-1.49
9Pr
actic
e Sett
ing C
hara
cteris
tics
Comp
ensa
tion w
ith bo
nus
.77.42
.85.36
-9.42
2***
Firm
choic
e (life
style)
.08.69
-.06
.6810
.899*
**W
ork h
ours
48.95
11.79
50.71
12.15
-7.47
6***
Oppo
rtuni
ty P
aths
& S
truct
ures
Netw
orkin
gRe
cruitm
ent c
ommi
ttee
.30.46
.24.43
7.683
***

Gender Gap in Lawyers’ Incomes • 829
represent the 14-15 percent of men and women who are more than 36 years of age. Race is measured by a series of dummy variables to represent Asian, black and Hispanic respondents, with white respondents as the omitted group; about 85 percent of men and women in the sample are white.
As noted above, research has pointed to the important relationship between women’s family status and income (Hersch 2003; Noonan et al. 2005). We find that women are significantly less likely than men to have children (p < .001) or to be married (p < .001); for example, only 17 percent of women have a child compared to 29 percent of men. Since the lawyers in this study are just beginning their careers, it appears that delayed marriage and childbearing are the norm for female lawyers compared to their male peers.
Tabl
e 1: M
eans
, Sta
ndar
d De
viatio
ns an
d T
Test
s, by
Gen
der
Fem
aleMa
le
Mean
SDMe
anSD
T St
atisti
cSa
lary l
ogge
d11
.32.44
11.38
.45-7
.126*
**Sa
lary
9052
7.63
3738
7.36
9648
6.36
4008
0.46
-7.84
5***
Dem
ogra
phics
Numb
er of
year
s sinc
e bar
admi
ssion
.11.39
.08.38
3.726
***Bl
ack
.06.23
.04.19
4.915
***Hi
span
ic.04
.19.04
.19.12
4As
ian.08
.26.05
.224.4
76***
Has c
hildr
en.17
.38.29
.4614
.794*
**Ma
rried
.49.50
.61.49
11.69
6***
Over
36 ye
ars o
ld.15
.35.14
.341.5
74Cr
eden
tials
(for l
aw sc
hool
, exc
lude
d ca
tego
ry is
Tier
4)GP
A3.3
4.34
3.31
.344.7
01***
Rank
ed 1-
10.11
.31.12
.33-2
.943*
*Ra
nked
11-2
0.12
.32.12
.32.42
5Ra
nked
21-4
0.16
.37.20
.40-5
.407*
**Ra
nked
41-1
00.31
.46.28
.453.9
21***
Tier 3
(101
-137
).18
.38.15
.363.7
83***
Wor
k Pro
files
Prac
tice S
etting
s (ex
clude
d cate
gory
is firm
of 2-
20 la
wyer
s)
Firm
21-1
00.19
.39.20
.40-1
.660
Firm
101-
250
.13.34
.11.32
3.099
**Fir
m 25
1+
.29.45
.30.46
-1.49
9Pr
actic
e Sett
ing C
hara
cteris
tics
Comp
ensa
tion w
ith bo
nus
.77.42
.85.36
-9.42
2***
Firm
choic
e (life
style)
.08.69
-.06
.6810
.899*
**W
ork h
ours
48.95
11.79
50.71
12.15
-7.47
6***
Oppo
rtuni
ty P
aths
& S
truct
ures
Netw
orkin
gRe
cruitm
ent c
ommi
ttee
.30.46
.24.43
7.683
***
Meals
with
partn
ers/
asso
ciates
.58.49
.66.47
-8.31
2***
Recre
ation
with
partn
ers
.31.46
.35.48
-4.11
0***
Area
s of L
aw P
racti
ced
Gene
ral p
racti
ce2.1
88.3
74.0
113
.92-8
.402*
**An
titrus
t.80
6.29
.745.9
3.45
4Ba
nkru
ptcy
3.36
15.17
3.64
14.42
-.945
Civil
litiga
tion
23.20
34.86
22.85
32.92
.532
Comm
ercia
l law
3.56
12.28
4.19
11.91
-2.63
3**
Emplo
ymen
t law
mana
geme
nt5.8
319
.822.6
412
.639.4
52***
Fami
ly law
4.68
17.45
2.31
10.84
8.028
***Ge
nera
l cor
pora
te6.8
118
.307.8
318
.11-2
.845*
*Int
ellec
tual p
rope
rty6.3
322
.349.8
127
.20-7
.192*
**Pe
rsona
l injur
y plai
ntiff
3.15
13.56
4.64
16.80
-5.01
8***
Perso
nal in
jury d
efens
e4.6
915
.935.3
217
.96-1
.894
Prob
ate3.2
513
.001.6
78.3
07.1
33***
Real
estat
e com
merci
al3.9
816
.023.4
413
.831.8
10Re
al es
tate p
erso
nal
1.86
9.18
1.56
8.37
1.756
Secu
rities
3.91
14.77
5.02
15.82
-3.70
3***
Lega
l Mar
kets
(exc
lude
d ca
tego
ry is
Ore
gon)
New
York
City
.07.25
.06.24
1.114
Distr
ict of
Colu
mbia
.07.26
.08.27
-1.70
6Ch
icago
.10.30
.10.30
-.226
Los A
ngele
s.10
.30.08
.273.8
67***
San F
ranc
isco
.06.24
.05.21
3.291
***Bo
ston
.03.17
.03.16
.771
Atlan
ta.06
.24.06
.24-.2
79Ho
uston
.05.21
.04.20
.559
Minn
eapo
lis.05
.22.05
.22-.1
22Co
nnec
ticut
.04.19
.05.21
-2.21
4*Ne
w Je
rsey
.05.21
.03.18
2.950
**Flo
rida
.05.21
.05.21
-.298
cont
inued
on
the
folllo
wing
pag
e
830 • Social Forces 88(2)
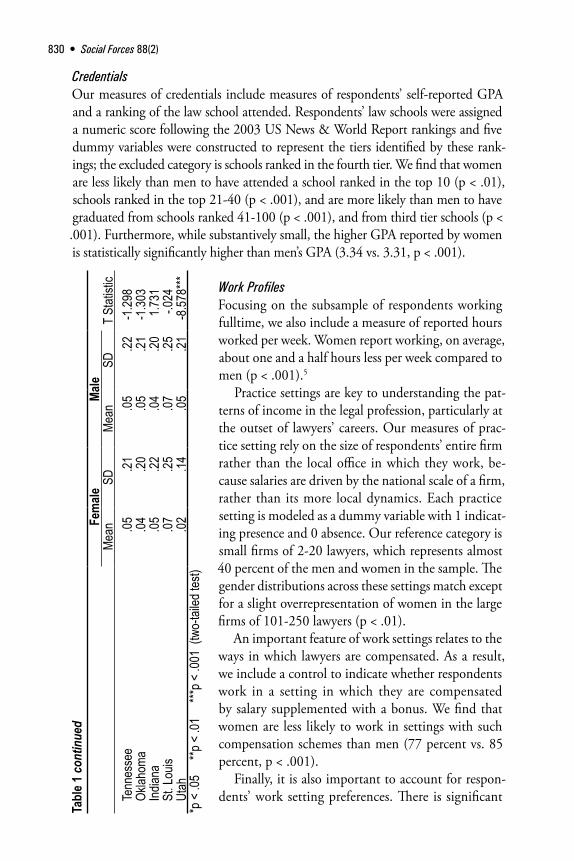
CredentialsOur measures of credentials include measures of respondents’ self-reported GPA and a ranking of the law school attended. Respondents’ law schools were assigned a numeric score following the 2003 US News & World Report rankings and five dummy variables were constructed to represent the tiers identified by these rank-ings; the excluded category is schools ranked in the fourth tier. We find that women are less likely than men to have attended a school ranked in the top 10 (p < .01), schools ranked in the top 21-40 (p < .001), and are more likely than men to have graduated from schools ranked 41-100 (p < .001), and from third tier schools (p < .001). Furthermore, while substantively small, the higher GPA reported by women is statistically significantly higher than men’s GPA (3.34 vs. 3.31, p < .001).
Work ProfilesFocusing on the subsample of respondents working fulltime, we also include a measure of reported hours worked per week. Women report working, on average, about one and a half hours less per week compared to men (p < .001).5
Practice settings are key to understanding the pat-terns of income in the legal profession, particularly at the outset of lawyers’ careers. Our measures of prac-tice setting rely on the size of respondents’ entire firm rather than the local office in which they work, be-cause salaries are driven by the national scale of a firm, rather than its more local dynamics. Each practice setting is modeled as a dummy variable with 1 indicat-ing presence and 0 absence. Our reference category is small firms of 2-20 lawyers, which represents almost 40 percent of the men and women in the sample. The gender distributions across these settings match except for a slight overrepresentation of women in the large firms of 101-250 lawyers (p < .01).
An important feature of work settings relates to the ways in which lawyers are compensated. As a result, we include a control to indicate whether respondents work in a setting in which they are compensated by salary supplemented with a bonus. We find that women are less likely to work in settings with such compensation schemes than men (77 percent vs. 85 percent, p < .001).
Finally, it is also important to account for respon-dents’ work setting preferences. There is significant
Tabl
e 1 co
ntinued
Fem
aleMa
le
Mean
SDMe
anSD
T St
atisti
cTe
nnes
see
.05.21
.05.22
-1.29
8Ok
lahom
a.04
.20.05
.21-1
.303
Indian
a.05
.22.04
.201.7
31St
. Lou
is.07
.25.07
.25-.0
24Ut
ah.02
.14.05
.21-8
.578*
***p
< .0
5 *
*p <
.01
***p
< .0
01 (
two-
tailed
test)

Gender Gap in Lawyers’ Incomes • 831
heterogeneity among private law firms not only based on their business profile (e.g., litigation-oriented, full-service, etc.), but firm culture itself varies tremen-dously. Some firms are known as elite white shoe firms, others are said to be more
“family-friendly,” while others are more competitive, or seen as “sweatshops” (see e.g., Barnes 2007; Ginsburg and Wolf 2004). Our final measure taps into this more symbolic aspect of practice settings, with a focus on measures that reflect respondents’ orientation towards firms’ “lifestyle” profile. Given our focus on private law firms, the measure of “lifestyle” is based on responses to six items in which respondents rated the importance of various job characteristics in their choice of firm, on a scale of one to seven. The items include the following factors: office environment/collegiality; hours expected; pro bono opportunities; prospects for advancement; good match of employer’s mission and my own; and training/mentorship opportunities. The items were summed, and then standardized, with an Alpha score of .72. We find that women rate a firm’s lifestyle profile as more important in their choice of firm than do men (p < .001).
Opportunity Paths and StructuresWe rely on three measures to capture a range of organizational networking activi-ties, which might create the social connections that produce work for young law-yers who are more likely to depend on the firm’s clients at this early stage of their careers. These include whether respondents serve on the firm’s recruitment com-mittee, whether they share meals with partners or senior associates, and whether they engage in recreational activities with partners. We find that women are more likely to serve on the service-oriented recruitment committee (30 percent vs. 24 percent, p < .001), but they are less likely to be involved in other social activities with partners and senior associates in the firm (p < .001).
Equally important is the opportunity to spend time in areas of practice that translate into differential earnings for lawyers. As a result, we include measures of the percent of time spent working in each of 15 different fields of practice. There are gendered patterns across fields of law with women more likely than men to be working in employment law, family law and probate, while men are more likely than women to be working in general practice, commercial, general corporate, intel-lectual property, personal injury (plaintiffs) law and securities (p < .05 or better).6
GeographyA unique feature of these data is the ability to measure the effects of working in different regions or cities across the country, which has not been possible for the majority of researchers of the legal profession. The four largest legal markets (New York City, Los Angeles, Chicago and Washington, D.C.) represent about a third of respondents, while another quarter of the respondents work in the five “large” markets (Boston, Atlanta, Houston, Minneapolis, San Francisco) and about 38 percent work in the eight smaller markets (Connecticut, New Jersey remainder,
832 • Social Forces 88(2)
Tabl
e 2: O
rdin
ary L
east
Squ
ares
Reg
ress
ions
(Uns
tand
ardi
zed)
Pre
dict
ing
ln(S
alary
)Mo
del 1
Mode
l 2Mo
del 3
Mode
l 4Mo
del 5
b
b
b
b
b
De
mog
raph
icsMa
le.06
3**
(3.14
5).07
3***
(4.52
8).05
2***
(3.93
1).04
1**
(3.03
7).05
2***
(4.17
0)Nu
mber
of ye
ars s
ince b
ar ad
miss
ion.02
2(1
.095)
-.003
(-.17
9)-.0
03(-.
180)
.000
(.023
)Bl
ack
.149*
**(3
.713)
.074*
(2.39
5).07
2*(2
.398)
.055*
(2.03
5)Hi
span
ic.03
8(.8
02)
.024
(.646
).01
8(.4
95)
-.027
(-.82
6)As
ian.09
7**
(2.77
7).07
8**
(2.86
5).07
2**
(2.72
7).00
8(.3
36)
Has c
hildr
en-.0
23(-1
.097)
-.004
(-.20
9)-.0
08(-.
518)
.023
(1.51
7)Ma
rried
-.010
(-.53
7)-.0
13(-.
849)
-.014
(-1.00
0).00
9(.6
99)
Over
36 ye
ars o
ld.02
7(1
.070)
.046*
(2.28
0).03
0(1
.560)
.022
(1.29
6)Cr
eden
tials
(for l
aw sc
hool
, exc
lude
d ca
tego
ry is
Tier
4)GP
A.47
4***
(13.8
33)
.195*
**(6
.274)
.170*
**(6
.029)
.181*
**(6
.806)
Rank
ed 1-
10.57
4***
(17.1
48)
.252*
**(8
.900)
.215*
**(7
.900)
.129*
**(4
.919)
Rank
ed 11
-20
.421*
**(1
2.842
).19
0***
(7.13
9).16
1***
(6.38
1).11
4***
(4.81
2)Ra
nked
21-4
0.30
1***
(1.14
4).13
3***
(5.49
2).10
6***
(4.59
9).06
3**
(2.81
7)Ra
nked
41-1
00.14
3***
(5.31
4).04
8*(2
.189)
.037
(1.75
6).02
3(1
.127)
Tier 3
(101
-137
).08
2**
(2.66
3).01
7(.6
68)
.012
(.484
).00
7(.2
91)
Wor
k Pro
files
Prac
tice S
etting
s (ex
clude
d cate
gory
is firm
of 2-
20 la
wyer
s)Fir
m 21
-100
.266*
**(1
3.553
).22
6***
(10.9
77)
.221*
**(11
.333)
Firm
101-
250
.414*
**(1
6.196
).36
2***
(13.2
69)
.363*
**(1
4.277
)Fir
m 25
1+.59
3***
(25.4
13)
.530*
**(1
9.928
).46
7***
(19.1
62)
Prac
tice S
etting
Cha
racte
ristic
sCo
mpen
satio
n with
bonu
s
.150*
**(7
.993)
.137*
**(7
.989)
.119*
**(7
.429)
Firm
choic
e (life
style)
-.002
(-.18
7)-.0
04(-.
429)
.005
(.495
)W
ork h
ours
.001*
*(2
.683)
.001*
*(2
.636)
Oppo
rtuni
ty P
aths
& S
truct
ures
Netw
orkin
gRe
cruitm
ent c
ommi
ttee
.055*
(2.26
0).06
5**
(3.10
5)

Gender Gap in Lawyers’ Incomes • 833
Meals
with
partn
ers/
asso
ciates
.028
(1.43
3).02
7(1
.347)
Recre
ation
with
partn
ers
-.031
*(-1
.982)
-.014
(-.91
2)Ar
eas o
f Law
Pra
ctice
dGe
nera
l pra
ctice
-.001
*(-2
.035)
-.002
*(-2
.504)
Antitr
ust
.002*
(2.41
0).00
2*(2
.252)
Bank
ruptc
y.00
1(1
.223)
.000
(.790
)Ci
vil lit
igatio
n.00
0*(2
.086)
.000
(1.12
2)Co
mmer
cial la
w-.0
01(-1
.822)
.000
(-.98
1)Em
ploym
ent la
w ma
nage
ment
.000
(-.60
2).00
0(-.
121)
Fami
ly law
-.002
***(-3
.341)
-.001
*(-2
.396)
Gene
ral c
orpo
rate
.000
(1.12
3).00
0(.5
01)
Intell
ectua
l pro
perty
.003*
**(8
.901)
.002*
**(9
.005)
Perso
nal in
jury p
lainti
ff.00
0(-.
904)
.000
(-.62
0)Pe
rsona
l injur
y defe
nse
-.001
**(-2
.850)
-.001
**(-3
.070)
Prob
ate-.0
01(-1
.898)
-.001
(-1.82
3)Re
al es
tate c
omme
rcial
.000
(.544
).00
0(.6
61)
Real
estat
e per
sona
l.00
0(-.
188)
-.001
(-.75
5)Se
curiti
es.00
2***
(4.40
4).00
1**
(3.18
3)Le
gal M
arke
ts (e
xclu
ded
cate
gory
is O
rego
n)Ne
w Yo
rk Ci
ty.40
6***
(12.1
31)
Distr
ict of
Colu
mbia
.292*
**(9
.480)
Chica
go.26
3***
(8.34
0)Lo
s Ang
eles
.339*
**(1
.746)
San F
ranc
isco
.335*
**(9
.525)
Bosto
n.28
0***
(6.57
8)At
lanta
.216*
**(6
.374)
Hous
ton.27
1***
(7.33
1)Mi
nnea
polis
.068
(1.90
0)Co
nnec
ticut
.184*
**(5
.168)
New
Jerse
y.17
7***
(4.98
8)co
ntinu
ed o
n th
e fo
lllowi
ng p
age

834 • Social Forces 88(2)
Florida remainder, Tennessee, Oklahoma, Indiana, St. Louis, Utah). The reference category is Oregon, which represents the remaining 5 percent of respondents work-ing in one of the smaller markets. We find roughly similar distributions of men and women in each of the regions, except there are more women than men in Los Angeles, San Francisco and New Jersey (p < .05 or better), while men outnumber women in Connecticut and Utah (p < .05 or better).
Data Analysis
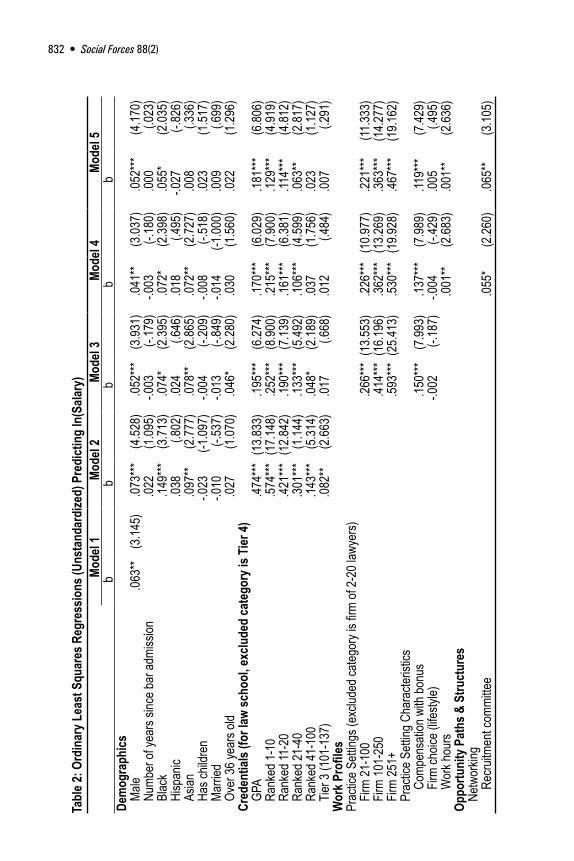
The analyses are based on four nested regres-sion models of salary that allow us to track the relative contributions of the sets of vari-ables. To minimize the bias resulting from missing data, we relied on multiple imputa-tion (Little and Rubin 1987; Allison 2001).7 The results are displayed in Table 2.
GenderThe first model begins by displaying the ef-fect of gender alone and reveals that men earn a 6.3 percent salary premium compared to women.
Human and Social CapitalThe second model introduces controls for demographic factors and academic cre-dentials. We find that black and Asian re-spondents report greater earnings than their white counterparts, with increased earnings of 15 percent and 10 percent, respectively. This model also affirms the importance of credentials. For each full point increase in GPA, respondents earn a 47 percent increase in their income. An even larger boost to in-come is attained for graduates of elite law schools, with top 10 law school graduates earning 57 percent more than their fourth-tier counterparts, and those who graduated Ta
ble 2
continued
Mode
l 1Mo
del 2
Mode
l 3Mo
del 4
Mode
l 5
b
b
b
b
b
Florid
a.06
5(1
.704)
Tenn
esse
e.00
8(.2
13)
Oklah
oma
-.026
(-.67
3)Ind
iana
.009
(.256
)St
. Lou
is.04
9(1
.407)
Utah
.141*
**(3
.515)
Cons
tant
11.32
1***
(.015
)9.5
04***
(.118
)10
.176*
**(.1
03)
10.21
1***
(.095
)10
.041*
**(1
05.92
)R
Squa
re.00
4
.363
.61
1
.648
.72
0
Note:
T ra
tios i
n par
enthe
ses
*p <
.05
**p
< .0
1 *
**p <
.001
(two
-taile
d tes
t)

Gender Gap in Lawyers’ Incomes • 835
from top 20 schools earning 42 percent more than fourth-tier graduates. Indeed, the earnings boost related to law school tier continues down the hierarchy, with earnings declining alongside law school tier. Compared to fourth-tier graduates, those who attended schools ranked in the top 40 earn 30 percent more, top 100 graduates earn 14 percent more, while third-tier graduates earn 8 percent more.
While the controls for credentials significantly increase the explanatory power of the model, with an adjusted R square of 36 percent, the coefficient for gender actually increases in this model. Thus, after introducing controls for demograph-ics and human capital the earnings gap increases to slightly more than 7 percent. This increase suggests that the salary differential is not due to the differences in credentials between men and women; if it were, then we would expect the gap to be reduced after those differences were taken into account. But as the findings indicate, the gap instead increases.
Work ProfilesThe third model includes controls for work profiles. As expected, income increases in a linear fashion with firm size. Compared to the reference group of lawyers working in small firms of 2-20 lawyers, we find a 27 percent boost for those work-ing in medium firms of 21-100 lawyers with salaries increasing by up to 60 percent for those working in the mega firms of 251 or more lawyers. In short, the larger the firm, the greater the earnings. Independent of firm size, we also find positive returns to income for respondents who work in firms where compensation is determined by a mixture of salary and bonus, with these lawyers experiencing an additional 15 percent increase in their incomes. The results also indicate that there is no relationship between choosing a firm for “lifestyle” reasons and salary. With the addition of these work profile variables, the R square of the model increases to 61 percent, suggesting that human capital, demographics and practice setting account for almost 66 percent of the variance in income. Despite these important controls, however, the gender wage gap is only slightly attenuated, with men in this model earning 5.2 percent more than women.
Opportunity PathsThe fourth model introduces the variables for networking and time spent in areas of practice. Women are often thought to be excluded from important networking opportunities that can lead to valuable work assignments (Kay and Hagan 1998; Reichman and Sterling 2002), and that women’s lower earnings are the result of investments in areas of practice that may be more traditionally gendered (e.g., family law) and/or less lucrative (e.g., real estate).
The data indicate varying effects for the networking variables. We find a 5.5 percent increase in salary for those serving on the recruitment committee and a 3 percent decrease for lawyers reporting that they spend recreational time with partners. The findings suggest two potential avenues for understanding the role of
836 • Social Forces 88(2)
networking in private law firms. First, being selected to serve on the recruitment committee may work as a signal that junior associates are valuable team players and provide young lawyers with a venue for building important relationships within the firm. Second, we find a somewhat surprising negative effect for spend-ing recreational time with partners. We hypothesize that this may stem from the increased opportunities for this type of networking in firms that are located in smaller cities, where salaries are somewhat lower. Indeed, after we control for geographic legal markets in Model 5, this negative effect of networking is reduced to below the level of significance.
We also find modest support for the relationship between time devoted to areas of practice and income. The largest gains in salary (of .2-.3 percent) result from spending more time working in antitrust and intellectual property, while higher incomes are also related to spending more time working in securities and civil litigation. As expected, we find that time spent working in family law results in a small (.2 percent) reduction in earnings, as does working in general practice and personal injury defense. Inclusion of these factors increases the explanatory power of the model to 65 percent, and reduces the income advantage accrued to men by about 27 percent (.041-.052/.041).
GeographyThe final model includes controls for geographic location. As expected, there are significant payoffs to working in the nation’s largest cities: respondents in New York City, Los Angeles, Chicago, Boston and Washington, D.C. all earn 26-41 percent more than their counterparts in Oregon (the excluded category); we also find an earnings premium for respondents working in Atlanta, Houston, Connecticut, New Jersey and Utah. This final model explains 72 percent of the variance in salary, signaling that we have accounted for a large proportion of the variance in new lawyers’ salaries; this is likely because we have a well-specified model, but also because we focus only on lawyers working in private practice. Yet in this final model the gender wage gap between male and female salaries increases again to 5.2 percent, despite the introduction of these elaborate controls.
The results displayed in Table 2 are clear: while our models provide a very good accounting of the predictors of new lawyer salaries, these same factors do not account for the gender gap in income. Our results indicate that despite con-trols for demographic background, human and social capital, fields of practice or geographic locale, male lawyers continue to command an earnings premium of about 5 percent compared to female lawyers. The invariance of this gap even as the models become more elaborate is particularly striking, since the models were constructed to account for the factors traditionally believed to be driving the gen-der gap in earnings. Below, we consider possible interaction effects and proceed to further decompose the gender gap in lawyer salaries.

Gender Gap in Lawyers’ Incomes • 837
Gender-Specific Models
Prior research has suggested that factors predicting salaries for men and women may vary (Kay and Hagan 1998; Marini and Fan 1997), thus we also estimate the salary models for subsamples of men and women. The results are presented in Appendix A and B. To assess the differences between the coefficients for men and women across the models we display relevant Z-tests in Appendix C. While many researchers rely on t-tests in assessing these differences (e.g., Marini and Fan 1997), we follow the equation specified by Clogg et al. (1995) and Paternoster et al. (1998:861) who argue that the equation for the t-tests commonly used by researchers relies on a “negatively ... biased estimate of the true standard deviation of the sampling distribution of coefficient differences” and which leads to a higher probability of rejecting the null hypothesis that b1 – b2 = 0. As a result, we employ the following equation:
Ζ =−
+
b bSEb SEb
1 2
1 22 2
√The results are fairly straightforward. There are few if any significant differences
between the explanatory variables for male and female salaries, with the Z scores for the final model indicating only one significant difference in the coefficients for men and women, with men earning more for working in personal real estate compared to women. As a result, we conclude that the models presented in Table 2 accurately reflect the predictors of male and female salaries alike.
Sources of the Gender Wage Gap
To better understand the relationship between gender and lawyers’ earnings, we decompose the gender wage gap into four components (Jones and Kelley 1984; Marini and Fan 1997; Kay and Hagan 1995). This technique stems from work that seeks to locate sources of discrimination which is said to exist when individu-als with the same characteristics receive different rates of return for these charac-teristics. By comparing the coefficients derived from the salary regressions within each group (presented in appendices A and B), and by relying on group means for the relevant variables (presented in Table 1), this decomposition provides us with four components with which to understand the gender gap in earnings. The decomposition is specified as follows (Jones and Kelley 1984):
GAP = membership + coefficients + endowments + interaction(Ym – Yw) = (am – aw) + ΣXw(bm – bw) + Σbm(Xm – Xw) + Σ(bm – bw)(Xm – Xw),where the superscript M represents men and the superscript W represents women

838 • Social Forces 88(2)
The membership component is calculated as the difference in the intercept for women and men, and it is interpreted as an “unexplained” part of the difference in incomes due to being male or female; we return below to an explanation of this term of the equation. The coefficients component is the part of the gap that is due to differences in the coefficients for men and women. This term estimates how much of the income gap results from differences in how women’s endow-ments are actually valued on the market and how much women would earn for these endowments if they benefited from the same valuations given to men. The third term is the endowments component which estimates the amount by which women’s incomes are depressed compared to men’s because of differences in their endowments. This term estimates how much more women would earn if they had the same profile as men (e.g., if women worked as many hours as men, had the same GPA, etc.), but if their endowments remained valued at the rate “paid” to women. Finally, the interaction term takes into account both the difference in endowments (e.g., the amount of hours worked) and the difference in how these endowments are valued (e.g., the hourly rates of pay for men and women). This is the amount women would gain if, for example, they worked as long as men and if those extra hours were remunerated at the same rate as men. Because this is an interaction effect, if women did work the same number of hours as men and were paid the same as men, for example, this term would equal 0.
In calculating the gender gap in earnings, Jones and Kelley (1984:34) caution that the membership component should not be interpreted on its own. Because most variables in social science analyses have arbitrary 0 points, “the substan-tive results of the decomposition are arbitrary.” As a result, we add together the membership component and the coefficient component. When combined, we are in effect calculating the unexplained difference in income between men and women – in other words, the amount of the income gap that is due to the inex-plicable finding that differences in income are the consequence of checking off male or female on a survey. While the formal models of the decomposition (e.g., Jones and Kelley 1984) use the language of “discrimination” for this particular component, we argue that these distinctive designations are difficult to make. For example, contributions to the gender wage gap that result from differences in men’s and women’s “endowments” component (e.g., the hours men and women report they work) may themselves be the result of discrimination: for example, junior women may not receive the same number of files or valuable client assign-ments from senior partners as junior men, which will then result in fewer hours worked. As a result, in our discussion we rely on the more descriptive labels for each component of the decomposition.
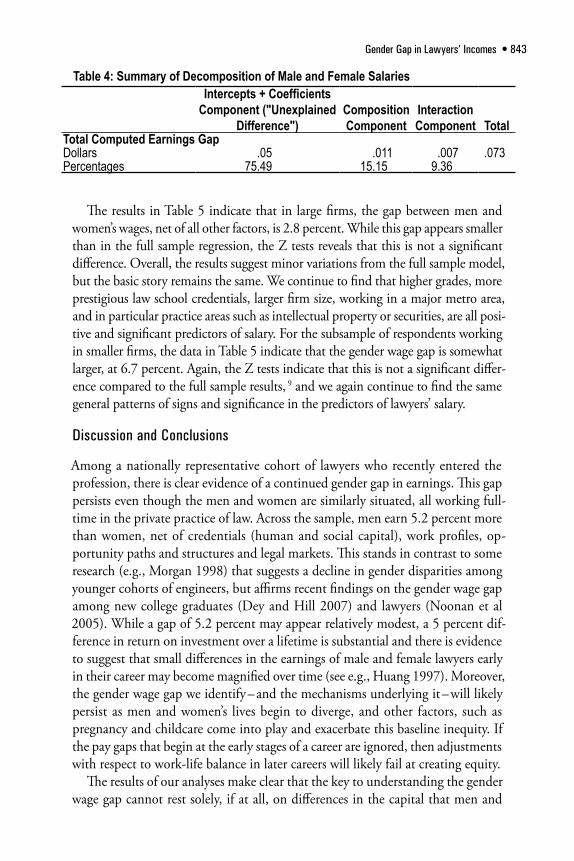
The full decomposition is displayed in Table 3, with a summary of the findings in Table 4. Overall, we have calculated a total gender wage gap of 7.3 percent. About 75 percent of this gap is due to unexplained differences in the valuation of women’s endowments, about 15 percent results from the differential endow-
Gender Gap in Lawyers’ Incomes • 839
ments of women compared to men, and the remaining 9 percent of the gap is due to the interaction between the difference in returns to endowments and the difference in the endowments themselves. This distribution signals that the gender gap in salaries is largely unexplained (75 percent of the gap is unexplained), and the largest contributor to the gender wage gap is this residual variance. Jones and Kelly (1984:324) refer to this residual variance as “discrimination” – yet we cau-tion, as do Jones and Kelly, that this unexplained residual might be the product of variables unaccounted for in the model, or potential measurement error, rather than simply the result of discrimination.
We cannot isolate the contribution of particular variables to the “discrimination component” (Jones and Kelley 1984), so we turn our attention to the 15 percent of the gender wage gap that is attributed to differences in endowments between men and women. This reflects the amount that the gap would be narrowed if women “looked” like men, but were paid like women. The largest contribution to the gender wage gap comes from the differential distribution of men and women in one particular field of law, intellectual property. Women, on average, spend 6.5 percent of their time working in this field compared to men’s 9.8 percent. According to the results in Table 3, if women spent as much time as men working in this field of law but were paid at the rate of women, the gender gap in earn-ings would be reduced by about 9.5 percent (63 percent of 15 percent). Another important contributor to the gender wage gap is the compensation scheme in one’s firm. If as many women as men worked in firms where compensation is deter-mined by a combination of salary and bonus (and were paid as women are paid), the gender wage gap would be narrowed by about 12.9 percent (86 percent of 15 percent).8 Practice settings are also an important source of the compositional gen-der wage gap, so that if as many women as men worked in the largest private firms (of more than 250 lawyers), the gender wage gap would narrow by 8.3 percent (55 percent of 15 percent). Finally, demographics play an interesting role: while men are more likely than women to have children (28 percent vs. 17 percent, p < .001), they receive positive returns for having children. Thus, if women were rewarded similarly to men, having more children would actually increase women’s salaries.
Overall, the data in the endowments column do not point to the tradition-ally noted factors (such as hours worked or GPA) as sources of the gender gap in salaries. This is because women, in fact, have very good endowments on key characteristics. On average, their GPAs are higher than that of men and they are well-represented in large law firms; as a result, the equations indicate that if women were to adjust their endowments to equal those of men (by reducing their GPAs, for example), the gender wage gap might actually increase. Indeed, all negative figures in the column for the endowments component reflect variables for which the mean score for women is higher than that of men.
The final component of the gap is the interaction component, which represents the interaction between the gap produced by the differential valuation of men
840 • Social Forces 88(2)
Tabl
e 3: D
ecom
posit
ion
of th
e Sala
ry G
ap fo
r Male
and
Fem
ale L
awye
rs
Coef
ficen
ts
Com
pone
nt:
Endo
wmen
ts (o
r Co
mpo
sitio
nal)
Com
pone
nt:
Inte
ract
ion
Com
pone
nt:
Inte
rcep
tCo
mpo
nent
Xw (b
m -bw )
bm (Xm -X
w ) Pe
rcent
(bm -b
w )(Xm -X
w )Pe
rcent
am -aw
Dem
ogra
phics
Numb
er of
year
s sinc
e bar
admi
ssion
-.002
.000
2.3.00
17.3
-.279
Blac
k.00
1-.0
01-1
0.1.00
0-2
.9Hi
span
ic.00
1.00
0.1
.000
-.2As
ian.00
0.00
0-1
.0.00
01.8
Has c
hildr
en.00
7.00
439
.4.00
568
.1Ma
rried
.003
.001
12.4
.001
8.6Ov
er 36
year
s old
-.008
.000
-.7.00
18.0
Cred
entia
ls (fo
r law
scho
ol, e
xclu
ded
cate
gory
is T
ier 4)
GPA
.234
-.007
-59.3
-.002
-31.3
Rank
ed 1-
10.00
6.00
325
.3.00
113
.7Ra
nked
11-2
0.00
6.00
0-3
.4.00
0-2
.0Ra
nked
21-4
0.01
2.00
432
.5.00
344
.4Ra
nked
41-1
00.01
0-.0
01-11
.9-.0
01-1
5.4Tie
r 3 (1
01-1
37)
.012
-.001
-8.1
-.002
-26.0
Wor
k Pro
files
Prac
tice S
etting
s (ex
clude
d cate
gory
is firm
of 2-
20 la
wyer
s)Fir
m 21
-100
-.004
.003
25.1
.000
-3.7
Firm
101-
250
-.007
-.007
-62.0
.001
14.8
Firm
251+
-.014
.006
54.6
-.001
-9.3
Prac
tice S
etting
Cha
racte
ristic
sCo
mpen
satio
n with
bonu
s.01
1.01
086
.6.00
114
.6Fir
m ch
oice (
lifesty
le).00
0-.0
01-5
.4.00
06.6
Wor
k hou
rs.05
6.00
432
.0.00
228
.6Op
portu
nity
Pat
hs &
Stru
ctur
esNe
twor
king
Recru
itmen
t com
mitte
e.00
0-.0
04-3
9.9.00
0.6
Gender Gap in Lawyers’ Incomes • 841
Tabl
e 3: D
ecom
posit
ion
of th
e Sala
ry G
ap fo
r Male
and
Fem
ale L
awye
rsMe
als w
ith pa
rtner
s/ as
socia
tes.00
9.00
326
.0.00
118
.1Re
creati
on w
ith pa
rtner
s.00
5.00
0-2
.8.00
19.2
Area
s of L
aw P
racti
ced
Gene
ral p
racti
ce.00
1-.0
04-3
3.3.00
112
.5An
titrus
t.00
0.00
0-1
.0.00
0-.3
Bank
ruptc
y-.0
04.00
00
.000
-4.4
Civil
litiga
tion
-.012
.000
0.00
02.6
Comm
ercia
l law
.002
.000
0.00
05.9
Emplo
ymen
t law
mana
geme
nt-.0
01.00
00
.000
4.0Fa
mily
law.00
0.00
221
.6.00
02.7
Gene
ral c
orpo
rate
-.005
.000
0-.0
01-11
.5Int
ellec
tual p
rope
rty-.0
01.00
763
.2.00
0-6
.6Pe
rsona
l injur
y plai
ntiff
.004
.000
.0.00
228
.1Pe
rsona
l injur
y defe
nse
.004
-.001
-5.7
.001
7.7Pr
obate
.000
.002
14.4
.000
1.1Re
al es
tate c
omme
rcial
-.001
.000
0.00
01.9
Real
estat
e per
sona
l.00
7.00
0-2
.8-.0
01-1
6.1Se
curiti
es-.0
04.00
110
.1-.0
01-1
4.2Le
gal M
arke
ts (e
xclu
ded
cate
gory
is O
rego
n)Ne
w Yo
rk Ci
ty.00
0-.0
02-1
9.6.00
0-.2
Distr
ict of
Colu
mbia
-.005
.002
21.6
-.001
-8.1
Chica
go.00
1.00
03.2
.000
.2Lo
s Ang
eles
.005
-.008
-71.6
-.001
-15.8
San F
ranc
isco
.000
-.005
-45.2
.000
.8Bo
ston
.003
-.001
-7.2
.000
-3.2
Atlan
ta-.0
01.00
02.6
.000
-.2Ho
uston
.003
-.001
-6.1
.000
-2.3
Minn
eapo
lis-.0
02.00
0.2
.000
-.3Co
nnec
ticut
.001
.002
16.4
.000
4.7Ne
w Je
rsey
.003
-.002
-21.5
-.001
-11.3
cont
inued
on
the
follo
wing
pag
e

842 • Social Forces 88(2)
and women’s endowments and the actual difference in their endowments. As Jones and Kelley (1984) explain, the interaction term can be allocated to either “discrimination” or endowments, depending on how one theorizes the reasons for the gap. If it is hypothesized that the gender wage gap results because men are privileged (i.e., that men are “over-paid” for their endowments), then the interaction term can be added to the endowment component. On the other hand, if the gender wage gap is hy-pothesized to occur because women are deprived (i.e., that they are earning less because they are re-ceiving lower returns for their endowments) then the interaction term should be added to the “dis-crimination component.” According to Jones and Kelley (1984), it is quite reasonable to report the interaction term separately, as we do, because it al-lows us to separately assess the magnitude of any residual “discrimination” component.
The largest contribution to the interaction component stems from the effect of having a child, which explains 6.1 percent of the gender wage gap (68 percent of 9 percent). This is the amount women would gain if they had children at the same rate as men and if having a child netted them the financial benefits that currently accrue only to men. All remaining variables contribute less than 5 per-cent individually to the gender wage gap.
Firm Effects?
One of the strongest predictors of salaries in the legal profession, according to these data and oth-ers, is firm size. Working for a larger firm nets a larger income. Because factors that determine salaries within firms might vary by size of firm, we undertook two additional subsample regres-sion models to investigate whether the factors determining salaries vary by setting: the first sub-sample is comprised of respondents working in large private firms of more than 100 lawyers and the second is restricted to respondents working in firms of fewer than 100 lawyers. Ta
ble 3
continued
Coef
ficen
ts
Com
pone
nt:
Endo
wmen
ts (o
r Co
mpo
sitio
nal)
Com
pone
nt:
Inte
ract
ion
Com
pone
nt:
Inte
rcep
tCo
mpo
nent
Xw (b
m -bw )
bm (Xm -X
w ) Pe
rcent
(bm -b
w )(Xm -X
w )Pe
rcent
am -aw
Florid
a.00
0.00
0.7
.000
0Te
nnes
see
-.001
.000
-.1.00
0-1
.7Ok
lahom
a.00
0.00
0-1
.3.00
0-.3
Indian
a.00
2.00
0-1
.9.00
0-4
.6St
. Lou
is-.0
03.00
00
.000
-.1Ut
ah-.0
01.00
331
.5-.0
02-2
7.7
Gender Gap in Lawyers’ Incomes • 843
The results in Table 5 indicate that in large firms, the gap between men and women’s wages, net of all other factors, is 2.8 percent. While this gap appears smaller than in the full sample regression, the Z tests reveals that this is not a significant difference. Overall, the results suggest minor variations from the full sample model, but the basic story remains the same. We continue to find that higher grades, more prestigious law school credentials, larger firm size, working in a major metro area, and in particular practice areas such as intellectual property or securities, are all posi-tive and significant predictors of salary. For the subsample of respondents working in smaller firms, the data in Table 5 indicate that the gender wage gap is somewhat larger, at 6.7 percent. Again, the Z tests indicate that this is not a significant differ-ence compared to the full sample results, 9 and we again continue to find the same general patterns of signs and significance in the predictors of lawyers’ salary.
Discussion and Conclusions
Among a nationally representative cohort of lawyers who recently entered the profession, there is clear evidence of a continued gender gap in earnings. This gap persists even though the men and women are similarly situated, all working full-time in the private practice of law. Across the sample, men earn 5.2 percent more than women, net of credentials (human and social capital), work profiles, op-portunity paths and structures and legal markets. This stands in contrast to some research (e.g., Morgan 1998) that suggests a decline in gender disparities among younger cohorts of engineers, but affirms recent findings on the gender wage gap among new college graduates (Dey and Hill 2007) and lawyers (Noonan et al 2005). While a gap of 5.2 percent may appear relatively modest, a 5 percent dif-ference in return on investment over a lifetime is substantial and there is evidence to suggest that small differences in the earnings of male and female lawyers early in their career may become magnified over time (see e.g., Huang 1997). Moreover, the gender wage gap we identify – and the mechanisms underlying it – will likely persist as men and women’s lives begin to diverge, and other factors, such as pregnancy and childcare come into play and exacerbate this baseline inequity. If the pay gaps that begin at the early stages of a career are ignored, then adjustments with respect to work-life balance in later careers will likely fail at creating equity.
The results of our analyses make clear that the key to understanding the gender wage gap cannot rest solely, if at all, on differences in the capital that men and
Table 4: Summary of Decomposition of Male and Female Salaries Intercepts + Coefficients
Component ("Unexplained Difference")
Composition Component
Interaction Component Total
Total Computed Earnings GapDollars .05 .011 .007 .073Percentages 75.49 15.15 9.36

844 • Social Forces 88(2)
women bring to their careers or on the choices they make. Even more, by drawing on this particular dataset, our analyses lay to rest many of the assumptions put forward as potential sources of the pay gap. We have done so both by design and through systematic testing of mechanisms that may result in gender inequities in compensation. The data that we analyze in this article have three important
Tabl
e 5: O
rdin
ary L
east
Squ
ares
Reg
ress
ions
Pre
dict
ing
ln(S
alary
), by
Lar
ge (>
100)
and
Small
(< 10
0) P
rivat
e Firm
sLa
rge F
irms (
>100
Law
yers
)Sm
all F
irms (
<100
Law
yers
)
b
Z tes
t com
parin
g lar
ge fir
ms to
full
samp
leb
Z tes
t com
parin
g sm
all fir
ms to
full
samp
leDe
mog
raph
icsMa
le.02
8*(.0
12)
-1.42
3.06
7***
(.018
).90
6Nu
mber
of ye
ars s
ince a
dmiss
ion.03
4*(.0
14)
1.680
-.008
(.023
)-.4
22Bl
ack
.033
(.025
)-.5
79.07
5(.0
43)
.551
Hisp
anic
.015
(.038
).85
0-.0
55(.0
49)
-.541
Asian
.007
(.021
)-.0
40-.0
04(.0
40)
-.367
Has c
hildr
en-.0
05(.0
16)
-1.27
3.04
2(.0
23)
.891
Marri
ed.00
6(.0
12)
-.153
.008
(.021
)-.0
37Ov
er 36
year
s old
.026
(.020
).15
4.02
0(.0
24)
-.082
Cred
entia
ls (fo
r law
scho
ol, e
xclu
ded
cate
gory
is T
ier 4)
GPA
.124*
**(.0
22)
-1.64
1.17
9***
(.036
)-.0
43Ra
nked
1-10
.072*
(.035
)-1
.294
.192*
*(.0
60)
1.457
Rank
ed 11
-20
.052
(.035
)-1
.444
.137*
**(.0
40)
.557
Rank
ed 21
-40
.030
(.035
)-.7
99.04
7(.0
32)
-.383
Rank
ed 41
-100
.014
(.034
)-.2
16.01
0(.0
28)
-.333
Tier 3
(101
-137
).00
5(.0
35)
-.041
.000
(.031
)-.1
60W
ork P
rofil
esPr
actic
e Sett
ings
Firm
251+
/Firm
21-1
00.10
6***
(.014
)-4
.740
.209*
**(.0
24)
-.505
Prac
tice s
etting
char
acter
istics
Comp
ensa
tion w
ith bo
nus
.057*
(.023
)-9
.010
.118*
**(.0
22)
-7.21
3Fir
m ch
oice (
lifesty
le)-.0
07(.0
11)
-17.9
55.01
5(.0
14)
-17.1
28W
ork h
ours
.000
(.000
)-7
.432
.002*
*(.0
01)
-7.30
7Op
portu
nity
Pat
hs &
Stru
ctur
esNe
twor
king
Recru
itmen
t com
mitte
e.03
6*(.0
18)
1.577
.093*
*(.0
28)
4.394

Gender Gap in Lawyers’ Incomes • 845
design features. First, the data derive from a single cohort of young lawyers. We are able to parcel out confounding issues related to seniority and to sidestep is-sues of marriage and childbearing, a life stage the majority of men and women in this sample have not yet experienced and which is often identified as a potential cause of the gender wage gap. By comparing the earnings of women at the point
Meals
with
partn
ers/
asso
ciates
.016
(.016
).89
2.03
1(.0
35)
1.850
Recre
ation
with
partn
ers
-.013
(.016
)-2
.934
-.014
(.021
)-2
.976
Area
s of L
aw P
racti
ced
Gene
ral p
racti
ce.00
0(.0
01)
-1.34
6-.0
02*
(.001
)-1
.476
Antitr
ust
.001
(.001
).95
9.00
4*(.0
02)
1.156
Bank
ruptc
y.00
0(.0
00)
1.908
.000
(.001
)2.1
76Ci
vil lit
igatio
n.00
0(.0
00)
-1.82
4.00
0(.0
00)
-1.73
1Co
mmer
cial la
w.00
0(.0
00)
.000
-.001
(.001
).00
0Em
ploym
ent la
w ma
nage
ment
.000
(.000
).00
0.00
0(.0
01)
.000
Fami
ly law
-.002
(.002
)-.6
10-.0
01(.0
01)
-.222
Gene
ral c
orpo
rate
.000
(.000
).00
0.00
1(.0
01)
.000
Intell
ectua
l pro
perty
.001*
**(.0
00)
.000
.004*
**(.0
00)
.000
Perso
nal in
jury p
lainti
ff.00
2(.0
02)
.666
.000
(.001
)-.1
71Pe
rsona
l injur
y defe
nse
-.002
***(.0
01)
-4.23
7-.0
01(.0
01)
-3.23
5Pr
obate
-.001
(.001
)-.4
64-.0
01(.0
01)
-.614
Real
estat
e com
merci
al.00
0(.0
00)
.000
.000
(.001
).00
0Re
al es
tate p
erso
nal
-.001
(.001
).12
8.00
0(.0
01)
.696
Secu
rities
.001*
(.000
).00
0.00
3*(.0
01)
.000
Lega
l Mar
kets
(exc
lude
d ca
tego
ry is
Ore
gon)
New
York
City
.480*
**(.0
34)
14.13
2.32
2***
(.062
)9.4
76Di
strict
of C
olumb
ia.36
5***
(.032
)11
.368
.211*
**(.0
55)
6.542
Chica
go.33
8***
(.032
)-1
.486
.214*
**(.0
45)
-4.17
5Lo
s Ang
eles
.398*
**(.0
34)
2.310
.331*
**(.0
47)
.835
San F
ranc
isco
.365*
**(.0
36)
2.160
.375*
**(.0
58)
2.365
Bosto
n.38
0***
(.040
).80
6.16
0*(.0
78)
-3.50
4At
lanta
.198*
**(.0
36)
-2.73
2.22
8***
(.050
)-2
.132
Hous
ton.29
5***
(.038
).25
3.27
9***
(.057
)-.0
14Mi
nnea
polis
.118*
*(.0
38)
-1.92
8.04
0(.0
51)
-3.47
0Co
nnec
ticut
.276*
**(.0
41)
.083
.132*
(.051
)-2
.515
New
Jerse
y.30
2***
(.042
)4.2
30.11
4*(.0
51)
.841
cont
inued
on
the
follo
wing
pag
e.

846 • Social Forces 88(2)
in their careers where they look most like men – and still finding a gender wage gap – we are able to rule out many competing hypotheses and to identify that there is an underlying structure of inequality that devalues women. As a result, these data offer a conservative estimate of the pay gap and also alert researchers to look beyond the expected causes of the gender wage gap. Second, by focusing on
lawyers working in the private sec-tor we avoid issues of the differen-tial levels of pay across the public and private sectors, along with the overrepresentation of women in this lower-paying sector; we are thus able to focus on mechanisms exclusive to the private sector that have been hypothesized to cause a gender wage gap. Despite this nar-rowing of our focus, we continue to find a gender gap in earnings. Finally, these analyses report find-ings from a sample that is nation-ally representative, thus speaking to the experiences of new lawyers from a range of social backgrounds, working in varying labor markets. Taken together, these data provide an unprecedented look at the in-come of new lawyers, with gradu-ates of virtually every law school in the country represented in the sample, and with respondents working in varied labor markets, both large and small.
Turning to investigate the mechanisms that may be driving these differential earnings, we identified four potential avenues: work profiles, opportunity paths and structures, legal markets, and credentials. Our results indicate that none of these mechanisms can fully account for the gender wage gap (see Table 2). With respect to credentials, the results suggest that
Tabl
e 5 co
ntinued
Larg
e Firm
s (>1
00 L
awye
rs)
Small
Firm
s (<1
00 L
awye
rs)
b
Z tes
t com
parin
g lar
ge fir
ms to
full
samp
leb
Z tes
t com
parin
g sm
all fir
ms to
full
samp
leFlo
rida
-.004
(.046
)-3
.219
.078
(.050
)-1
.820
Tenn
esse
e-.0
09(.0
45)
-3.24
9.00
9(.0
53)
-2.94
4Ok
lahom
a-.0
70(.0
86)
-1.44
4-.0
33(.0
48)
-1.05
1Ind
iana
.043
(.041
).61
4.01
0(.0
47)
.033
St. L
ouis
.052
(.036
)1.4
78.05
6(.0
51)
1.546
Utah
.152*
*(.0
57)
2.157
.118*
(.054
)1.6
46Co
nstan
t10
.754*
**(.1
04)
97.55
59.9
77***
(.128
)90
.477
R Sq
uare
.629
.494
N88
5
12
02
No
te: S
tanda
rd er
rors
in pa
renth
eses
*p <
.05
**p
< .0
1 *
**p <
.001
(two
-taile
d tes
t)
Gender Gap in Lawyers’ Incomes • 847
contrary to the assumptions of human capital theory, the wage gap does not result from the human capital that women bring to their careers. On the other hand, tak-ing into account work profiles – the size of firm, work hours, style of compensation, and the importance of “lifestyle” considerations – attenuates the gender wage gap, although the effect is quite modest. A more promising avenue appears to be con-sideration of a range of opportunity paths, including networking opportunities and time devoted to specific areas of law. The introduction of these variables accounts for just over a quarter of men’s earnings advantage (see Table 2). These findings confirm that in professional settings such as law firms, where work assignments travel from senior to more junior employees, socializing with more senior lawyers in both work and non-work settings can directly affect earnings. Similarly, working in particular fields of law, such as securities or intellectual property, is another op-portunity path that translates into higher earnings and which helps explain some of men’s earnings advantage. Finally, lawyers’ earnings are closely tied to geographic markets. The nation’s largest cities are the locations of the most lucrative legal work, with big city firms vying for the best credentialed elite law graduates by offering substantial salaries. However, the distribution of men and women across these legal markets is fairly even, so that geographic markets are not an important mechanism in understanding the gender gap in early lawyers’ earnings.
Relying on a method which compares the differences in means, slopes and con-stants for men and women, we then sought to locate the sources of this gap. Using this decomposition technique we first estimated how much of the income gap stems from the differential valuation of women’s endowments; we then estimated the amount by which women’s incomes are depressed compared to men’s because they have different endowments; and finally, we took into account both these pos-sibilities (i.e., that women’s endowments are paid at a different rate than men’s and that women have different endowments than men). The results of this analysis are both straightforward and complex in their implications. First, we find that only a small proportion (15 percent) of the wage gap would be narrowed if women resembled men across endowments. Second, we find that about three quarters of the gender wage gap remains unexplained by any of the empirical measures avail-able to us. This unexplained variance may be due to discrimination or to other unmeasured factors: and thus to fully understand the process through which men are more highly valued and rewarded than women (see also Joy 2003) will require additional analyses to unpack this residual, and to examine the mechanisms of inequality that lie beneath the surface of professional work and compensation.
These analyses make clear that in professional settings such as law firms, where work is defined by a complex assemblage and hierarchy of tasks, the mechanisms underlying gender inequity combine to generate a consistent devaluation of women. Indeed, it is possible that it is the nature and organization of work that lawyers do that allows for practices that contribute to the pay gap in ways that they do not for other professionals. Thus while Morgan (1998) found a gender

848 • Social Forces 88(2)
wage gap at close to nil among engineers, the gender wage gap we find in our research signals that there may be something unique in the early professional work of lawyers that allows for the kind of subjective assessments and interactions that underlie differences in pay and account for significant within-occupation wage gaps (Peterson and Morgan 1995). Female lawyers are not alone, of course, in experiencing unexplained earnings differentials. Gender gaps in earnings are found in all of the traditional professions (medicine, clergy and professors) and in occupations that are commonly described as professional practice (accountants, for example). Although the data and methodologies vary considerably, efforts to explain gaps consistently find earnings models that, depending on the study, can explain only part of the earnings. Even with the best effort to explain pay differ-ences, some portion of the gap remains unexplained in the pay gap studies of male and female science academics (Ginther 2003); medical school professors (Ash et al. 2004); scientists and engineers (Prokos and Padavic 2005); psychiatrists (Weeks and Wallace 2007); accountants (Caro et al. 1998); social workers (Koeske and Krowinski 2004); and nurses (Kalist 2002).
These findings make even more urgent the call to empirically examine compen-sation as a form of gender practice (Yancey Martin 2003). A substantial literature based on experimental and observational data describes ways that gender schemas (Valian 1999) work to disadvantage women by consistently overrating men and underrating women in compensation practices. Ridgeway’s (1997:221) important work on the impact of gender status beliefs, for example, suggests that they “cause men and women to implicitly expect (or expect that others will expect) greater competence from men than from women, all things being equal.” A significant body of research has found that in male gendered type work where performance level assessment is ambiguous, as is often the case in the evaluation of legal work, women are not perceived as competent (Heilman 2007:81). Heilman describes this as descriptive or “lack of fit” bias. The attributes assumed necessary for male typed tasks do not correspond to the attributes that are assumed to characterize women; lack of fit therefore leads to expectations of failure. A different type of bias, prescrip-tive bias, occurs when women are recognized as successful but are penalized because their success violates preconceived notions of what women should be like (Heilman 2001). Heilman et al. (2004) found that women who were deemed successful in male typed tasks, that is success in violation of gender expectations, were perceived of as less likeable and more interpersonally hostile than successful men, and earned lower performance ratings and fewer organizational rewards as a result.
The repeated background activation of gender status beliefs through everyday interactions can play an important role in sustaining gendered compensation practices as well; expectations become self-fulfilling ( see also Zimmerman and West 1987). Non-verbal cues about social dominance can become powerful forms of hierarchical control (Dovidio et al. 1988). Yancey Martin (2003) observes that when men acknowledge women with a mere nod, and recognize men with exten-
Gender Gap in Lawyers’ Incomes • 849
sive eye contact and talk, the message women receive is that they are less important. When such messages are given over and over again, they can be debilitating even to highly educated women . Because gender status beliefs advantage men over women who are otherwise their equals, men, on average, are less likely to notice and/or disregard information that challenges existing beliefs. The consequences can be profound: subjective and discriminatory evaluation in some cases and di-minished performance in still others. Recent investigations of wage discrimination argue that increased disparity in wages between men and women tend to occur when decision makers are given discretionary power to determine income (Parloff 2007). And indeed, research on lawyers has shown that when hiring criteria rely on stereotypically feminine traits women are more likely to be hired, and conversely, when criteria include more stereotypically masculine traits, women represent a smaller proportion of new hires (Gorman 2005).
Valian (2005) further argues that women themselves are affected by gender sche-mas, leading them to perceive themselves as worth less and entitled to less and this, too, may create gendered compensation practices. Women lawyers interviewed by Sterling and Reichman (2004) suggested that men and women record billable hours in different ways; men record every snippet of conversation with a client, women are more selective. Do women routinely discount the amount of work they do relative to men? If so, the consequences for income are profound as many law firms still rely on billable hours to measure productivity and value to the firm. Experiments conducted by social psychologists suggest that the gendered dynamics of salary negotiation might explain some of the remaining gender effects in our model. There is a substantial body of research that finds that women expect to be paid less than men do, that women are less likely than men to negotiate their starting salaries, and that men make significantly larger salary requests than do women (e.g., Babcock and Laschever 2003; Barron 2003; Kray and Thompson 2005; Major and Konar 1984). For example, in a series of experiments Small et al. (2007) found that women initiated fewer negotiations than men both when there was no explicit option to negotiate and when negotiation was a possibility. Gender differences were however dramatically reduced when the experimenters reframed the experimental condition from a negotiation to an opportunity to ask for more money. Asking offered a
“softer,” less face-threatening strategy that women appeared to find more acceptable than the idea of negotiation (Small et al. 2007). Women’s reluctance to pursue negotiations might be a rational choice given further research that found that there are costs to women who negotiate that men do not experience. Research testing the impact of knowing that a job candidate had negotiated for higher compensation on willingness to work with that candidate, revealed a decline in willingness for both male and female candidates, although the negative effect was 5.5 times greater for women than men (Bowles et al. 2007).
Few empirical studies carry those insights into the empirical analysis of pay in-equity, in part, because few, if any, offer direct observation of the process. Research

850 • Social Forces 88(2)
must move in that direction. Recognizing that compensation is a social process where individuals seeking compensation “make their best case,” and others evalu-ate the cases made, how does gender matter? Is the work that women produce, the hours that they put in, the intellect, creativity and initiative that they display on the job discounted in “small, barely visible ways” (Valian 2005:198) that ac-cumulate into fairly substantial differentials in pay? Are women disadvantaged in the compensation process because they are more likely than men to use tag questions, hedges, disclaimers and “super polite grammatical constructions in conversations that occur in mixed sex contexts?”(Ridgeway and Smith-Lovin 1999) Are women lawyers less willing than men to initiate negotiations on salary and bonus, and if they do, do they incur costs in terms of future, career launching assignments? Having recognized that we cannot explain pay inequity simply by differential credentials, opportunities, or the collateral damage of a society that has not provided viable ways to balance work and family, stepping inside the black box of compensation decision making seems a necessary next step.
Notes
1. In a “lockstep” compensation scheme, lawyers are compensated equally, based on seniority, regardless of the business they bring in or their performance. In contrast, an “eat what you kill” compensation scheme determines remuneration by the amount of business brought in by a lawyer and/or her billable hours.
2. The sample also included respondents who self-identified as Native Americans, however the number of respondents in this category is too small for the analyses in this paper.
3. Based on the standard definitions provided by the American Association for Public Opinion Research, the response rates for the AJD study range from 53-55 percent, due to the unlocated sample members.
4. We ran all analyses on the subset of respondents who began practice in the year 2000. Because the substantive findings showed a similar gender wage gap and the same patterns of magnitude and significance, we report here the results of the larger sample.
5. We rely on reported weekly hours because this is the format of the survey question, and respondents did not report the number of weeks worked that year.
6. In the AJD sample, 18 percent of women work in the public sector compared to 14 percent of men (p < .001).
7. The AJD data also contain measures of the types of tasks respondents engage in on their jobs (such as routine work, or work characterized by trust or independence). Initial analyses included these factors as predictors of income (on file with authors), however since none of these items were significant as predictors of income, they are not included in the analyses presented.
8. We relied on Stata ICE to impute five multiply imputed datasets by relying on other variables in the data set; analyses were then conducted in Stata using micombine.
9. According to Table 1, 77 percent of women work in such settings compared to 85 percent of men.

Gender Gap in Lawyers’ Incomes • 851
10. Z tests comparing the coefficients for gender between the large firm and small firm subsamples also indicate that the difference is not significant (Z = 1.83).
References
Allison, Paul. 2001. Missing Data. Sage Publications.American Bar Association. 2005. ‘‘Section on Legal Education, First Year Enrollment
in ABA Approved Law Schools 1947–2004 (Percentage of Women).’’ Accessed at: http://www.abanet.org/legaled/statistics/femstats.html.
Ash, Arlene S., Phyllis L. Carr, Richard Goldstein and Robert Friedman. 2004. “Compensation and Advancement of Women in Academic Medicine: Is There Equity?” Annals of Internal Medicine 141(3):205-14.
Babcock, Linda, and Sara Laschever. 2003. Women Don’t Ask. Princeton University Press.Baker, Joe. G. 2002. “The Influx of Women into Legal Professions: An Economic Analysis.”
Monthly Labor Review 125(8):14-24.Barnes, A. Harrison. 2007. “Firm Culture Matters Most.” Accessed at: http://www.
bcgsearch.com/crc/culture.html. Baron, James N., and William T. Bielby. 1980. “Bringing the Firm Back In: Stratification,
Segmentation, and the Organization of Work.” American Sociological Review 45(5):737-65.Barron, Lisa. 2003. “Ask and You Shall Receive? Gender Differences in Negotiators’
Beliefs and Requests for a Higher Salary.” Human Relations 56(6):635-63.Becker, Gary. 1964. Human Capital. Columbia University Press.Bertrand, Marianne, and Kevin F. Hallock. 2001. “The Gender Gap in Top Corporate
Jobs.” Industrial & Labor Relations Review 55(1):3-21.Bielby, William T., and James N. Baron. 1986. “Men and Women at Work: Sex Segregation
and Statistical Discrimination.” American Journal of Sociology 91(4):759-99.Blair-Loy, Mary, and Amy S. Wharton. 2004. “Mothers in Finance: Surviving and Thriving.”
Annals of the American Academy of Political and Social Science 2004 596(1):151-71.Blau, Francine D., and Marianna A Ferber. 1992. The Economics of Women, Men, and
Work. Prentice Hall.Boulis, Anne. 2004. “The Evolution of Gender and Motherhood in Contemporary Medicine.”
ANNALS of the American Academy of Political and Social Science 596(1):172-206.Boulis, Anne, and Jerry Jacobs. 2008. The Changing Face of Medicine: Women Doctors and
the Evolution of Health Care in America. Routledge.Bowles, Hannah Riley, Linda C. Babcock and Lai Lei. 2007. “Social Incentives for Gender
Differences in the Propensity to Initiate Negotiations: Sometimes It Does Hurt to Ask.” Organizational Behavior and Human Decision Processes 103(1):84-103.
Budig, Michelle J., and Paula England. 2001. “The Wage Penalty for Motherhood.” American Sociological Review 66(2):204-25.
Carson, Clara. 2004. The Lawyer Statistical Report: The U.S. Legal Profession in 2000. Chicago: American Bar Foundation.
Chambliss, Elizabeth, and Christopher Uggen. 2000. “Men and Women of Elite Law Firms: Reevaluating Kanter’s Legacy.” Law & Social Inquiry 25(1):41-68.
Chiu, Charlotte, and Kevin T. Leicht. 1999. “When Does Feminization Increase Equality? The Case of Lawyers.” Law & Society Review 33(3):557-94.

852 • Social Forces 88(2)
Clogg, Clifford, Eva Petkova and Adamantious Haritou. 1995. “Symposium on Applied Regression: Statistical Methods for Comparing Regression Coefficients between Models.” American Journal of Sociology 100(5):1261-93.
Cohen, Philip N., and Matt L. Huffman. 2003. “Individuals, Jobs, and Labor Markets: The Devaluation of Women’s Work.” American Sociological Review 68(3):443-63.
Correll, Shelley J. 2004. “Constraints into Preferences: Gender, Status and Emerging Career Aspirations.” American Sociological Review 69(1):93-113.
Dau-Schmidt, Kenneth, and Kaushik Mukhopadhaya. 1999. “The Fruits of Our Labors: An Empirical Study of the Distribution of Income and Job Satisfaction Across the Legal Profession.” Journal of Legal Education 49(3):342-66.
Dey, Judy Goldberg, and Catherine Hill. 2007. Behind the Pay Gap. Washington, DC: American Association of University Women Educational Foundation.
Dinovitzer, Ronit, and John Hagan. 2006. “Lawyers on the Move: The Consequences of Mobility for Legal Careers.” International Journal of the Legal Profession 13(2):1-17.
Dinovitzer, Ronit, Bryant G. Garth, Richard Sander, Joyce Sterling and Gita Z. Wilder. 2004. “After the JD: First Results of a National Study of Legal Careers.” American Bar Foundation and NALP. Accessed at: http://www.americanbarfoundation.org/afterjd.html.
Dinovitzer, Ronit and Bryant G. Garth. 2007. “Lawyer Satisfaction in the Process of Structuring Legal Careers.” Law & Society Review 41(1):1-50.
Dixon, Jo, and Carroll Seron. 1995. “Stratification in the Legal Profession: Sex, Sector, and Salary.” Law & Society Review 29(3):381-412.
Donovan, Kathleen. 1990. “Women Associates’ Advancement to Partner Status in Private Firms.” Georgetown Journal of Legal Ethics 4(1):135-52.
Dovidio, John F, Steve L. Ellyson, Caroline F. Keating, Karen Heltman and Clifford Brown. 1988. “The Relationship of Social Power to Visual Displays of Dominance Between Mean and Women.” Journal of Personality and Social Psychology 54(2):233-42.
England, Paula, and Melissa S. Herbert, Barbara Stanek Kilbourne, Lori L. Reid and Lori McCreary Megdal. 1994. “The Gendered Value of Occupations and Skills: Earnings in 1980 Census Occupations.” Social Forces 73(1):65-98.
Epstein, Cynthia Fuchs. 1993. Women in Law. University of Illinois Press.Epstein, Cynthia Fuchs, et. al. 1995. “Glass Ceilings and Open Doors: Women’s
Advancement in the Legal Profession.” Fordham Law Review 64(2):306-449.Fernandez, Roberto M., and Celina Su. 2004. “Space in the Study of Labor Markets.”
Annual Review of Sociology 30:545-69.Galanter, Marc S., and William D. Henderson. 2008. “The Elastic Tournament: The
Second Transformation of the Big Law Firm.” Stanford Law Review 60(6): 1867-1930.Galanter, Marc, and Thomas Palay. 1991. Tournament of Lawyers: The Transformation of the Big Law Firm. University of Chicago Press.
Ginsburg, Tom, and Jeffrey A. Wolf. 2004. “The Market for Elite Law Firm Associates.” University of Illinois College of Law, Law and Economics Working Papers. Accessed at: http://works.bepress.com/tom_ginsburg/13.
Ginther, Donna K. 2003. “Is MIT an Exception? Gender Pay Differences in Academic Science.” Bulletin of Science, Technology and Society 23(1):21-26.
Gorman, Elizabeth. 2005. “Gender Stereotypes, Same-Gender Preferences and Organizational Variation in the Hiring of Women: Evidence from Law Firms.” American Sociological Review 70(4):702-28.

Gender Gap in Lawyers’ Incomes • 853
Hagan, John. 1990. “The Gender Stratification of Income Inequality among Lawyers.” Social Forces 68(3):835-55.
Hagan, John, and Fiona Kay. 1995. Gender in Practice: A Study of Lawyers Lives. Oxford University Press.
Hagan, John, Marjorie Zatz, Bruce Arnold, and Fiona Kay. 1991. “Cultural Capital, Gender, and the Structural Transformation of Legal Practice.” Law & Society Review 25(2):239-62.
Hall, Elaine J. 1993. “Waitering/Waitressing: Engendering the Work of the Table Servers.” Gender and Society 7(3):329-46.
Heilman, Madeline E. 2001. “Description and Prescription: How Gender Stereotypes Prevent Women’s Ascent Up the Organizational Ladder.” Journal of Social Issues 57(4):657-74.
Heilman, Madeline E., Aaron S. Wallen, Daniella Fuchs and Melinda M. Tamkins. 2004. “Penalties for Success: Reactions to Women Who Succeed at Male Gender-Typed Tasks.” Journal of Applied Psychology 89(3):416-27.
Heilman, Madeline E., and Tyler G. Okimoto. 2007. “Why Are Women Penalized for Success at Male Tasks?: The Implied Community Deficit.” Journal of Applied Psychology 92(1):81-92.
Heinz, John, and Edward O. Laumann. 1982. Chicago Lawyers: The Social Structure of the Bar. Russell Sage Foundation.
Heinz, John P., and Robert L. Nelson, et al. 2001. ‘‘The Scale of Justice: Observations on the Transformation of Urban Law Practice,’’ Annual Review of Sociology 27:337-62.
Heinz, John P, Robert L. Nelson, Rebecca L. Sandefur and Edward O. Laumann. 2005. Urban Lawyers: The New Social Structure of the Bar. University of Chicago Press.
Henderson, William D. 2006. “An Empirical Study of Single-Tier Versus Two-Tier Partnerships in the Am Law 200.” North Carolina Law Review 84(5):1691-1750.
Henderson, William D., and Alderson, Arthur S. 2008. “The Changing Economic Geography of Large U.S. Law Firms.” Available at: http://ssrn.com/abstract=1134223.
Hersch, Joni. 2003. “The New Labor Market for Lawyers: Will Female Lawyers Still Earn Less?” Cardozo Women’s Law Journal 10(1):1-58.
Hodson, Randy. 1985. “Some Considerations Concerning the Functional Form of Earnings.” Social Science Research 14(4):374-94.
Huang, Wynn R. 1997. “Gender Differences in the Earnings of Lawyers.” Columbia Journal of Law and Social Problems 30(2):267-311.
Huffman, Matt L., and Philip N. Cohen. 2004. “Occupational Segregation and the Gender Gap in Workplace Authority: National versus Local Labor Markets.” Sociological Forum 19(1):121-47.
Hull, Kathleen E., and Robert L. Nelson. 2000. “Assimilation, Choice, or Constraint? Testing Theories of Gender Differences in the Careers of Lawyers.” Social Forces 79(1):229-64.
Jones, F.L., and Jonathan Kelley. 1984. “Decomposing Differences Between Groups: A Cautionary Note on Measuring Discrimination.” Sociological Methods and Research 12(3):323-42.Joy, Lois. 2003. “Salaries of Recent Male and Female College Graduates: Educational and Labor Market Effects.” Industrial and Labor Relations Review 56(4):606-621.
Kalist, David E. 2002. “The Gender Earnings Gap in the RN Labor Market.” Nursing Economics 20(4):155-62.
Kanter, Rosabeth Moss. 1977. Men and Women of the Corporation. Basic Books.Kay, Fiona, and Joan Brockman. 2000. “Barriers to Gender Equality in the Canadian
Legal Establishment.” Feminist Legal Studies 8(2):169-98. .

854 • Social Forces 88(2)
Kay, Fiona, and John Hagan. 2003. “Building Trust: Social Capital, Distributive Justice and Loyalty to the Firm.” Law and Social Inquiry 28(2):483-519.
______. 1998. “Raising the Bar: The Gender Stratification of Law-Firm Capital.” American Sociological Review 63(5):728-43.
______. 1995. “The Persistent Glass Ceiling: Gendered Inequalities in the Earnings of Lawyers.” British Journal of Sociology 46(2):279-310.
Kilbourne, Barbara, Paula England, George Farkas, Kurt Beron and Dorothea Weir. 1994. “Returns to Skill, Compensating Differentials, and Gender Bias: Effects of Occupational Characteristics on the Wages of White Women and Men.” American Journal of Sociology 100(3):689-719.
Koeske, Gary F., and William J. Krowinski. 2004. “Gender Based Inequity in Social Work: Mediators of Gender’s Effect on Salary.” Social Work 49(2):309-17.
Korenman, Sanders, and David Neumark . 1992. “Marriage, Motherhood and Wages.” Journal of Human Resources 27(2):233-55.
Kray, Laura J., and Thompson, Leigh 2005. “Gender Stereotypes and Negotiation Performance: A Review of Theory nd Research.” Research in Organizational Behavior Series 26:103-82.
Lai, Bhavya, Sam Yoon and Ken Carlson. 1999. “How Large is the Gap in Salaries of Male and Female Engineers.” Division of Science Resources Studies Issue Brief. Available at: http://www.nsf.gov/statistics/issuebrf/sib99352.htm.
Leicht, Kevin, and Mary L Fennell. 1997. “The Changing Organizational Context of Professional Work.” Annual Review of Sociology 23:215-31.
Little, Roderick J.A., and Donald B Rubin. 1987. Statistical Analysis with Missing Data. Wiley.Lundberg, Shelly, and Eliana Rose. 2000. “Parenthood and the Earnings of Married Men
and Women.” Labor Economics 7(6):689-710.Major, Brenda, and Ellen Konar. 1984. “An Investigation of Sex Differences in Pay
Expectations and Their Possible Causes.” Academy of Management Journal 27(4):777-92.Marini, Margaret Mooney, and Pi-Ling Fan. 1997. “The Gender Gap in Earnings at
Career Entry.” American Sociological Review 62(4):588-604.Maume, David J. 2004. “Wage Discrimination over the Life Course: A Comparison of
Explanations.” Social Problems 51(4):505-27.McBrier, Debra Branch. 2003. “Gender and Career Dynamics within a Segmented
Professional Labor Market: The Case of Law Academia.” Social Forces 81(4):1201-66.Mincer, Jacob, and Solomon Polachek. 1974. “Family Investments in Human Capital:
Earnings of Women.” Journal of Political Economy 82(2):S76-S108.Morgan, Laurie. 1998. “Glass Ceiling Effect or Cohort Effect? A Longitudinal Study of
the Gender Earnings Gap for Engineers, 1982 to 1989.” American Sociological Review 63(4):479-83.
Morgan, Laurie, and Michelle Arthur. 2002. “Methodological Considerations in Estimating the Gender Pay Gap for Employed Professionals.” Sociological Methods Research 33(3):383-403.
National Law Journal. 2006. “The NLJ 250.” Accessed at: http://www.law.com/jsp/article.jsp?id=1163066718029.
Noonan, Mary C., Mary E. Corcoran and Paul N. Courant. 2005. “Pay Differences Among the Highly Trained: Cohort Difference in the Male-Female Earnings Gap in Lawyers’ Salaries.” Social Forces 84(2):853-72.

Gender Gap in Lawyers’ Incomes • 855
Parloff, Roger. 2007. “The War Over Unconscious Bias.” Fortune 156(8): 90-102.Paternoster, Raymond, Robert Brame, Paul Mazerolle and Alex Piquero. 1998. “Using
the Correct Statistical Test for the Equality of Regression Coefficients.” Criminology 36(4):859-66.
Petersen, Trond, and Laurie A. Morgan. 1995. “Separate and Unequal: Occupation-Establishment Segregation and the Gender Wage Gap.” American Journal of Sociology 101(2):329-65.
Petersen, Trond, and Ishak Saporta. 2004. “The Opportunity Structure of Discrimination.” American Journal of Sociology 109(4):852-901.
Prokos, Anastasia, and Irene Padavic. 2005. “An Examination of Competing Explanations for the Pay Gap among Scientists and Engineers.” Gender & Society 19(4):523-43.
Regan, Milton. 2005. Eat What You Kill: The Fall Of A Wall Street Lawyer. University of Michigan Press.
Reichman, Nancy, and Joyce Sterling. 2002. “Recasting the Brass Ring: Deconstructing and Reconstructing Workplace Opportunities for Women Lawyers.” Capital University Law Review 29(4):923-77.
Reid, Lori L. 1998. “Devaluing Women and Minorities: The Effects of Race/Ethnic and Sex Composition of Occupations on Wage Levels.” Work and Occupations 25(4):511-36.
Reskin, Barbara F. 2003. “Including Mechanisms in Our Models of Ascriptive Inequality.” American Sociological Review 68(1):1-21.
Reskin, Barbara F., and Irene Padavic. 1994. Women and Men at Work. Pine Forge Press.Ridgeway, Cecilia L. 1997. “Interaction and the Conservation of Gender Inequality:
Considering Employment.” American Sociological Review 62(2):218-35.Ridgeway, Cecilia L., and Lynn Smith-Lovin. 1999. “The Gender System and Interaction.”
Annual Review of Sociology 25:191-216.Robinson, Karen, and Jean E. Wallace. 2001. “Gendered Inequalities in Earnings: A Study
of Canadian Lawyers.” Canadian Review of Sociology and Anthropology 38(1):75-95.Rosen, Sherwin. 1992. “The Market for Lawyers.” Journal of Law and Economics 35(2):215-46.Roth, Louise Marie. 2003. “Selling Women Short: A Research Note on Gender Differences
in Compensation on Wall Street.” Social Forces 82(2):783-802.Sandefur, Rebecca L. 2001. “Work and Honor in the Law: Prestige and the Division of
Lawyers’ Labor.” American Sociological Review 66(3):382-403.Schmitt, Kellie. 2006. “More firms lift associate salaries.” The Recorder. Accessed at: http://
www.nylawyer.com/news/06/01/011106a.html.Schultz, Vicki. 1991. “Telling Stories About Women and Work: Judicial Interpretation
of Sex Segregation in the Workplace in Title VII Cases Raising the Lack of Interest Argument.” Pp. 124-43. Feminist Legal Theory. Katharine Bartlett and Rosanne Kennedy, editors. Westview Press.
Skuratowicz, Eva, and Larry W. Hunter. 2004. “Where Do Women’s Jobs Come From? Job Resegregation in an American Bank.” Work and Occupations 31(1):73-110.
Small, Deborah A, Linda C. Babcock, Michele Joy Gelfand and Hilary Gettman. 2007. “Who Goes to the Bargaining Table? The Influence of Gender and Framing on the Initiation of Negotiation.” Journal of Personality and Social Psychology 93(4):600-13.
Sommerlad, Hillary. 2002. “Women Solicitors in a Fractured Profession: Intersections of Gender and Professionalism in England and Wales.” International Journal of the Legal Profession 9(3):213-34.

856 • Social Forces 88(2)
Spraggins, Rachel. 2005. “We the People: Women and Men in the United States.” Census 2000 Special Reports CENSR-20. Washington, DC: US Census Bureau. Available at: http://www.census.gov/prod/2005pubs/censr-20.pdf.
Sterling, Joyce, and Nancy Reichman. 2004. “Sticky Floors, Broken Steps, and Concrete Ceilings in Legal Careers.” Texas Journal of Women and the Law 14(1):27-76.
Treiman, Donald J., and Heidi I. Hartmann. 1981. Women Work and Wages. National Academy Press.
U.S. Census Bureau. 2002. 2000 Decennial Census of the United States, 5% Public Use Microdata Sample. Available at: http://www.census.gov/Press-Release/www/2003/PUMS5.html.
Uzzi, Brian, and Ryon Lancaster. 2004. “Embeddedness and Price Formation in the Corporate Law Market.” American Sociological Review 69(3):319-44.
Valian, Virginia. 1999. Why So Slow? The Advancement of Women. MIT Press.______. 2005. “Beyond Gender Schemas: Improving the Advancement of Women in
Academia.” Hypatia 20(3):198-213.Weeks, William B., and Amy E Wallace. 2007. “Gender Differences in the Annual
Incomes of Psychiatrists.” Psychiatric Services 58(4):515-20.Winship, Christopher, and Larry Radbill. 1994. “Sampling Weights and Regression
Analysis.” Sociological Methods and Research 23(2):230-57.Wood, Robert G., Mary E. Corcoran and Paul N. Courant. 1993. “Pay Differences
Among the Highly Paid: The Male-Female Earnings Gap in Lawyers’ Salaries.” Journal of Labor Economics 11(3):417-41.
Wootton, Barbara H. 1997. “Gender Differences in Occupational Employment.” Monthly Labor Review 120(4):15-24.
Yancey Martin, Patricia. 2003. ““Said and Done” Versus “Saying and Doing”. Gendering Practices, Practicing Gender at Work.” Gender and Society 17(3):342-66.
Zimmerman, Don, and Candace West. 1987. “Doing Gender.” Gender and Society 1(2):13-37.

Gender Gap in Lawyers’ Incomes • 857
Appe
ndix
A. O
rdin
ary L
east
Squ
ares
Reg
ress
ions
(uns
tand
ardi
zed)
Pre
dict
ing
ln(S
alary
), W
omen
Onl
yMo
del 1
Mode
l 2Mo
del 3
Mode
l 4
b
b
b
b
Dem
ogra
phics
Numb
er of
year
s sinc
e bar
admi
ssion
.012
(.032
).01
3(.0
26)
.011
(.025
).00
9(.0
23)
Blac
k.16
7**
(.057
).08
0(.0
42)
.071
(.040
).04
4(.0
37)
Hisp
anic
.000
(.071
).01
6(.0
51)
-.005
(.052
)-.0
47(.0
48)
Asian
.088
(.050
).07
2(.0
37)
.074*
(.035
).01
1(.0
32)
Has c
hildr
en-.0
73(.0
37)
-.050
(.030
)-.0
45(.0
29)
-.004
(.029
)Ma
rried
.009
(.026
)-.0
07(.0
20)
-.017
(.020
).00
7(.0
18)
Over
36 ye
ars o
ld-.0
36(.0
41)
.025
(.036
).04
6(.0
34)
.059
(.031
)Cr
eden
tials
(for l
aw sc
hool
, exc
lude
d ca
tego
ry is
Tier
4)GP
A.45
2***
(.047
).16
4***
(.039
).12
4**
(.038
).13
8 ***
(.037
)Ra
nked
1-10
.569*
**(.0
58)
.219*
**(.0
50)
.180*
**(.0
47)
.099 *
(.047
)Ra
nked
11-2
0.44
2***
(.053
).16
7***
(.043
).14
7***
(.042
).08
6 *(.0
40)
Rank
ed 21
-40
.305*
**(.0
51)
.090*
(.043
).04
0(.0
41)
.012
(.039
)Ra
nked
41-1
00.14
3***
(.042
).02
8(.0
34)
.011
(.032
).00
7(.0
32)
Tier 3
(101
-137
).08
4(.0
47)
-.019
(.037
)-.0
36(.0
35)
-.034
(.035
)W
ork P
rofil
esPr
actic
e Sett
ings (
exclu
ded c
atego
ry is
firm of
2-20
lawy
ers)
Firm
21-1
00.26
9***
(.029
).22
5***
(.029
).23
2 ***
(.028
)Fir
m 10
1-25
0.45
8***
(.034
).37
9***
(.036
).39
2 ***
(.033
)Fir
m 25
1+.61
7***
(.032
).53
9***
(.035
).49
3 ***
(.033
)Pr
actic
e Sett
ing C
hara
cteris
tics
Comp
ensa
tion w
ith bo
nus
.145*
**(.0
30)
.144*
**(.0
29)
.116 *
**(.0
27)
Firm
choic
e (life
style)
.005
(.015
).01
1(.0
15)
.007
(.013
)W
ork h
ours
.001
(.001
).00
1(.0
01)
OIpo
rtuni
ty P
aths
& S
truct
ures
Netw
orkin
gRe
cruitm
ent c
ommi
ttee
.056*
(.029
).06
6 *(.0
27)
Meals
with
partn
ers/
asso
ciates
.020
(.022
).02
0(.0
24)
cont
inued
on
the
follo
wing
pag
e

858 • Social Forces 88(2)
Appe
ndix
A. co
ntinued
Mode
l 1Mo
del 2
Mode
l 3Mo
del 4
b
b
b
b
Re
creati
on w
ith pa
rtner
s-.0
43(.0
24)
-.025
(.029
)Ar
eas o
f Law
Pra
ctice
dGe
nera
l pra
ctice
-.003
*(.0
01)
-.002
*(.0
01)
Antitr
ust
.002
(.001
).00
2(.0
01)
Bank
ruptc
y.00
1(.0
01)
.001 *
(.001
)Ci
vil lit
igatio
n.00
1(.0
00)
.001
(.000
)Co
mmer
cial la
w-.0
01(.0
01)
-.001
(.001
)Em
ploym
ent la
w ma
nage
ment
.000
(.001
).00
0(.0
01)
Fami
ly law
-.001
*(.0
01)
-.001
(.001
)Ge
nera
l cor
pora
te.00
1(.0
01)
.001
(.001
)Int
ellec
tual p
rope
rty.00
2***
(.000
).00
2 ***
(.000
)Pe
rsona
l injur
y plai
ntiff
-.002
**(.0
01)
-.001
*(.0
01)
Perso
nal in
jury d
efens
e-.0
02**
(.001
)-.0
02 **
(.001
)Pr
obate
-.001
(.001
)-.0
01(.0
01)
Real
estat
e com
merci
al.00
0(.0
01)
.000
(.001
)Re
al es
tate p
erso
nal
-.003
*(.0
01)
-.003
*(.0
01)
Secu
rities
.002*
*(.0
01)
.002 *
*(.0
01)
Lega
l Mar
kets
(exc
lude
d ca
tego
ry is
Ore
gon)
New
York
City
.402 *
**(.0
48)
Distr
ict of
Colu
mbia
.332 *
**(.0
47)
Chica
go.25
6 ***
(.049
)Lo
s Ang
eles
.311 *
**(.0
45)
San F
ranc
isco
.336 *
**(.0
52)
Bosto
n.22
7 ***
(.065
)At
lanta
.222 *
**(.0
49)
Hous
ton.22
8 ***
(.053
)Mi
nnea
polis
.083
(.054
)Co
nnec
ticut
.167 *
*(.0
60)
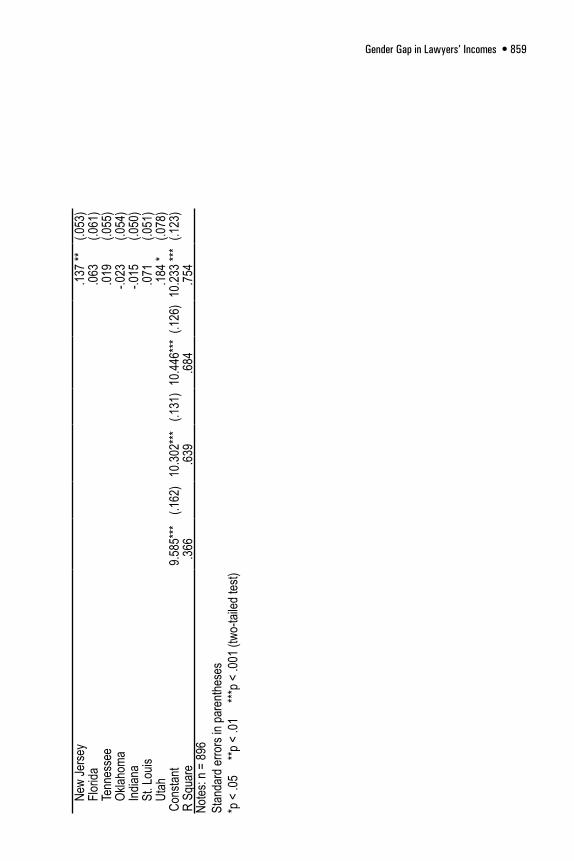
Gender Gap in Lawyers’ Incomes • 859
New
Jerse
y.13
7 **
(.053
)Flo
rida
.063
(.061
)Te
nnes
see
.019
(.055
)Ok
lahom
a-.0
23(.0
54)
Indian
a-.0
15(.0
50)
St. L
ouis
.071
(.051
)Ut
ah.18
4 *(.0
78)
Cons
tant
9.585
***(.1
62)
10.30
2***
(.131
)10
.446*
**(.1
26)
10.23
3 ***
(.123
)R
Squa
re.36
6
.639
.68
4
.754
No
tes: n
= 89
6St
anda
rd er
rors
in pa
renth
eses
*p <
.05
**p
< .0
1 *
**p <
.001
(two
-taile
d tes
t)
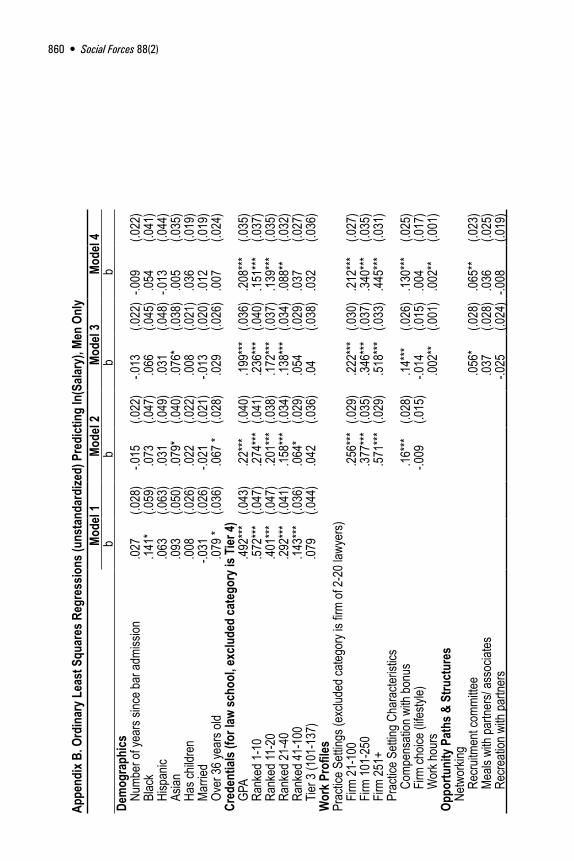
860 • Social Forces 88(2)
Appe
ndix
B. O
rdin
ary L
east
Squ
ares
Reg
ress
ions
(uns
tand
ardi
zed)
Pre
dict
ing
ln(S
alary
), Me
n On
lyMo
del 1
Mode
l 2Mo
del 3
Mode
l 4
b
b
b
b
Dem
ogra
phics
Numb
er of
year
s sinc
e bar
admi
ssion
.027
(.028
)-.0
15(.0
22)
-.013
(.022
)-.0
09(.0
22)
Blac
k.14
1*(.0
59)
.073
(.047
).06
6(.0
45)
.054
(.041
)Hi
span
ic.06
3(.0
63)
.031
(.049
).03
1(.0
48)
-.013
(.044
)As
ian.09
3(.0
50)
.079*
(.040
).07
6*(.0
38)
.005
(.035
)Ha
s chil
dren
.008
(.026
).02
2(.0
22)
.008
(.021
).03
6(.0
19)
Marri
ed-.0
31(.0
26)
-.021
(.021
)-.0
13(.0
20)
.012
(.019
)Ov
er 36
year
s old
.079 *
(.036
).06
7 *(.0
28)
.029
(.026
).00
7(.0
24)
Cred
entia
ls (fo
r law
scho
ol, e
xclu
ded
cate
gory
is T
ier 4)
GPA
.492*
**(.0
43)
.22***
(.040
).19
9***
(.036
).20
8***
(.035
)Ra
nked
1-10
.572*
**(.0
47)
.274*
**(.0
41)
.236*
**(.0
40)
.151*
**(.0
37)
Rank
ed 11
-20
.401*
**(.0
47)
.201*
**(.0
38)
.172*
**(.0
37)
.139*
**(.0
35)
Rank
ed 21
-40
.292*
**(.0
41)
.158*
**(.0
34)
.138*
**(.0
34)
.088*
*(.0
32)
Rank
ed 41
-100
.143*
**(.0
36)
.064*
(.029
).05
4(.0
29)
.037
(.027
)Tie
r 3 (1
01-1
37)
.079
(.044
).04
2(.0
36)
.04(.0
38)
.032
(.036
)W
ork P
rofil
esPr
actic
e Sett
ings (
exclu
ded c
atego
ry is
firm of
2-20
lawy
ers)
Firm
21-1
00.25
6***
(.029
).22
2***
(.030
).21
2***
(.027
)Fir
m 10
1-25
0.37
7***
(.035
).34
6***
(.037
).34
0***
(.035
)Fir
m 25
1+.57
1***
(.029
).51
8***
(.033
).44
5***
(.031
)Pr
actic
e Sett
ing C
hara
cteris
tics
Comp
ensa
tion w
ith bo
nus
.16***
(.028
).14
***(.0
26)
.130*
**(.0
25)
Firm
choic
e (life
style)
-.009
(.015
)-.0
14(.0
15)
.004
(.017
)W
ork h
ours
.002*
*(.0
01)
.002*
*(.0
01)
Oppo
rtuni
ty P
aths
& S
truct
ures
Netw
orkin
gRe
cruitm
ent c
ommi
ttee
.056*
(.028
).06
5**
(.023
)Me
als w
ith pa
rtner
s/ as
socia
tes.03
7(.0
28)
.036
(.025
)Re
creati
on w
ith pa
rtner
s-.0
25(.0
24)
-.008
(.019
)
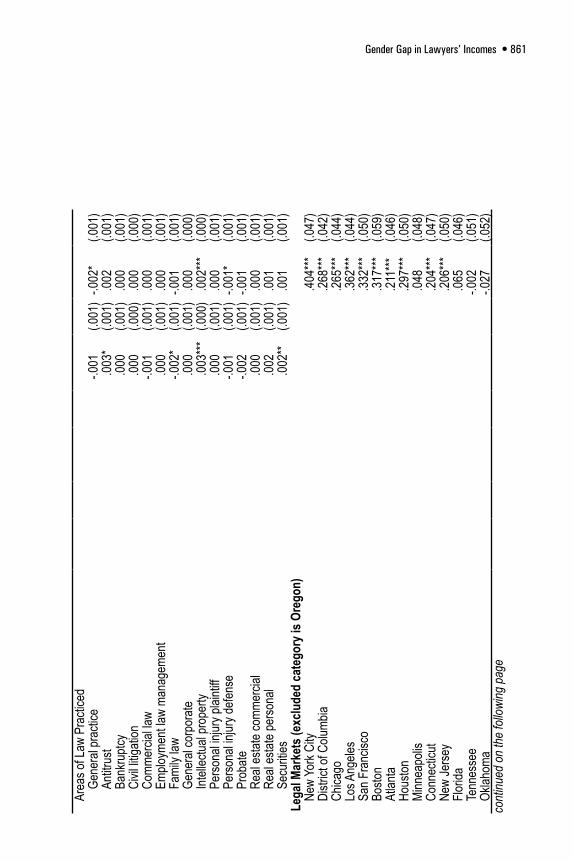
Gender Gap in Lawyers’ Incomes • 861
Area
s of L
aw P
racti
ced
Gene
ral p
racti
ce-.0
01(.0
01)
-.002
*(.0
01)
Antitr
ust
.003*
(.001
).00
2(.0
01)
Bank
ruptc
y.00
0(.0
01)
.000
(.001
)Ci
vil lit
igatio
n.00
0(.0
00)
.000
(.000
)Co
mmer
cial la
w-.0
01(.0
01)
.000
(.001
)Em
ploym
ent la
w ma
nage
ment
.000
(.001
).00
0(.0
01)
Fami
ly law
-.002
*(.0
01)
-.001
(.001
)Ge
nera
l cor
pora
te.00
0(.0
01)
.000
(.000
)Int
ellec
tual p
rope
rty.00
3***
(.000
).00
2***
(.000
)Pe
rsona
l injur
y plai
ntiff
.000
(.001
).00
0(.0
01)
Perso
nal in
jury d
efens
e-.0
01(.0
01)
-.001
*(.0
01)
Prob
ate-.0
02(.0
01)
-.001
(.001
)Re
al es
tate c
omme
rcial
.000
(.001
).00
0(.0
01)
Real
estat
e per
sona
l.00
2(.0
01)
.001
(.001
)Se
curiti
es.00
2**
(.001
).00
1(.0
01)
Lega
l Mar
kets
(exc
lude
d ca
tego
ry is
Ore
gon)
New
York
City
.404*
**(.0
47)
Distr
ict of
Colu
mbia
.268*
**(.0
42)
Chica
go.26
5***
(.044
)Lo
s Ang
eles
.362*
**(.0
44)
San F
ranc
isco
.332*
**(.0
50)
Bosto
n.31
7***
(.059
)At
lanta
.211*
**(.0
46)
Hous
ton.29
7***
(.050
)Mi
nnea
polis
.048
(.048
)Co
nnec
ticut
.204*
**(.0
47)
New
Jerse
y.20
6***
(.050
)Flo
rida
.065
(.046
)Te
nnes
see
-.002
(.051
)Ok
lahom
a-.0
27(.0
52)
cont
inued
on
the
follo
wing
pag
e

862 • Social Forces 88(2)
Appe
ndix
B. co
ntinued
Mode
l 1Mo
del 2
Mode
l 3Mo
del 4
b
b
b
b
Ind
iana
.029
(.049
)St
. Lou
is.02
9(.0
47)
Utah
.118*
(.048
)Co
nstan
t9.5
16***
(.141
)10
.128*
**(.1
32)
10.09
1***
(.121
)9.9
54***
(.124
)R
Squa
re.36
1
.589
.62
5
.697
No
tes: n
= 12
12St
anda
rd er
rors
in pa
renth
eses
*p <
.05
**p
< .0
1 *
**p <
.001
(two
-taile
d tes
t)
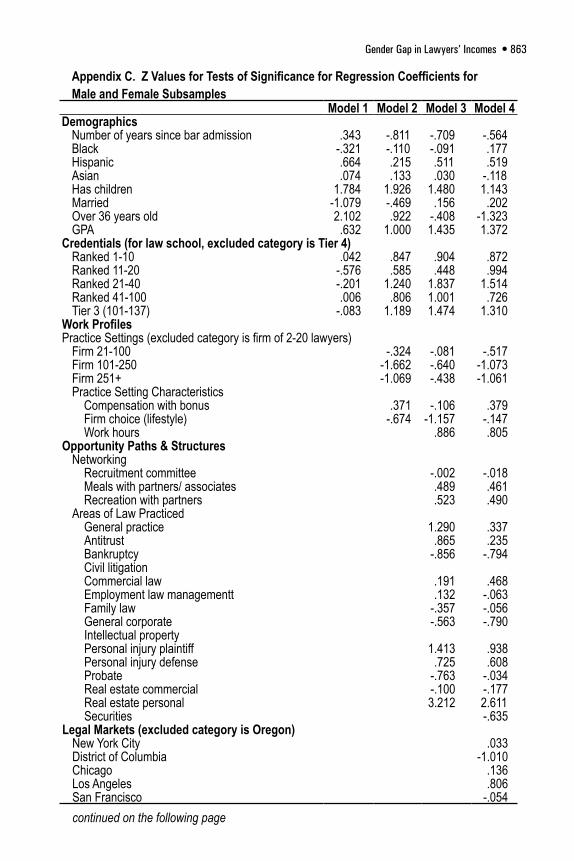
Gender Gap in Lawyers’ Incomes • 863
Appendix C. Z Values for Tests of Significance for Regression Coefficients for Male and Female Subsamples
Model 1 Model 2 Model 3 Model 4Demographics
Number of years since bar admission .343 -.811 -.709 -.564Black -.321 -.110 -.091 .177Hispanic .664 .215 .511 .519Asian .074 .133 .030 -.118Has children 1.784 1.926 1.480 1.143Married -1.079 -.469 .156 .202Over 36 years old 2.102 .922 -.408 -1.323GPA .632 1.000 1.435 1.372
Credentials (for law school, excluded category is Tier 4)Ranked 1-10 .042 .847 .904 .872Ranked 11-20 -.576 .585 .448 .994Ranked 21-40 -.201 1.240 1.837 1.514Ranked 41-100 .006 .806 1.001 .726Tier 3 (101-137) -.083 1.189 1.474 1.310
Work ProfilesPractice Settings (excluded category is firm of 2-20 lawyers)
Firm 21-100 -.324 -.081 -.517Firm 101-250 -1.662 -.640 -1.073Firm 251+ -1.069 -.438 -1.061Practice Setting Characteristics
Compensation with bonus .371 -.106 .379Firm choice (lifestyle) -.674 -1.157 -.147Work hours .886 .805
Opportunity Paths & StructuresNetworking
Recruitment committee -.002 -.018Meals with partners/ associates .489 .461Recreation with partners .523 .490
Areas of Law PracticedGeneral practice 1.290 .337Antitrust .865 .235Bankruptcy -.856 -.794Civil litigationCommercial law .191 .468Employment law managementt .132 -.063Family law -.357 -.056General corporate -.563 -.790Intellectual propertyPersonal injury plaintiff 1.413 .938Personal injury defense .725 .608Probate -.763 -.034Real estate commercial -.100 -.177Real estate personal 3.212 2.611Securities -.635
Legal Markets (excluded category is Oregon)New York City .033District of Columbia -1.010Chicago .136Los Angeles .806San Francisco -.054continued on the following page

864 • Social Forces 88(2)
Appendix C. continued Model 1 Model 2 Model 3 Model 4
Boston 1.027Atlanta -.160Houston .952Minneapolis -.480Connecticut .490New Jersey .944Florida .022Tennessee -.285Oklahoma -.060Indiana .632St. Louis -.611Utah -.720