the diffusion of mobile phones and its impact on financial
TRANSCRIPT

The Diffusion of Mobile Phones and its Impact on Financial Inclusion and Economic
Growth in Africa
Authors
Maria Lundqvist
Frida Erlandsson
Supervisor
Pontus Hansson
Master Thesis
Department of Economics
Spring 2014
2
Abstract
The aim of this paper is to examine the effect of mobile phone penetration on economic growth,
both directly and through the channel of financial inclusion. Based on a sample of 44 African
countries during the period 2000-2011, the relationship between mobile phone penetration,
captured by the number of mobile phone subscribers per capita, and economic growth is
analysed. Using a dynamic panel data model, the System Generalized Method of Moments
(GMM) estimator addresses issues of endogeneity. Further, the African “mobile revolution” in
combination with the continent’s large financial infrastructure gap raises an interest to investigate
whether financial inclusion can act as a channel through which mobile phone development
influences economic growth. The role of mobile phone deployment for financial inclusion is
therefore estimated by including variables measuring access to financial services, namely the
number of deposits and loans per capita by commercial banks, respectively. The results show that
mobile phone penetration has an unambiguously beneficial impact on economic growth in
African countries, and a part of the positive effect is channelized through financial inclusion.
Key words: Africa, Economic growth, Generalized methods of moments, Financial development, Financial
inclusion, Mobile financial services, Mobile phone penetration
3
Table of Contents
1. Introduction 4
2. Background 8 2.1 The Diffusion of Mobile Phones and its New Field of Application 8
2.1.1 Mobile Financial Services throughout Africa 8 2.1.2 Business Models of Mobile Financial Services 9
2.2 Financial Inclusion 9
3. Theoretical Framework 11 3.1. The Development of ICT and Economic Growth 11 3.2 Financial Inclusion and Economic Growth 13
3.2.1 The Current Stage of Financial Inclusion 14 3.2.2 Determinants of Financial Inclusion 15
4. Previous Empirical Studies 16 4.1 The Development of ICT and Economic Growth 16 4.2 Financial Inclusion and Economic Growth 17 4.3 Determinants of Financial Inclusion 18
5. Data and Methodology 18 5.1 Econometric Specification 18
5.1.1 Regression Model 1: Mobile Phone Penetration and Economic Growth 18 5.1.2 Regression Model 2: Mobile Phone Penetration and Financial Inclusion 19
5.2 Regression estimators 20 5.2.1 System GMM 20 5.2.2 Fixed Effects or Random Effects Estimator 22
5.3 Data 22 5.3.1 Variable construction 23
6. Results 26 6.1 Mobile Phone Penetration and Economic Growth 28 6.2 Taking Financial Inclusion into Account 29 6.3 Assessing the Impact of Mobile Phone Penetration on Financial Inclusion 31
7. Analysis 32
8. Conclusion 36
9. References 38
Appendix 1 41
Appendix 2 42
Appendix 3 43
Appendix 4 44
Appendix 5 45

4
Figures and Tables
Figure 1: Mobile Money Deployments in Africa (March 2012) 9
Figure 2: Account at a Formal Financial Institution (% age 15+, 2011 10
Figure 3: Correlation Scatterplot, Mobile Phone Subscribers and GDP per capita 44
Figure 4: Correlation Scatterplot, Mobile Phone Subscribers (< 1 per capita) and GDP per capita (excl. 90th percentile high income countries) 44
Figure 5: Correlation Scatterplot, Mobile Phone Subscribers and Deposit Accounts 44
Figure 6: Correlation Scatterplot, Mobile Phone Subscribers and Loan Accounts 44
Table 1: Channels through which ICT affects Economic Growth 12
Table 2: Summary Statistics (2000-2011) 26
Table 3: Average Annual Growth Rate Depending on Income Level (2000-2011) 27
Table 4: Mobile Phone Penetration and Economic Growth 28
Table 5: Mobile Phone Penetration, Financial Inclusion and Economic Growth 30
Table 6: Financial Inclusion and Mobile Phone Penetration 31
Table 7: Sample of 44 African Countries 41
Table 8: Low Income Countries, 10th Percentile 41
Table 9: High Income Countries, 90th Percentile 41
Table 10: Variable Definition and Source 42
Table 11: Correlation Matrix, Logged Variables 43
Table 12: Mobile Phone Penetration, Financial Inclusion and Economic growth 45

5
1. Introduction
Only a few years ago, mobile banking seemed futuristic and far-off, limited by the perception of a
tool that enabled people to make short phone calls and write simple messages. The recent
“mobile revolution” in combination with technological advancements has not only allowed the
majority of the global population to call or write messages, it has in a much broader sense
transformed the way we live, work and communicate. One of the latest high-impact
breakthroughs related to mobile phones is the possibility to access banking services and carry out
monetary transactions through the mobile device, which has become known as mobile financial
services. The flourishing technological development has however not been reflected in the
inclusion of people into the financial sector. Half of the adult population worldwide remains
financially excluded, meaning that they do not have access to a formal bank account (Demirgüc-
Kunt and Klapper, 2013). However, it has been estimated that more than 2 billion out of the 2.5
billion unbanked individuals already own a mobile phone. Thus, by combining mobile phone
expansion, the rise of mobile financial services and the existing large financial infrastructure gap,
it all together reveals tremendous potential for previously underserved groups to gain access to
the formal financial sector.
Although many parts of the world have experienced rapid growth in the number of mobile
phone users during the last decade, turning our eyes to the African continent paints an even
brighter picture, with the numbers of mobile phone subscribers surging from 39 percent in 2008
to 72 percent in 2012 (ITU, 2013). Adding the fact that large segments of the world’s unbanked
population are living in African countries, the potential for mobile phone development to
contribute to greater financial inclusion enlarges even further. The low levels of financial
inclusion in relation to the large number of mobile phone raises the interest to investigate
whether an expansion of mobile phone deployment and mobile financial services can contribute
to greater financial inclusion. As more people gain access to formal financial services, the size of
the financial sector increases, which in turn contributes to economic growth. Thus, in order to
influence policymakers to promote and facilitate mobile phone development and its related
financial services, there is a need for broad-scaled evidence on the positive effect on financial
inclusion, and subsequently on economic growth. Accordingly, this paper represents an attempt
to provide a starting point for the discussion of the relevancy of mobile communications on
countries’ economic growth.
The purpose of this study is twofold. Firstly, it examines the effects of mobile phone penetration
on economic growth in 44 African countries between 2000 and 2011. Secondly, once this
relationship is established, the study investigates whether financial inclusion is one of the
channels through which mobile phone penetration affects economic growth. In particular, this
paper addresses the following questions: What impact does mobile phone penetration has on economic
growth in Africa? Does financial inclusion function as a channel through which mobile phone penetration affects
economic growth?
Demographic changes in combination with the rise of the world’s middle class have reshaped the
global financial landscape. The concept of financial inclusion has in particular been highlighted
and gained momentum in the recent years’ global policy discussions (see for example World

6
Bank, 2014; IMF, 2014; FI2020, 2013). Due to its previously neglected role in financial
development and economic growth, attempts to examine the impact on financial inclusion have
been scarce. The lack of data and inadequate measures of financial inclusion (prior to 2011, when
the World Bank launched the Global Financial Inclusion database, Global Findex), have further
hampered research within this field. Consequently, previous studies have either been limited to
cross-sectional analysis, only capturing the current situation at a certain point in time, or to
country-specific case studies, only assessing the effects within a certain country. Analysis of
financial inclusion based on panel data is thus very rare, and when it comes to financial inclusion
in combination with technological advancements, the literature becomes even scarcer. However,
an exception is made by Andrianaivo and Kpodar (2012), who have made a first attempt to assess
the impact of information and communication technologies (ICT) on financial inclusion and
economic growth, in a sample of African countries. The study is nevertheless based on a set of
critical assumptions, which affects the reliability of the results. Yet, it opens up the door for
further research – something this study takes stand on.
The reason for studying African countries is because of its recent explosive growth of mobile
phone penetration rates in combination with an underdeveloped physical financial infrastructure.
Mobile financial services can thereby function as a substitute for tangible bank branches, creating
opportunities for people living in rural and remote areas to benefit from gaining access to the
financial system. It can further be seen as a first step into the financial sector, opening up doors
to other forms of formal financial services.
In addition to mobile phone penetration, this study also controls for other ICT variables such as
the number of fixed telephone lines, the price of fixed and mobile calls, broadband subscribers
and Internet users. The underlying hypothesis being that mobile phone penetration is the variable
with the greatest impact on economic growth in Africa, since: (i) mobile phone deployments have
grown substantially in recent years, (ii) the use of Internet is still poor, and (iii) mobile financial
services are growing. It has been highlighted that 80 percent of the Internet users in sub-Saharan
Africa use their mobile phones to access Internet and mobile connections in Africa are further
expected to grow at 21 percent annually between 2012 and 2016, revealing even greater potential
for further Internet access (World Economic Forum, 2014).
The relationship between mobile phone penetration and economic growth is examined through
the System Generalized Method of Moments (GMM) estimator, which will be referred to as
Model 1. A distinctive feature of this estimator is its possibility to control for issues of
endogeneity that arise when variables are assumed to be determined within the model.
Furthermore, the relationship between mobile phone penetration and financial inclusion is
estimated by incorporating measures of financial inclusion, namely the number of deposits and
loans at commercial banks, into the growth model. The hypothesis is that the coefficient of
mobile phone penetration should weaken once financial inclusion is included in the regression,
suggesting that financial inclusion acts as a channel through which mobile phone penetration
affects economic growth. To more explicitly investigate the determinants of financial inclusion
and its correlation with mobile phone development, a complementary regression model based on
a fixed effect estimator, referred to as Model 2, is specified and analysed.
7
The empirical evidence presented in this study shows that mobile phone penetration has a
positive and significant effect on economic growth in a sample of African countries during the
period 2000-2011. The findings further suggest that part of the positive effect is channelized
through deeper financial inclusion, revealing new evidence on the indirect contribution from
mobile phone development on economic growth. In turn, this dissertation points to the short
run benefits that increased levels of mobile phone penetration may facilitate for previously
financially underserved groups, thus narrowing the financial infrastructure gap currently present
in many African countries. Turning to the long run effects, greater financial inclusion can
possibly help to alleviate poverty and enhance inclusive growth.
Economic growth – usually measured as the annual growth in a country’s gross domestic product
(GDP) – is considered to be the main determinant of the material well-being of billions of people
around the globe (Aghion and Howitt, 2009). Economic growth is a long-term concept and
estimations over shorter time periods tend to capture business cycles rather than the underlying
growth trend. Being aware of this, the time dimension in this study may be on the short side as it
only covers the period 2000-2011 – although it includes the relevant period for studying mobile
phone development. The macroeconomic impacts of financial inclusion and mobile phone
penetration are of main interest in this paper, implying no further analysis of microeconomic
effects or business opportunities related to the expansion of mobile financial services. Neither is
the inequality dimension explicitly studied, and since focus lies on the African continent, other
regions go beyond the scope of this paper as well. In addition, although projections about the
future effects of mobile phone penetration could be interesting to estimate, this type of forecast
will not be conducted, yet touched upon when in later chapter analysing the trend of mobile
phone developments and financial inclusion.
Chapter 1 has outlined the aim of the thesis. Chapter 2 will present the background of mobile
phone development, its application and potential for financial inclusion, as well as the current
state of financial inclusion and how it contributes to economic growth. Chapter 3 will describe
the theoretical framework laying the ground for this paper, whereas Chapter 4 will account for
empirical studies within the field of mobile phone penetration, financial development, and
financial inclusion in Africa and worldwide. Chapter 5 will describe the data and the methodology
used to address the research questions. Chapter 6 will outline the main results and Chapter 7 will
further discuss these findings. Lastly, this paper ends with conclusions in Chapter 8.

8
2. Background
This chapter will present relevant background information on the diffusion of mobile phones,
mobile financial services and financial inclusion, whereas the upcoming two chapters will go
deeper into theoretical and empirical previous research.
2.1 The Diffusion of Mobile Phones and its New Field of Application
In recent years, and all over the world, mobile phone penetration has grown rapidly. The growth
in Africa has however been exceptional, with figures surging from 39 percent in 2008 to 72
percent in 2012 (ITU 2013). The diffusion of mobile phones is particularly beneficial in low- and
middle-income countries where the information and communication technology (ICT)
infrastructure is poor. Furthermore, new technological solutions does no longer limit the use of
mobile phones to calls and messages, but has made mobile financial services such as mobile
payments and mobile banking possible.
2.1.1 Mobile Financial Services throughout Africa
The rapid growth of mobile financial services in Africa has enabled millions of people previously
excluded from the financial system to carry out financial transactions in a relatively cheap, secure
and reliable way. Today, Africa has more than 56 mobile money deployments in place, with Sub-
Saharan Africa accounting for 45 percent of the world’s total mobile money deployments
(Pénicaud and Katakam, 2014; GSMA, 2014). In Kenya, 68 percent of the adults reported that
they had used mobile financial services during the year 2011, out of which 43 percent did not had
a formal bank account (Demirgüc-Kunt and Klapper, 2012).
One of the most renowned mobile financial service providers is M-Pesa, the Kenyan pioneer
launched in 2007. As of today, M-Pesa employs around 27,000 agents handling more than 30
million transactions on a daily basis. Another important player is M-Kesho, an interest-earning
bank-integrated mobile savings system, also based in Kenya and introduced in March 2010. At
the time of its commercialization, it unlocked a new field of application for mobile money
(Demombynes and Thegeya, 2012). Moreover, mobile network operators and banking groups
within the West African Economic and Monetary Union (WAEMU) jointly offer mobile financial
services, currently available in six out of eight countries in the region. Although the average
mobile penetration rate is around 40 percent, more than 95 percent of the population remain
excluded from formal financial services, pointing towards the great promises held by the
development of mobile financial services. However, in South Africa, mobile financial services are
widely used and the country has currently six deployments in place. Likewise, in Tanzania, mobile
financial services were introduced in 2007 and since then, more than 4.3 billion transactions have
been carried out. The Bank of Tanzania is further a strong promoter of developing these
financial services to go beyond transactions between individuals (i.e. micro savings, micro
insurance, and micro credits) and also come to include business-to-consumer-, as well as
business-to-business transactions (Faye and Triki, 2013).

9
Figure 1 below displays the number of mobile money deployments in East and West Africa. The
figure reveals a widespread pattern, with Nigeria holding the largest number of mobile money
deployments (10), followed by Uganda (7), and South Africa (6).
2.1.2 Business Models of Mobile Financial Services
Mobile financial services can be delivered through three different business models: (i) a bank
focused model, which refers to traditional banks providing banking services to its existing customers
through “non-traditional low cost delivery” such as internet banking and mobile phone banking,
(ii) a bank-led model, offering opportunities to carry out financial transactions through either retail
agents such as post offices, supermarkets, and petrol stations, or simply through mobile phones,
and (iii) a non-bank-led model, where a non-bank entity, often a telecom operator, manage the
account functions. The two latter models hold the greatest potential to increase financial
inclusion since they are able to reach previously underserved or financially excluded individuals
(Faye and Triki, 2013).
2.2 Financial Inclusion
Having introduced the diffusion of mobile phones and its new field of application, this section
turns to financial inclusion, usually defined as the proportion of individuals and firms that have
access to or use financial services (World Bank, 2014). Access to financial services refers to the
possibility of using financial services, whereas use means the actual use of the services. Evidently,
they measure different aspects of economic activities (Beck et al., 2007). Within the framework of
this study, due to data availability, financial inclusion is considered in terms of access.
Figure 1: Mobile Money Deployments in Africa (March 2012)
Source: GSMA Mobile Money Tracker, 2012.

10
Financial inclusion has recently gained momentum among policymakers worldwide. However,
despite being put on the top of the global reform agenda – and bearing in mind the rapid growth
of mobile phone users and the substantial diffusion of mobile money deployments – the financial
systems in the world today are far from inclusive. Lacking access to bank account is one of the
most identifiable obstacles to financial inclusion, illustrated in Figure 2 below. As the map reveals,
Africa lags behind other regions in terms of financial inclusion; being the continent with the
lowest rates of account penetration, indicated by brighter colours.
Recent studies have shown that half of the adult population in the world, 2.5 billion people, are
so-called unbanked, meaning that they do not have access to a bank account at a formal financial
institution (Demirgüc-Kunt and Klapper, 2013; Chaia et al., 2013). Besides, out of the people that
do have access, only seven percent use their bank accounts actively. This great disparity between
access and use accentuates that financial inclusion is more than just “banking the unbanked”.
Further, substantial differences exist both across and within countries. The level of economic
development have been identified as the main source of disparities between countries, and for
within-country differences, income seem to be the major determinant; youth, individuals living in
rural areas or with poor educational backgrounds are particularly exposed to financial exclusion
(Kathuria et al., 2009).
The main barriers to access to formal financial accounts are costs, distances and bureaucracy
(World Bank, 2014). All these factors are useful to identify market failures and provide policy
makers with guidelines on financial policies. People in the world’s poorest regions would have
much to gain from getting access to financial services, but market failures or inadequate policies
prevent it. In addition, access to a formal bank account is not the only critical issue, but also
access to credit and insurance. In 2012, only 17 percent of all individuals worldwide had personal
insurance and nine percent had access to formal credit (FI2020, 2013). Moreover, financial
inclusion can contribute to alleviate poverty and boost prosperity (see for example Chaia et al.,
Figure 2: Account at a Formal Financial Institution (% age 15+, 2011
Source: Demirgüc-Kunt and Klapper, 2012.

11
2013; Kumar, 2013). Despite clear evidence, efforts to create a well-designed and customized
system must not be underscored. Policies should be carefully created so as to maximize the
welfare benefits of financial inclusion, to enhance the “stability and inclusiveness of the global
financial system” (World Bank, 2014). Nevertheless, the low level of financial inclusion in Africa
is reflected in constraints on both the demand and the supply side of the economy. Existing
financial systems are underdeveloped, credit reporting from financial institutions is lacking and
the level of financial literacy is often poor. Financial inclusion is further limited by low-quality
financial infrastructure and the small size of many African economies. However, things are about
to change. Innovative use of ICT has made management of large numbers of small transactions
easier and the delivery of financial services in remote areas cheaper. Africa’s recent surge in
mobile phone penetration looks promising for future progress towards greater financial inclusion
(Faye and Triki, 2013).
3. Theoretical Framework
Turning to previous studies on mobile phone development and financial inclusion, this chapter
will present the theoretical framework, whereas the next chapter will account for previous
empirical work. The mechanisms through which information and communication technologies
(ICT) affect economic growth will be described, followed by the channels through which
financial inclusion influences economic growth, and lastly will the possible determinants of
financial inclusion be discussed.
3.1. The Development of ICT and Economic Growth
According to the definition presented by Grace et al. (2003, p.2), ICT are “tools that facilitate the
production, transmission, and processing of information”. The mobile phone device is a relatively recent
phenomenon that had its breakthrough during the late 1990s. Previous researches that have
investigated the effects of ICT on economic growth have therefore mainly been focused on fixed
phones, radio and television. The relationship between these older forms of ICT and economic
growth is however relevant for mobile phone penetration as well, since the mechanisms through
which fixed and mobile phones affect growth are very similar (Andrianaivo and Kpodar, 2012).
Therefore, this section takes a wider perspective on ICT development and its effects on
economic growth.
Telecommunication affects growth through network externalities; the value of a telephone line
increases exponentially as the number of users grows but in order to have effect on economic
growth, a certain threshold level1 must first be reached (Grace et al., 2003). Thus, benefits from
ICT development have previously been restricted to high-income countries since resources in
low- and middle-income ones have been insufficient to reach such a threshold. On the contrast,
recent research suggest that low- and middle-income countries may also gain from ICT
development, as it is valued with the same importance as basic utilities such as water, electricity
and transport (Andrianaivo and Kpodar, 2012). According to Waverman et al. (2005),
1 A penetration rate of 40 telephone lines per 100 people has sometimes been set as a threshold (Röller and Waverman, 2001).

12
telecommunication networks are part of the social overhead capital, having the same
characteristics as education, health services, and roads; the common denominator being that
social return is higher than private return. Thereby, ICT is considered to have similar positive
externalities as public infrastructure.
Turning to the economic benefits of ICT, which can be either of direct or indirect nature. Lewin
and Sweet (2005) argue that the direct effects arise from the supply of telecommunication services,
whereas the indirect effects stems from the use of such services. The mechanisms through which
ICT development affects growth are presented in Table 1 below.
Table 1: Channels through which ICT affects Economic Growth
Direct Effects Indirect Effects
Increased employment and demand Productivity gains and reduced transaction costs
Higher government revenues Rural development and opportunities for women
Improved balance of payments Financial inclusion
Source: Andrianaivo and Kpodar, 2012.
Looking at the direct effects of increased supply of ICT, it can have a positive impact on
employment and demand, government revenues, foreign direct investment (FDI) and countries’
balance of payments. Job opportunities are created as the supply of ICT increases since there is a
growing need for support functions such as network builders, system managers, and
manufactures. Domestic demand is consequently increased as more people are employed and
suggestively receive a higher income. Furthermore, government revenues increase through the
collection of various taxes such as value added tax (VAT), income taxes, and corporate taxes.
Moreover, FDI increases due to foreign interest in domestic ICT development, which in turn has
positive effects on the balance of payments. A more developed ICT system attracts further FDI,
resulting in even higher investment rates, creating more job opportunities and government
revenues, all contributing to higher economic growth (Datta and Ararwal, 2004).
Turning to the indirect effects of ICT development, these include stimulation of capital
accumulation, increased firm productivity, better and larger markets, rural development,
empowering of women, and deeper financial inclusion.
More developed ICT systems have positive effects on rural development since it allows dispersed
families to stay in touch, which reduces vulnerability and isolation. Better information flows
further improve farmer’s bargaining power, reduce the use of intermediaries, and make the
development of economic activities that are non-agricultural possible (Andrianaivo and Kpodar,
2012). In addition, ICT development may be particularly beneficial for women since they often
lack the collaterals needed to open a formal bank account. The potential of raising the power of
women by making them financially independent is further an important aspect of financial
inclusion (GSMA mWomen 2013).
Furthermore, financial inclusion, as a channel through which mobile phone penetration may
affect economic growth, is of main interest for this study. Innovative use of ICT makes

13
management of large amounts of small transactions much cheaper (Faye and Triki, 2013). It has
thus become profitable for actors to offer such services, which previously required transactions
of larger size in order to be gainful. Furthermore, mobile financial services may play a crucial role
in fostering financial inclusion. Meanwhile, unbanked people are not necessarily financially
excluded. Despite not having access to a formal bank account, an individual can still have access
to monetary services or accounts either through mobile financial services or the informal
financial sector. Being unbanked is however associated with important drawbacks since
individuals outside the formal financial sector experience less insurance as well as higher financial
costs. Thus, mobile banking can help overcome major impediments to financial inclusion such as
geographical barriers and high transaction costs, thereby acting as an important step towards the
use of formal financial services. Consequently, more capital is flowing into the financial system,
which in turn raises investments and economic growth. Similar to other ICTs, mobile banking
creates network externalities, meaning they become more cost effective as more users join the
system (World Bank, 2014).
3.2 Financial Inclusion and Economic Growth
Financial inclusion per se does not contribute to higher economic growth, but through financial
development. As more people gain access to the formal financial system, the size of the economy
increases, which contributes to higher economic activity.
According to the theoretical framework presented by Levine (2005), greater financial
development can have a positive effect on economic growth through the following five
mechanisms. Firstly, financial intermediates provide information about potential investments at
lower costs in comparison to individual investors, which results in a more efficient resource
allocation since the most promising projects, and not only the ones with the most available
information, will get funding. Secondly, by monitoring investors after providing them with
capital, financial intermediates help to alleviate agency problems, which make people more willing
to save, and hence more capital available for investments. Thirdly, by channelizing savings from
different individuals financial intermediates are able to finance large-scale projects for which a
single investor’s capital would have been insufficient. Fourthly, financial intermediates invest in a
wide range of different projects, thereby pooling the risk by diversifying their investment
portfolios so that they invest in more high-risk projects in comparison to a single risk-avert
investor. Thus, financial intermediaries can channelize investments towards projects with higher
returns. Lastly, financial intermediates lower transaction costs between different agents, and thus
facilitate exchange of goods and services. Each of the mechanisms described above may have a
positive impact on decisions regarding savings and investment, and hence economic growth
(Levine, 2005). Next section will continue the discussion by explaining how financial inclusion
relates to financial development, and consequently economic growth.
Financial constraints are particularly binding for the poor since they usually either lack the
required collateral, the credit history or the connections. Expanding the outreach of financial
services enables these poor people to finance potential high-return investments, which can lead
to more efficient resource allocations (Galor and Zeira, 1993). Access to credit further facilitates
the smoothing of consumption over time, and in turn increases the likelihood that poor

14
households can finance education for their children (Becker, 1975; Mincer, 1974). Financial
inclusion may therefore have a positive effect on human capital accumulation. Moreover, access
to formal financial services is negatively associated with poverty as well as with inequality –a
conclusion supported both by theoretical and empirical evidence (World Bank, 2014; GSMA
mWomen, 2013). Since financial development may foster growth through the entry of new firms
(Klapper et al., 2007), it becomes crucial for talented entrepreneurs to get access to financial
services in order to commercialise their projects (Rajan and Zingales, 2003).
Moreover, the majority of the African economies remain reliant on cash, implying that the
population still have their trust in physical money. Hence, in order to promote “invisible” money
as mobile financial services, it is important to emphasise the easiness of transforming cash to
mobile-based cash points (World Bank, 2014). Of course, even though full financial inclusion is
the overall goal, it does not mean that everyone should be given access to credit at any expense.
Besides, the recent financial crisis provides a prominent example of possible consequences of
rapid and uncontrolled credit growth, which obviously should be avoided as far as possible
(World Bank, 2014). However, having accounted for some of the mechanisms through which
financial inclusion can affect financial development and economic growth, the next section will
present three important factors that possess great potential for contributing to larger financial
inclusion within the near future.
3.2.1 Current Stage of Financial Inclusion The degree of financial inclusion is likely to increase in the next few years since, (i) the absolute
income levels of those at the bottom of the pyramid are rising, (ii) new technologies such as
mobile financial services reduce transaction costs and increase outreach, and (iii) financial
inclusion has become a policy priority at high global levels (FI2020, 2013). All these three factors
will in turn be presented below.
Economic development has contributed to declining rates of the absolute number of the world’s
poorest people. FI2020 Working Group (FI2020, 2013) emphasize that the incomes of people at
the bottom of the pyramid2 are rising. A substantial movement from levels at or near subsistence,
in the range of $1-2 per day, to levels with some disposable surplus, $4-10 per day, has recently
been seen. This has given rise to a new social-economic class, which has become known as the
“fragile middle class”3. Estimates by FI2020 further suggest that the 40 percent poorest people in
the world will double their consumption between 2010 and 2020, from $3 trillion to
approximately $5.8 trillion, measured in 2011 USD, which consequently will increase the demand
for formal financial services.
The role of technology for financial inclusion is growing in importance (Faye and Triki, 2013).
Technology developments such as telecommunication infrastructure and more advanced
payment systems do not only reduce transaction costs but also expand reachable areas.
2 People at the bottom of the pyramid are usually defined as individuals living on less than $2.50 a day, at constant USD 2005 level, thus measuring absolute levels of poverty. 3 The “vulnerable class” includes people who have an income above the level required to cover minimum living expenses, but are still not wealthy enough to ensure a sustained income level above this poverty line.

15
Traditional branch-based banking activities, associated with urban areas and high transaction
costs, could be overcome by the recent ICT development, enabling people at rural and poorly
served geographical regions to be financially included. Although many people remain poor, safer
systems of money transfers and benefits payments can still come to their benefit. As have further
been argued by FI2020 (2013), formal financial services might be more interesting for individuals
living on $4-10 a day, whereas the informal financial services still can reach the individuals living
on levels below this threshold. Subsequently, when the bulk of a country’s population experience
income growth, they will begin to shift from informal to formal services. This will in turn put
pressure on the providers of formal financial services to convince their potential customers that
they will be better off by switching into more formal services, as it offers better terms of
conditions for borrowing and lending. Additionally, by putting the surplus money into a formal
bank account, it will increase credits available for banks’ lending, which in turn increases
investments and foster economic growth. In this manner, financial inclusion will turn into
financial development, and as a consequence increase the size of the economy.
Policymakers worldwide are now putting financial inclusion on the top of their agendas. In order
to learn more about financial inclusion, banking authorities in low- and middle-income countries
were called together and established the Alliance for Financial Inclusion (AFI) in 2008. In the
following year, the G20 brought financial inclusion to the highest policy level and created the
Global Partnership for Financial Inclusion (GPFI). These initiatives have led to national
authorities setting up ambitious goals and strategies to achieve financial inclusion (FI2020, 2013).
3.2.2 Theoretical Determinants of Financial Inclusion Previous studies suggest that the level of economic development, population density,
infrastructure, outreach of bank branches, banks’ overhead costs, and institutional capacity are
important determinants of financial development. Higher income levels lower the barriers to
financial inclusion and economic development and population density capture the effect of
income and market size on the provision of financial services (Kendall et al., 2010). More densely
populated areas should be easier to supply with financial services since infrastructure tend to be
more widespread in these areas. Bank branches in densely populated areas are able to reach a
larger number of customers, suggesting greater chances of being profitable and thus higher
likelihood to be present (Calem and Nakamura, 1998). Infrastructure is also deemed to be a
determinant of financial inclusion since underdeveloped infrastructure makes it more expensive
for financial institutions to provide their services. This may in turn have a negative impact on
business activities since customers are more likely to face higher transaction costs, thus reducing
the overall demand for financial services. Furthermore, access to financial services is crucial for
financial inclusion. Since costs and distances are some of the main barriers to financial inclusion,
the outreach of bank branches are assumed to be an important determinant of the outreach of
the financial sector (Kendall et al., 2010). Moreover, institutional capacity, captured by a strong
and well-regulated banking sector, is assumed to dampen the effect of macroeconomic shocks (or
even prevent them). This suggests a positive relationship between measures of institutional
development and financial inclusion (Tornell and Westermann, 2003).

16
4. Previous Empirical Studies
Building on the theoretical framework presented in the last chapter, this chapter will account for
previous empirical studies on mobile phone penetration and financial inclusion. Empirical work
on the development of ICT and economic growth will firstly be described, followed by studies
on financial inclusion, and lastly by investigations of the determinants of financial inclusion.
4.1 The Development of ICT and Economic Growth
Empirically, mobile phone penetration has been shown to have a positive and significant effect
on economic growth in high-income as well as in low- and middle-income countries. In an early
cross-country study, Hardy (1980) examines the impact of telecommunication penetration on
economic growth. Based on a sample of 15 high-income and 45 low- and middle-income
countries during the period 1960 to 1973 he finds that telecommunication penetration, in
contrast to radio penetration, does have a positive impact on economic growth. The problem of
reverse causality arises because better communication systems may result in higher income, and
higher income may in turn lead to better communication systems, which makes it difficult to
ascertain the causal direction. Further, based on a sample of 47 countries with different degrees
of economic development, Norton (1992) investigates the relationship between transaction costs,
telecommunication and economic growth, during 1957–1977. The initial-year value of the stock
of telephones is included in order to overcome the issue of reverse causality, and the following
results are in line with Hardy (1980).
In contrast to previous studies based on single equation models, Röller and Waverman (2001)
developed a more structural model, which came to act as a platform for further work by other
scholars within this field of research. In more detail, Röller and Waverman endogenize
telecommunications by specifying a micro-model of supply and demand for telecommunication
investments, which further is jointly estimated with a macro-growth equation. Their result put
light on network externalities, meaning that as the number of users of a telephone line increases,
higher value is generated from the telecommunication system. Thus, telephone penetration may
have a non-linear effect on economic growth since the growth rate appears to be higher above a
certain threshold level (Röller and Waverman, 2001). Further, Sridhard and Sridhard (2004)
extend the analysis to include mobile phones. Based on a sample of 63 low- and middle-income
countries between 1990 and 2001, they find that mobile penetration has a greater impact on
economic performance than fixed telephone lines.
Another study that uses a modified version of Röller and Waverman (2001) is conducted by
Waverman et al. (2005). Based on a sample of 92 countries during the period 1980-2003, the
researchers show that the role of mobile phones in today’s low- and middle-income countries is
comparable to the role that fixed telephone lines played in OECD countries during the 1970s and
1980s. Due to the steady progress in technological development, low- and middle-income
countries do however not need to undergo the same development stages as high-income
countries did some 30 years ago. Consequently, mobile phones can be seen as substitutes for
fixed lines in low- and middle-income countries, whereas they work as complements in high-
income countries (Waverman et al., 2005). Estimates suggest that the impact on growth of
mobile phones in low- and middle-income countries is about twice as large as in high-income

17
ones, thus emphasising the importance of flexibility and positive externalities that mobile phones
give rise to during countries’ early stages of development.
Turning to case studies of mobile phone penetration, Kathuria et al. (2009) investigate the impact
of mobile phone penetration on economic growth across Indian states during the period 2000-
2008. Based on an adjusted Röller and Waverman model, the findings suggest that states with
higher mobile phone penetration rates can expect higher growth rates. In addition, a penetration
rate of 25 percent seems to be needed in order for network effects to take place, which further
confirms the existence of a threshold effect. Moreover, one study among few that focuses on the
growth effect of mobile phones in sub-Saharan Africa is Lee et al. (2009). The endogeneity
problem is addressed by using a System GMM estimator, and in line with Waverman et al. (2005),
various degrees of substitutability between mobile phones and fixed lines is tested for. The result
shows that regions with few fixed lines are associated with a higher marginal benefit of mobile
phones. This further confirms the theoretical predication that mobile phones act as substitutes,
rather than complements, to fixed telephone lines in low- and middle-income countries.
However, previous empirical studies on the relationship between ICT development and
economic growth have neither accounted for the price effect of telecommunications nor the
explicit channels through which mobile phones may affect growth. A study conducted by
Andrianaivo and Kpodar (2012) is nevertheless an exception, taking both of these issues into
account. Their hypotheses are that higher prices on telecommunications dampens its positive
effects on economic growth, and that financial inclusion is one of the channels through which
mobile phone penetration contributes to economic growth. Notwithstanding, their study raises
some substantial concerns, since many critical assumptions have been made and important
factors have been excluded. However, great opportunities to improve on their work are opened
up, which this study aims to utilize.
4.2 Financial Inclusion and Economic Growth
Turning to previous empirical studies on financial inclusion, several case studies have been
conducted, while there are very few studies based on panel data. The main reason is the lack of
adequate data, which is a consequence of the absence of comprehensive measures of financial
inclusion. However, the measures that do exist try to capture various aspects of financial
inclusion, but often lack either time dimension or cross-country dimension. Nonetheless, a recent
attempt to measure financial inclusion has been done by the World Bank and its creation of the
Global Financial Inclusion Index (Global Findex). This financial index measures the use of
financial services, including a wide range of factors, divided into three sub-groups: ownership and
use of an account at formal financial institutions; and saving and borrowing behaviour,
respectively. Global Findex was launched in 2011 and brings great opportunities for future
research within this field. The dataset covers 148 economies for the year 2011, or for the last year
of available data. A second version of Global Findex will be available in 2015, leaving great
promises for future research. Nevertheless, in regards of the purpose of this study, the lacking
time dimension has resulted in the use of alternative measures of financial inclusion that covers a
greater number of years, yet not as detailed as Global Findex data.

18
Moreover, although previous theoretical studies unanimously argue that financial inclusion is
important for economic development and poverty reduction, the empirical support is somewhat
lacking. One obvious reason being the absence of data. However, the empirical evidences that do
exist suggest that access to basic payments and savings have a positive effect on economic
development; access to savings accounts contributes to increased savings (Aportela, 1999; Ashraf
et al., 2006), women’s empowerment (Ashraf et al., 2006; 2010), productive investments (Dupas
and Robinson, 2011, 2013), and investments in preventive health, as well as increased
consumption, higher productivity, and raising income (Ashraf et al., 2010; Dupas and Robinson,
2013). The positive effect is particularly strong for poor households (Beck et al., 2010).
4.3 Empirical Determinants of Financial Inclusion Building on previous work by Beck and de la Torre (2006) and Beck et al. (2007), Kendall et al.
(2010) investigate which factors that determine the outreach of the financial system. Their
findings suggest that level of economic development, as well as population density and financial
stability are of particularly importance for financial inclusion. They further conclude that
electricity consumption and mobile phone diffusion have positive effects on financial access. In
light of these findings, Model 2 in this paper investigates the relationship between mobile phone
penetration and financial inclusion and includes a similar vector of determinants. Electricity
consumption is however excluded from the analysis.
5. Data and Methodology
This chapter will cover data and the methodological parts of the study. Firstly, it will describe the
regression models used in order to investigate the relationship between on the one hand, mobile
phone penetration and economic growth, Model 1, and on the other hand, mobile phone
penetration and financial inclusion, Model 2. Secondly, it will motivate the choice of the System
GMM estimator for Model 1 and the fixed effects estimator for Model 2. Lastly, the chapter will
present the data and explain how the variables have been constructed.
5.1 Econometric Specification
This section will specify the econometric models used to analyse the data and address the
research questions.
5.1.1 Regression Model 1: Mobile Phone Penetration and Economic Growth
Following the methodology used by Andrianaivo and Kpodar (2012), and previously by
Waverman et al. (2005), this study applies an endogenous growth model in order to investigate
what effect mobile phone penetration has on economic growth.
Firstly, let denote the logarithm of real GDP per capita and the lagged logarithm of
real GDP per capita, then the GDP per capita growth rate can be obtained by taking the absolute
difference in the logarithmic values, . Thus, by taking into account country
specific, , as well as time specific effects, , the left hand side of the equation denotes economic
growth for country at year , and the GDP variable on the right hand side represent the

19
corresponding value for year , that is the lagged growth rate. The econometric specification
can consequently be written as:
where denotes the mobile penetration rate, and represents a vector of growth
determinants such as education, inflation, government expenditure, and institutional
development. Further, is an unobserved country-specific effect, and denotes the error
term. However, we do not limit the model to only estimate the effect of mobile phone
penetration, but also to examine how a range of other ICT variables can contribute to economic
growth. The other variables taken into consideration are the number of fixed telephone lines,
price of a three minutes local call for both fixed and mobile phones, broadband subscribers, and
Internet users.
In a similar manner, we further introduce measures of financial inclusion to the growth model,
represented by the number of deposits per capita and number of loans per capita respectively.
The following equation is specified:
where the variables are denoted as above. By estimating this model, we thereby open up the
possibility for greater financial inclusion to have a positive effect on economic growth, as well as
to get a first impression on the relationship between mobile phone penetration and financial
inclusion.
5.1.2 Regression Model 2: Mobile Phone Penetration and Financial Inclusion
The relationship between financial inclusion and mobile phone penetration will further be
investigated, which gives rise to an additional regression model that explicitly tests whether a
higher rate of mobile phone penetration is associated with higher financial inclusion. In line with
Kendall et al. (2010), and Andrianaivo and Kpodar (2012), the following econometric model is
specified:
∑
where stands for financial inclusion, represented by the number of deposits and loans per
capita, denotes logged real GDP per capita, the number of mobile phone
subscribers per capita, the population density measured as people per square
kilometers of land area. Moreover, vector X denotes a set of other control variables such as
institutional quality, capturing the legal environment; banks’ overhead cost as percentage of total
assets, measuring the efficiency of financial intermediaries; bank density as the number of
commercial banks per km2 , capturing the geographical distribution of bank branches.

20
5.2 Regression Estimators
Having specified the models that will be used for the forthcoming regression analyses, this
section will furthermore describe the estimators that have been applied before turning to a more
detailed description of the data. The choice to use the System GMM estimator for Model 1 will be
motivated initially, followed by a motivation of why the fixed effects estimator is appropriate to
use for Model 2.
5.2.1 System GMM
Regression Model 1 is based on a dynamic panel data model, where the dependent variable, real
GDP growth rate per capita, , depends on its own lagged value, , which raises issues of
endogeneity. In line with previous research, this paper will apply the System GMM estimator, and
the choice of this estimator will be explained in the following paragraphs.
As mentioned above, a dynamic panel data model raises issues of endogeneity, which refers to
the problem of variables being determined within the model. The explanatory variables may be
either predetermined or endogenous, where the former refers to a variable that is correlated with
previous error terms and the latter to a variable that is correlated with both previous and present
error terms. Applying an Ordinary Least Square (OLS) estimator to a dynamic panel data model
will overestimate the true autoregressive coefficient (given a positive autoregressive coefficient,
). Thus, the results will be inconsistent, which follows from the positive correlation
between the lagged dependent variable, , and the country specific effect, . The same
reasoning applies to the random effect estimator, making the estimator inconsistent, which
means that the distribution of the estimated coefficients not will be moving towards its true value
as the number of observations approaches infinity. Likewise, the fixed effect estimator is also
inconsistent, unless both the number of individuals and time periods approaches infinity. The
estimator is however appropriate for Model 2 since it is based on a static panel data model where
we do not have a dependent variable that is dependent on its own lagged value, but this will be
discussed further in section 5.2.2.
However, a possible solution to the problem of inconsistency is to take the first differences of
the explanatory variables, in order to eliminate the individual effects, hence turning to an
instrument variable (IV) method (Anderson and Hsiao, 1981). This assumes that is
correlated with but not with . The results obtained from the first-difference
estimator would be consistent given that the error term, , does not suffer from
autocorrelation. However, Arellano (1989) points out that, as more explanatory variables are
added to the model, this estimator becomes inefficient, since it gives rise to a large variance of
the autoregressive coefficient, . Anderson and Hsiao (1981) further argue that the lagged first
difference can be used as an alternative instrument. Notably, this reduces the number of effective
observations, and the estimator suffers from both large biases and large standard errors when the
autoregressive coefficient, , is close to one (Arellano, 1989). As a consequence of this
disagreement and the problem of inaccuracy, alternative estimators that combine the two
approaches have been developed.

21
Different GMM estimators have been developed, such as the Arellando-Bond estimator (1991)
and the Blundell-Bond estimator (1998). The Arellando-Bond estimator, which also is known as
difference GMM, initially transforms all explanatory variables by taking first differences and
thereafter applies the generalized method of moments (GMM) “principle”. The Blundell-Bond
estimator extends the Arellando-Bond estimator by assuming that the first differences are
uncorrelated with the fixed effects, . Consequently, more instruments can be introduced to the
model, which improve the efficiency of the model considerably. The estimator furthermore
builds a system of two equations – consisting of the original equation in levels and the
transformed one in differences – and is commonly known as system GMM (Roodman, 2009a).
When limited to a small sample size, the Blundell-Bond estimator is argued to be the most
efficient one. However, this estimator requires that the series are mean
stationary, meaning that they have a constant mean
for each country i. The Blundell-Bond
estimator furthermore contains two different variants, the one-step and the two-step estimator.
The two-step variant is asymptotically more efficient, although at the cost of substantially
downward biased standard errors (Blundell and Bond 1998). In order to compensate for this, a
finite-sample correction derived by Windmeijer (2005) has been applied to the two-step variant.
Even though the Blundell-Bond estimator and the Windmeijer correction compensates for the
small sample size and the problem of inaccurate standard errors when using the two-step variant,
the problem of too many instruments remains.
Firstly, having too many instruments is problematic in the sense that the instruments may overfit
the endogenous variables. Secondly, the estimates of the optimal weighting matrix, in the case of
a two-step GMM estimator, is likely to be inaccurate when numerous instruments are being used
(Roodman, 2009a; Roodman, 2009b). The Sargan and Hansen test is applied in conjunction with
Model 1 in order to detect problems of misspecification, a test which is very sensitive to the
number of instruments. If the model restriction includes too many instruments, the result will be
misleading even though the obtained test statistics does not indicate problems of an over-
identified model. There is however no general rule on how to determine whether the restriction
at hand includes too many instruments or not. The recommendation is to keep the number of
instruments at minimum even if there are instruments available that are both theoretically
relevant and valid (Verbeek, 2012).
The instrument used for the lagged real GDP per capita is the first difference, lagged one period,
and for the equations in first difference, the first lagged value is used as instrument. Other
variables that are assumed endogenous, such as education, mobile phone penetration and
institutional framework, the second lagged values are used as instruments. The choices of
instruments have firstly been based on logic reasoning, where after models have been specified,
tested and compared by means of Hansen J-statistics.
The validity of the internal instruments used must be checked in order to make sure that the
results are valid. As noted by Roodman (2009a; 2009b), the use of System GMM estimators must
be done with great caution and several checks should be conducted before relying on the
estimation results, especially when the sample is small and the number of internally determined

22
instruments is high. Because of the problem of too many instruments we keep the number of
instruments to minimum.
5.2.2 Fixed Effects or Random Effects Estimator
As mentioned previously, Model 2 is based on a static linear panel data model. This implies that
the variables are strictly exogenous, hence neither dependent on current, future nor past error
terms. This stands in contrast to the dynamic characteristics of Model 1, where issues of
endogeneity needed to be controlled for. The more complex system GMM estimator is however
still consistent and unbiased, yet not the most efficient estimator. Linear panel data models are
usually estimated with either a fixed effects or a random effects estimator (Verbeek, 2012).
In light of this study, the fixed effects estimator will be used. The random effect estimator draws
its conclusion on effects within the sample, whereas the inference for the fixed one are made
with respect to population characteristics. The choice between the two estimators is far from
clear-cut, but since this study includes arbitrary chosen countries, the sample should not be
regarded as a random draw, hence motivating the use of the fixed effects estimator.
The fixed effects model can be described as a linear model that allows the intercept to vary with
the individual units i, which in this study refers to countries. In order to deal with the country
specific effects a dummy variable could be included for each country and the equation could
consequently be estimated using a Least Squares Dummy Variable (LSDV) estimator. However,
using the fixed effects estimator, which is based on deviations from individual means instead of
the individual effects, is thus a simpler way of obtaining the same results (Verbeek, 2012).
Moreover, the choice to use the fixed effects estimator stands in contrast to the random effect
estimator used by Andrianaivo and Kpodar (2012), who motivate their choice of estimator with
the limited time dimension of their study. The argumentation is further based on their obtained
probability of the Hausman test, which is above 0.10, thus suggesting that the random effect
estimator is appropriate. Even though the Hausman test is commonly used to decide between the
fixed effects and the random effects estimator one should be aware of that it has low power,
meaning that the possibility of making a type II error is high, that is, failing to reject a false null
hypothesis. Furthermore, the random effect estimator requires that the independent variables are
strictly exogenous, meaning that they are uncorrelated with the cross-sectional specific effect as
well as the time-specific effect. If they in fact are correlated, the random effect estimator
becomes biased and inconsistent (Baltagi, 2009).
5.3 Data
This section will present the data that has been used to conduct the regression analyses, and
further explain how the variables have been constructed.
In order to analyse the relationship between on the one hand, mobile phone penetration and
economic growth, and on the other hand, mobile phone penetration and financial inclusion, as
well as testing whether financial inclusion function as a channel through which mobile phone
penetration affects economic growth, various data on 44 African countries between the years
2000 and 2011 has been collected. The chosen sample period is motivated by the fact that the
23
rapid growth of mobile phones took off towards the end of the 1990s, implying that data did not
exist before. Although the African continent as a whole is of ultimate interest for this study, data
limitations leave us with a sample of 44 countries out of which 25 are classified as low-income
countries, ten lower middle-income counties, and four middle-income countries, according the
World Bank (2014b). Africa consists of 54 countries, and ten countries have consequently been
excluded in this study. Seven out of these are classified as low-income countries, and the
remaining three as lower middle-income countries. Accordingly, when making generalizations
and referring to Africa as a continent, one should bear in mind that some of the poorest and
most conflict-affected countries are excluded, which might bias the result. Nevertheless, one
could still argue in favour for the possibility to generalize since the sample contains over 80
percent of the African countries and 80 percent4 of the African population. However, additional
awareness needs to be raised in terms of sample heterogeneity, which may affect the results in
terms of large standard errors.
5.3.1 Variable Construction
Economic Growth
Economic performance is captured by annual growth in real gross domestic product (GDP) per
capita, measured in purchasing power parity (PPP) constant 2005 international dollars.
Noteworthy, GDP is a measure of economic performance based solely on economic activities in
the formal sector. There is however a tendency for fast-growing, low-income countries to
underestimate their GDP, one reason being that changes in the composition of the economy are
not consistently reflected in the calculation of GDP5 (Jerven, 2013). Although this type of
countries are included in this study, the focus is not on levels of GDP but GDP growth, which
somewhat mitigates such measurement errors (for further discussion, see Jerven, (2013)).
Growth Determinants
Turning to the macroeconomic growth determinants included in Model 1. Data have mainly been
obtained from the World Bank and its different databases, namely the World Development
Indicators, the International Financial Statistics and the African Development Database. Human
capital is represented by educational attainment in terms of primary school net enrolment rate.
This variable describes the total enrolment in primary schools in relation to the population of the
age group that officially corresponds to that level of education. Further included in the vector of
growth determinants is government final consumption; measured as percentage of GDP, and
inflation; measured as the annual changes in Consumer Price Index (CPI), with data obtained
from the World Bank and Index Mundi. The institutional capacity of the countries is further
taken into account by the inverse indexes of the average value of the Political Right Index and
the Civil Liberty Index, calculated based on data from the Freedom House. School enrolment
4 The 54 sovereign states of Africa have a total population of 1.1 billion, out of which 860 million are included in this sample of 44 countries. 5 For example, in April 2014, Nigeria ‘rebased’ its GDP, meaning that the composition of their economic performance was upgraded by changing the base year of calculations. The country’s GDP in 2013 was revised upwards with 89 percent, from 42.4 to 80.2 trillion naira ($510 billion). As a result, Nigeria became the largest economy in Africa over a night (The Economist, April 2014).

24
and institutional capacity are expected to be positively correlated with economic growth whereas
negative signs are expected from inflation and government final consumption.
Information and Communication Technologies (ICT)
Data on ICT are obtained from the International Telecommunication Union (ITU) and the
World Bank. Irrespective of initial measurement unit, the variables are converted either into per
capita or per adult measures. The ICT variable of main interest in this study is mobile phone
penetration, which is captured by mobile phone subscribers per capita, measured as the total
number of mobile subscribers in each country by the end of each year, divided by total adult
population (+15). It includes both post-paid and pre-paid subscriptions, made to a public mobile
phone service using cellular technology, thereby providing access to the public switched
telephone network (ITU, 2014). Mobile phone penetration is expected to have a positive effect
on economic growth, as well as on financial inclusion.
Although mobile phone penetration is the factor of main interest, the presence of fixed
telephone lines might as well have a positive impact on economic growth, thereby making it
appropriate to include in the model. Moreover, the rise of the Internet is further assumed to
reveal positive effects on economic growth, and is thus accounted for by including data on
Internet users and broadband subscribers. Data have been gathered from ITU. Internet users are
measured as the number of individuals with access to the worldwide network divided by total
population. Broadband subscribers are denoted as people with a digital subscriber line, a cable
modem, or other high-speed technologies. Notably, reporting countries might have different
definitions of broadband, which makes the data not strictly comparable across countries. Data
have in some cases been extrapolated backwards, since knowing that it was zero broadband
subscribers in for example Angola in 2005, one could quite safely assume that it was zero
subscribers in preceding years as well. The same technique has been applied to Internet users. A
positive correlation between Internet users and Broadband subscribers, respectively, and
economic growth is expected.
Moreover, in order to investigate whether the price of a phone call is associated with the number
of subscriptions, both in terms of fixed lines and mobile phones, the regression model includes
two price variables. These are defined as the price of a 3-minute fixed local telephone call and the
price of 3-minute local mobile call. To make it comparable across time and across countries, both
variables are measured as the peak rate, and in the unit of US dollars. The price is expected to be
negatively correlated with economic growth.
Financial Development
Turning to the financial side of the economy, financial development is captured by private credit
to GDP, which is the ratio of claims of financial institutions on the private sector to GDP. Data
is obtained from the Financial Structure Database of the World Bank. Despite a certain level of
financial development, a substantial part of the population might remain excluded from formal
financial services and this gap can be illuminated by not only taking financial development into
account but also financial inclusion.

25
Financial Inclusion and its Determinants
Data on financial inclusion is obtained from the Financial Access Survey (FAS), which contains
data for 189 countries from 2004 to 2012, thus enable cross-country comparisons over time. The
data set further consists of indicators of both financial access and use, although only for a limited
amount of countries. Since the FAS does not contain adequate data on financial inclusion for all
countries in the studied sample, additional sources have been used such as CGAP (2009; 2010),
Beck et al. (2007) and the Global Findex (2012). The number of deposits per capita is measured
as the number of deposits by commercial banks divided by total adult population, and
corresponding definition for loans. In order to make the data comparable, the number of
deposits refers to deposits at commercial banks, which means that deposit or loan accounts at
other formal financial institutions such as credit unions, financial cooperatives, insurance
companies, and microfinance providers are not included. The measure of access to financial
services is therefore assumed to be somewhat underestimated. However, to the best of the
authors’ knowledge, this study makes one of the first attempts to assess the determinants of
financial inclusion based on African panel data, and including mobile phone development.
Notably, the two measures of financial inclusion, deposit and loans per capita, are included in the
regressions with mutual exclusiveness in order to avoid problems of multicollinearity.
The outreach of the financial sector is further likely to be determined by population density, bank
density, and banks’ overhead costs, all of which have been included in Model 2. Data on these
variables are obtained from the Global Financial Development Database. Population density is
measured as total population divided by land area in square kilometers and is expected to be
positive correlated with financial inclusion. The same reasoning holds for bank density, captured
by the number of branches of commercial banks per 1,000 square kilometers. Banks’ overhead
costs is measured as banks’ operating costs as a share of its total assets and this variable is
expected to be negatively associated with financial inclusion.
Additional Model Adjustments In order to smooth the trend and avoid short-term fluctuations, all variables have been averaged
over two years. This is further motivated by the fact that the main interest of this study is to
analyse how the variables have evolved over time. The choice of using two years averages might
be questioned since averages of four-five years are common in the context of growth, albeit
arbitrary (Birch-Sørensen and Whitta-Jacobsen, 2010). One shortcoming of this study is the
limited time dimension in combination with the use of the System GMM estimator. Data is
available from the year 2000 and the System GMM requires five time periods at minimum, which
makes averages exceeding two years not possible since it results in too few periods. Nevertheless,
Rand and Tarp (2002) argue that business cycles in low- and middle-income countries tend to be
shorter than in high-income countries, which partly supports the use of two-year averages.
However, one must still be aware of the potential problem due to short-term volatility.
Lastly, the properties of the variables have been tested to ensure their stationarity. Based on the
unit root test constructed by Levin-Lin-Chun, and/or for the variables where we have
unbalanced panels, the Im-Pesaran-Shin and Fisher-type unit root test are applied, the first
differences of some variables have been taken and the number of lags has been appropriately
adjusted – ending up with the conclusion of stationary variables.

26
6. Results
This chapter will start out by presenting descriptive statistics of the variables included in the
regression models. Thereafter three consecutive sections will each account for the outcome of
one set of regressions. As previously explained, Model 1 examines the effects of mobile phone
penetration and other ICT variables on economic growth, and the results will be presented in
part one. To further investigate the effect of financial inclusion on economic growth (both in
itself and combined with mobile phone penetration) measures of financial inclusion has been
added to Model 1. These results will be presented in part two of this chapter. Finally, the results
from Model 2, investigating the determinants of financial inclusion will be presented in part three.
First of all, Table 2 below presents the summary statistics of the variables included in the different
regression analyses.
Table 2: Summary Statistics (2000-2011)
Observations Average Standard
deviation Minimum Maximum
GDP growth 528 4.8 5.9 -61.2 63.4
Real GDP per capita 528 3,941 5,182 262 28,993
Government consumption 528 0.147 0.062 0.023 0.402
Primary school enrolment rate 528 0.766 0.167 0.279 0.998
Inflation 528 9.6 32.1 -9.8 513.9
Institutions 528 0.529 0.227 0.143 1.000
Fixed telephone lines per capita 528 0.041 0.065 0.000 0.325
Mobile phone subscribers per capita 528 0.286 0.325 0.000 1.715
Price of 3-min fixed telephone call 528 0.156 0.151 0.013 1.342
Price of 3-min mobile phone call 528 0.696 0.351 0.028 2.323
Broadband subscribers per capita 528 0.003 0.010 0.000 0.105
Internet users per capita 528 0.052 0.082 0.000 0.510
Private credit to GDP 528 0.190 0.178 0.006 0.867
Deposits per capita 325 0.323 0.452 0.001 2.187
Loans per capita 241 0.086 0.136 0.000 0.588
Bank density 422 5.606 17.034 0.005 104.926
Population density 528 77.2 110.8 2.3 633.5
Banks’ overhead costs 528 5.267 2.81 0.1667 18.896
As presented in Table 2, African economies grew on average 4.8 percent per year during the
period 2000-2011. Notably is however the substantial difference among the sample countries
revealed by the large standard errors, which amounts to 5.9 percent. Another variable with high
disparities is inflation, with an average annual rate of 9.6 percent and a standard deviation of as
much as 32 percent. The average mobile phone penetration rate is 28.6 percent, which stands in
stark contrast rate of fixed telephone lines, 4.1 percent. Further ICT variables worth noting are
the low rates of broadband subscribers as well as Internet users; 0.3 percent and 5.2 percent,
respectively. Turning to the financial variables, deposits per capita is on average 0.32 whereas the
corresponding number for loans is 0.09, implying that the deposit rate is almost four times higher
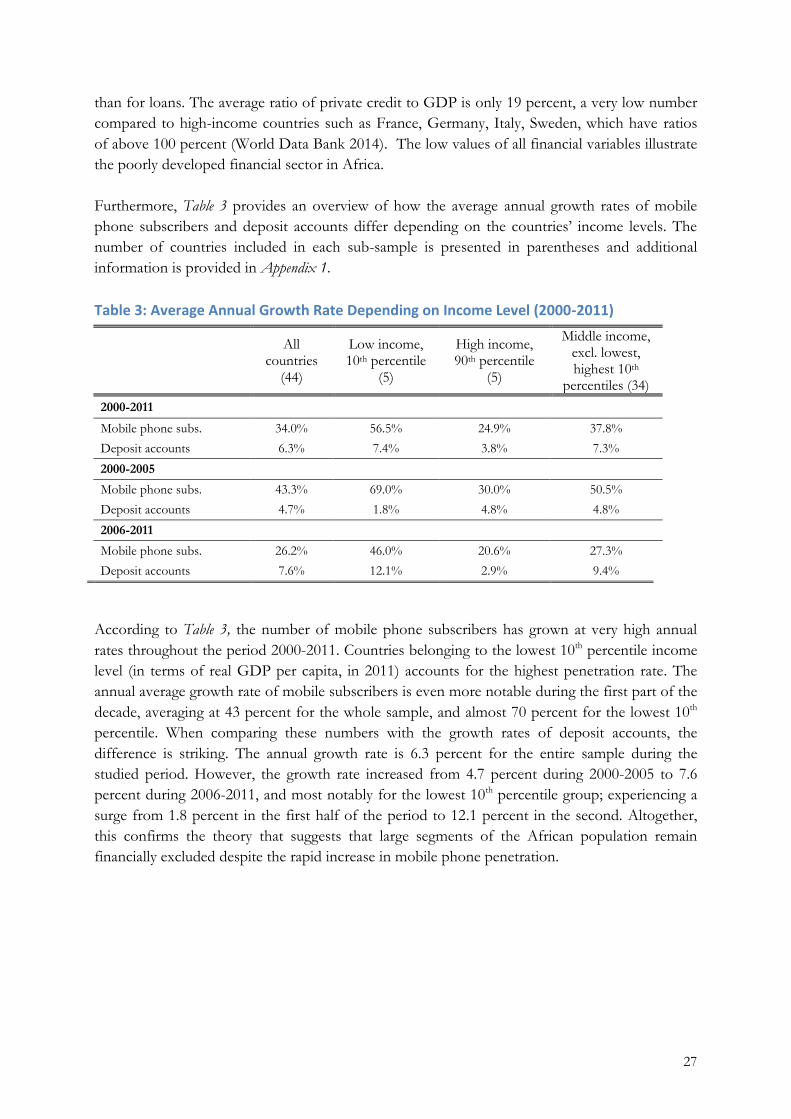
27
than for loans. The average ratio of private credit to GDP is only 19 percent, a very low number
compared to high-income countries such as France, Germany, Italy, Sweden, which have ratios
of above 100 percent (World Data Bank 2014). The low values of all financial variables illustrate
the poorly developed financial sector in Africa.
Furthermore, Table 3 provides an overview of how the average annual growth rates of mobile
phone subscribers and deposit accounts differ depending on the countries’ income levels. The
number of countries included in each sub-sample is presented in parentheses and additional
information is provided in Appendix 1.
Table 3: Average Annual Growth Rate Depending on Income Level (2000-2011)
All
countries (44)
Low income, 10th percentile
(5)
High income, 90th percentile
(5)
Middle income, excl. lowest, highest 10th
percentiles (34)
2000-2011
Mobile phone subs. 34.0% 56.5% 24.9% 37.8%
Deposit accounts 6.3% 7.4% 3.8% 7.3%
2000-2005
Mobile phone subs. 43.3% 69.0% 30.0% 50.5%
Deposit accounts 4.7% 1.8% 4.8% 4.8%
2006-2011
Mobile phone subs. 26.2% 46.0% 20.6% 27.3%
Deposit accounts 7.6% 12.1% 2.9% 9.4%
According to Table 3, the number of mobile phone subscribers has grown at very high annual
rates throughout the period 2000-2011. Countries belonging to the lowest 10th percentile income
level (in terms of real GDP per capita, in 2011) accounts for the highest penetration rate. The
annual average growth rate of mobile subscribers is even more notable during the first part of the
decade, averaging at 43 percent for the whole sample, and almost 70 percent for the lowest 10th
percentile. When comparing these numbers with the growth rates of deposit accounts, the
difference is striking. The annual growth rate is 6.3 percent for the entire sample during the
studied period. However, the growth rate increased from 4.7 percent during 2000-2005 to 7.6
percent during 2006-2011, and most notably for the lowest 10th percentile group; experiencing a
surge from 1.8 percent in the first half of the period to 12.1 percent in the second. Altogether,
this confirms the theory that suggests that large segments of the African population remain
financially excluded despite the rapid increase in mobile phone penetration.

28
6.1 Mobile Phone Penetration and Economic Growth
Turning to the results of the regressions, Table 4 shows the results of Model 1, with logged real
GDP per capita growth as dependent variable.
Table 4: Mobile Phone Penetration and Economic Growth
(1) (2) (3) (4) (5) (6)
Lagged Real GDP per capita growth
-0.372*** -0.2285*** -0.1783** -0.1482* -0.1664** -0.2337***
(0.0967) (0.0845) (0.0996) (0.1366) (0.0692) (0.1052)
Mobile phone subscribers per capita
– 0.0274*** – – 0.0129*** 0.0971**
(0.0135) (0.0125) (0.0338)
Broad band subscribers per capita – – 0.0299*** – – –
(0.0067)
Fixed telephone lines per capita – – – – – 0.0506
(0.0451)
Internet users per capita – – – 0.0403* – –
(0.0158)
Fixed telephones x Mobile subscribers per capita
– – – – – 0.0154*
(0.0067)
GDP per capita x Mobile subscribers per capita
– – – – -0.008** –
(0.0024)
Education 0.6577*** 0.3949*** 0.274** 0.5115** 0.4111** 0.3791***
(0.1879) (0.2257) (0.1384) (0.1452) (0.2435) (0.1512)
Government consumption -0.1237*** -0,1031*** -0.0256* -2.1093** -0.0843*** -0.0785**
(0.0385) (0.0290) (0.0199) (0.6987) (0.0222) (0.0237)
Inflation 0.0002 0.0001 0.0004 0.0002 0.0002 0.0002
(0.0008) (0.0006) (0.001) (0.0007) (0.0005) (0.0004)
Institutions 0.0063 -0.041 -0.0866 -0.0409 -0.0098 -0.05
(0.1200) (0.0914) (0.0391) (0.0632) (0.0784) (0.0572)
Constant 0.3408*** 0.3006*** 0.1251** 0.2989** 0.2472*** 0.2443***
(0.0894) (0.0634) (0.0575) (0.0707) (0.5909) (0.0609)
Observations 220 220 220 220 220 220
Number of countries 44 44 44 44 44 44
Hansen test (prob) 0.388 0.337 0.513 0.490 0.543 0.284
AR(2) (prob) 0.184 0.416 0.418 0.080 0.511 0.204
Standard deviation in parentheses, *** p<0.01, ** p<0.05, * p<0.1
The coefficient of mobile phone penetration appears to be positive and significant, thus having
the anticipated effect on economic growth, confirming theoretical as well as empirical previous
research (Andrianaivo and Kpodar, 2012; Röller and Waverman, 2001). As can be seen in Column
2 of Table 4, when the penetration rate increases with one percent, GDP growth increases with
0.027 percent, and correspondingly an increase of ten percent gives rise to 0.27 percent higher
growth rates. In Column 6, when fixed telephone lines and an interaction term between fixed and
mobile phones is added to the model, the effect of mobile phone penetration on economic
growth is considerably higher and amounts to 0.971 (given that the mobile phone penetration
rate increases with ten percent).
The variable capturing the number of fixed telephone lines per capita does not appear to have a
significant impact on economic growth. The interaction term between mobile phone penetration
and GDP per capita is negative and significant at the five-percent level. Furthermore, the
interaction term between mobile phone subscribers and fixed telephone lines per capita is
positive and significant at the ten percent level, implying that the diffusion of mobile phones and

29
fixed phones reinforces each other’s growth contribution. Thus, the total growth contribution
from a ten percent increase in mobile phone penetration is firstly a direct effect of 0.97 percent,
which is further fortified by the magnitude of 0.15 percent from the interaction term.
Based on the assumption that Internet is too underdeveloped in many African countries to reveal
any effect on economic growth, and further reinforced by the very low penetration rates of
broadband subscribers and Internet users in our sample, the result of positive and highly
significant Internet related coefficients are surprising. A ten percent increase in the number of
broadband subscribers is associated with an increase in GDP growth by 0.299 percent. The
variable Internet users reveals an even larger effect, where a ten percent increase is associated
with 0.4 percent higher growth rates.
Table 4 reveals that lagged GDP per capita growth is negative and significant. This result is
somewhat surprising, but could possibly be explained by business cycle movements. The average
length of a business cycle is assumed to be four years, implying that higher growth rates during a
two-year period will be followed by lower rates in the consecutive two years, thus captured by the
use of two-year averages. This is in line with Rand and Tarp’s (2002) findings that business cycles
in low- and middle-income countries tend to be shorter. Turning to the growth determinants,
government expenditure appears to have a negative impact on economic growth whereas human
capital (captured by the education variable), favours growth. These findings are in line with
previous research.
Robustness checks are carried out in order to ascertain the validity of the results. The regressions
are estimated based on annual data but does not show any significant result, assumingly due to
yearly fluctuations. Three-year averages cannot be used since it results in too few observations for
System GMM to work. Lastly, the regressions are run with and without outliers in terms of GDP
per capita level, where the lowest and highest 10th percentile (each consisting of five countries)
respectively has been excluded.
Hitherto, the analysis has only examined how different ICT variables relate to economic growth.
Next section will deepen the analysis by including measures of financial inclusion.
6.2 Taking Financial Inclusion into Account
Building on the previous section, this section will present the results of Model 1, adding measures
of financial inclusion to the regression. The dependent variable remains the same, real GDP per
capita growth, and the results from the regression analyses can be seen in Table 5 below.

30
Table 5: Mobile Phone Penetration, Financial Inclusion and Economic Growth
(1) (2) (3) (4) (5) (6)
Lagged Real GDP per capita growth -0.223** -0.3204** -0.115* -0.4239** -0.1961* -0.1708*
(0.0978) (0.1411) (0.2196) (0.1364) (0.1036) (0.1005)
Mobile phone subscribers per capita 0.0559** – 0.0148** 0.041*** 0.028** 0.029***
(0.0293) (0.0082) (0.0931) (0.011) (0.099)
Deposits per capita – 0.0234*** 0.0249** – – –
(0.0078) (0.0082)
Loans per capita – – – 0.0355* – –
(0.0201)
Private credit/GDP – – – – 0.0094 -0.0045
(0.0139) (0.0195)
Mobile x Private credit/GDP – – – – – 0.1119*
(0.0652)
Education 0.2514* 0.4699** 0.5085* 0.3228* 0.4197*** 0.2893**
(0.3609) (0.1986) (0.2163) (0.1694) (0.1362) (0.1462)
Government consumption -0.0799*** -0.1048** -0.1058*** -0.0599** -0.1036*** -0.0976***
(0.0189) (0.0411) (0.0373) (0.0242) (0.0238) (0.0251)
Inflation -0.0002 -0.0001 0.0004 -0.001 0.0003 0.0002
(0.0009) (0.001) (0.0007) (0.0001) (0.0005) (0.0005)
Institutions -0.008 0.1172 0.0683 0.0703 -0.027 0.001
(0.0719) (0.1317) (0.1031) (0.0725) (0.0238) (0.0745)
Constant 0.2297*** 0.2439*** 0.265*** 0.1568*** 0.3129*** 0.2451***
(0.0556) (0.0782) (0.0616) (0.0543) (0.0813) (0.1027)
Observations 135 135 135 100 220 220
Number of countries 28 28 28 21 44 44
Hansen test (prob) 0.616 0.664 0.471 0.489 0.558 0.463
AR(2) (prob) 0.601 0.669 0.41 0.717 0.283 0.272
Standard deviation in parentheses, *** p<0.01, ** p<0.05, * p<0.1
Financial inclusion, measured as the number of deposits per capita and the number of loans per
capita, respectively, is shown to have a positive and significant effect on economic growth. This
positive effect is somewhat higher for loans than for deposits. Loans are however only significant
at the ten percent significance level whereas deposits are significant at either one or five percent
level depending on whether the number of mobile phone subscribers are included or not (see
Column 3, 4 and 5 of Table 5). When the financial inclusion variable increases with ten percent, the
average increase in GDP growth increases is 0.279 percent, irrespective of what measure of
financial inclusion being used.
By comparing the coefficient of mobile phone subscribers in Column 1 in Table 5 with the
coefficients in Column 3 and 5, a highly interesting result is revealed; firstly, it changes from 0.06
to 0.01 when deposits is introduced into the model. Thus, the positive effect of mobile phone
penetration on economic growth decreases once controlling for financial inclusion, suggesting
that part of the positive effect is absorbed into the financial inclusion variable. In turn, this may
imply that mobile phone penetration not only has a direct positive effect on economic growth,
but also an indirect effect, through the channel of financial inclusion. In addition, this
argumentation also holds for the change in mobile phone coefficient in Column 5, when
controlling for loan accounts per capita. The weakening of the mobile phone coefficient is
however smaller. This suggests a less prominent channelizing effect when financial inclusion is
captured by loan accounts compared to deposit accounts, something that in turn might be

31
explained by lower average levels of loans than deposits (see Table 2). However, this conclusion is
only based on the changes in these coefficients and does not explicitly address the determinants
of financial inclusion, which will be dealt with further down.
6.3 Assessing the Impact of Mobile Phone Penetration on Financial Inclusion Turning to the results of regression Model 2, assessing whether mobile phone penetration has a
direct impact on financial inclusion, are presented in Table 6 below, with the number of deposit
accounts as dependent variable in Column 1 and 2, and loan accounts in Column 3 and 4.
Table 6: Financial Inclusion and Mobile Phone Penetration
Deposits per capita
(2000-2011)
Loans per capita
(2000-2011)
Deposits per capita,
excl. 90th percentile
highest GDP pc
(2006-2011)
(1) (2) (3) (4) (5) (6)
Mobile phone subscribers per capita 0.1705* 0.0317 0.043 0.0328 0.5336*** 0.2637*
(0.1011) (0.0928) (0.1186) (0.1187) (0.1640) (0.1505)
Real GDP per capita 2.0255*** 1.1533*** 2.2531*** 1.7186*** 3.4733*** 2.2241***
(0.4017) (0.3808) (0.4982) (0.5042) (0.5750) (0.5688)
Population density 4.3812*** 1.3283*** 4.8908*** 3.2653*** 4.5254*** 0.3624**
(0.7237) (0.8036) (0.8276) (1.0148) (0.9806) (0.1537)
Banks’ overhead costs – -0.0523 – -0.1866** – -0.1061
(0.0928) (0.1252) (0.1252)
Bank density – 0.7793*** – 0.4641*** – 0.9630***
(0.0924) (0.1106) (0.1382)
Institutions – 0.5926 – -1.1665 – -0.1303
(0.5366) (0.7366) (0.8066)
Constant -3.8299*** -1.5456*** -3.994*** 2.9062*** 4.6164*** 2.3598***
(0.2105) (0.3063) (0.2757) (0.3993) (0.2844) (0.4771)
Observations 262 262 241 241 170 170
Number of countries 28 28 21 21 23 23
R2 (between) 0.166 0.342 0.048 0.129 0.305 0.625
Hausman test (prob) 0.023 0.000 0.005 0.000 0.000 0.000
Standard deviation in parentheses, *** p<0.01, ** p<0.05, * p<0.1
Looking at Column 1 of Table 6, mobile phone penetration is shown to have a positive effect on
financial inclusion. The coefficient of mobile phone subscribers in Column 1 suggests that an
increase in the number of mobile phone subscriber with one percent will be associated with a
0.17 percent increase in the number of deposit per capita. This result is however only significant
at the ten percent level and should thus be considered with caution. When adding more control
variables to the equation mobile phone usage has no significant effect on the number of deposits
per capita. Turning to the regressions estimated with financial inclusion measured as the number
of loans per capita as the explanatory variable, the results came out to be insignificant irrespective
if the other determinants of financial inclusion are included or not.
Furthermore, the dependent variable in Column 5 and 6 is deposits, and these regressions exclude
the five richest countries (in terms of real GDP per capita) in the sample and only look at the
32
second half of the sample period, namely 2006-2011. As can be seen in Table 3, average annual
growth rate of deposits have been particularly high in lower income countries between 2006 and
2011, making it justified to investigate whether mobile phone penetration has a more pronounced
effect on financial inclusion in this case. It turns out that the results not only are more significant,
but the size of the coefficient is also greater. Looking at Column 5 of Table 5, a one percent
increase in mobile phone subscribers is associated with a 0.53 percent higher financial inclusion.
This result is significant at one percent level. However, as more control variables are added to the
model the result becomes significant at ten percent level and the coefficient weakens from 0.53
to 0.26 percent (Column 6 of Table 6). Running the corresponding regression with financial
inclusion measured as loans per capita does however not generate any significant results.
Regarding the control variables, real GDP per capita is significant independent of model
specification. The coefficient of bank density appears to be positive and significant, both in terms
of deposits and loans. Bank’s overhead costs are negatively associated with financial inclusion,
confirming the expectations of a negative impact of higher costs for establishment. However, this
variable is only significant when financial inclusion is measured as loans per capita (see Column 4
of Table 6). In accordance with previous regressions presented in part one and two of this
chapter, the variable capturing institutional capacity is insignificant when the estimations are
based on Model 2 as well. Lastly, although Kendall et al. (2010) find that inflation had a significant
negative effect on deposit penetration, our result on this point is rather in line with Andrianaivo
and Kpodar (2012), finding that inflation does not appear to be significantly associated with
financial inclusion.
7. Analysis
This chapter will further outline and discuss the findings of this paper and when appropriate
relate to previous studies and make suggestions for future research.
Firstly, this study confirms that mobile phone penetration is a significant contributor to
economic growth, which is in line with previous empirical evidence. However, this positive effect
weakens when controlling for financial inclusion, suggesting that financial inclusion could act as a
channel through which mobile penetration affects economic growth. Thus, to make a deeper
analysis of this relationship, the determinants of financial inclusion are further estimated. The
results of the contribution of mobile phone penetration did not turn out to be as straightforward
as suggested by Andrianaivo and Kpodar (2012). Firstly, when controlling for factors such as
population and bank density, and banks’ overhead costs, mobile phone penetration does not
seem to be a significant contributor to financial inclusion among the African countries included
in the sample, during the period 2000-2011. Referring to section 2.1.2, this might be due to the
fact that the measure of financial inclusion in this study only captures access to commercial banks
(the bank focused model). As explained, technology-based financial services could either be bank
focused, bank-led, or non-bank led. The first model offers the least potential for further financial
inclusion since the bank focused models mainly aims to facilitate financial services for those who
already are customers at a commercial bank.

33
The countries included in the sample are assumed to be heterogeneous in some respects, thus,
making potential effects to be expected to differ among them. For example, based on the
correlation scatterplot shown in Figure 4 in Appendix 4, the impact of mobile phone penetration
on economic growth appears to be stronger when the number of mobile phone subscriptions is
below one per capita and the high-income countries in the sample are excluded. The figures
presented in Table 6 furthermore reinforce this assumption. This could possibly reflect
diminishing growth returns to mobile phone development, which is in line with the findings of
Waverman et al. (2005), suggesting that mobile phone penetration has a stronger impact in low-
income countries. Thus, when the analysed sample excludes the five top-performing countries in
terms of real GDP per capita level, and in addition, when taking the potentially lagged effects of
the “mobile revolution” into account, the findings show that mobile phone penetration in fact is
a significant contributor to financial inclusion. This evidence is revealed in Column 5 and 6 of
Table 6, and suggests that further, future effects of mobile phone penetration for financial
inclusion in low-income-countries.
Moreover, the findings show that financial inclusion measured in terms of deposits, as well as in
terms of loans, is positively and significantly associated with economic growth. Although the
effect of deposits appears to be statistically stronger, the impact of loans shows larger economic
significance (0.036 for loans, and 0.023 for deposits, as can be seen in Table 6). The results reveal
insight into the effects of the respective type of financial services. As previously noted, the
number of deposits per capita is considerably higher than the corresponding number of loans,
which indicates that deposit accounts are easier to access. It further captures the existence of
credit market constraints, since the threshold level for opening a deposit account typically is
much lower compared to the threshold associated with being granted a loan at a commercial
bank. Consequently, this implies that the African credit market is underdeveloped and unable to
assess potential clients efficiently enough. Referring back to chapter 3, theoretical predictions
suggest that access to credit facilitates investments and allow entrepreneurs to launch potentially
lucrative projects, which in turn foster economic growth. Connecting this with the result in this
study, access to credit (and savings facilities) is a crucial contributor to economic growth. The
strong loan coefficient emphasises the importance for the African population to gain access to
credit, thereby revealing important policy implications for the development of the African
financial sector, which according to this argument should be targeted towards the credit market.
Although it might be assumed that this tendency of lower loans-to-deposits ratio is found in
many other regions of the world as well, the potential contribution of credit market development
could still be argued to be higher in Africa. The important need of access to credit can however
not be translated into careless issuance of loans, keeping the recent financial crisis in mind.
Nevertheless, it could also be the case that once an individual has obtained one deposit account,
it is commonplace to obtain additional ones. This could be controlled for if data on the number
of depositors, as a complement to the number of deposit accounts, had been available. As of
today, adequate data on the number of depositors is however only available for a few of the
countries included in this sample. Hence, this might be something of interest for future research.
In terms of the determinants of financial inclusion, mobile phone penetration only appears to
have a significant effect when no other financial control variables are included in the specified

34
regression model. While this holds true for the sample as a whole, there appears to be a high
contributing effect of mobile phone penetration on deposit accounts6 when dividing the studied
period into a former and latter part, and excluding the five top-performing countries in terms of
GDP per capita. The overall findings from Model 2 suggest that mobile phone deployment has a
significant effect on deposits but not on loans. An explanation for this might lie in the suggestion
that individuals who have a mobile subscription are more prone to save than to borrow, which
refers back to the discussion above of skewed financial markets (i.e. more directed towards
deposit than loans).
Furthermore, the distribution of mobile phones might be skewed towards high-income segments
of the population, both in terms of single and multiple ownerships of SIM cards and/or mobile
phones. The number of mobile phone subscribers could consequently overestimate the actual
number of mobile phone consumers. Accordingly, a skewed distribution, with the poorer
segments still lacking access to mobile connections, does not hold the same promises for
financial inclusion as a more equal distribution does. This in turn might be a reason why financial
inclusion lags behind the high rates of mobile phone penetration. Andrianaivo and Kpodar
(2012) further argue that variables capturing the cost of a local three-minute call with fixed and
mobile phones respectively might be subject to less bias, and hence could function as a proxy for
the diffusion of mobile phones. However, in contrast to their findings, the price variables came
out to be insignificant in this study.
The insignificant result of fixed telephone lines might be due to the fact that Africa has been able
to skip some of the development steps that today’s high-income counties had to undertake. As of
today, more advanced technology is available and can therefore be applied at once. Furthermore,
the negative coefficient of the interaction term between mobile phone penetration and GDP per
capita, imply that the marginal impact on mobile phone penetration drops with increasing income
levels. This result could possibly reflect diminishing growth returns to mobile phone
development, which is in line with the findings of Waverman et al. (2005) that mobile phone
penetration has a stronger impact in low-income countries.
Regarding the control variables, neither inflation nor institutional capacity showed a significant
effect on economic growth, regardless of model specification. As mentioned previously, the
inflation volatility appears to be very high in the studied countries and despite the use of two-year
averages the high rates remain, which is indicated by the high standard errors (see Table 2). The
combined inverse indexes of the average value of the Political Right Index and the Civil Liberty
Index might not fully capture the institutional capacity of the African countries, which may
explain why this variable is not shown to have a significant effect on economic growth, despite its
theoretically expected relevance.
The measures of financial inclusion applied throughout this paper capture the access dimension of
formal financial services. This broad concept of financial inclusion results in higher values of
financial sector outreach compared to measures of the use dimension. However, since the former
6 Loans are not reported since no significant effects were shown.

35
one only captures access to commercial banks, excluding access to financial services provided by
other types of formal financial institutions, may lead to some degrees of downward biasedness.
Another point that needs to be raised is how to measure the beneficiaries of increased financial
inclusion. As the direct beneficiaries grow in absolute numbers, that is, as more individuals gain
access to formal financial services, positive external effects are likely to be followed. The
measures of financial inclusion used in this study capture the individual consumer and do not
take suppliers or distributors of financial services into account. An expected effect of greater
financial inclusion is increased demand for financial services, hence a higher demand for
investments in related activities. Consequently, this will contribute to job creation for suppliers as
well as distributors within the financial sector.
Furthermore, this study focuses on the “fragile middle class”, based on the assumption that the
individuals belonging to this income class (living on a $4-10 per day budget) have enough money
to cover basic needs and still have some disposable income, which much would benefit from
being deposited at a formal financial institution. Even though this being the hypothesis, we
cannot explicitly distinguish the fragile middle class from other income groups in the analysis,
simply because our measures are at aggregate level, and hence do not enable us to see within-
country differences. Being able to explicitly test for the anticipated different effects that access to
financial services may have for different income groups would therefore be a highly interesting
improvement of this study.
Despite the statistic and economic significance of these results, one needs to bear in mind that a
generalization to other continents might be limited. The main reason is the exceptionally rapid
growth in mobile phone penetration that has taken place in Africa during recent years, which
does not have any counterparts in the rest of the world. In addition, the financial inclusion gap is
particularly prominent in Africa.
As previously discussed, the underlying hypothesis of the development path towards financial
inclusion starts with access to a mobile phone. This will increase the likelihood to gain access to
mobile financial services; the first step towards financial inclusion. Although this step is beneficial
per se, the underlying thought is that access to mobile financial services successively will increase
the opportunities for the individual to be a part of the overall financial system. Thereby, mobile-
based financial services can act as a stepping stone towards financial services of a more formal
type, such as deposit accounts at commercial banks. In terms of this prediction, the findings in
this study reveal a very important insight, namely that the measure of financial inclusion – the
number of deposit and loans – only includes these financial services at commercial banks,
thereby pointing towards the conclusion that the hypothesized financial inclusion development
path indeed is confirmed. However, since we do not have specific measures that can take into
account the number of people that previously only used mobile financial services but now have
entered the next dimension of financial services, i.e. by having access to financial services at
commercial banks. Lastly, all this brings about suggestions for future research, which should aim
at capturing different stages throughout the development path of financial inclusion. By doing so,
important bottlenecks can be revealed and further help stakeholders to design appropriate
policies and make strategic investment.

36
Finally, since the findings imply great potential for mobile phone penetration and the
opportunities that mobile financial services have in contribution to financial inclusion, and
further to economic growth, African policymakers should be encouraged to facilitate further
progress within these fields. This may in particular be important for policymakers in the very
low-income African countries, since the positive relationship between mobile phone penetration
and financial inclusion is shown to be most prominent for these countries.
8. Conclusion
The aim of this study has been to assess the impact of mobile phone penetration on economic
growth. Based on a sample of 44 African countries during the period 2000-2011, the relationship
between mobile phone penetration, measured as the number of mobile phone subscribers per
capita, and economic growth has been examined. Using a dynamic panel data model, a System
GMM estimator has been applied to address any issues of endogeneity. This study has further
utilized the unique situation of the African “mobile revolution” in combination with the
continent’s large financial infrastructure gap by addressing the question whether financial
inclusion, measured as the number of deposits and loans per capita, act as a channel through
which mobile phone penetration affects economic growth. The results suggest that mobile phone
penetration is a positive and significant contributor to economic growth in Africa, and a part of
the positive effect is channelized through financial inclusion, when measured as deposit accounts.
However, even though financial inclusion does function as a channel through which mobile
penetration affects economic growth, this relationship is not as strong as expected. Nevertheless,
when excluding the five richest countries in the sample and the first half of the studied period, a
positive and significant relation is revealed. This finding points towards the particular importance
of mobile phone penetration in the countries with very low-income levels, which are also those
countries where mobile phones have diffused the most in recent years. In addition, other ICT
variables such as Internet users and the number of broadband subscribers are also associated
with a positive, but somewhat smaller effect on economic growth.
The findings suggest that policy promotions and regulations should be targeted towards further
utilization of the great potential for inclusive growth that higher mobile phone penetration
reveals. Moreover, there is a growing demand for formal financial services since the absolute
incomes at the bottom of the pyramid in many of the world’s poorest countries are rising,
implying that more people are moving away from incomes at subsistence levels to have some
disposable surplus. The technologies needed to deepen financial inclusion among these people
are claimed to already be in place, the question becomes how to put them in practice. On top of
that, financial inclusion is highly prioritised by policymakers worldwide. Thereby, financial
inclusion is likely to increase in the near future, and in turn contribute to financial development
and economic growth.
Future research within the field of financial inclusion holds great promises, in particular since a
second version of the Global Findex will be available in 2015. This database, containing detailed
37
information on various aspects of financial inclusion, will open up the possibility for more
extensive studies. In addition, as the time passes, the longitudinal dimension will improve,
enabling panel data analysis over longer periods. This will make the results less vulnerable to
short-term fluctuations and also have the possibility to capture potentially lagged effects of the
increase in mobile phone deployment. Another suggestion for future research would be to
measure financial inclusion in terms of deposit and loan accounts at financial institutions that go
beyond commercial banks, which assumingly account for a substantial part of financial services in
many African countries, most notably microfinance.
As final remarks, the findings in this paper underline the importance of mobile phone diffusion
for African economies. Not only does greater mobile phone penetration allow people to stay in
contact with each other, its applications goes far beyond traditional views and towards a more
technologically advanced and economically significant field, namely mobile financial services.
Through these new technologies, large segments of poor, previously financially excluded
populations can be reached. Thus, African policy makers should promote and facilitate
interaction and investments in mobile phone deployment and its related financial services. Mobile
financial diffusion has the potential to reduce the current financial infrastructure gap in Africa,
help creating a more inclusive global financial landscape and boost economic growth.
38
9. References Aghion, P., and Howitt, P. (2009). The economics of growth, MIT Press. Anderson, T.W., and Hsiao, C. (1981). Estimation of dynamic models with error components. Journal of the American Statistical Association, 76(375):598–606. Andrianaivo, M., and Kopodar, K. (2012). “Mobile phones, financial inclusion, and growth”. Review of Economics and Institutions, 3(2), Article 4. Aportela, F. (1999). Effects of financial access on savings by low-income people. Research Department, Banco México, Mexico. Arellano, M. (1989). “A note on the Anderson-Hsiao estimator for panel data”. Economics Letters, Elsevier 31(4):337-341. Arellano, M., and Bond, S. (1991). ”Some tests of specification for panel data: evidence and an application to employment equations”. The Review of Economic Studies 58:277-297. Ashraf, N., Karlan, D., and Yin, W. (2006). “Tying the Odysseus to the mast: evidence from a commitment savings product in the Philippines”. Quarterly Journal of Economics 121(2):635-72. Ashraf, N., Karlan, D., and Yin, W. (2010). “Female empowerment: further evidence from a commitment savings product in the Philippines”. World Development 28(3):333-44. Baltagi, B.H. (2009). Econometric analysis of panel data. John Wiley & Sons, Lts. Beck, T., Demirgüç-Kunt, A. and Martinez-Peria, S. (2007). “Reaching out: Access to and use of banking services across countries”. Journal of Financial Economics, Vol. 85 (1):234-266. Beck, T., Levine, R., and Levkov, A. (2010). “Big Bad Banks? The Winners and Losers from Bank Deregulation in the United States”. Journal of Finance 65(5):1637-67. Beck, T., de la Torre, A. (2007). “The basic analytics of access to financial services”. Financial Markets, Institutions and Instruments 16. Becker, G.S. (1975). Human capital. New York: Columbia University Press. Birch-Sørensen, P., and Whitta-Jacobsen, H.J. (2010). Introducing advanced macroeconomics: Growth and business cycles. 2nd ed. McGraw-Hill. Blundell, R. and Bond, S. (1998). “Initial conditions and moment restrictions in dynamic panel data models”. Journal of Econometrics 87(1):115-143. Calem, P., and Nakamura, L., (1998) ”Branch banking and the geography of bank pricing”. The Review of Economics and Statistics, MIT Press 80(4):600-610. CGAP (Consultative Group to Assist the Poor). (2010). Financial Access 2010: The State of Financial Inclusion Through the Crisis. http://www.cgap.org. [Last accessed: 2014-05-20]
Chaia, A., Dalal, A., Goland, T., Gonzalez, M.J., Morduch, J., and Schiff, R. (2013). “Half the world is unbanked”, in Cull, et al. eds. Banking the World: Empirical Foundations of Financial Inclusion. Cambridge: MIT Press.
Datta, A., and Agarwal, S. (2004). “Telecommunications and economic growth: A panel data approach”. Applied Economics, 36(15):1649-54. Demirgüc-Kunt, A., and Klapper, L. (2012). “Measuring financial inclusion: The global findex database”. Policy research working paper 6025. Washington: World Bank. Demirgüc-Kunt, A., and Klapper, L. (2013). “Measuring financial inclusion: Explaining variation in use of financial services across and within countries”. Brookings Papers on Economic Activity, Spring 2013.

39
Demombynes, G., and Thegeya, A. (2012). “Kenya’s mobile revolution and the promise of mobile savings”. Policy Research Working Paper 5988. The World Bank, Africa Region. Dupas, P., and Robinson, J. (2011). “Why don’t the poor save more? Evidence from health savings experiments.” NBER Working Paper 17255. National Bureau of Economic Research, Cambridge, MA. Dupas, P., and Robinson, J. (2013). “Savings constraints and microenterprise development: Evidence from a field experiment in Kenya”. American Journal: Applied Economics 5(1), pp. 163-92. Faye, I., and Triki, T. (2013). “VII Financial inclusion in Africa: The transformative role of technology in financial inclusion in Africa”. African Development Bank. FI2020. (2013). “Seizing the moment: On the road to financial inclusion”. Financial inclusion 2020, a global forum. Center for Financial inclusion. Accion. Galor, O., and Zeira, J. (1993). “Income distribution and macroeconomics”. Review of Economic Studies 60:35–52. Grace, J., Kenny, C., and C. Z-W. Qiang, (2003). “Information and communication technologies and broad based development: A partial review of the evidence”. Working Paper, Technical Report 12. Washington: World Bank. GSMA Women (2013). “Unlocking the potential: Women and mobile financial services in emerging markets”. In partnership with Visa Inc. Hardy, A.P. (1980). “The role of the telephone in economic development”. Telecommunications Policy, 4(4):278-286. IMF (2014). “Regional economic outlook, Sub-Saharan Africa – Fostering durable and inclusive growth”, April 2014. World Economic and Financial Surveys. Jerven, M. (2013). Poor numbers: How we are misled by African development statistics and what to do about it. Cornell University Press, Cornell Studies in Political Economy. Kathuria, R., Uppal, M., Matma. (2009). “An econometric analysis of the impact of mobile”. The Vodaphone Policy Paper Series (9):5-20. Kendall, J., Mylenko, N., and Ponce, A. (2010). “Measuring financial access around the world”. Policy Research Working Paper, No 5253. Washington: World Bank. Klapper, L., Laeven, L., Rajan, R. (2006). “Entry regulation as barrier to entrepreneurship”. Journal of Financial Economics 82:591–629. Kumar, N. (2013). “Financial inclusion and its determinants: evidence from India”. Journal of Financial Economic Policy, Vol. 5 Iss: 1, pp.4 – 19. Lee, S., Levendis, J., and Gutierrez, L. (2009). “Telecommunications and economic growth: An empirical analysis of Sub-Saharan Africa”. Working paper 005512. Bogota Universidad del Rosario. Levine, R. (2005). Finance and growth: theory and evidence. In: Aghion, P., Durlauf, S. (Eds.). Handbook of Economic Growth. Elsevier Science, Netherland. Lewin, D., and Sweet, S. (2005). “The economic impact of mobile services in Latin America, technical report”. London: Report from the GSMA, GSM Latin America, and AHCIET. Mincer, J. (1974). Schooling, experience, and earnings. New York: Columbia University Press. Norton, S.W. (1992). “Transaction costs, telecommunications, and the microeconomics of macroeconomic growth”. Economic Development and Cultural Change, 41(1), pp.175-96. Pénicaud, C., and Katakam, A. (2014). “State of the industry 2013: Mobile financial services for the unbanked”. GSMA Mobile Money for the Unbanked (MMU) program. Rajan, R., and Zingales, L. (2003). Saving Capitalism from the Capitalists. Crown Business Division of Random House, New York.

40
Rand, J., and Tarp, F. (2002). “Business cycles in developing countries: Are they different?” World Development, Vol. 30(12):2071-2088. Roodman, D. (2009a). “How to do xtabond2: An introduction to difference and system GMM in Stata”. Stata Journal 9(1):86-136. Roodman, D. (2009b). “Practitioner’s corner: A note on the theme of too many instruments”. Oxford Bulletin of Economics and Statistics, 71 (1) 2009. Center for Global Development. Röller, L.H., and Waverman, L. (2001). “Telecommunications infrastructure and economic development: A simultaneous approach”. American Economic Review, 91(4):909-23. Sridhar, K.S., and Sridhar, V. (2004). “Telecommunications infrastructure and economic growth: Evidence from developing countries”. Working Paper 04/148. New Delhi: National Institute of Public Finance and Policy). The Economist (2014). Nigeria’s GDP, Step change: Revised figures show that Nigeria is Africa’s largest economy. The Economist, April 2014. http://www.economist.com/news/finance-and-economics/21600734-revised-figures-show-nigeria-africas-largest-economy-step-change [Last accessed: 2014-05-23] Tornell, A. and Westermann, F. (2003). “Credit Market Imperfections in middle income countries” NBER Working Paper 9737. Verbeek, M. (2012). A Guide to Modern Econometrics, 4th Edition, Wiley. Waverman, L., Meschi, M., and Fuss, M. (2005). “The impact of telecoms on economic growth in developing countries”. The Vodaphone Policy Paper Series, (2):10-23. Windmeijer, F. 2005. ”A finite sample correction for the variance of linear efficient two-step GMM estimators”. Journal of Econometrics 126: 25–51. World Bank (2014). Global Financial Development Report, Financial Inclusion. Washington DC: International Bank for Reconstruction and Development / The World Bank. World Bank (2014b). World Bank list of economies (February 2014). http://data.worldbank.org/about/country-classifications/country-and-lending-groups [Last accessed: 2014-05-23] World Economic Forum (2014). Delivering Digital Infrastructure: Advancing the Internet Economy. Industry Agenda. Prepared in Collaboration with The Boston Consulting Group.

41
Appendix 1
Table 7: Sample of 44 African Countries
Algeria Libya
Angola Madagascar
Benin Malawi
Botswana Mali
Burkina Faso Mauritania
Burundi Mauritius
Cameroon Morocco
Cape Verde Mozambique
Central African Republic Namibia
Chad Niger
Congo Rwanda
Congo, Dem. Rep. Senegal
Cote d'Ivoire Seychelles
Egypt Sierra Leone
Equatorial Guinea South Africa
Ethiopia Sudan
Gabon Swaziland
Gambia Tanzania
Ghana Togo
Guinea-Bissau Tunisia
Kenya Uganda
Lesotho Zambia
Table 8: Low Income Countries, 10th Percentile
Congo, Dem. Rep.
Burundi
Niger
Malawi
Madagascar
Table 9: High Income Countries, 90th Percentile
Equatorial Guinea
Seychelles
Libya
Botswana
Gabon

42
Appendix 2
Table 10: Variable Definition and Source
Variable Definition Source
GDP per capita, PPP (constant 2005 international $)
GDP per capita based on purchasing power parity (PPP), measured in constant 2005 international dollars.
World Development Indicators, UN Data, Africa Development Indicators, International Financial Statistics
School enrolment, primary (% net)
Gross enrolment ratio is the ratio of total enrolment, regardless of age, to the population of the age group that officially corresponds to the level of education shown.
Government consumption (% of GDP)
General government final consumption expenditure includes all government current expenditures for purchases of goods and service incl. compensation of employees and expenditure on national defence and security, in percentage of GDP.
Inflation (annual %) Annual change in Consumer Price Index (CPI)
Institutions Inverse indexes of the average value of Political Right Index and Civil Liberty Index.
Freedom House
Mobile phone subscribers per capita
Subscribers to a public mobile telephone service using cellular technology.
International Telecommunication Union, World Bank
Telephone lines per capita
Fixed telephone lines connected to a subscriber's terminal equipment to the public switched telephone network and have a port on a telephone exchange. Integrated services digital network channels and fixed wireless subscribers are included.
Price of 3-min mobile local call
The price of a 3-minute peak rate call from a mobile cellular telephone to a mobile cellular subscriber of the same network, in USD.
Price of 3-min fixed phone call
The price of a 3-minute peak rate call between two fixed telephone lines, in USD.
Broadband subscribers per capita
Total number of broadband subscribers with a digital subscriber line, cable modem, or other high-speed technologies, divided by adult population (+15).
Internet users per capita Internet users are people with access to the worldwide network divided by adult population.
Private credit to GDP Private credit by deposit money banks and other financial institutions as percentage of GDP
Financial Structure Database
Deposit accounts per capita
Total number of deposit accounts that are held by resident households and nonfinancial corporations (public and private) in commercial banks for every adult in the reporting country. World Development
Indicators, CGAP, Global Findex
Loan accounts per capita Total number of loan accounts that are held by resident households and nonfinancial corporations (public and private) in commercial banks for every adult in the reporting country.
Population density Population divided by land area in square km
Global Financial Development Database (GFDD)
Bank density Number of branches of commercial banks (retail locations of resident commercial banks that provide financial services to customers and are physically separated from the main office) per 1,000 sq. km.
Banks overhead costs Accounting value of banks’ operating costs as share of total assets

43
Appendix 3
Table 11: Correlation Matrix, Logged Variables
Real GDP per capita
Govt. cons.
Edu cation
Infla tion
Instit utions
Fixed phones
Mobile phones
Price 3-min fixed call
Price 3-min mobile call
Broad band
Internet users
Private credit /GDP
Deposits Loans Bank
density Population
density Banks
OH costs
Real GDP per capita 1
Government consumption -0,174 1
Education 0,1765 0,2805 1
Inflation -0,3822 0,0078 -0,1687 1
Institutions 0,2346 0,6276 0,1633 -0,0168 1
Fixed telephone lines 0,7912 0,2069 0,3178 -0,2946 0,4912 1
Mobile phone subscribers 0,621 0,1015 0,3422 -0,3632 0,2469 0,5602 1
Price 3-min fixed call -0,1992 0,2585 0,1347 -0,1248 0,1028 -0,3719 0,1531 1
Price 3-min mobile call -0,015 0,1095 -0,0523 -0,0072 0,0055 -0,2664 -0,0414 0,5039 1
Broadband subscribers 0,6646 0,0383 0,3748 -0,2032 0,2558 0,6771 0,7398 -0,1825 -0,223 1
Internet users 0,6335 0,1672 0,3864 -0,286 0,3406 0,7921 0,8057 -0,108 -0,2534 0,7952 1
Private credit/GDP 0,5014 0,4153 0,2906 -0,1871 0,6256 0,8047 0,4359 -0,2946 -0,2641 0,5428 0,6737 1
Deposits 0,6881 0,2442 0,2905 -0,2377 0,573 0,8803 0,6137 -0,2354 -0,2955 0,7022 0,8098 0,7154 1
Loans 0,711 0,3768 0,2358 -0,2381 0,7024 0,8818 0,6096 -0,1648 -0,1436 0,6209 0,7299 0,8319 0,8829 1
Bank density 0,2699 0,051 0,4597 -0,0711 0,3308 0,5362 0,281 -0,3491 -0,418 0,4638 0,5914 0,5147 0,5879 0,3791 1
Population density -0,2005 -0,0158 0,4071 0,0544 0,0675 0,0844 -0,086 -0,2622 -0,4273 0,0895 0,203 0,2026 0,1308 -0,0776 0,8387 1
Banks overhead costs -0,6687 0,0068 -0,3027 0,3322 -0,0111 -0,6739 -0,4034 0,3894 0,303 -0,5853 -0,5325 -0,4343 -0,5572 -0,478 -0,3051 -0,0184 1
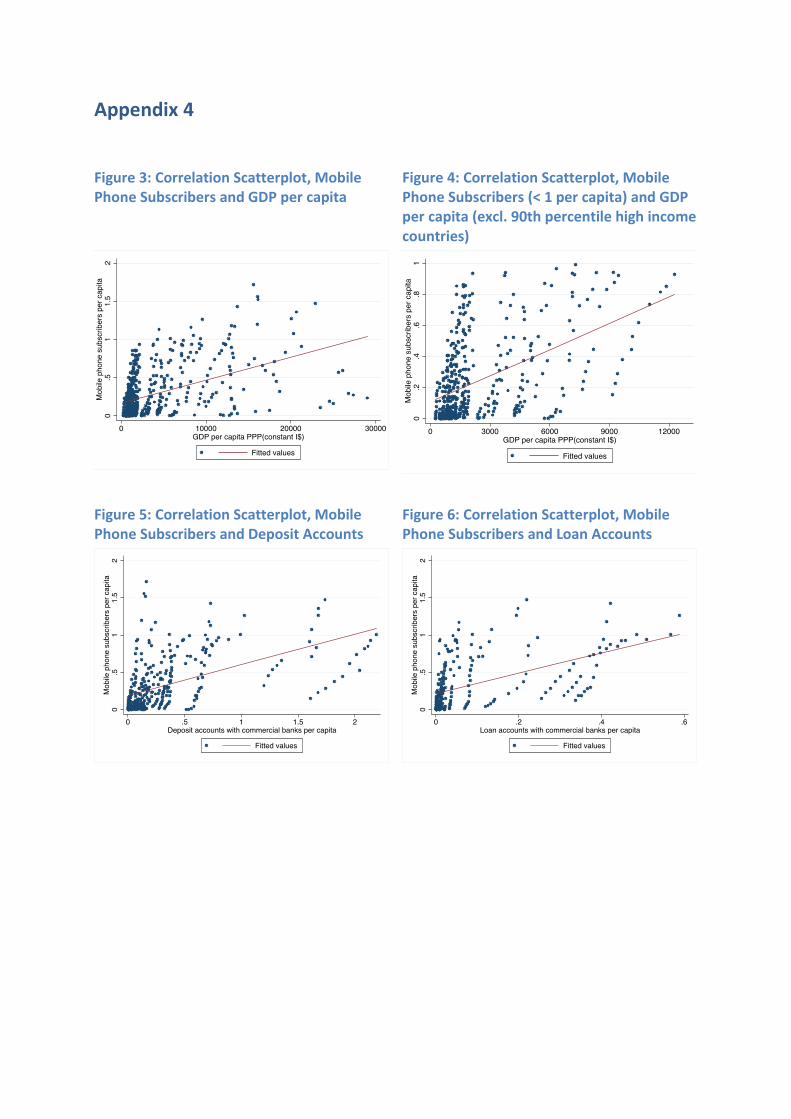
Appendix 4
Figure 3: Correlation Scatterplot, Mobile Phone Subscribers and GDP per capita
Figure 4: Correlation Scatterplot, Mobile Phone Subscribers (< 1 per capita) and GDP per capita (excl. 90th percentile high income countries)
Figure 5: Correlation Scatterplot, Mobile Phone Subscribers and Deposit Accounts
Figure 6: Correlation Scatterplot, Mobile Phone Subscribers and Loan Accounts

45
Appendix 5
Table 12: Mobile Phone Penetration, Financial Inclusion and Economic growth
2000-2011 2005-2011
Excl. 10th percentile
lowest GDP pc
Excl. 90th percentile highest
GDP pc
Excl. 10th percentile
lowest GDP pc
Excl. 90th percentile
highest GDP pc
All countries
Excl. 90th percentile highest
GDP pc
Excl. 10th percentile
lowest GDP pc
(1) (2) (4) (3) (5) (6) (7)
Lagged Real GDP per capita
-0.2566*** 0.2720** -0.0658 0.0500 0.0387 -0.3157** 0.0474
(0.0858) (0.1047) (0.2121) (0.2275) (0.1841) (0.1294) (0.143)
Mobile phone subscribers per capita
0.0224 0.0344** 0.0164 0.0216*** 0.0403** 0.0264*** 0.0403***
(0.0139) (0.0128) (0.0124) (0.0067) (0.0172) (0.0058) (0.014)
Deposits per capita – – 0.0199* 0.0419* 0.1835* 0.0765** 0.1008
(0.0097) (0.0223) (0.0928) (0.035) (0.1348)
Education 0.5503* 0.0899 0.7168 0.0708 -0.2291 -0.0947 0.0973
(0.2749) (0.1637) (0.5229) (0.1967) (0.2193) (0.035) (0.3852)
Government consumption
-0.1013*** -0.0381 -0.048 -0.0721 -0.0097 -0.0783 0.0318
(0.031) (0.0247) (0.0364) (0.0619) (0.0591) (0.0511) (0.0296)
Inflation 0.0003 0.0002 0.0004 0.0001 0.000 -0.0001 0.0001
(0.0005) (0.0003) (0.0005) (0.0003) (0.0013) (0.0006) (0.0012)
Institutions 0.0205 -0.0693 0.0183 -0.0133 0.0064 0.0729 -0.0852
(0.116) (0.0867) (0.1111) (0.1262) (0.0431) (0.0818) (0.0805)
Constant 0.2684*** 0.1522 0.1382** 0.2268 0.0271 0.2177* -0.0033
(0.0627) (0.0934) (0.0618) (0.155) (0.1116) (0.1153) (0.0585)
Observations 194 194 110 110 81 88 72
Number of countries 39 39 22 22 27 22 24
Hansen test (prob) 0.323 0.445 0.789 0.992 0.608 0.733 0.792
AR(2) (prob) 0.459 0.467 0.198 0.09 0.148 0.588 0.075
Standard deviation in parentheses, *** p<0.01, ** p<0.05, * p<0.1