the digital transformation: used car retail performance management 2.0
TRANSCRIPT

The digital transformation:Used car retail performancemanagement 2.0
E.N.G. Automotive FinanceRome – Jue 1, 2016
Jörg Höhner, Global Managing Director INDICATA
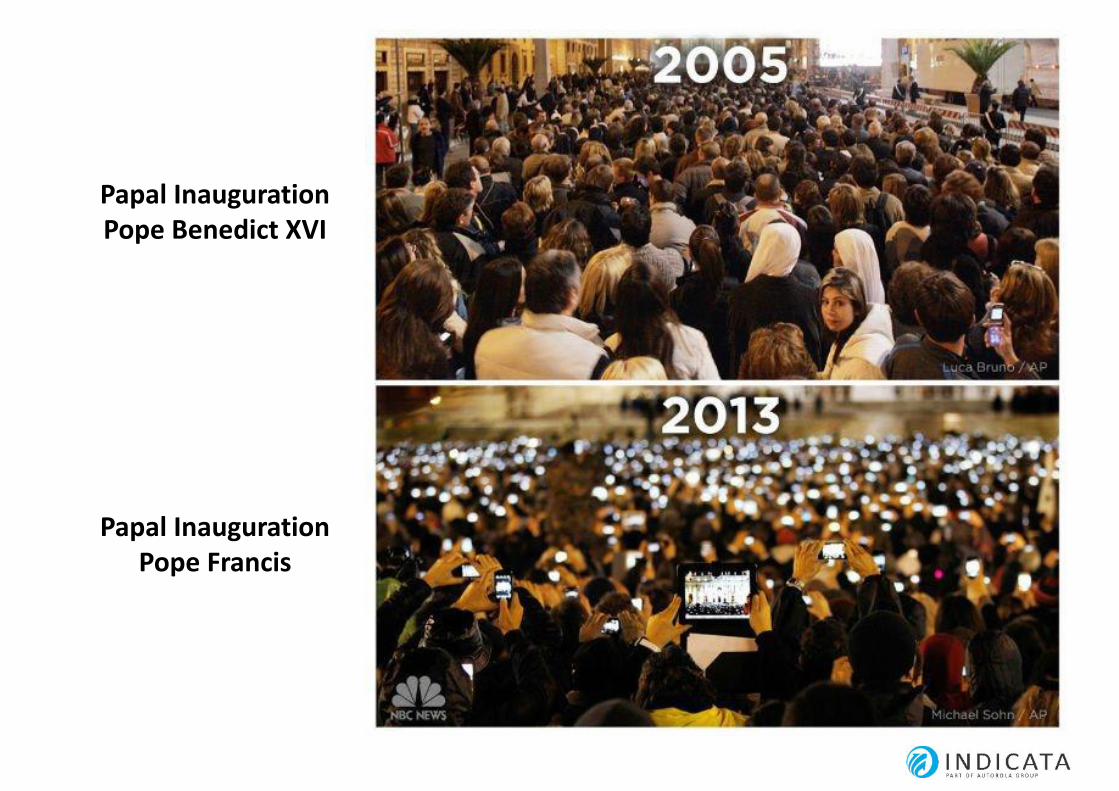
Papal InaugurationPope Benedict XVI
Papal InaugurationPope Francis
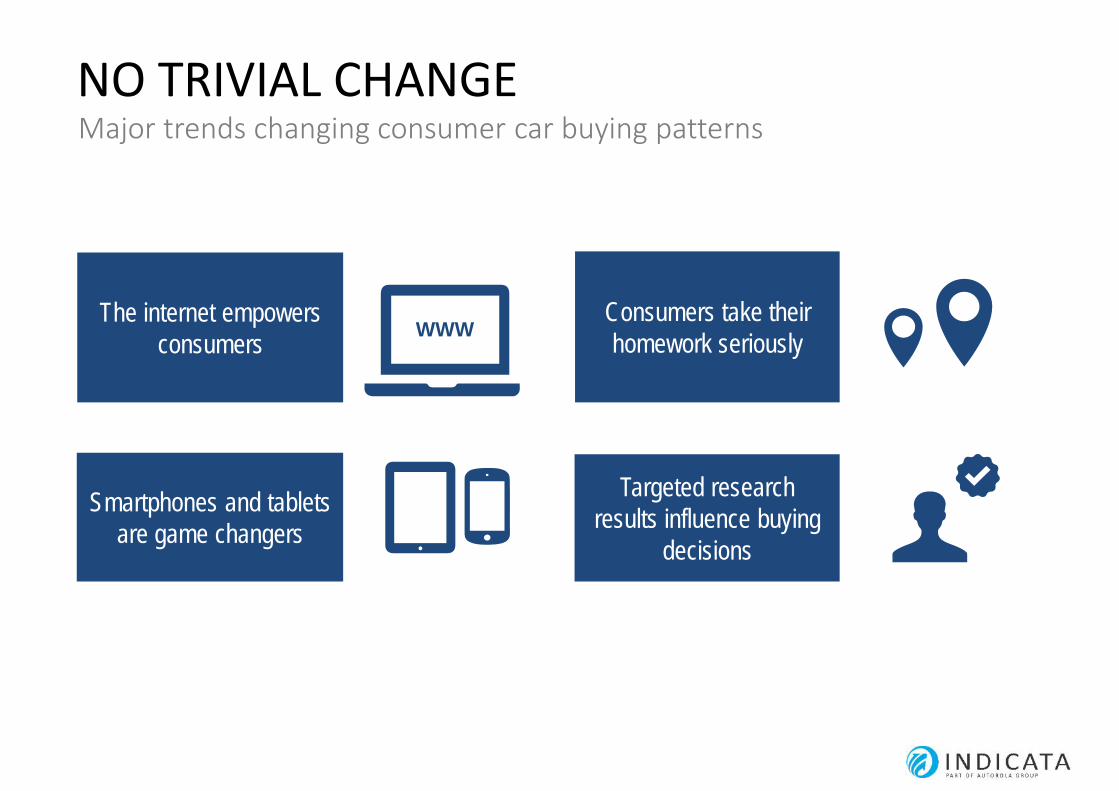
NO TRIVIAL CHANGEMajor trends changing consumer car buying patterns
The internet empowersconsumers
Smartphones and tabletsare game changers
Consumers take theirhomework seriously
Targeted researchresults influence buying
decisions
WWW
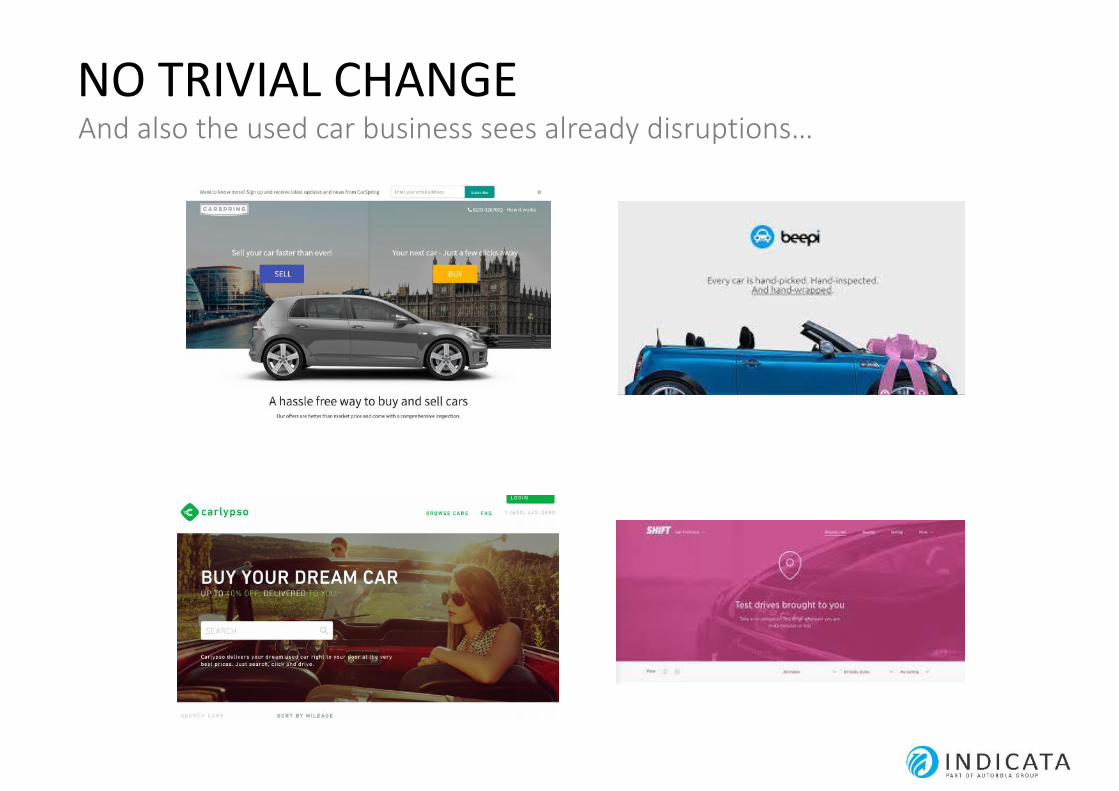
NO TRIVIAL CHANGEAnd also the used car business sees already disruptions…


In a time wheresupply and demandchanges faster thanever, data-driveninsights are vital todrive your usedvehicle business togrowth.
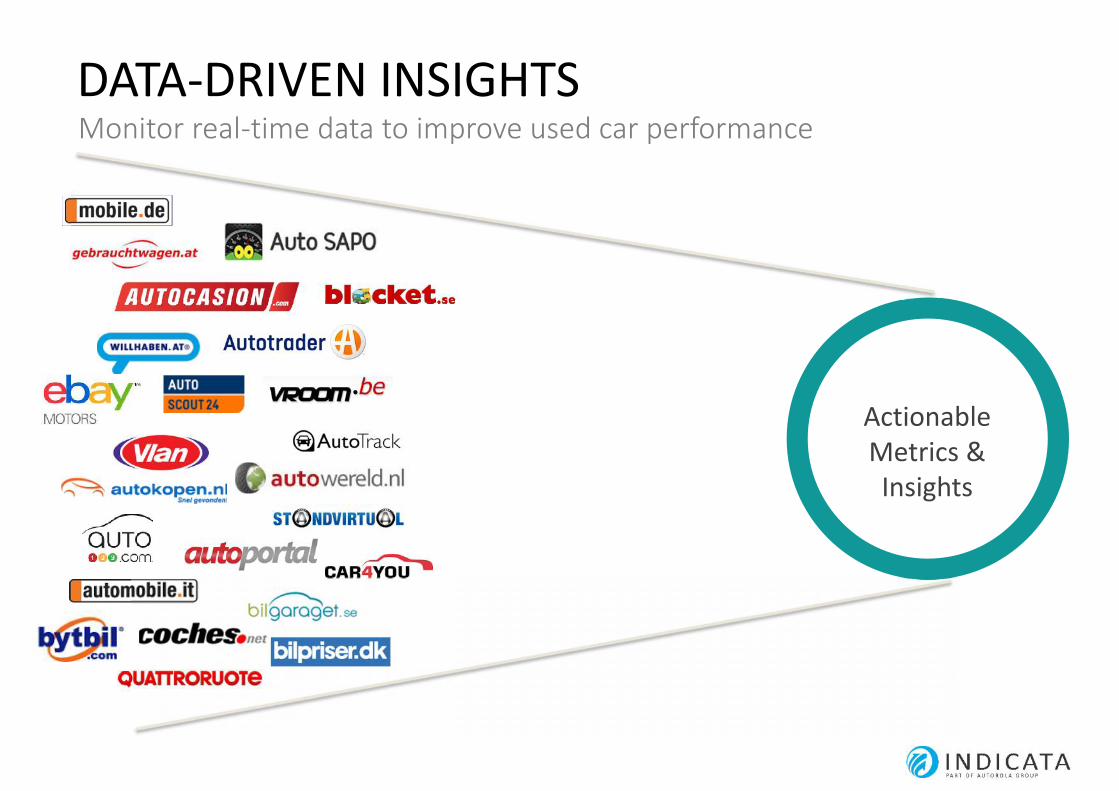
ActionableMetrics &Insights
DATA-DRIVEN INSIGHTSMonitor real-time data to improve used car performance

MARKET DAYSSUPPLY
PRICE TOMARKET
INVENTORYAGE
PRICINGSTRATEGY
STOCKTURN
SHARE OVERFIRST PRICETO MARKET
NUMBER OFPHOTOS
DATA-DRIVEN INSIGHTSKPIs to guide used vehicle suceess
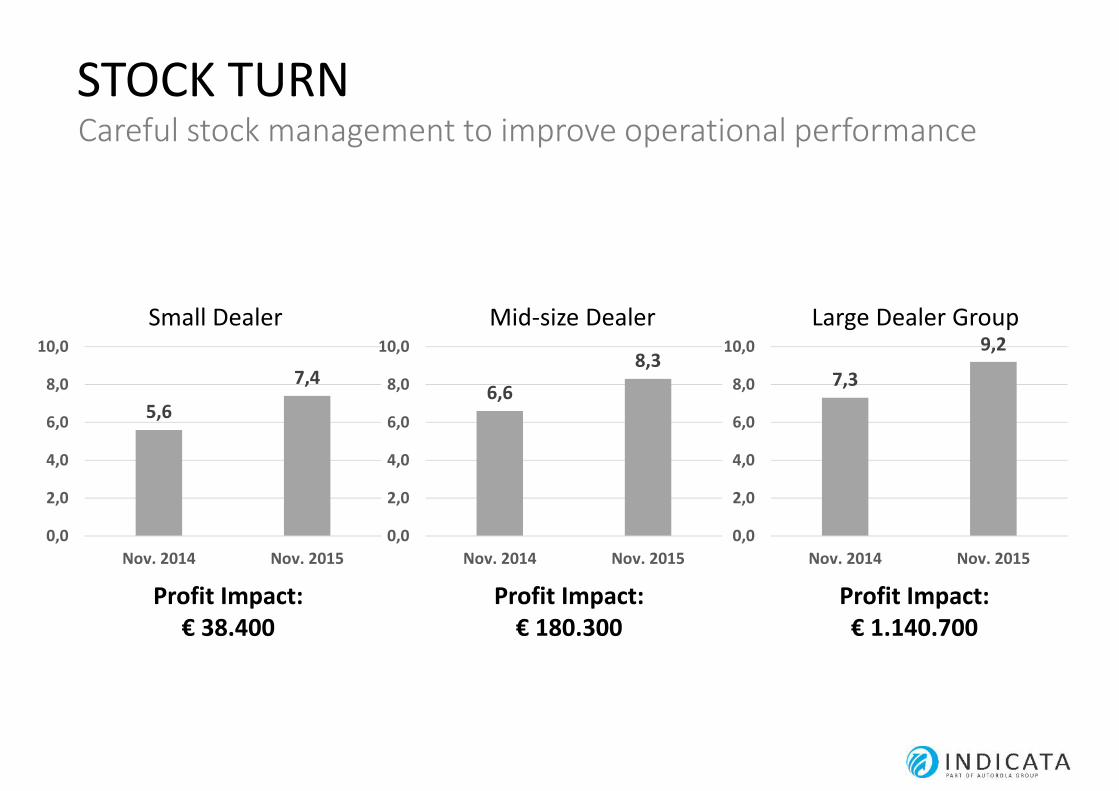
STOCK TURNCareful stock management to improve operational performance
5,67,4
0,0
2,0
4,0
6,0
8,0
10,0
Nov. 2014 Nov. 2015
Profit Impact:€ 38.400
Small Dealer
6,68,3
0,0
2,0
4,0
6,0
8,0
10,0
Nov. 2014 Nov. 2015
Profit Impact:€ 180.300
Mid-size Dealer
7,3
9,2
0,0
2,0
4,0
6,0
8,0
10,0
Nov. 2014 Nov. 2015
Profit Impact:€ 1.140.700
Large Dealer Group
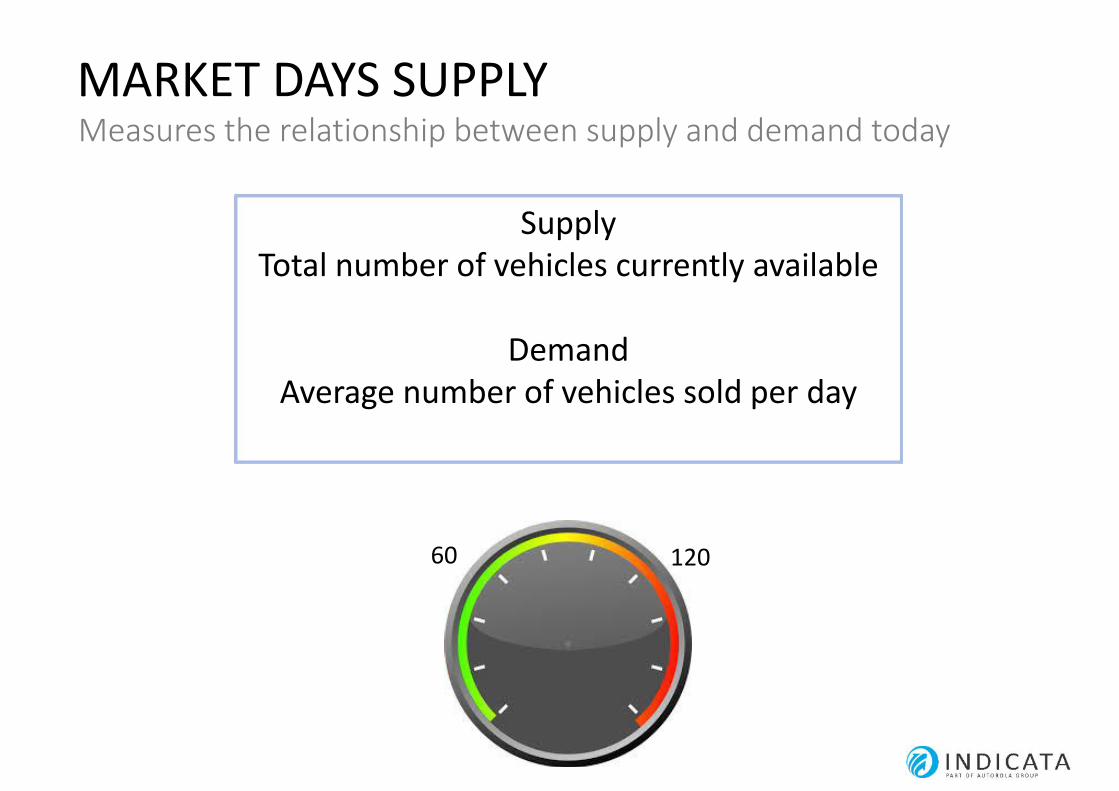
MARKET DAYS SUPPLYMeasures the relationship between supply and demand today
120
SupplyTotal number of vehicles currently available
DemandAverage number of vehicles sold per day
60
MARKET DAYS SUPPLYHow can Market Days Supply help protect residual values?
VolumeDistribution
PricingStrategy
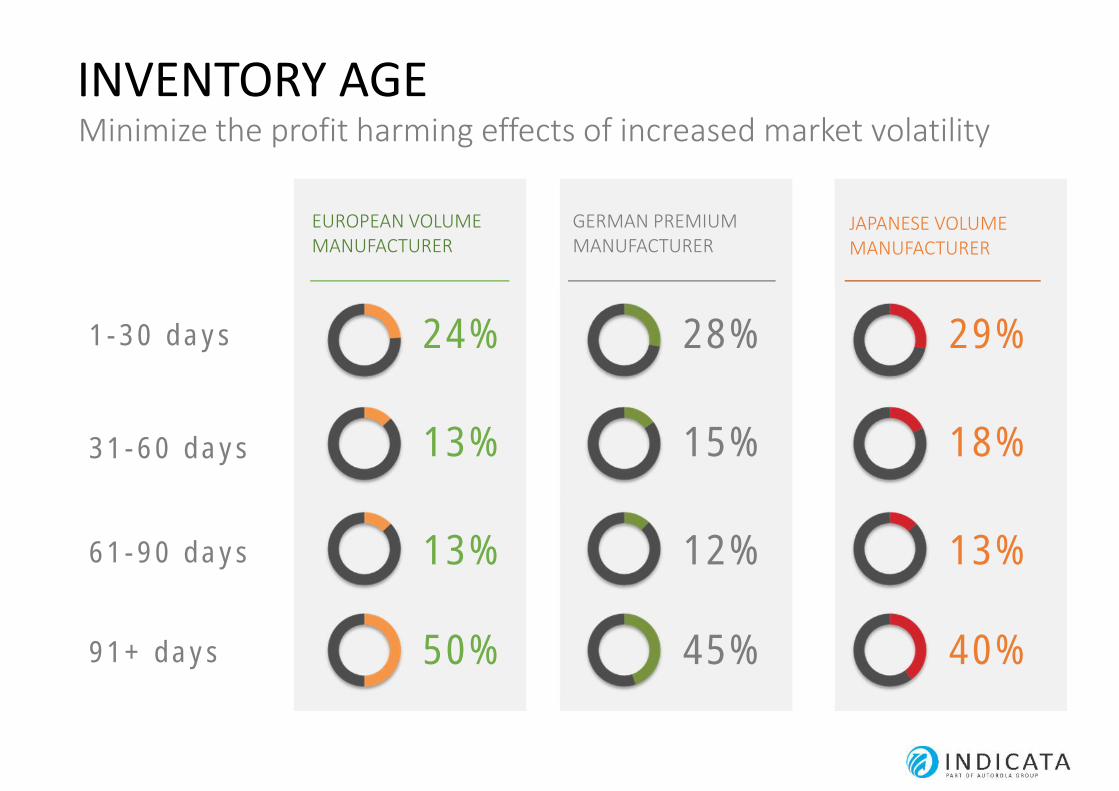
GERMAN PREMIUMMANUFACTURER
JAPANESE VOLUMEMANUFACTURER
EUROPEAN VOLUMEMANUFACTURER
1 - 3 0 d a y s
3 1 - 6 0 d a y s
6 1 - 9 0 d a y s
9 1 + d a y s
INVENTORY AGEMinimize the profit harming effects of increased market volatility
24%
13%
13%
50%
28%
15%
12%
45%
29%
18%
13%
40%
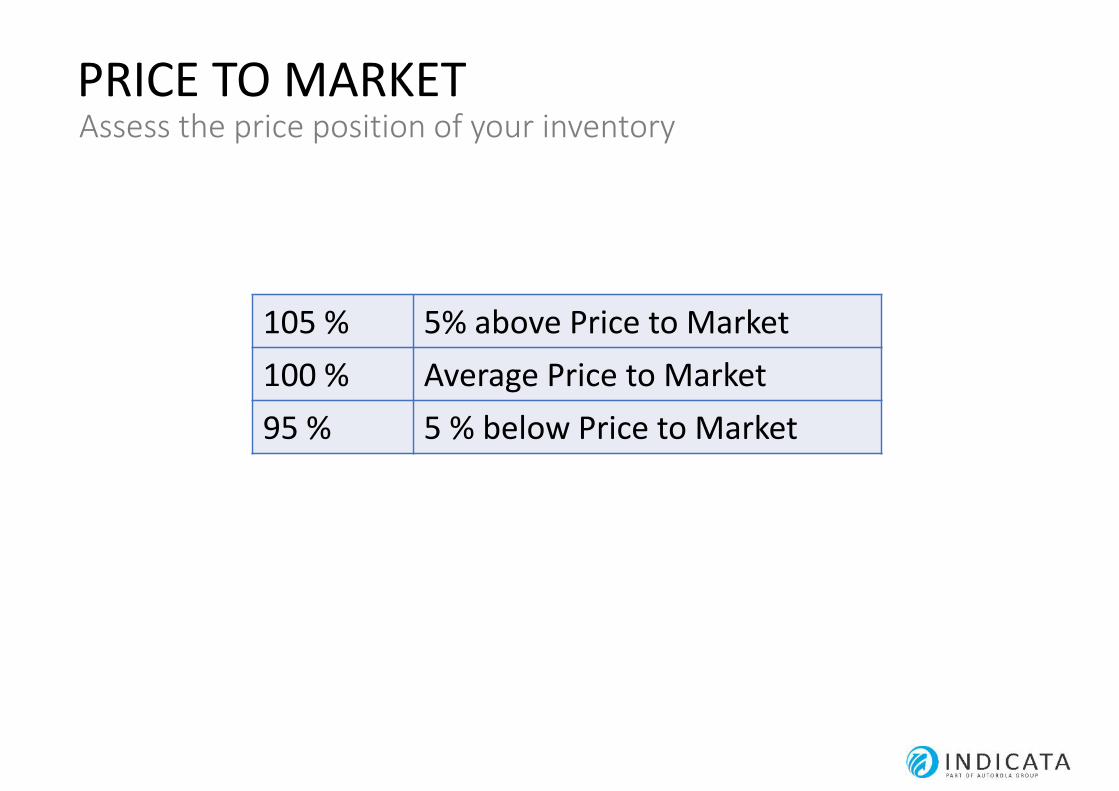
105 % 5% above Price to Market100 % Average Price to Market95 % 5 % below Price to Market
Nøgletal
PRICE TO MARKETAssess the price position of your inventory
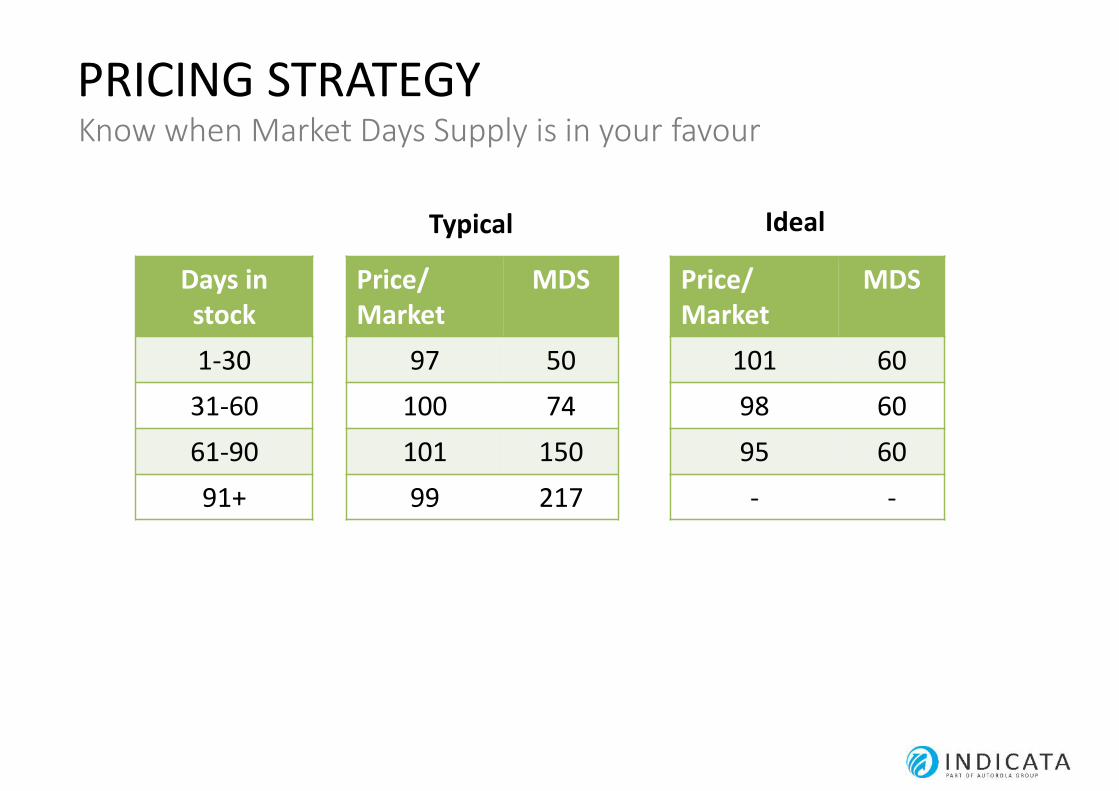
Price/Market
MDS
97 50100 74101 15099 217
Price/Market
MDS
101 6098 6095 60- -
Days instock1-30
31-6061-9091+
Typical Ideal
PRICING STRATEGYKnow when Market Days Supply is in your favour
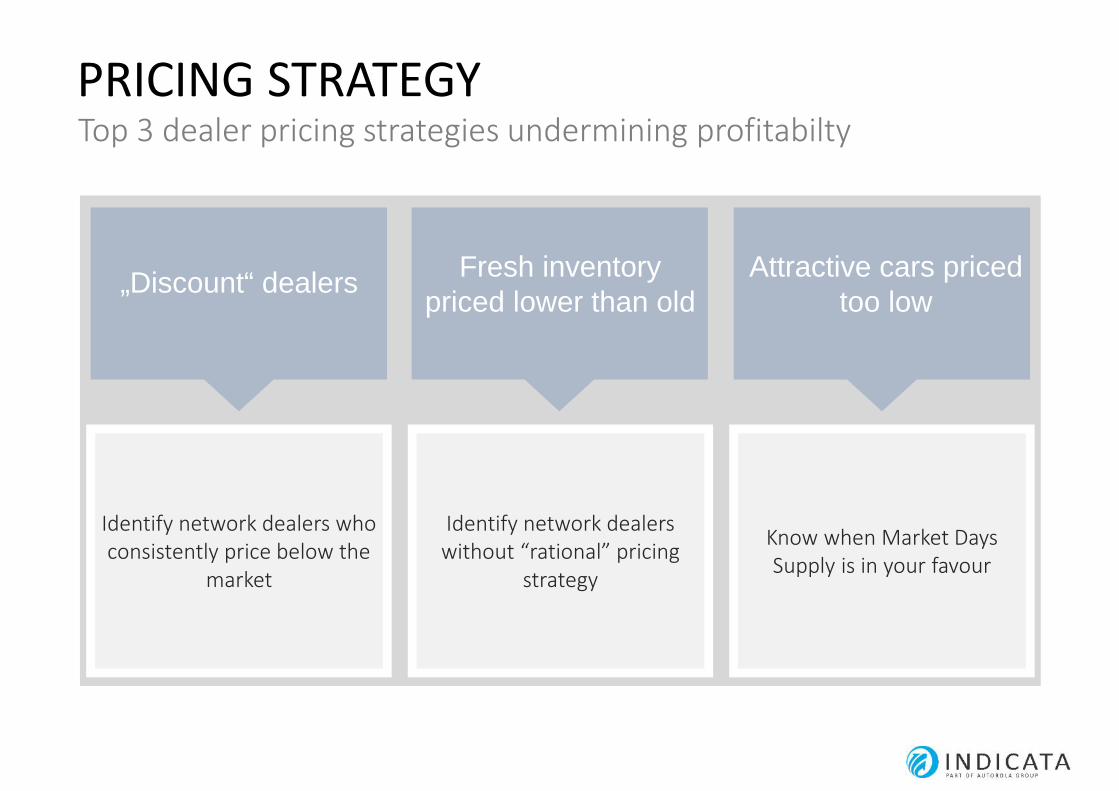
Attractive carspriced too low
Identify network dealers whoconsistently price below the
market
Identify network dealerswithout “rational” pricing
strategy
Know when Market DaysSupply is in your favour
„Discount“ dealers Fresh inventorypriced lower than old
Attractive cars pricedtoo low
PRICING STRATEGYTop 3 dealer pricing strategies undermining profitabilty
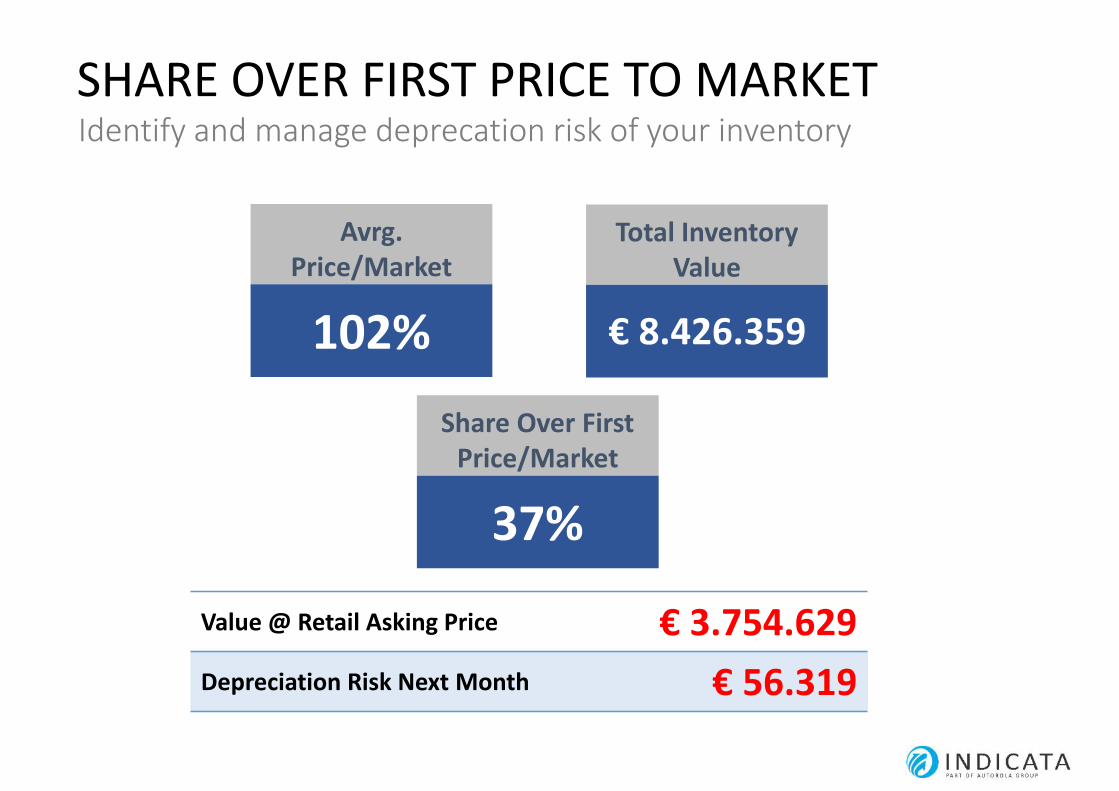
SHARE OVER FIRST PRICE TO MARKETIdentify and manage deprecation risk of your inventory
Avrg.Price/Market
102%
Total InventoryValue
€ 8.426.359
Share Over FirstPrice/Market
37%
Value @ Retail Asking Price € 3.754.629Depreciation Risk Next Month € 56.319
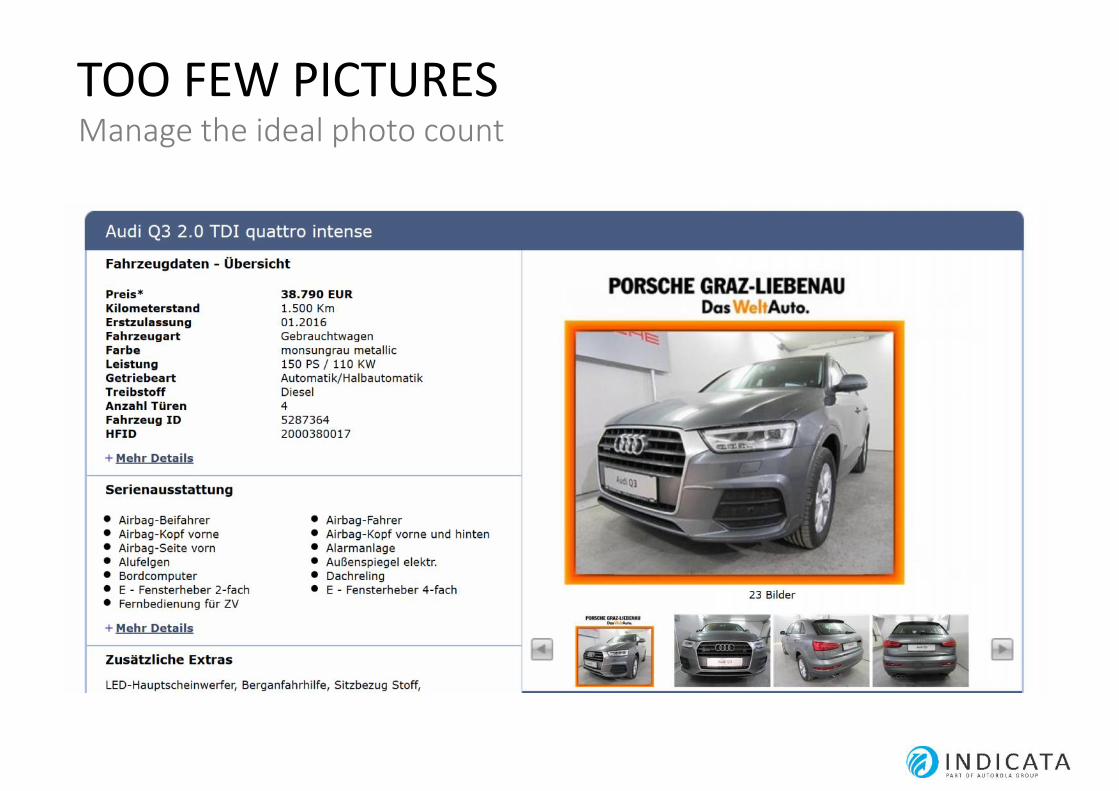
TOO FEW PICTURESManage the ideal photo count
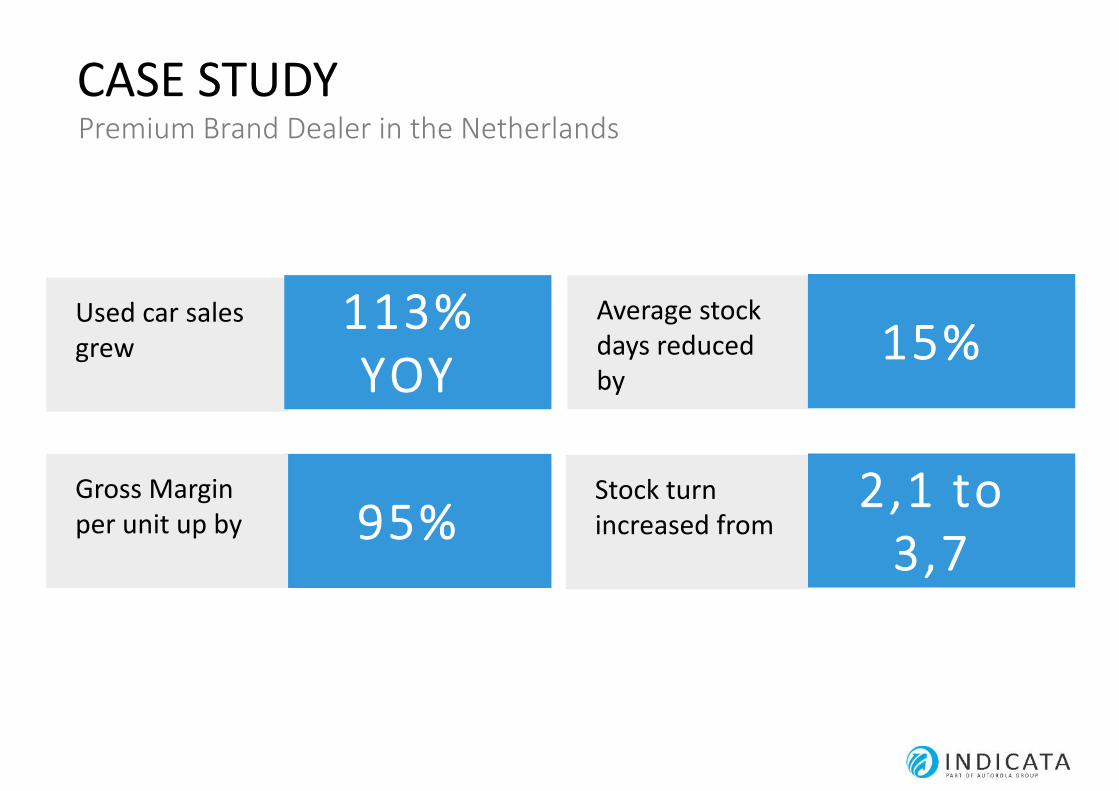
CASE STUDYPremium Brand Dealer in the Netherlands
Average stockdays reducedby
15%
95%Gross Marginper unit up by
Used car salesgrew
113%YOY
2,1 to3,7
Stock turnincreased from
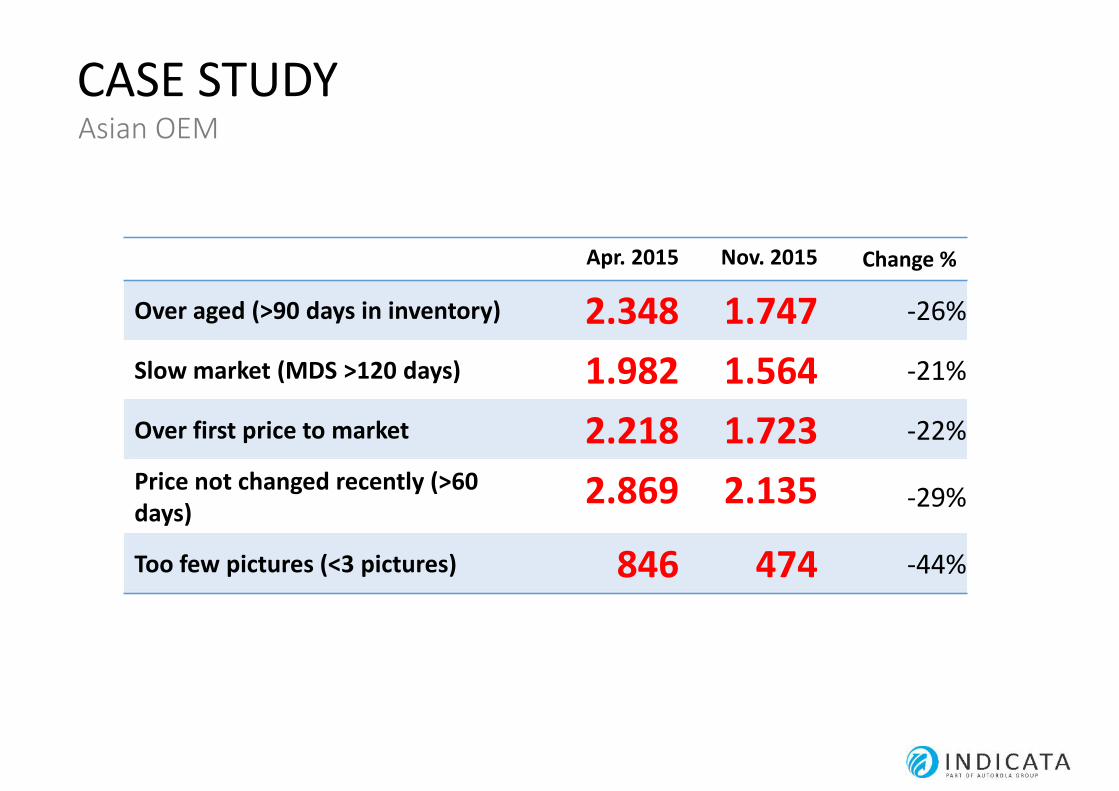
CASE STUDYAsian OEM
Apr. 2015 Nov. 2015 Change %
Over aged (>90 days in inventory) 2.348 1.747 -26%
Slow market (MDS >120 days) 1.982 1.564 -21%
Over first price to market 2.218 1.723 -22%
Price not changed recently (>60days)
2.869 2.135 -29%
Too few pictures (<3 pictures) 846 474 -44%
www.indicata.com