the distribution of income, wealth and taxes across washington households presented by lorrie jo...
TRANSCRIPT
The Distribution of Income, Wealth and Taxes Across Washington Households
Presented by Lorrie Jo Brown, Ph.D.Washington State OFM
PNREC, May 2013, Spokane

OVERVIEW
• A legislative mandated study.
• Analysis done by 3 Agencies, OFM, Department of Revenue, House Ways and Means Committee Staff.
• Led by OFM Forecasting.

There are 5 parts of the study:
• Washington Income Deciles from 2005-2009
• Income Mobility: Tracking 2005 Households Through 2009
• Washington Wealth Distribution
• Washington State and Local Tax Burden by Income Decile
• History of Tax Burden over Time• For entire report:
http://www.ofm.wa.gov/economy/default.asp
Part 1: Washington Income Deciles from 2005 to
2009
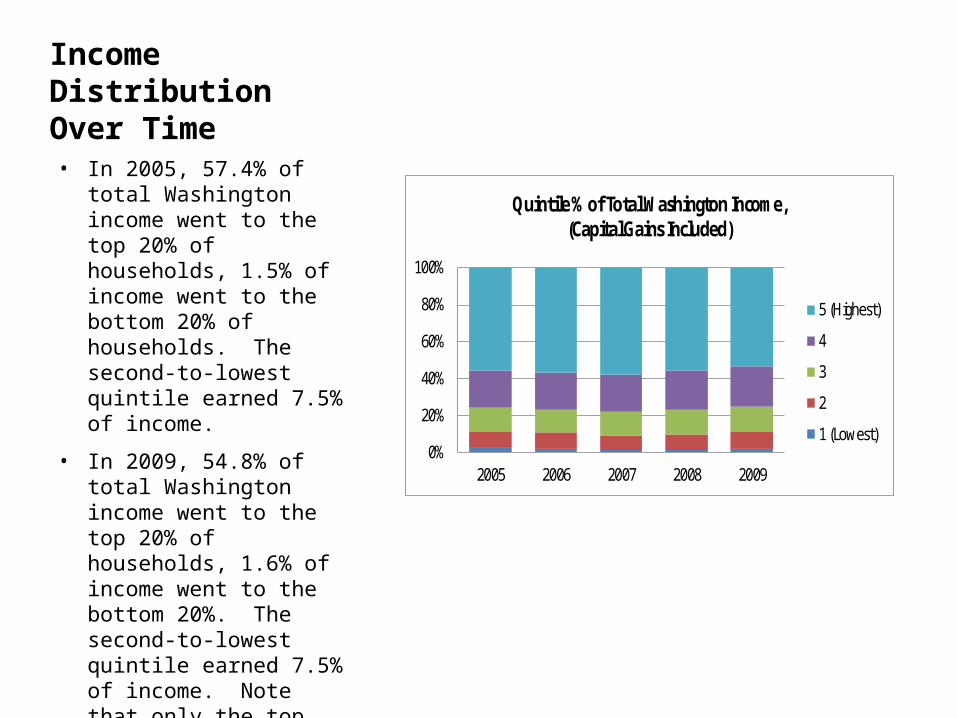
Income Distribution Over Time• In 2005, 57.4% of total
Washington income went to the top 20% of households, 1.5% of income went to the bottom 20% of households. The second-to-lowest quintile earned 7.5% of income.
• In 2009, 54.8% of total Washington income went to the top 20% of households, 1.6% of income went to the bottom 20%. The second-to-lowest quintile earned 7.5% of income. Note that only the top quintile lost a percentage of the share of total income between 2005 and 2009.
0%
20%
40%
60%
80%
100%
2005 2006 2007 2008 2009
Quintile % of Total Washington Income, (Capital Gains Included)
5 (Highest)
4
3
2
1 (Lowest)
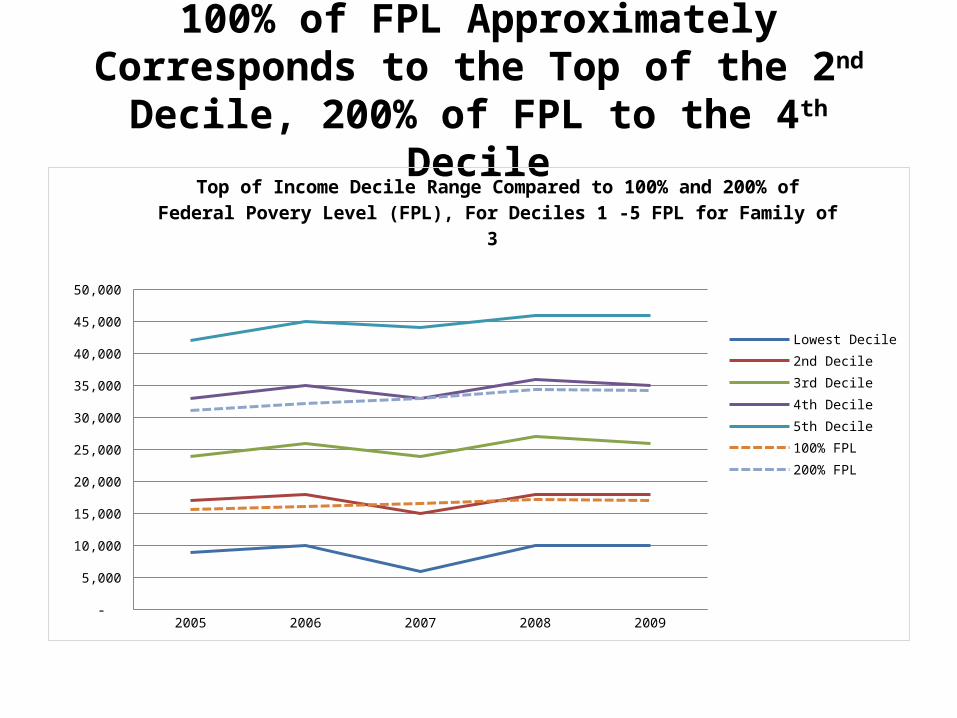
100% of FPL Approximately Corresponds to the Top of the 2nd Decile, 200% of FPL to the 4th Decile
2005 2006 2007 2008 2009 -
5,000
10,000
15,000
20,000
25,000
30,000
35,000
40,000
45,000
50,000
Top of Income Decile Range Compared to 100% and 200% of Federal Povery Level (FPL), For Deciles 1 -5 FPL for Family of 3
Lowest Decile2nd Decile3rd Decile4th Decile 5th Decile100% FPL200% FPL

All Income Deciles Decreased in Real Terms from 2005 to 2009
1 2 3 4 5 6 7 8 9 10
-35%
-30%
-25%
-20%
-15%
-10%
-5%
0%
Percentage Change in Real Income from 2005 to 2009 by Decile
Top of Decile Range Mean Income
Lowest Decile--------------------to----------------------Highest Decile
WASHINGTON INCOME DISTRIBUTION METHODOLOGY
• Income Distribution—Used IRS microdata.
• The tricky part was defining Households. Decided to define households as economic units.
• Matched married tax returns, also matched children to parents returns.
• Used a 3-step process for unmarried partners. First, matched non-married returns by address.
• Second used ACS data. Took all ACS respondents that live in a household with non-relatives and grouped them into the first-cut income quintiles.
• ACS also asks if the respondents live with an unmarried partner. The percentage that answered affirmative within each quintile subset of non-relative HHs was calculated.
• IRS non-relative households were randomly assigned non-married partner status based upon the above probabilities. Deciles and Quintiles re-run with new households.

Part 2: Income Mobility, Tracking Individual
Households from 2005 to 2009

More Households that Were in WA in 2005 Moved Up Than Down from 2005 to 2009
-9 -8 -7 -6 -5 -4 -3 -2 -1 0 1 2 3 4 5 6 7 8 90
5
10
15
20
25
30
35
40
2005 Households' Change in Deciles from 2005 to 2009
Percent of 2005 Households
Number of Deciles increased or decreased

INCOME MOBILITY METHODOLOGY
• Used IRS microdata longitudinally.
• Merged 5 years of tax return data for 2005 households that were also in 2009 (about 1.9 out of 2.5 million returns).
• Compared the 2009 decile with the 2005 decile for each decile.

Part 3: Washington Wealth Distribution
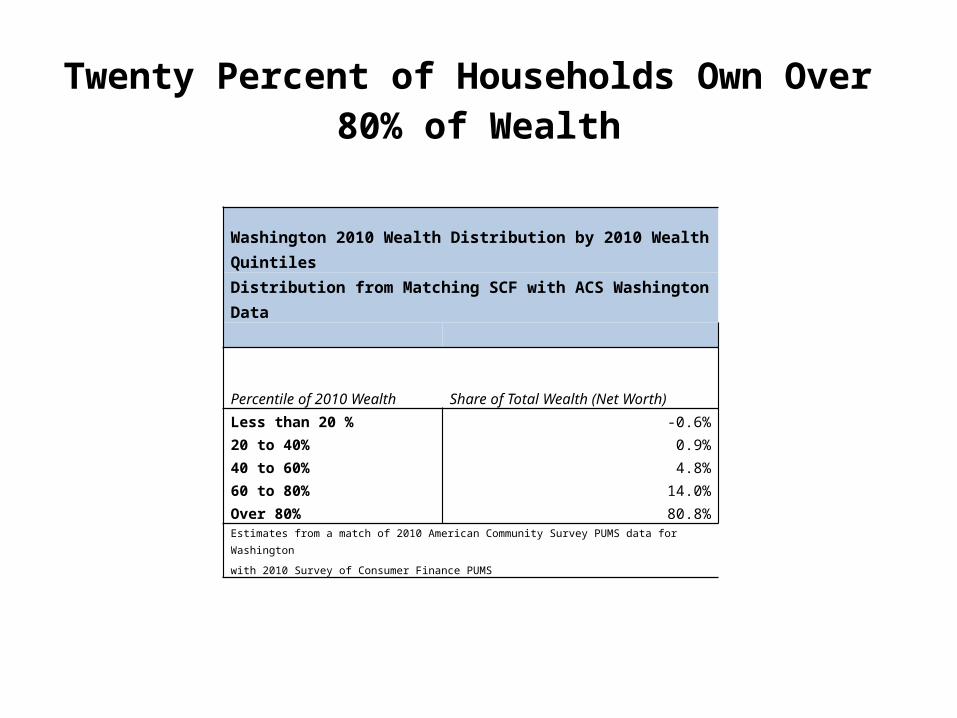
Washington 2010 Wealth Distribution by 2010 Wealth Quintiles
Distribution from Matching SCF with ACS Washington Data
Percentile of 2010 Wealth Share of Total Wealth (Net Worth)Less than 20 % -0.6%20 to 40% 0.9%40 to 60% 4.8%60 to 80% 14.0%Over 80% 80.8%
Estimates from a match of 2010 American Community Survey PUMS data for Washington
with 2010 Survey of Consumer Finance PUMS
Twenty Percent of Households Own Over 80% of Wealth

The Top Income Quintile Owns Over 50% of Wealth
Washington 2010 Wealth Distribution by 2010 Income QuintilesDistribution from Matching SCF with ACS Washington Data
Percentile of 2010 Income Share of Total Wealth (Net Worth)Less than 20 % 12.2%20 to 40% 8.4%40 to 60% 12.3%60 to 80% 16.2%Over 80% 50.9%Estimates from a match of 2010 American Community Survey PUMS data for Washington
with 2010 Survey of Consumer Finance PUMS
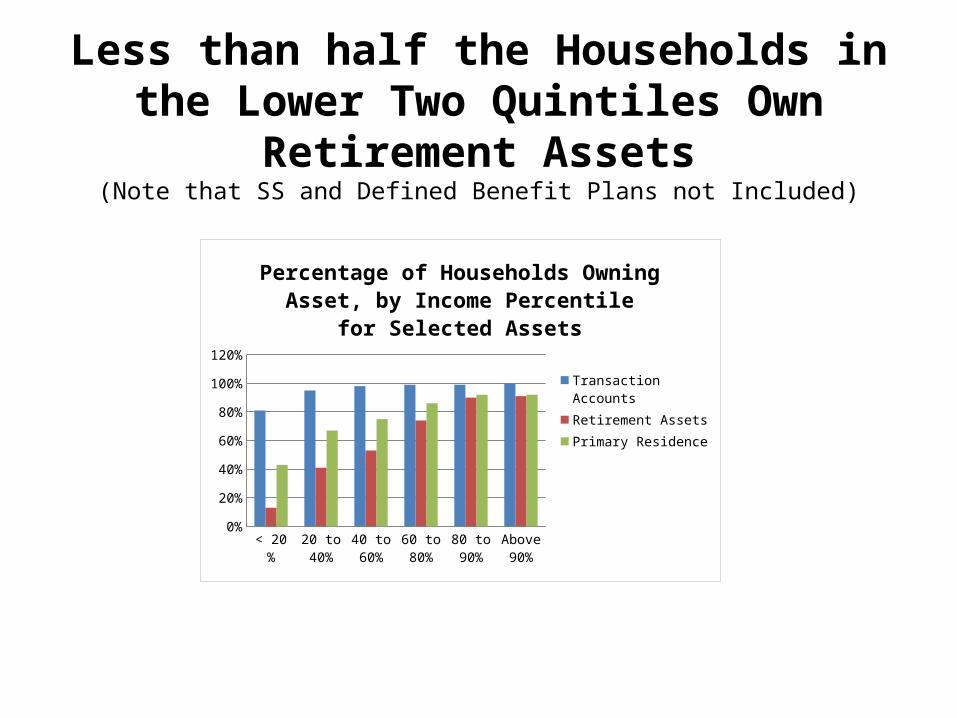
Less than half the Households in the Lower Two Quintiles Own Retirement Assets
(Note that SS and Defined Benefit Plans not Included)
< 20 % 20 to 40%
40 to 60%
60 to 80%
80 to 90%
Above 90%
0%
20%
40%
60%
80%
100%
120%
Percentage of Households Owning Asset, by Income Percentilefor Selected Assets
Transaction AccountsRetirement AssetsPrimary Residence
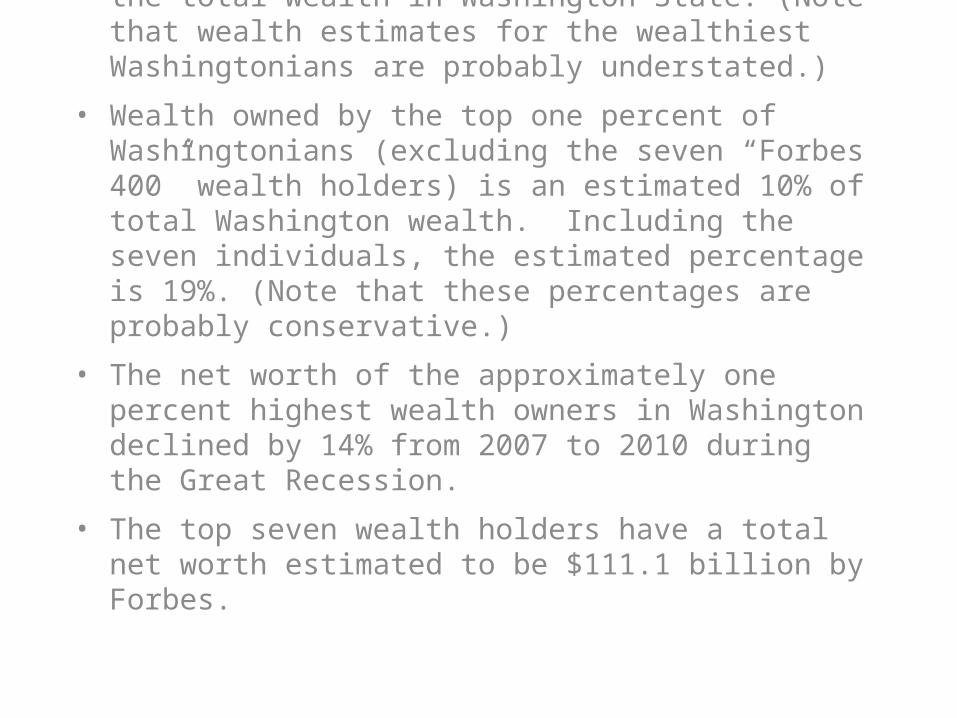
• The top 5% of wealth holders own over half the total wealth in Washington State. (Note that wealth estimates for the wealthiest Washingtonians are probably understated.)
• Wealth owned by the top one percent of Washingtonians (excluding the seven “Forbes 400” wealth holders) is an estimated 10% of total Washington wealth. Including the seven individuals, the estimated percentage is 19%. (Note that these percentages are probably conservative.)
• The net worth of the approximately one percent highest wealth owners in Washington declined by 14% from 2007 to 2010 during the Great Recession.
• The top seven wealth holders have a total net worth estimated to be $111.1 billion by Forbes.

WEALTH DISTRIBUTION METHODOLOGY
• Wealth Distribution—”Hot-Decked” Survey of Consumer Finance Data with Washington State American Community Survey data using several criteria for matching.
• Wealth Distribution for the top 1% (with gross assets over $2 million)--Used Washington Estate Tax microdata as a sample. Used mortality tables by age and sex to determine the sample weights of each decedent.

Part 4: Washington State and Local Tax Burden
by Income Decile

Taxes as Percentage of Personal Income is Over 4.5 Times as Large for the Lowest Income Decile Compared to the Highest Decile. For
the 2nd to Lowest Decile it is Almost 2.5 Times as Large
0 0.05 0.1 0.15 0.2 0.25
Lowest Decile
3rd Decile
5th Decile
7th Decile
9th Decile
2009 Washington State and Local Tax as a Percent of Income, by Decile
TAX BURDEN BY INCOME DECILE METHODOLOGY
• “Hot-Decked” Consumer Expenditure Survey data with American Community Survey for Washington State and Combined with WA tax Rates and Base.
Part 5: Washington State and local
Taxes over Time

State and Local Taxes as a Percent of Personal Income Have Generally Been Declining Since 1995
1960 1965 1970 1975 1980 1985 1990 1995 2000 2005 201080.00
85.00
90.00
95.00
100.00
105.00
110.00
115.00
120.00
Graph 5.2- Total Taxes Per $1,000 Income
Fiscal Year
Taxe
s per
$10
00 In
com
e

State Taxes as a Percent of Personal Income Have Been Declining, Local Taxes Have Been Increasing
1960 1965 1970 1975 1980 1985 1990 1995 2000 2005 201055
60
65
70
75
80
85
State Taxes Per $1,000 of Personal Income
Fiscal Year
Sta
te T
axes
(p
er $
1000
)
1960 1965 1970 1975 1980 1985 1990 1995 2000 2005 201020.00
25.00
30.00
35.00
40.00
45.00
Local Taxes Per $1,000of Personal Income
Fiscal Year
Lo
cal
Tax
es (
per
$10
00)
HISTORY OF TAX BURDEN METHODOLOGY
• Most of the analysis is done by the US Census Bureau.