the distribution of teachers in north carolina, 2009...
TRANSCRIPT
The Distribution of Teachers in North
Carolina, 2009-2013
Research Brief
Authors:
Douglas Lee Lauen
Education Policy Initiative at Carolina, The University of North
Carolina at Chapel Hill
Gary T. Henry
Peabody College, Vanderbilt University
Contributors:
Kyle Shaffer and Kari Kozlowski
The University of North Carolina at Chapel Hill
August 2015
Consortium for Educational Research and Evaluation–North Carolina
Distribution of Teachers in NC: Final Report
August 2015
Consortium for Educational Research and Evaluation–North Carolina
Table of Contents
Executive Summary ........................................................................................................................ 2
Introduction ..................................................................................................................................... 4
Data Used .................................................................................................................................... 4
Research Questions ..................................................................................................................... 4
Findings........................................................................................................................................... 5
Do Teacher Value-Added Ratings Vary by On-the-Job Experience, Grade Level, or Subject
Taught? ....................................................................................................................................... 5
Do Students Assigned to Teachers with High Past Value-Added Scores Show Higher Test
Score Growth? ............................................................................................................................ 7
Do Low Value-Added Teachers Tend to Teach in High-Poverty Classrooms and Schools and
Low-Achieving Classrooms and schools? If so, has this Tendency Weakened over Time? ...... 9
Are Differences in Teacher Value-Added across Districts Relatively Stable, or can we Detect
Change over Time? ................................................................................................................... 11
Are there Differences across Districts in the Equity of the Distribution of Teachers across
Schools within Districts? .......................................................................................................... 14
Conclusion .................................................................................................................................... 16
Distribution of Teachers in NC: Final Report
August 2015
Consortium for Educational Research and Evaluation–North Carolina 2
THE DISTRIBUTION OF TEACHERS IN NORTH CAROLINA, 2009-2013:
RESEARCH BRIEF
Executive Summary
Research shows that teachers influence student learning more than any other school-based
resource. This research brief addresses the question of whether this important resource is
equitably distributed across districts (local education agencies), schools, and classrooms in North
Carolina. The concern is that students in high-poverty and low-achieving schools and classrooms
may not be getting the most effective teachers. North Carolina’s Race to the Top (RttT) plan
included several specific interventions that were designed to improve the effectiveness of
teachers and reduce inequities in students’ access to high value-added teachers. This report
provides a follow-up to the baseline report of teacher distribution1 and assesses changes in the
distribution of high value-added teachers that may have resulted from implementation of the
state’s RttT plan. The findings of this report could help inform policy initiatives—such as
relocation bonuses and strategic staffing practices—that attempt to address inequities in access to
high value-added teachers.
Do the percentages of teachers in each of the three teacher value-added ratings (Exceeded, Met,
Did Not Meet growth standards) vary by on-the-job experience, grade level, or subject taught?
Novice teachers have lower value-added ratings than more experienced teachers.
Value-added ratings vary by grade level and subject. Fewer reading and English teachers and
fewer 5th
grade teachers in reading and mathematics were identified as exceeding and not
meeting growth expectations than teachers in other grades and subjects.
Do students assigned to teachers with high past value-added scores show higher test score
growth?
Students assigned to high value-added teachers tend to show substantially more achievement
growth than do students assigned to low value-added teachers, but the size of the gain varies
by subject. The impact of teacher skill is weaker on reading and English than on mathematics
and science test results (End-of-Grade [EOG] mathematics, EOG science, Algebra I End-of-
Course [EOC], and Biology EOC).
Do low value-added teachers tend to teach in high-poverty classrooms and schools and low-
achieving classrooms and schools? If so, has this tendency weakened over time?
High-poverty schools and low-achieving schools tend to have lower mean teacher value-
added scores, on average.
We also find some evidence of inequity in the distribution of teachers between classrooms
within schools, but this phenomenon is substantially weaker than the differences between
schools.
1 http://cerenc.org/wp-content/uploads/2013/12/Baseline-TQ-Report_FINAL_12-05-2013.pdf
Distribution of Teachers in NC: Final Report
August 2015
Consortium for Educational Research and Evaluation–North Carolina 3
There is suggestive evidence that inequitable access to high value-added teachers declined by
2013.
Are differences in teacher value-added across districts relatively stable, or can we detect
change over time?
Between 2009 and 2012, districts became more similar in their average teacher value-added
scores. In 2013, however, variation between districts widened.
Are there differences across districts in the equity of the distribution of teachers across schools
within districts?
There was a slight increase in the variation in mean teacher value-added scores between
schools within districts. Two large districts, however, reduced the differences across schools
in teacher value-added.

Distribution of Teachers in NC: Final Report
August 2015
Consortium for Educational Research and Evaluation–North Carolina 4
Introduction
Research shows that teachers influence student learning more than any other school-based
resource. This research brief addresses the question of whether this important resource is
equitably distributed across districts (local education agencies), schools, and classrooms in North
Carolina. The concern is that students in high-poverty and low-achieving schools and classrooms
may not be getting the most effective teachers. North Carolina’s Race to the Top (RttT) plan
included several specific interventions that were designed to improve the effectiveness of
teachers and reduce inequities in students’ access to high value-added teachers. This report
provides a follow-up to the baseline report of teacher distribution2 and assesses changes in the
distribution of high value-added teachers that may have resulted from implementation of the
state’s RttT plan. The findings of this report could help inform policy initiatives—such as
relocation bonuses and strategic staffing practices—that attempt to address inequities in access to
high value-added teachers.
Data Used
For this report, the Evaluation Team analyzed the value-added EVAAS index scores of North
Carolina teachers who teach a class with an End-of-Grade (EOG; reading, mathematics, and
science in grades 5 through 8) or End-of-Course (EOC; Algebra I, Biology, English) test in the
2008-09 through 2012-13 school years. The report uses the EVAAS index scores calculated by
the SAS Institute as the sole measure for an individual teacher’s “value added,” which is defined
as a teacher’s contribution to gains in student achievement. In some of the analyses below, we
use a measure that separates a teacher’s performance into three categories: Exceeds the growth
standard (greater than or equal to two standard errors above the mean), Meets the growth
standard (between two standard errors below and two standard errors above the mean), and Did
Not Meet the growth standard (less than or equal to two standard errors below the mean). About
1,000 to 4,000 teachers per year were available for analysis, depending on the tested subject or
grade.
Research Questions
1. Do the percentages of teachers in each of the three teacher value-added ratings (Exceeded, Met,
Did Not Meet growth standards) vary by on-the-job experience, grade level, or subject taught?
2. Do students assigned to teachers with high past value-added scores show higher test score
growth?
3. Do low value-added teachers tend to teach in high-poverty classrooms and schools and low-
achieving classrooms and schools? If so, has this tendency weakened over time?
4. Are differences in teacher value-added across districts relatively stable, or can we detect
change over time?
5. Are there differences across districts in the equity of the distribution of teachers across schools
within districts?
2 http://cerenc.org/wp-content/uploads/2013/12/Baseline-TQ-Report_FINAL_12-05-2013.pdf

Distribution of Teachers in NC: Final Report
August 2015
Consortium for Educational Research and Evaluation–North Carolina 5
Findings
Do Teacher Value-Added Ratings Vary by On-the-Job Experience, Grade Level, or Subject
Taught?
From 2009 to 2013 and across teachers in all grade levels combined, about 15% of teachers did
not meet growth expectations and about 15% of teachers exceeded these expectations. We find
very little evidence that these percentages varied much across time. However, the percentage of
teachers not meeting or exceeding growth expectations varies by on-the-job experience, grade
level, and subject taught.
Not surprisingly, there are many more teachers with no experience in the Not Meeting growth
standards category than there are teachers with no experience in the Exceeding standards
category. In 2013, compared to the overall averages of about 14% in each category, the
percentages of novice teachers in the Not Meeting and Exceeding categories were 22% and 7%,
respectively. The corresponding figures for teachers with one year of experience are 16% and
12%. Above two years of experience, there are more teachers in the Exceeding growth standards
category than in the Not Meeting category.
Relative to mathematics and science, very few teachers fell into either the Not Meeting or
Exceeding category in reading and English (Figure 1). For example, across all years only about
3% of 5th
grade reading teachers fell into the Not Meeting category and only about 3% of 5th
grade reading teachers fell into the Exceeding category. About 6-9% of middle school reading
teachers and 11% of English EOC teachers fell into each of these categories.
Figure 1: Proportion of Teachers who Met, Did Not Meet, or Exceeded Expectations: Reading
and English
0.11 0.04
0.09 0.07 0.06
0.76
0.93 0.82
0.86 0.86
0.12 0.03
0.09 0.07 0.07
0.0
00
.25
0.5
00
.75
1.0
0
English 5th Grade
Reading
6th Grade
Reading
7th Grade
Reading
8th Grade
Reading
Teacher Performance Comparison - Reading
% Not Meeting % Meeting % Exceeding
Distribution of Teachers in NC: Final Report
August 2015
Consortium for Educational Research and Evaluation–North Carolina 6
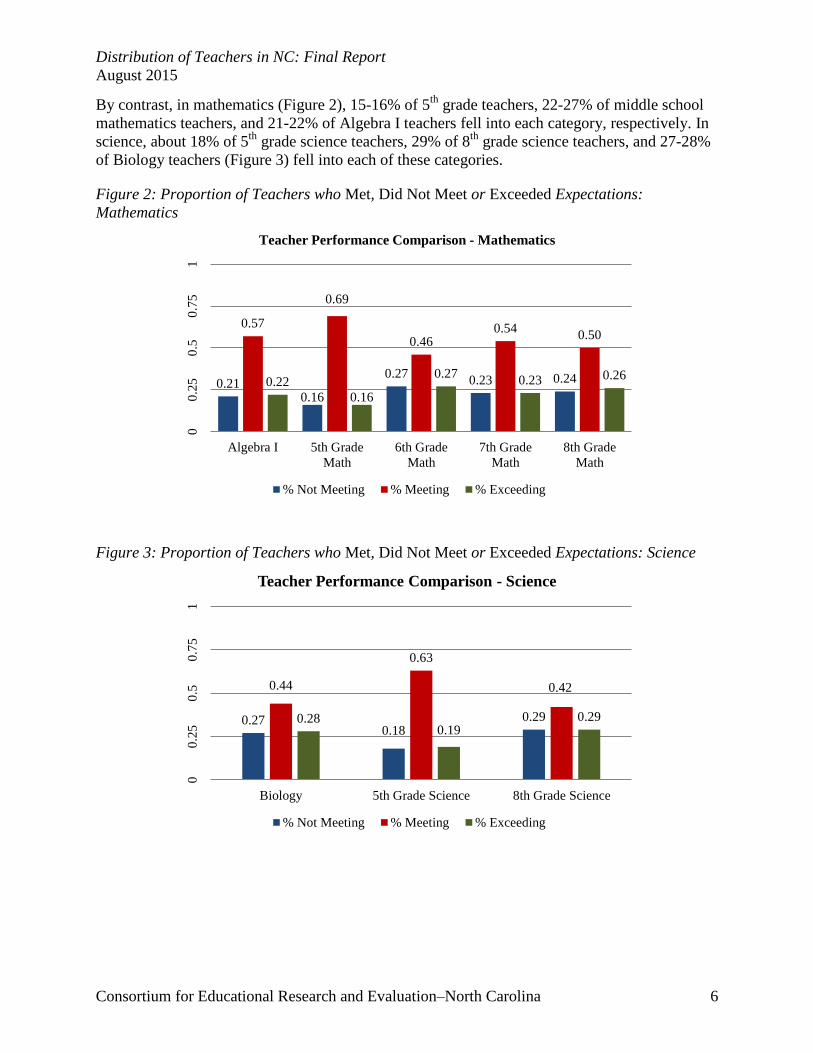
By contrast, in mathematics (Figure 2), 15-16% of 5th
grade teachers, 22-27% of middle school
mathematics teachers, and 21-22% of Algebra I teachers fell into each category, respectively. In
science, about 18% of 5th
grade science teachers, 29% of 8th
grade science teachers, and 27-28%
of Biology teachers (Figure 3) fell into each of these categories.
Figure 2: Proportion of Teachers who Met, Did Not Meet or Exceeded Expectations:
Mathematics
Figure 3: Proportion of Teachers who Met, Did Not Meet or Exceeded Expectations: Science
0.21 0.16
0.27 0.23 0.24
0.57
0.69
0.46 0.54
0.50
0.22
0.16
0.27 0.23 0.26
00
.25
0.5
0.7
51
Algebra I 5th Grade
Math
6th Grade
Math
7th Grade
Math
8th Grade
Math
Teacher Performance Comparison - Mathematics
% Not Meeting % Meeting % Exceeding
0.27 0.18
0.29
0.44
0.63
0.42
0.28 0.19
0.29
00
.25
0.5
0.7
51
Biology 5th Grade Science 8th Grade Science
Teacher Performance Comparison - Science
% Not Meeting % Meeting % Exceeding

Distribution of Teachers in NC: Final Report
August 2015
Consortium for Educational Research and Evaluation–North Carolina 7
Do Students Assigned to Teachers with High Past Value-Added Scores Show Higher Test
Score Growth?
This report is premised on the assumption that teachers with high prior-year value-added scores
should be more likely to raise student test scores than teachers with low prior-year value-added
scores. To answer this question, we match students to teachers and measure the effect of
teachers’ prior-year value-added rating on students’ current year test score growth. For example,
we ask whether a teacher’s 2009 value-added rating affects her or his students’ 2010 test score.
Formulating the question in this manner ensures that the predictor (teacher value-added rating)
precedes the outcome (student test score) in time, which is an important condition for making a
valid inference about the effect of a predictor on an outcome.3
We find strong evidence that teacher value-added score has a meaningful effect on student test
score gain, although the strength of the association between teacher value-added score and
student achievement varies somewhat by subject. The gap in test scores for students whose
teachers’ prior year value-added score fell into the Exceed category and students whose teachers’
prior year value-added score fell into the Not Meet category ranged from a low of .42 standard
deviations (Reading EOG) to a high of .60 standard deviations (Science EOG). If students were
randomly assigned to teachers, we might consider these bivariate associations to be valid
estimates of the causal effects of teacher skill on student test score. But, there are reasons to
think this is not the case. Students are sometimes assigned to classrooms based on their prior
achievement and other background factors and end up in particular schools based on residential
patterns and family income.4 In the results below, we make statistical adjustments for differences
that could confound the effects of teachers on student achievement.5
3 A consequence of our approach is that teachers without a prior-year value-added score cannot be matched to
students and thus are dropped from the analysis. We suspect that less-effective teachers were reassigned to non-
tested grades and subjects or left the teaching force because we are more likely to match students to teachers with
high value-added scores. We plan to explore this phenomenon in future studies. 4 One way to investigate whether teachers are randomly assigned to students is to test whether the association
between teacher value-added score and student test score changes once we make statistical adjustments for baseline
covariates. If students are not assigned to teachers based on prior-year test scores, then once we adjust for students’
baseline test score, the gap should be unaffected. In fact, the gap shrinks once we include students’ baseline test
score. The fact that the association of teacher effectiveness shrinks rather than grows is suggestive evidence that
teachers with higher value-added are assigned to students with higher baseline scores. This might be because of the
mechanisms used to assign teachers and students to classrooms within districts and schools. 5 To correct for confounding beyond that captured by prior test scores, we also estimated models with a rich set of
baseline covariates including gender, race/ethnicity, absences, free/reduced lunch, LEP status, disability, academic
giftedness, age, school mobility, classroom poverty, advanced/remedial course type, peer average prior test score,
variation in peer average test score, school poverty, school average achievement, grade, year, and grade-by-year
interactions. From these models, we computed predicted means by grade level and teacher effectiveness category
(holding all other variables at their means).

Distribution of Teachers in NC: Final Report
August 2015
Consortium for Educational Research and Evaluation–North Carolina 8
To measure the impact of teacher value-added scores on student test score gains, we compute the
adjusted mean difference in scores between students assigned to a teacher who received a rating
of Exceeds the growth standard (greater than or equal to two standard errors above the mean) and
students assigned to a teacher who received a rating of Did Not Meet the growth standard (less
than or equal to two standard errors below the mean). Again, we find that the impact varies by
subject taught. The impact of teacher value-added score is stronger in mathematics and science
than in reading. For example, the adjusted test score gap between students assigned to the most
effective science teachers and students assigned to the least effective science teachers is .42
standard deviations. By contrast, the adjusted test score gap in reading is much smaller, at only
.14 standard deviations (Figure 4).
Figure 4: Differences in Adjusted Average Test Score Gains for Students Assigned to Teachers
who Exceeded Growth Expectations and Students Assigned to Teachers who Did Not Meet
Growth Expectations
The reasons for these differences require further investigation. Some possibilities include the
potential for test score growth across various subjects for students of various ages, using the prior
year’s reading score as a control variable in science analyses (the science test is not an annual
assessment), and/or differences across subjects in how students are assigned to teachers
(tracking/ability grouping) and how teachers are assigned to courses (the mix of remedial,
regular, and advanced courses a teacher is assigned to teach).
We examined the data for differences across student subgroups in the effects of teacher value-
added on students of different backgrounds (by gender, race/ethnicity, and poverty level). We
found very few substantively significant and consistent differences.
0.16 0.19
0.23 0.24
0.08 0.09
-0.12
-0.15
-0.19 -0.16
-0.06 -0.07
-0.30
-0.20
-0.10
0.00
0.10
0.20
0.30
Mathematics Algebra I Science Biology Reading English I
Pre
dic
ted
Mea
ns
an
d D
fife
ren
ces
Avg. Gain for Teachers who did not Meet Growth
Avg. Gain for Teachers who Exceeded Growth
0.2
9
0.3
4
0.4
2
0.4
0
0.1
4
0.1
6

Distribution of Teachers in NC: Final Report
August 2015
Consortium for Educational Research and Evaluation–North Carolina 9
Do Low Value-Added Teachers Tend to Teach in High-Poverty Classrooms and Schools and
Low-Achieving Classrooms and schools? If so, has this Tendency Weakened over Time?
As was reported in our baseline report, we find that low value-added teachers tend to teach in
lower-achieving and higher-poverty schools. This is an important finding because it has
implications for strategic staffing policies to help close test score gaps by reassigning the most
effective teachers to the highest-poverty and lowest-achieving schools.
We investigate the question of whether teachers are equitably distributed by looking both across
and within schools.6 We find that the within-school correlation between teacher value-added
score and classroom poverty is below .05 across all subjects.7 Therefore, we find only weak
evidence that high value-added teachers are assigned to classrooms within schools based on the
poverty level of the classroom’s students. On the other hand, we find generally larger between-
school poverty correlations than within-school poverty correlations (Figure 5). In other words,
the association between teacher value-added score and school poverty is stronger than the
association between teacher value-added score and classroom poverty. This is suggestive
evidence that, within schools, teachers tend to be equitably distributed, while teachers tend to be
less equitably distributed across schools.
Figure 5: Correlations between Class (Within-School) Poverty and Teacher Value-Added and
School (Between-School) Poverty and Teacher Value-Added, by Subject
6 In technical terms, we use a technique called group-mean centering to cleanly decompose the within- and between-
school correlations between teacher value-added score and classroom and school compositional characteristics. This
technique results in a zero correlation between classroom and school variables. 7 The correlation coefficient is a measure of the strength of the linear relationship between two variables and ranges
from -1 to +1, with 0 representing no relationship.
-0.05
-0.03
-0.01
-0.03
-0.05
-0.02
-0.07
-0.13
-0.14
-0.10
-0.17
-0.04
-0.18 -0.16 -0.14 -0.12 -0.10 -0.08 -0.06 -0.04 -0.02 0.00
Math
Reading
Science
Algebra I
English
Biology
School Poverty Class Poverty
Distribution of Teachers in NC: Final Report
August 2015
Consortium for Educational Research and Evaluation–North Carolina 10
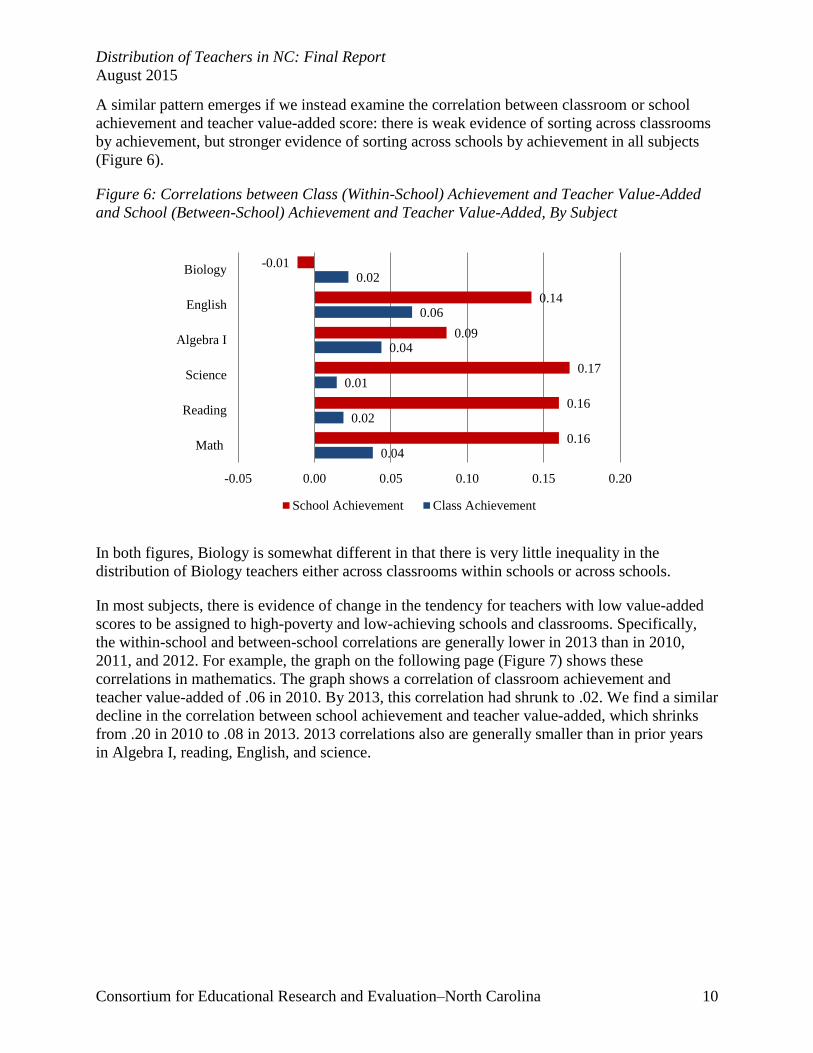
A similar pattern emerges if we instead examine the correlation between classroom or school
achievement and teacher value-added score: there is weak evidence of sorting across classrooms
by achievement, but stronger evidence of sorting across schools by achievement in all subjects
(Figure 6).
Figure 6: Correlations between Class (Within-School) Achievement and Teacher Value-Added
and School (Between-School) Achievement and Teacher Value-Added, By Subject
In both figures, Biology is somewhat different in that there is very little inequality in the
distribution of Biology teachers either across classrooms within schools or across schools.
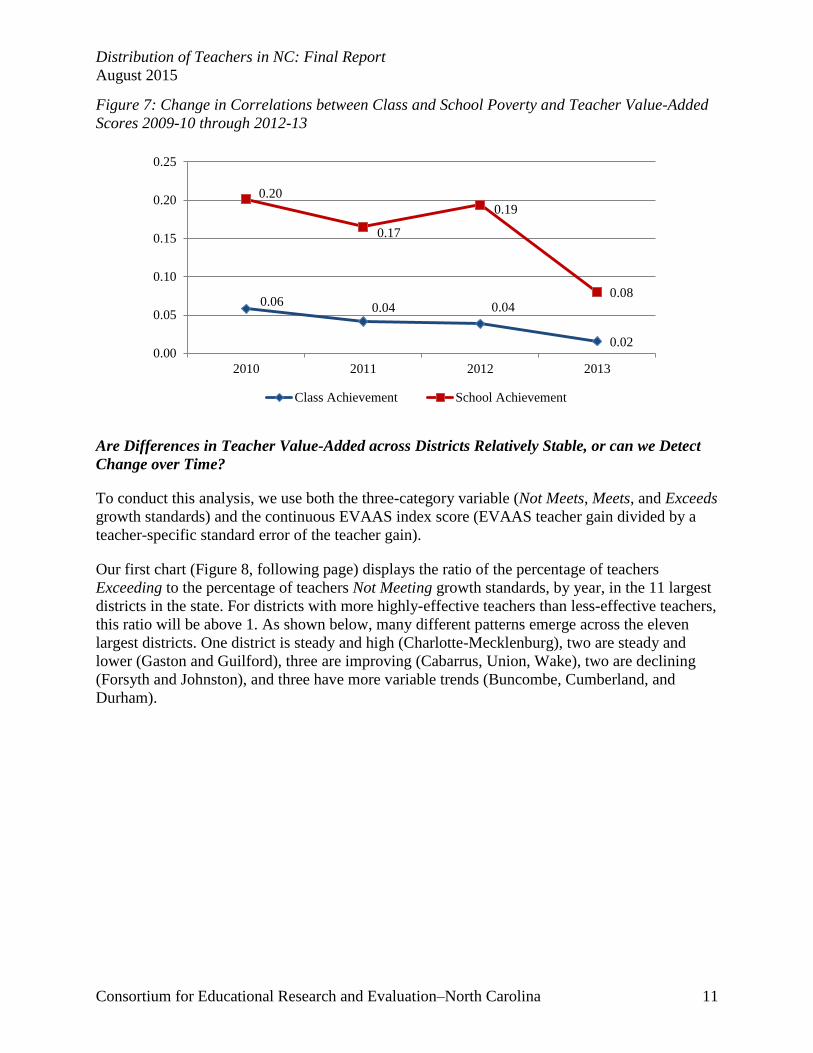
In most subjects, there is evidence of change in the tendency for teachers with low value-added
scores to be assigned to high-poverty and low-achieving schools and classrooms. Specifically,
the within-school and between-school correlations are generally lower in 2013 than in 2010,
2011, and 2012. For example, the graph on the following page (Figure 7) shows these
correlations in mathematics. The graph shows a correlation of classroom achievement and
teacher value-added of .06 in 2010. By 2013, this correlation had shrunk to .02. We find a similar
decline in the correlation between school achievement and teacher value-added, which shrinks
from .20 in 2010 to .08 in 2013. 2013 correlations also are generally smaller than in prior years
in Algebra I, reading, English, and science.
0.04
0.02
0.01
0.04
0.06
0.02
0.16
0.16
0.17
0.09
0.14
-0.01
-0.05 0.00 0.05 0.10 0.15 0.20
Math
Reading
Science
Algebra I
English
Biology
School Achievement Class Achievement
Distribution of Teachers in NC: Final Report
August 2015
Consortium for Educational Research and Evaluation–North Carolina 11
Figure 7: Change in Correlations between Class and School Poverty and Teacher Value-Added
Scores 2009-10 through 2012-13
Are Differences in Teacher Value-Added across Districts Relatively Stable, or can we Detect
Change over Time?
To conduct this analysis, we use both the three-category variable (Not Meets, Meets, and Exceeds
growth standards) and the continuous EVAAS index score (EVAAS teacher gain divided by a
teacher-specific standard error of the teacher gain).
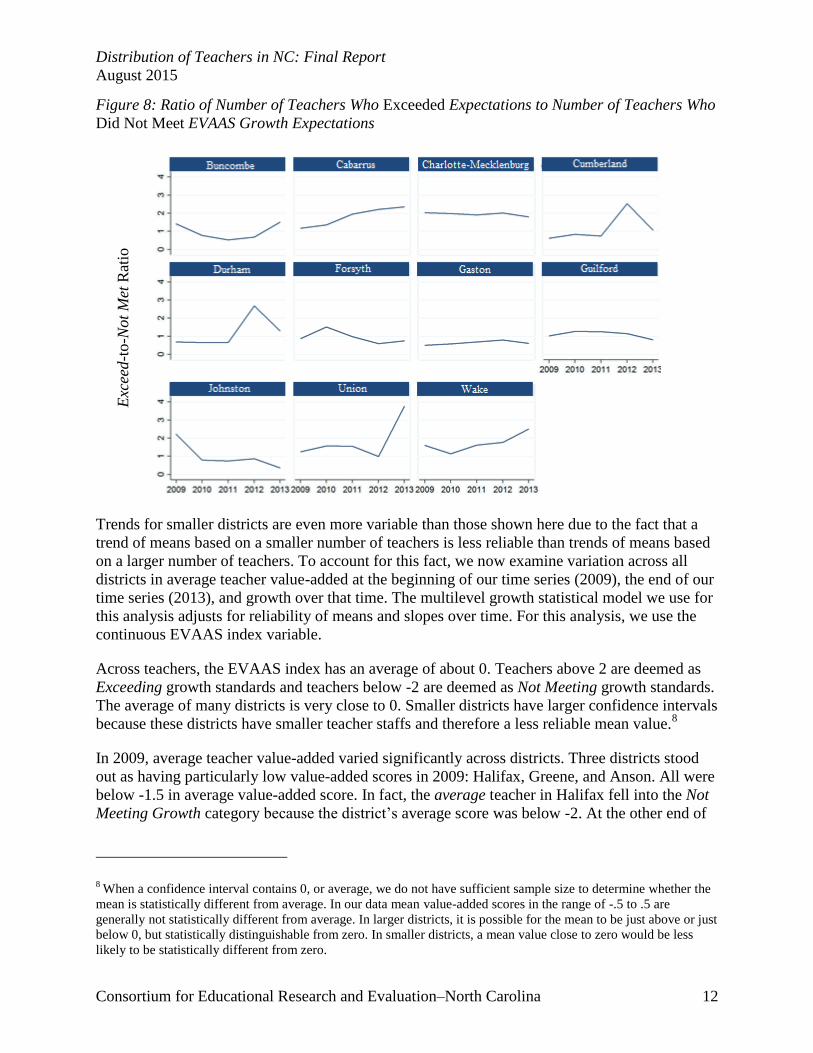
Our first chart (Figure 8, following page) displays the ratio of the percentage of teachers
Exceeding to the percentage of teachers Not Meeting growth standards, by year, in the 11 largest
districts in the state. For districts with more highly-effective teachers than less-effective teachers,
this ratio will be above 1. As shown below, many different patterns emerge across the eleven
largest districts. One district is steady and high (Charlotte-Mecklenburg), two are steady and
lower (Gaston and Guilford), three are improving (Cabarrus, Union, Wake), two are declining
(Forsyth and Johnston), and three have more variable trends (Buncombe, Cumberland, and
Durham).
0.06 0.04 0.04
0.02
0.20
0.17
0.19
0.08
0.00
0.05
0.10
0.15
0.20
0.25
2010 2011 2012 2013
Class Achievement School Achievement
Distribution of Teachers in NC: Final Report
August 2015
Consortium for Educational Research and Evaluation–North Carolina 12
Figure 8: Ratio of Number of Teachers Who Exceeded Expectations to Number of Teachers Who
Did Not Meet EVAAS Growth Expectations
Trends for smaller districts are even more variable than those shown here due to the fact that a
trend of means based on a smaller number of teachers is less reliable than trends of means based
on a larger number of teachers. To account for this fact, we now examine variation across all
districts in average teacher value-added at the beginning of our time series (2009), the end of our
time series (2013), and growth over that time. The multilevel growth statistical model we use for
this analysis adjusts for reliability of means and slopes over time. For this analysis, we use the
continuous EVAAS index variable.
Across teachers, the EVAAS index has an average of about 0. Teachers above 2 are deemed as
Exceeding growth standards and teachers below -2 are deemed as Not Meeting growth standards.
The average of many districts is very close to 0. Smaller districts have larger confidence intervals
because these districts have smaller teacher staffs and therefore a less reliable mean value.8
In 2009, average teacher value-added varied significantly across districts. Three districts stood
out as having particularly low value-added scores in 2009: Halifax, Greene, and Anson. All were
below -1.5 in average value-added score. In fact, the average teacher in Halifax fell into the Not
Meeting Growth category because the district’s average score was below -2. At the other end of
8 When a confidence interval contains 0, or average, we do not have sufficient sample size to determine whether the
mean is statistically different from average. In our data mean value-added scores in the range of -.5 to .5 are
generally not statistically different from average. In larger districts, it is possible for the mean to be just above or just
below 0, but statistically distinguishable from zero. In smaller districts, a mean value close to zero would be less
likely to be statistically different from zero.
Exc
eed
-to-N
ot
Met
Rat
io
Distribution of Teachers in NC: Final Report
August 2015
Consortium for Educational Research and Evaluation–North Carolina 13
the spectrum, three districts had particularly high value-added scores in 2009: Davie, Yancey,
and Ashe, all above 1.25.
We find that between-district variation has declined since 2009. The range of estimates declines,
with fewer outliers at the bottom of the distribution.9 None of the three districts with the lowest
averages remained particularly low in 2013 and none of the three districts with the highest
averages remained particularly high in 2013. There is some relationship between 2009 rank and
2013 rank, but it is not particularly strong—the correlation is only .28.
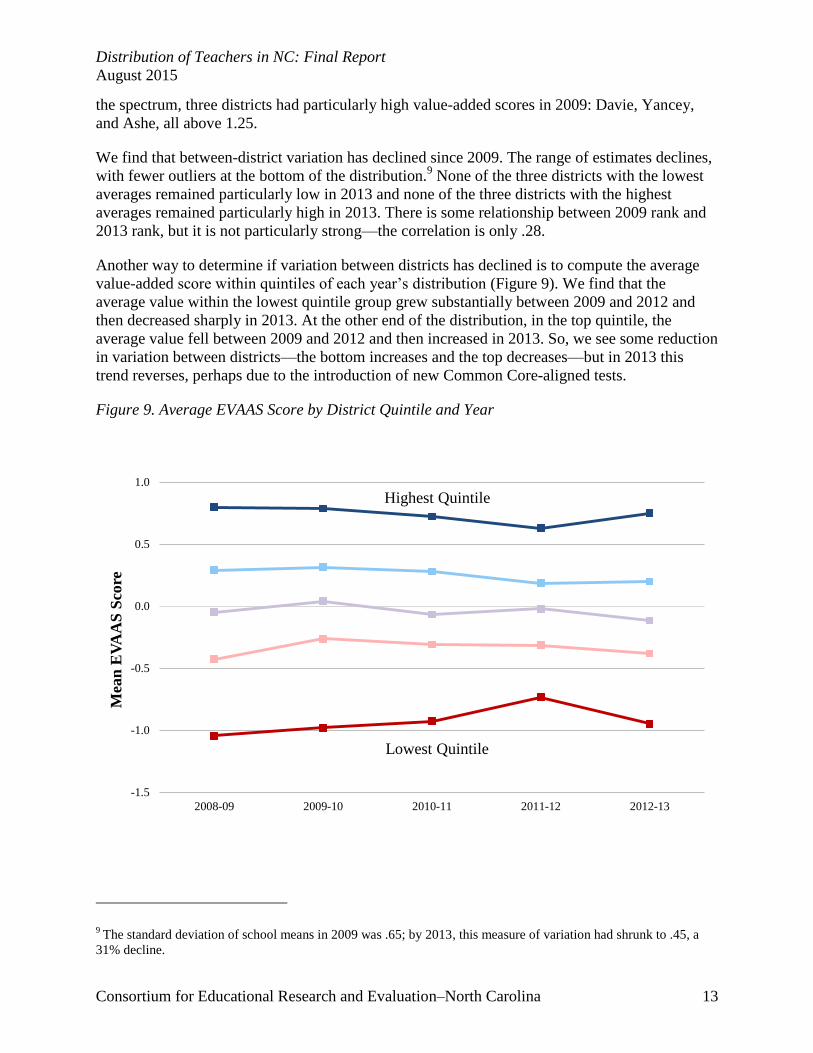
Another way to determine if variation between districts has declined is to compute the average
value-added score within quintiles of each year’s distribution (Figure 9). We find that the
average value within the lowest quintile group grew substantially between 2009 and 2012 and
then decreased sharply in 2013. At the other end of the distribution, in the top quintile, the
average value fell between 2009 and 2012 and then increased in 2013. So, we see some reduction
in variation between districts—the bottom increases and the top decreases—but in 2013 this
trend reverses, perhaps due to the introduction of new Common Core-aligned tests.
Figure 9. Average EVAAS Score by District Quintile and Year
9 The standard deviation of school means in 2009 was .65; by 2013, this measure of variation had shrunk to .45, a
31% decline.
Lowest Quintile
Highest Quintile
-1.5
-1.0
-0.5
0.0
0.5
1.0
2008-09 2009-10 2010-11 2011-12 2012-13
Mea
n E
VA
AS
Sco
re
Distribution of Teachers in NC: Final Report
August 2015
Consortium for Educational Research and Evaluation–North Carolina 14
A summary statistic for 2009-to-2013 growth is the linear slope.10
Less than 30 districts have
negative and significant slopes and less than 30 have positive and significant slopes, leaving
about 60 with slopes not significantly different from zero. Districts with particularly large
declines in average teacher value-added score were Avery, Yancey, Davie, Newton-Conover,
Bertie, and Alexander, all with slopes below -.25. The district with the largest annual increase
was Halifax, with a slope of .6 (between 2009 and 2013, Halifax’s average teacher value-added
score grew from -2.25 to +.34). Other districts with particularly large annual growth rates were
Greene, Washington, Anson, and Harnett, all with rates above .25.
Recall that Halifax, Greene, and Anson were districts with the lowest average values in 2009 and
Davie and Yancey had particularly high average values in 2009. This illustrates the general
pattern found in all statistical trend analyses: initial status is negatively correlated with growth.
In our data, this correlation is particularly strong at -.79. This number means that districts that
began low tend to end up higher and vice-versa.
Are there Differences across Districts in the Equity of the Distribution of Teachers across
Schools within Districts?
The purpose of this section is to determine whether some districts had particularly large changes
in the distribution of teacher effectiveness between schools within their districts. This is an
important question because districts with decreasing between-school variation could be
distributing their teachers more equitably across the schools within each district.
For this analysis, we calculate means of the continuous teacher value-added scores for each
school in each district over time. We then calculate the variation in these school means across all
the schools in the district in each year and standardize this measure to a mean of 0 and a standard
deviation of 1. This measure ranges from about -2 to 2. A district with low between-school
variation has a relatively even distribution of teacher effectiveness, while a district with high
between-school variation has a relatively uneven distribution of teacher effectiveness. We then
also examine trends in this statistic over time within districts to determine whether between-
school variation has increased or decreased.
For example, Charlotte-Mecklenburg, a large district, started with above-average between-school
variation in teacher effectiveness, but this variation has been falling over time to about average.
The statistical trend is -.22, which means that this measure fell by about a quarter of a standard
deviation in each year (from about 1.09 to -.05 over five years). Due to variation around this
trend over time, the trend is not statistically significant at p<.05, but it is significant at p<.10.
Another large district with a significant trend was Guilford, -.12 (p<.10). No other district in the
top decile of enrollment had a statistically significant positive or negative trend.
Overall, across all districts there is a slight increase in between-school variation in average
value-added score. The statistical trend is .066 and is significant at p<.05. This means that the
variation in school average teacher value-added score is increasing by about one-twentieth of a
10 Districts with positive slopes have positive growth rates. Those with negative slopes have negative growth rates.
For example, a district with a slope of 0 has no growth over the period; one with a slope of .25 grows at a rate of .25
index points per year between 2009 and 2013.
Distribution of Teachers in NC: Final Report
August 2015
Consortium for Educational Research and Evaluation–North Carolina 15
standard deviation per year, or by about one quarter of a standard deviation over the five-year
time-span.
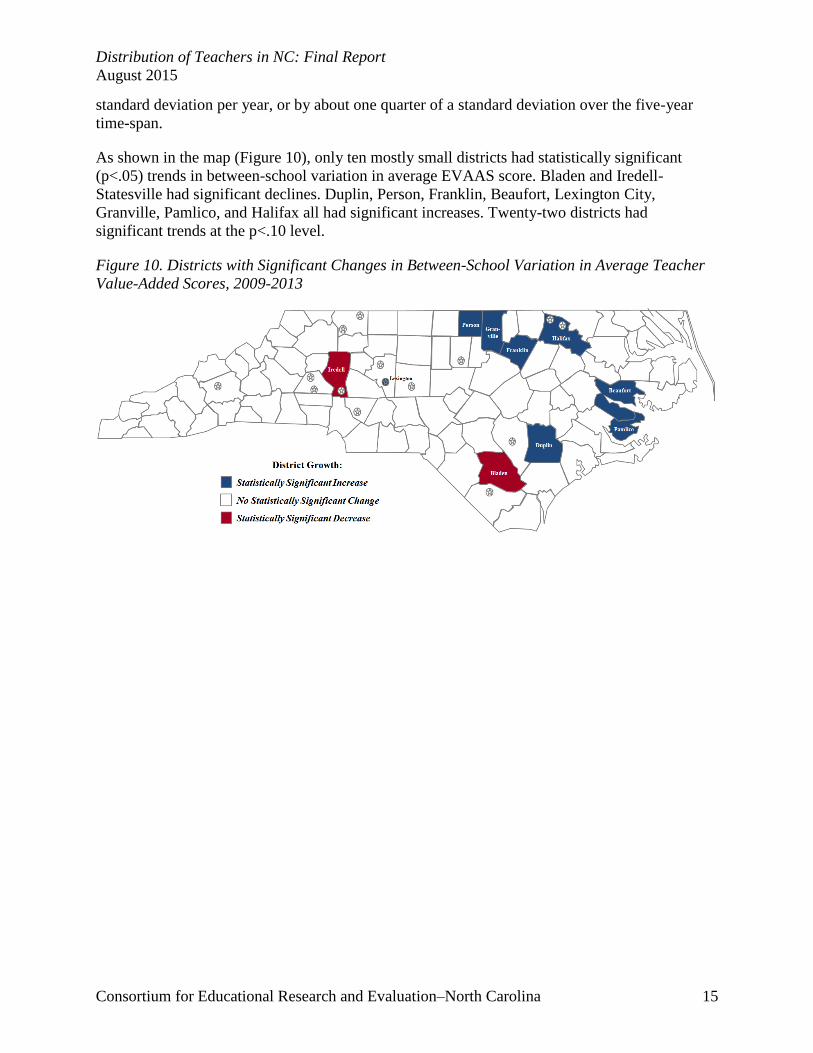
As shown in the map (Figure 10), only ten mostly small districts had statistically significant
(p<.05) trends in between-school variation in average EVAAS score. Bladen and Iredell-
Statesville had significant declines. Duplin, Person, Franklin, Beaufort, Lexington City,
Granville, Pamlico, and Halifax all had significant increases. Twenty-two districts had
significant trends at the p<.10 level.
Figure 10. Districts with Significant Changes in Between-School Variation in Average Teacher
Value-Added Scores, 2009-2013
Distribution of Teachers in NC: Final Report
August 2015
Consortium for Educational Research and Evaluation–North Carolina 16
Conclusion
Based on analyses of teacher value-added scores, the results in this research brief suggest that,
prior to RttT, students in low-achieving and high-poverty schools tended to have teachers with
lower value-added scores. In addition, we found substantial differences across districts in mean
value-added scores. In short, there is ample evidence of inequitable distribution of teachers
between schools prior to RttT. During the years of RttT implementation, it appears that inequities
in the distribution of teacher across schools with varying poverty and achievement rates had
eased somewhat by 2013. Moreover, between-district variation in mean teacher value-added
decreased between 2009 and 2012. However, between-district variation in mean teacher value-
added increased between 2012 and 2013, and between-school variation in average teacher value-
added increased between 2009 and 2013. Therefore, these research findings provide somewhat
mixed evidence on changes in the distribution of teacher effectiveness, as measured by value-
added, across the state.
In closing, teacher value-added is a relatively new measure of teacher productivity. While we
believe it is a valid measure of a teacher’s demonstrated ability to raise student test scores, it is
not a perfect measure. Boosting test scores is not the only important teacher thing a teacher does.
Teacher skill is likely to be related to the mix of students a teacher receives each year. Teachers
may be more effective with some types of students than with others. School contexts may
facilitate teacher productivity in ways that are difficult to capture in teacher value-added scores.
For these reasons and others, future equity analyses of teacher distribution should incorporate
multiple measures of teacher effectiveness whenever possible.
Contact Information:
Please direct all inquiries to Douglas Lee Lauen
© 2015 Consortium for Educational Research and Evaluation–North Carolina